Schematic overview of the cellular and molecular mechanisms involved in the cancer progression, including the proposed cellular and molecular mechanisms in cancer cells trajectory. AT1: alveolar type 1 cells; AT2: alveolar type 2 cells; AAH: atypical adenomatous hyperplasia; AIS: adenocarcinoma in situ; MIA: minimally invasive adenocarcinoma; IA: invasive adenocarcinoma; EMT: epithelial-mesenchymal transition

Home

Download

Statistics

Help

Contact

Center for Computational Systems Medicine
leaf

Tissue samples summary

leaf

Annotation details for different cell compartments

leaf

Cell type statistics by disease state

leaf

Cell type dynamics in malignant transformation

leaf

Cell lineage trajectory inference

leaf

TF regulatory network analysis

leaf

Cell-cell interaction analysis

leaf

Stemness, Senescence, Metaplasia and NeoTCR signature analysis

Tissue: Stomach

Tissue samples summary

check button Cell type statistics by tissue samples.
EpitheliaImmuneStromal
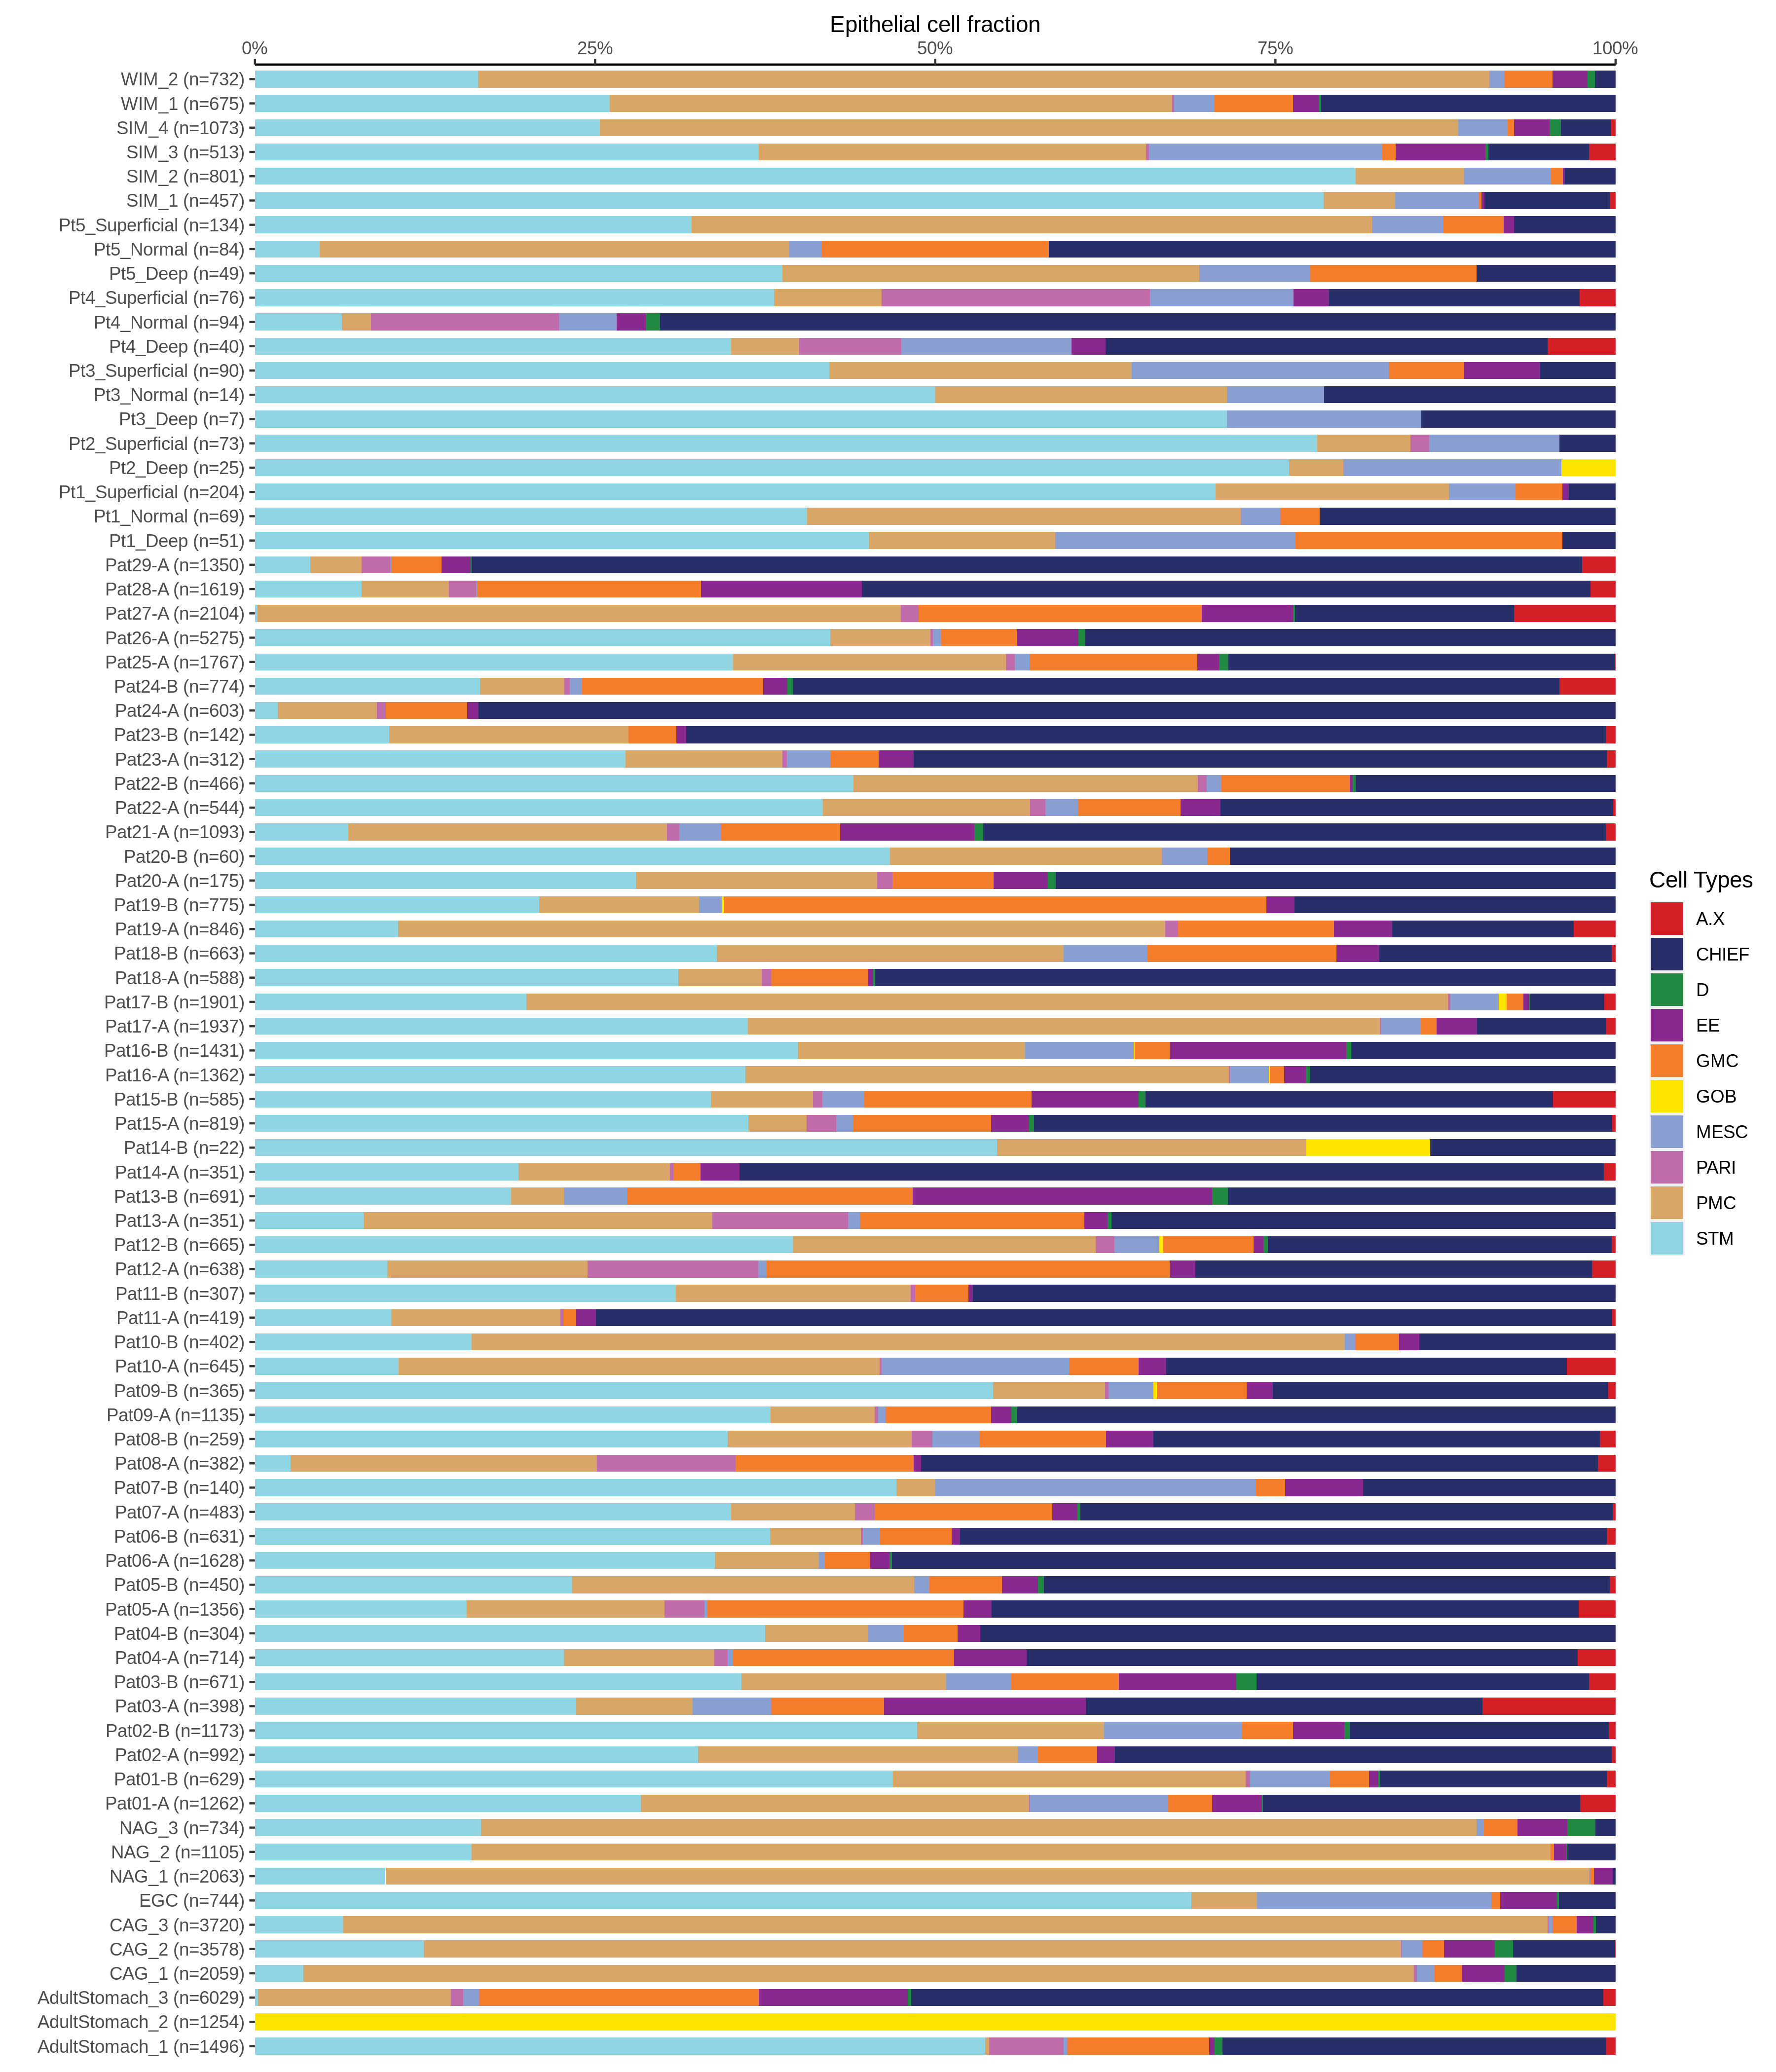
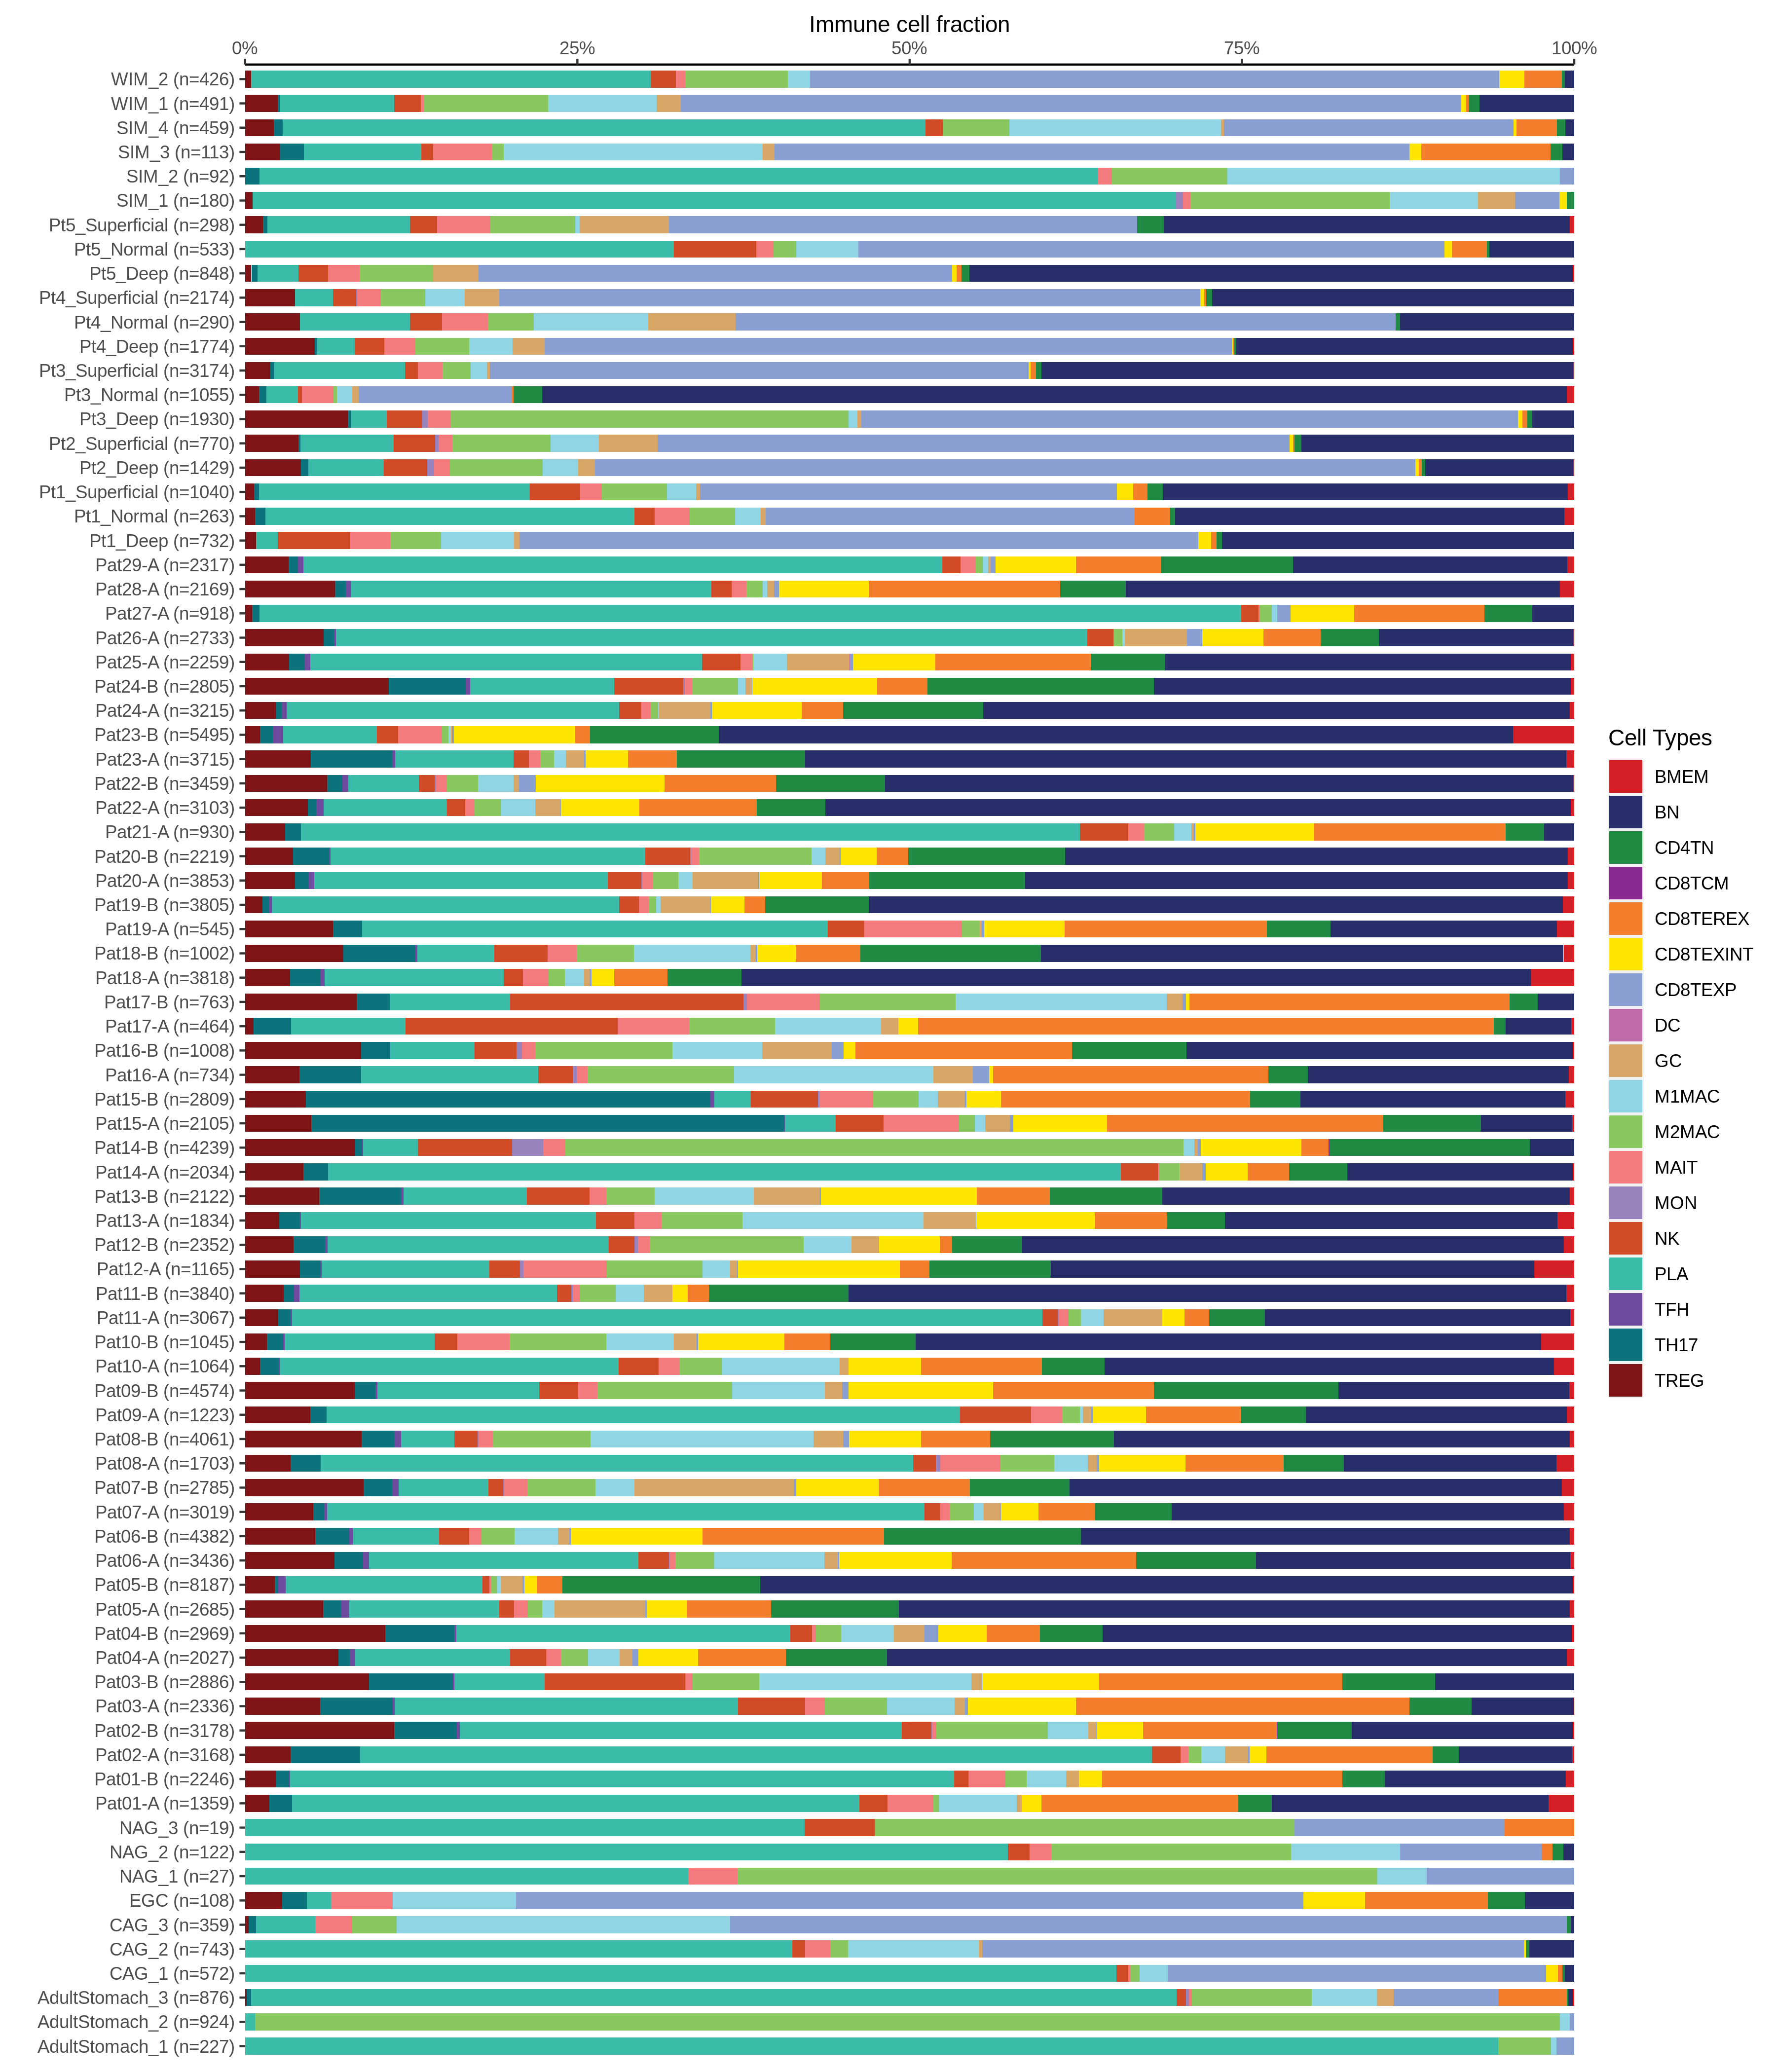
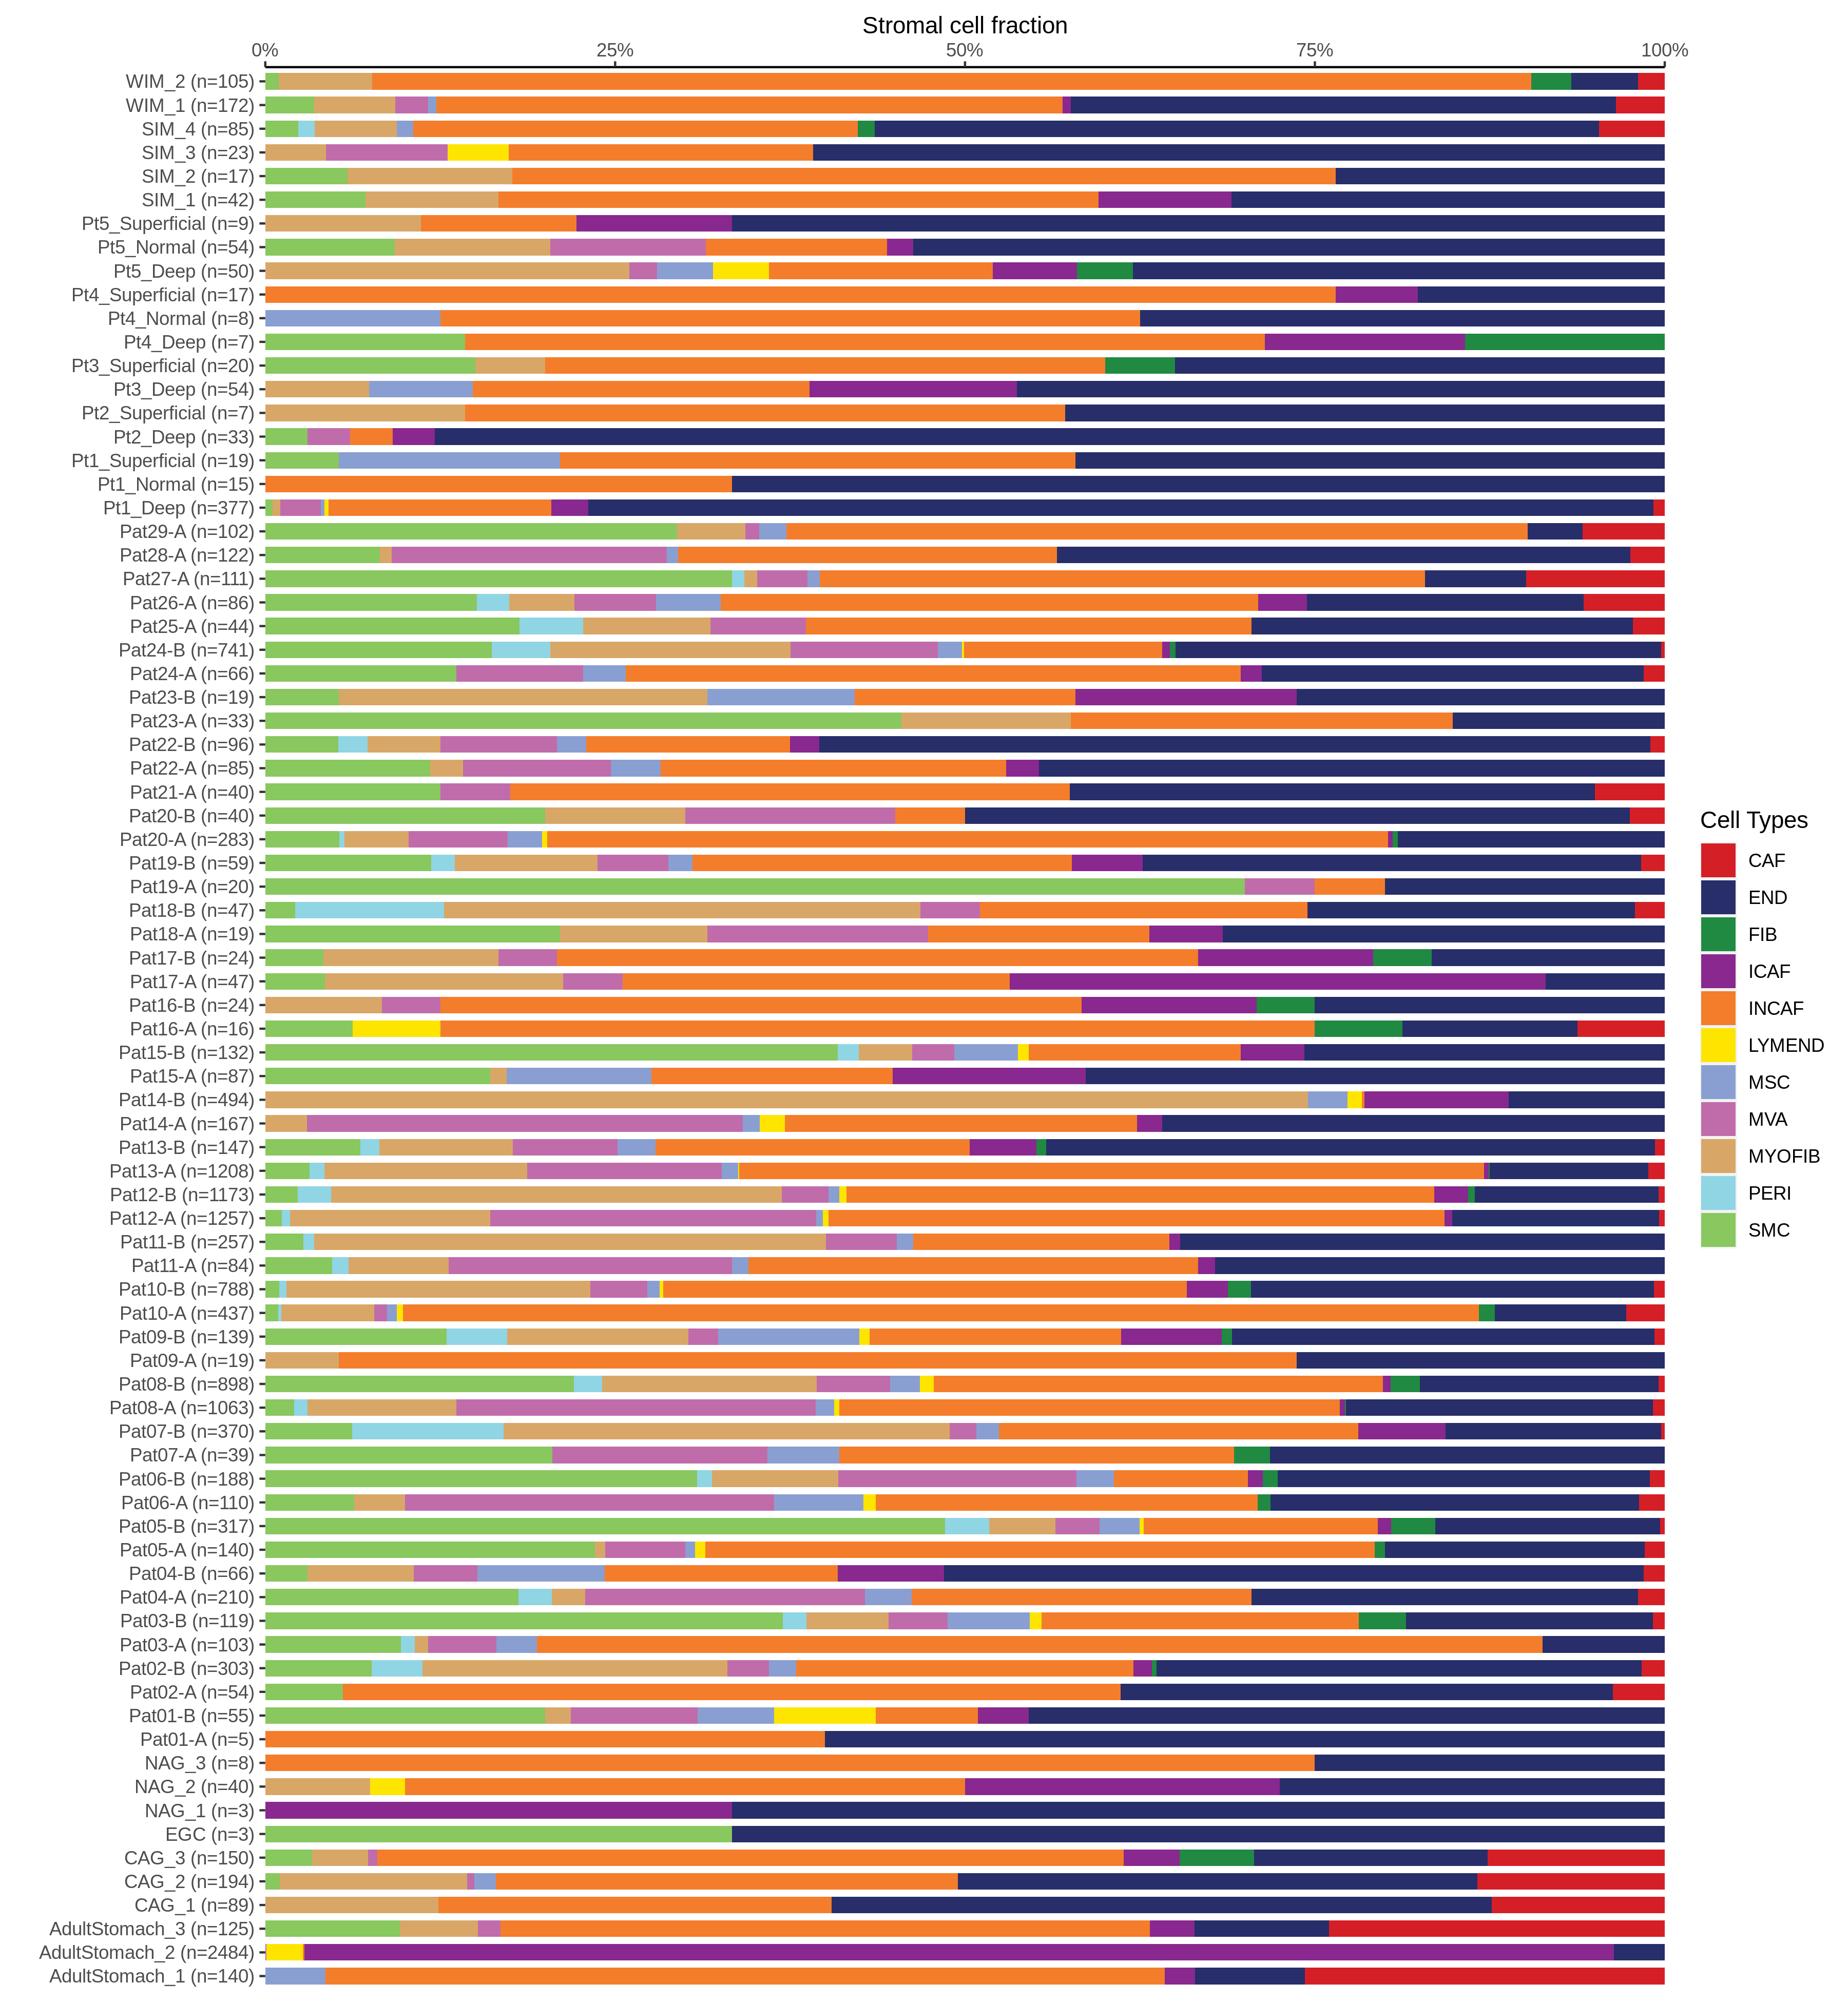
Bar plot representation of the fraction of all Epithelial cells in each sample composed of each cell type for the integrated scRNA-seq datasets of Breast tissues. Each row represents a single sample, with each color representing a different cell type present in the sample.Bar plot representation of the fraction of all Immune cells in each sample composed of each cell type for the integrated scRNA-seq datasets of Breast tissues. Each row represents a single sample, with each color representing a different cell type present in the sample.Bar plot representation of the fraction of all Stromal cells in each sample composed of each cell type for the integrated scRNA-seq datasets of Breast tissues. Each row represents a single sample, with each color representing a different cell type present in the sample.
∗Bar plot representation of the fraction of all Epithelial, Immune and Stromal cells in each sample composed of each cell type for the integrated scRNA-seq datasets of Stomach tissue. Each row represents a single sample, with each color representing a different cell type present in the sample.

check button Tissue summary table.
TissueDisease StateReplicatesEpithelia UMAPPMIDSourcePlatform
StomachCSGNAG_1Projection

31067475

GSE134520

10X Genomics
StomachCSGNAG_2Projection

31067475

GSE134520

10X Genomics
StomachCSGNAG_3Projection

31067475

GSE134520

10X Genomics
StomachCAGCAG_1Projection

31067475

GSE134520

10X Genomics
StomachCAGCAG_2Projection

31067475

GSE134520

10X Genomics
StomachCAGCAG_3Projection

31067475

GSE134520

10X Genomics
StomachWIMWIM_1Projection

31067475

GSE134520

10X Genomics
StomachWIMWIM_2Projection

31067475

GSE134520

10X Genomics
StomachSIMSIM_1Projection

31067475

GSE134520

10X Genomics
StomachSIMSIM_2Projection

31067475

GSE134520

10X Genomics
StomachSIMSIM_3Projection

31067475

GSE134520

10X Genomics
StomachSIMSIM_4Projection

31067475

GSE134520

10X Genomics
StomachGCEGCProjection

31067475

GSE134520

10X Genomics
StomachADJPat01-AProjection

35087207

GSE150290

10X Genomics
StomachGCPat01-BProjection

35087207

GSE150290

10X Genomics
StomachADJPat02-AProjection

35087207

GSE150290

10X Genomics
StomachGCPat02-BProjection

35087207

GSE150290

10X Genomics
StomachADJPat03-AProjection

35087207

GSE150290

10X Genomics
StomachGCPat03-BProjection

35087207

GSE150290

10X Genomics
StomachADJPat04-AProjection

35087207

GSE150290

10X Genomics
∗Projection of epithelial scRNA-seq cells from Stomach diseased tissue samples into the manifold of normal tissue epithelial cells. Projected cells are colored by nearest normal cells in the projection and normal epithelial cells are colored gray.
Page: 1 2 3 4 5 

Top

Annotation details for different cell compartments

check button Single-cell atlas of expresion.
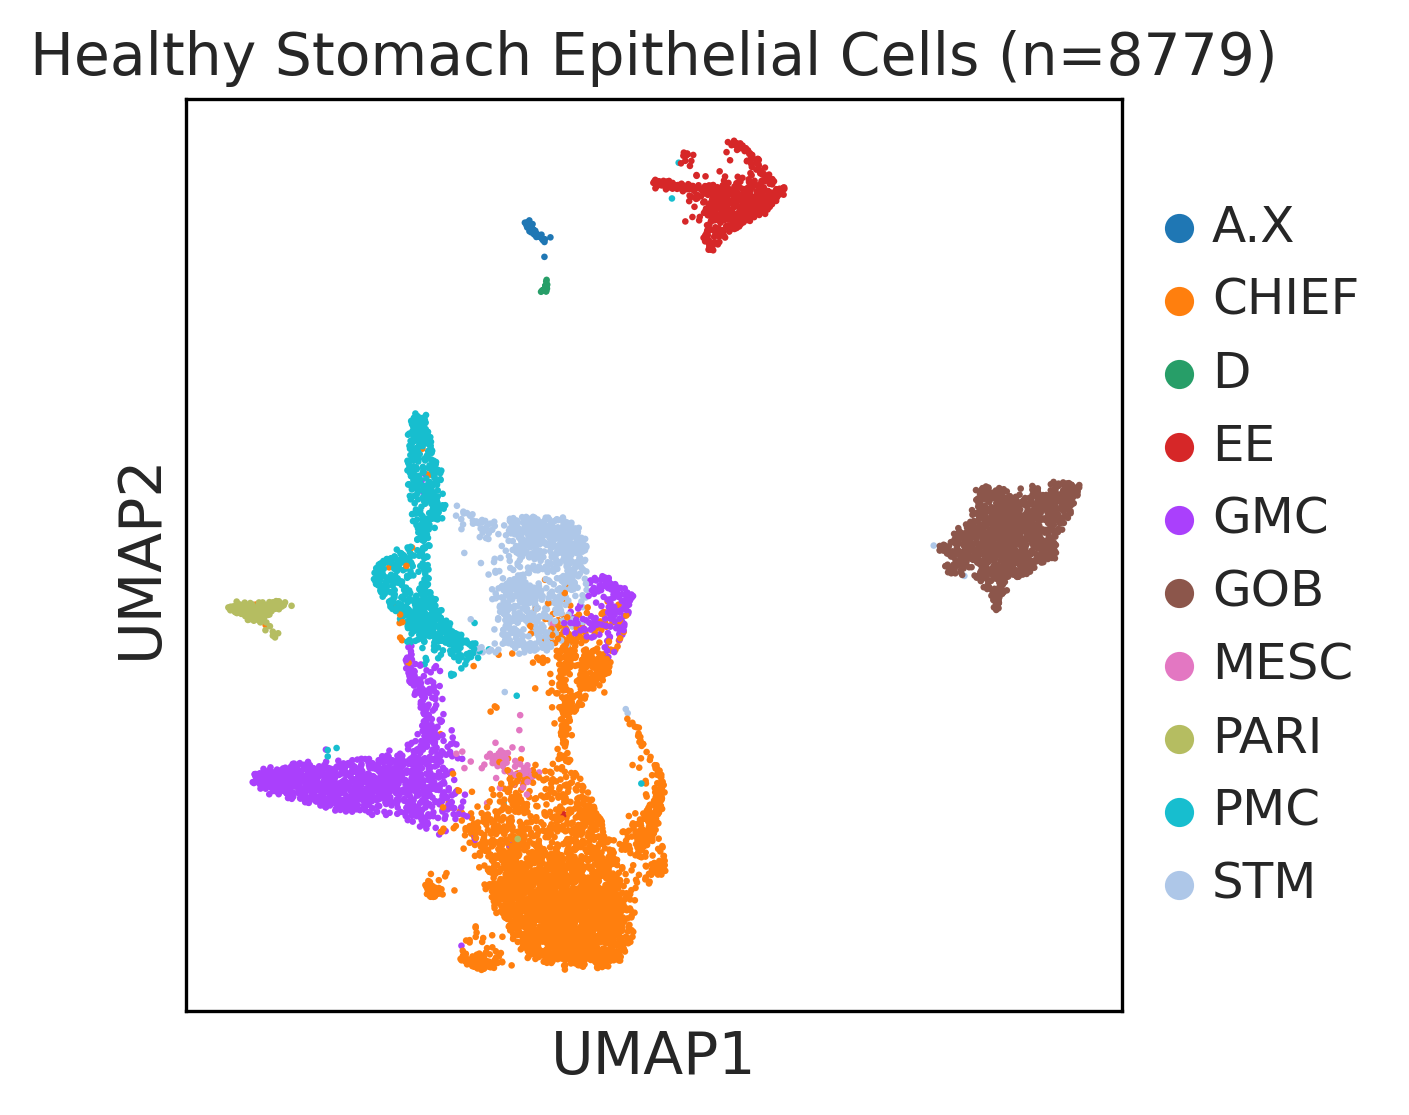
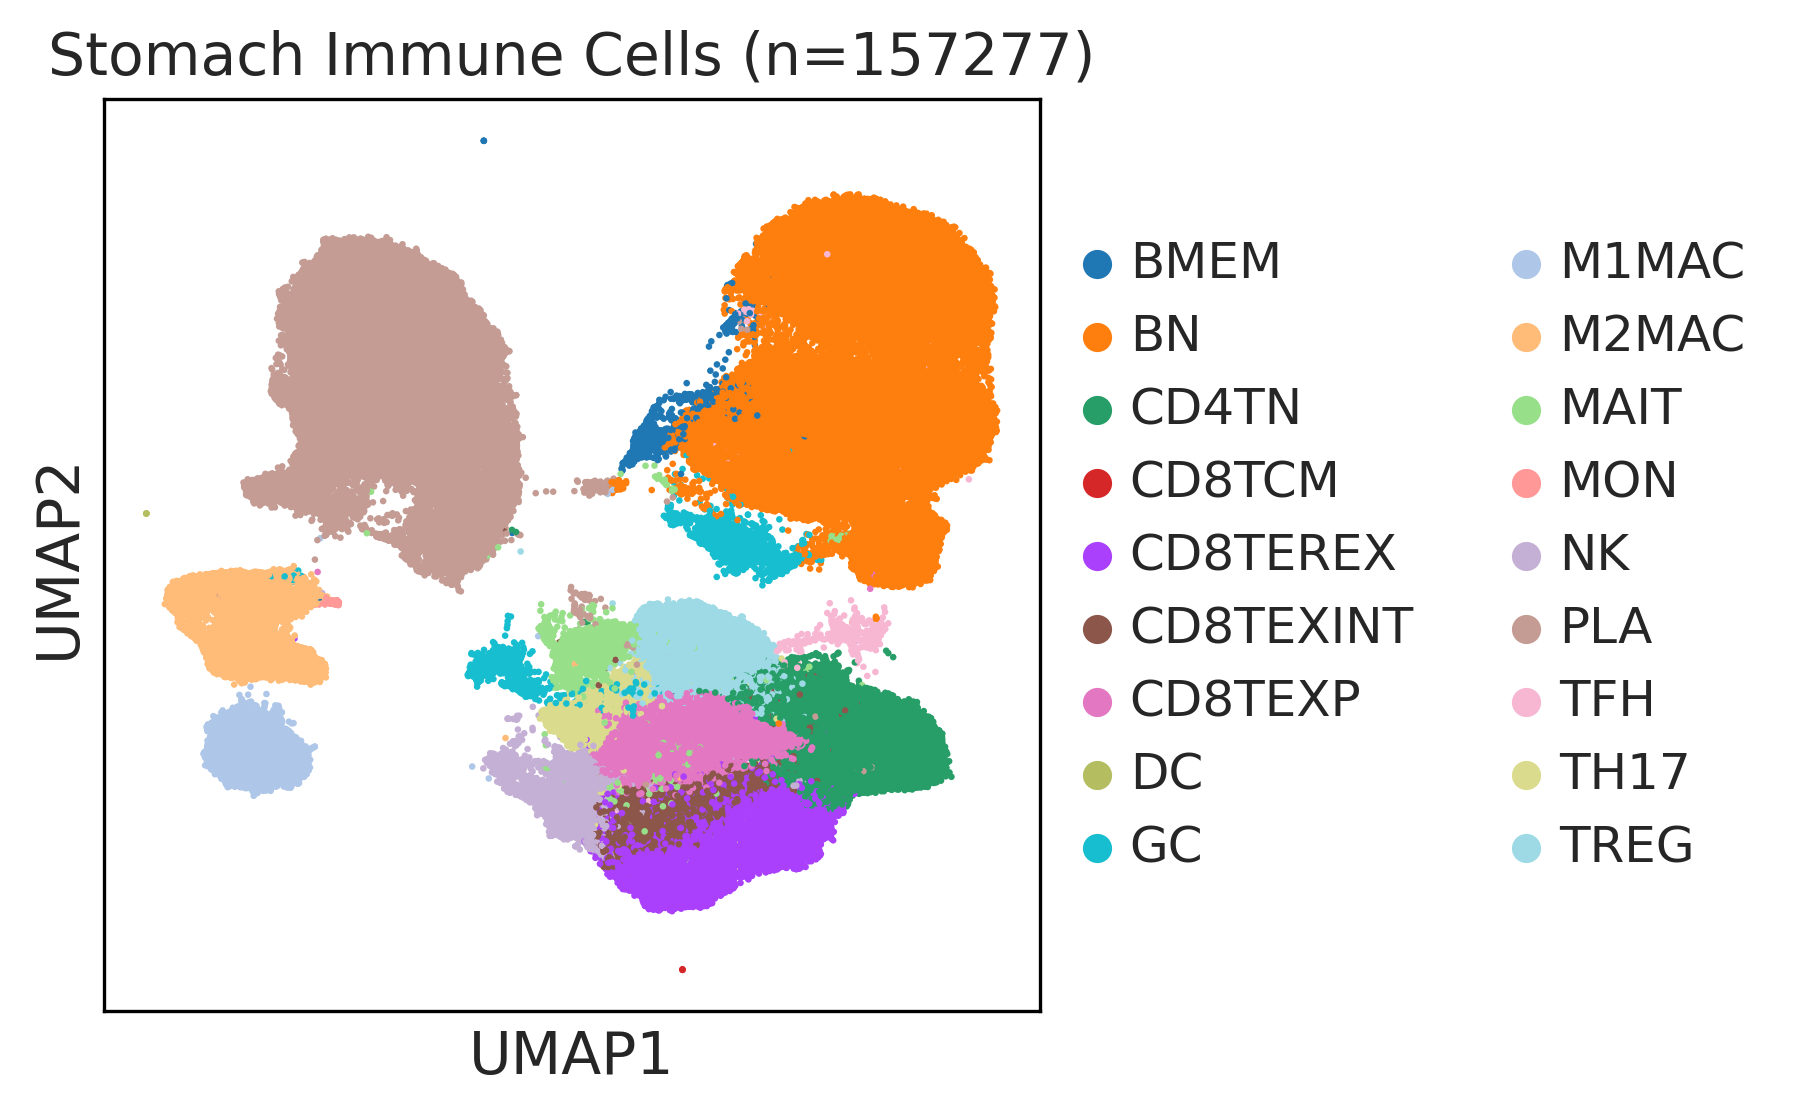
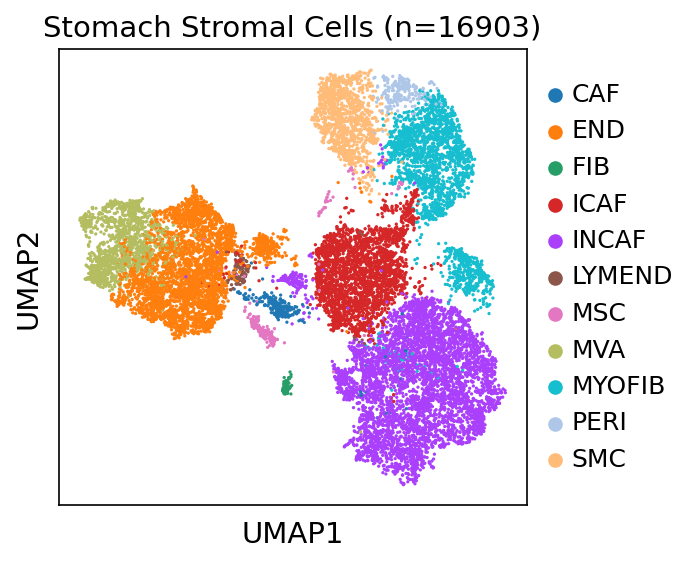
UMAP representations and annotations of Epithelial cells in the integrated scRNA-seq data of the selected tissue.UMAP representations and annotations of Immune cells in the integrated scRNA-seq data of the selected tissue.UMAP representations and annotations of Stromal cells in the integrated scRNA-seq data of the selected tissue.
∗UMAP representations and annotations of Epithelial, Immune, Stromal cells in the integrated scRNA-seq data of Stomach tissue. Colors represent cell types of each compartment.

check button Cell markers.
TissueMajor Cell TypeMinor Cell TypeFull NameMarkers
StomachEpiSTMStem-like cellsLGR5,OLFM4,ASCL2,SMOC2,RGMB,ASCL2,SOX9,CD34,SOX2,CCKBR
StomachEpiGOBGobletATOH1,MUC2,TFF3,HES6,KLK1,ITLN1,WFDC2,CLCA1,LRRC26,RETNLB,SPINK4,AGR2
StomachEpiEEEnteroendocrineCHGA,NEUROD1,CHGB,TAC1,TPH1,NEUROG3,GAST,PROX1
StomachEpiPMCPit mucous cellMUC5AC,GKN1,GKN2
StomachEpiGMCGland mucous cellsMUC6,TFF2
StomachEpiPARIParietal cellsATP4A,ATP4B,GIF
StomachEpiCHIEFChief cellsPGA4,PGA3,LIPF,PGC
StomachEpiMESCMetaplasia stem cells OLFM4,REG1A,CLDN3
StomachEpiA.XA/X cellsGAST,GHRL
StomachEpiDD cellsSST
StomachImmDCDendritic cellsHLA-DQA1,HLA-DQB1,CLEC10A,CLEC9A,FCER1A,CST3,CD1C
StomachImmNKNatural killer cellsKLRF1,SH2D1B,NCAM1,FCGR3A,GNLY,NKG7,GZMH,FGFBP2,CX3CR1,NCR1,NCR3,B3GAT1
StomachImmM1MACM1 macrophagesFOLR2,FABP3,PLA2G2D,ITGAM,ITGAX,CSF1R,CD68,CD163,THBD
StomachImmMONMonocytesCD14,CLEC9A,FCGR1A,LILRB2,CD209,CD1E,FCN1,VCAN
StomachImmM2MACM2 macrophagesCSF1R,CSF3R,MRC1,IL10,CCL18,VSIG4,CHI3L1
StomachImmBNNaive B cellsCD19,IGHD,IGLL1,CD27,CD38
StomachImmBMEMMemory B cellsPAX5,MS4A1,CD19,IGLL5,VPREB3,CD79A,CD79B,IGKC,CD74,HLA-DRA,CD37,CD22
StomachImmGCGerminal center B cellsSERPINA9,HRK,HTR3A,BCL6,CD180,FCRLA
StomachImmPLAPlasma cellsSSR4,IGLL5,IGLL1,AMPD1,IGHA1,IGHA2,JCHAIN,CD38,TNFRSF17,SDC1,IGHG1,MZB1
StomachImmCD4TNNaive CD4+ T cellsIL7R,SELL,CCR7,S100A4,TCF7
StomachImmTH17T-helper 17IL17A,CTSH,KLRB1,IL26,CCR6
StomachImmTH1T-helper 1CXCL13,IFNG,CXCR3,BHLHE40,GZMB,PDCD1,HAVCR2,ICOS,IGFLR1,ITGAE
StomachImmTFHT follicular helperCXCR5,BCL6,ICA1,TOX,TOX2,IL6ST,MAGEH1,BTLA,ICOS,PDCD1,CD200
StomachImmTREGRegulatory T cellsBATF,TNFRSF4,FOXP3,CTLA4,LAIR2,IL2RA
StomachImmMAITMucosal-associated invariant T cellsSLC4A10,DPP4,KLRB1,ZBTB16,NCR3,RORC,RORA
StomachImmCD8TEXPProgenitor exhausted CD8+ T cellsPDCD1,IL7R,GPR183,NR4A3,REL,TCF7
StomachImmCD8TEXINTIntermediate exhausted CD8+ T cellsPDCD1,LAG3,CD101,CD38,CXCR6,TIGIT
StomachImmCD8TEREXTerminally exhausted CD8+ T cellsTOX,GZMB,ENTPD1,ITGAE,HAVCR2,CXCL13,PDCD1,LAYN,TOX,IFNG,GZMB,MIR155HG,TNFRSF9,ITGAE
StomachImmCD8TCMCentral memory CD8+ T cellsCCR7,SELL,IL7R,CD27,CD28,PRF1,GZMA,CCL5,GPR183,S1PR1
StomachStrENDEndothelial cellsPECAM1,PLVAP,VWF,CLDN5,FLT1,RAMP2,FAM110D,INHBB,NPR1,NOVA2,GPIHBP1,SOX17
StomachStrLYMENDLymphatic endothelial cellsPROX1,LYVE1,PDPN,PROCR,FLT4
StomachStrMSCMesenchymal stem cellsNT5E,THY1,ENG,CD44,ITGB1,MCAM,ENDOD1
StomachStrFIBFibroblastsTGFB1,BMP7,MAP3K2,COL6A1,CD36,CD44,FAP,CBLN2,SPOCK1,ACSS3,COL1A1,FN1,COL1A2,COL3A1,BGN,DCN,POSTN,C1R,ACTA2,MMP2,FGF7,MME,CD47
StomachStrSMCSmooth muscle cellsACTA2,CNN1,MYH11,TAGLN,CALD1,TAGLN2
StomachStrMYOFIBMyofibroblastsSYT10,SOSTDC1,DES,TAGLN,MYH11,TPM4
StomachStrPERIPericytesPDGFRA,CSPG4,RGS5,MCAM,COX4I2,KCNJ8,HIGD1B,NOTCH3,HEYL,FAM162B
StomachStrMVAMicrovascular cellsPLVAP,CD36,DYSF,NRP1,SH3BP5,EXOC3L2,FABP5,VWA1,BAALC,PRSS23,RAPGEF4,APLN,HTRA1
StomachStrINCAFIntermediate cancer-associated fibroblastsPDGFRA,POSTN,ID1,ID3
StomachStrICAFInflammatory cancer-associated fibroblastsTWIST1,WNT2,FAP,CXCL1,CXCL2,CYR61,IL1B,IL6,HGF
StomachStrCAFCancer-associated fibroblastsTWIST1,WNT2,FAP,CXCL1,CXCL2

Top

Cell type statistics by disease state

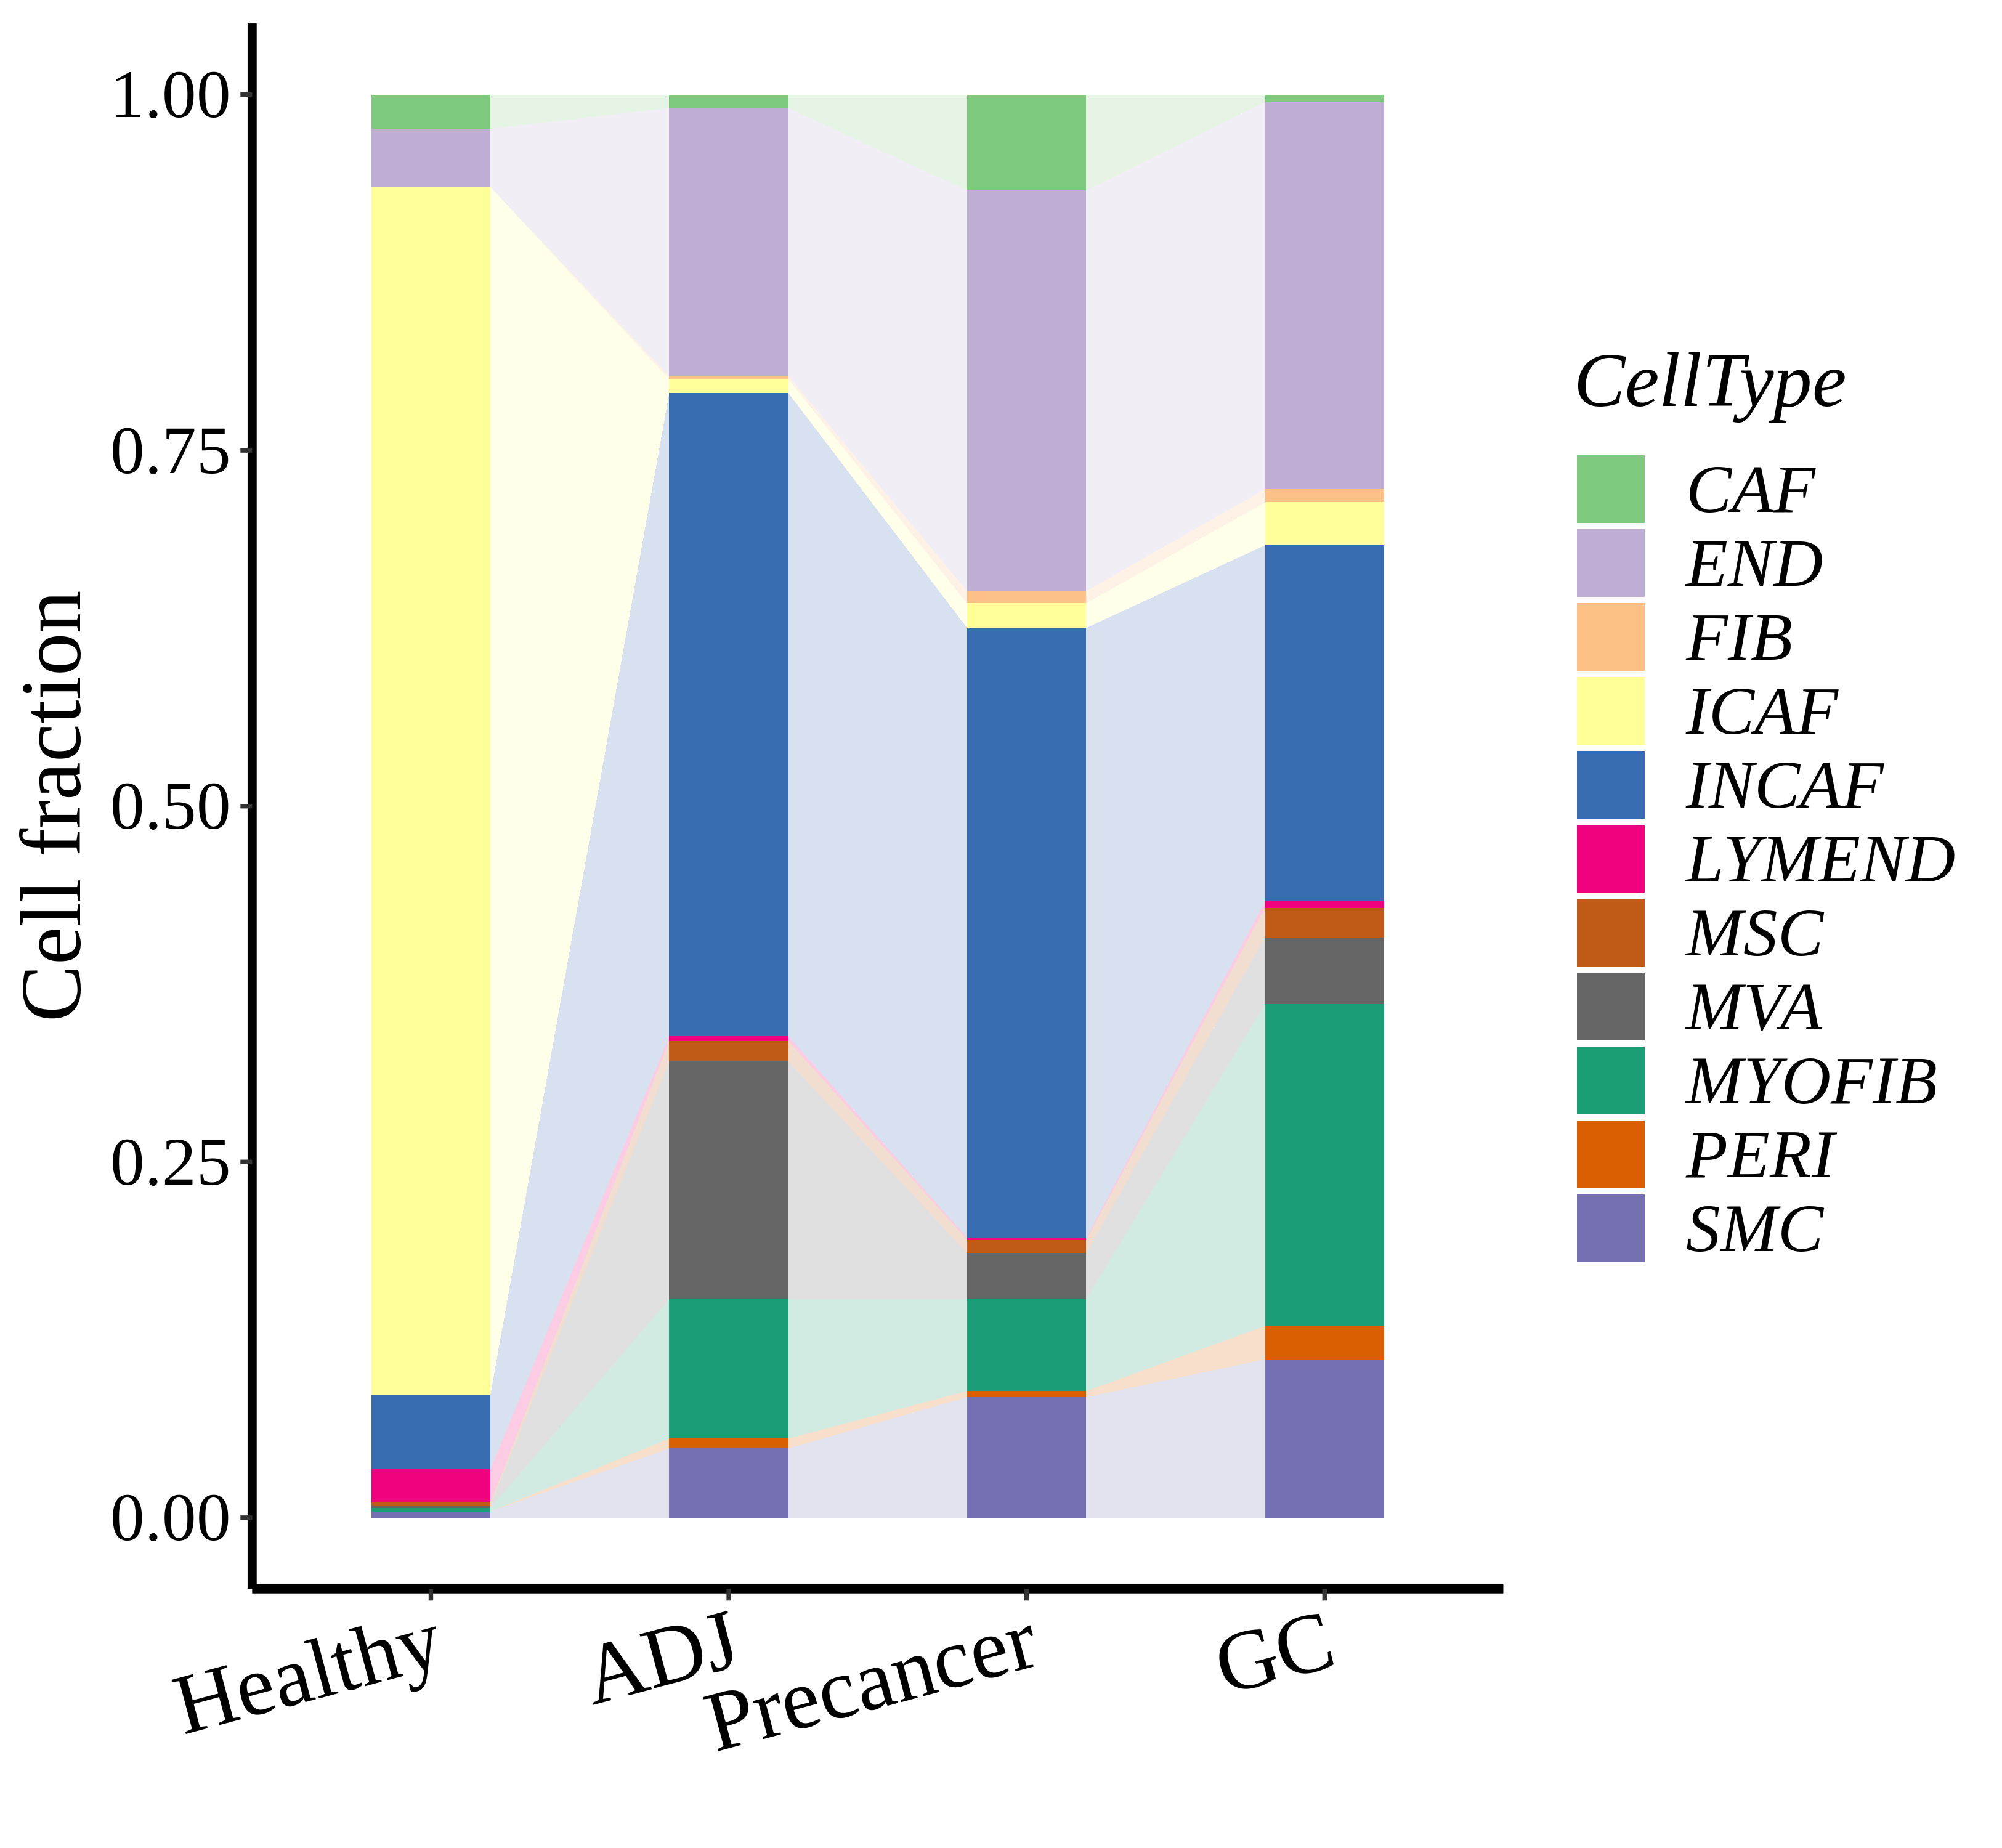
Stacked bar graph representation of the fraction of each epithelial cell type derived from samples with different Disease States in the integrated dataset of the selected tissue. Cells from each Disease State sample have a different color.Stacked bar graph representation of the fraction of each immune cell type derived from samples with different Disease States in the integrated dataset of the selected tissue. Cells from each Disease State sample have a different color.Stacked bar graph representation of the fraction of each stromal cell type derived from samples with different Disease States in the integrated dataset of the selected tissue. Cells from each Disease State sample have a different color.
∗Stacked bar graph representation of the fraction of each epithelial cell type derived from samples with different Disease States in the integrated dataset of Stomach tissue. Cells from each Disease State sample have a different color.

Top

Cell type dynamics in malignant transformation

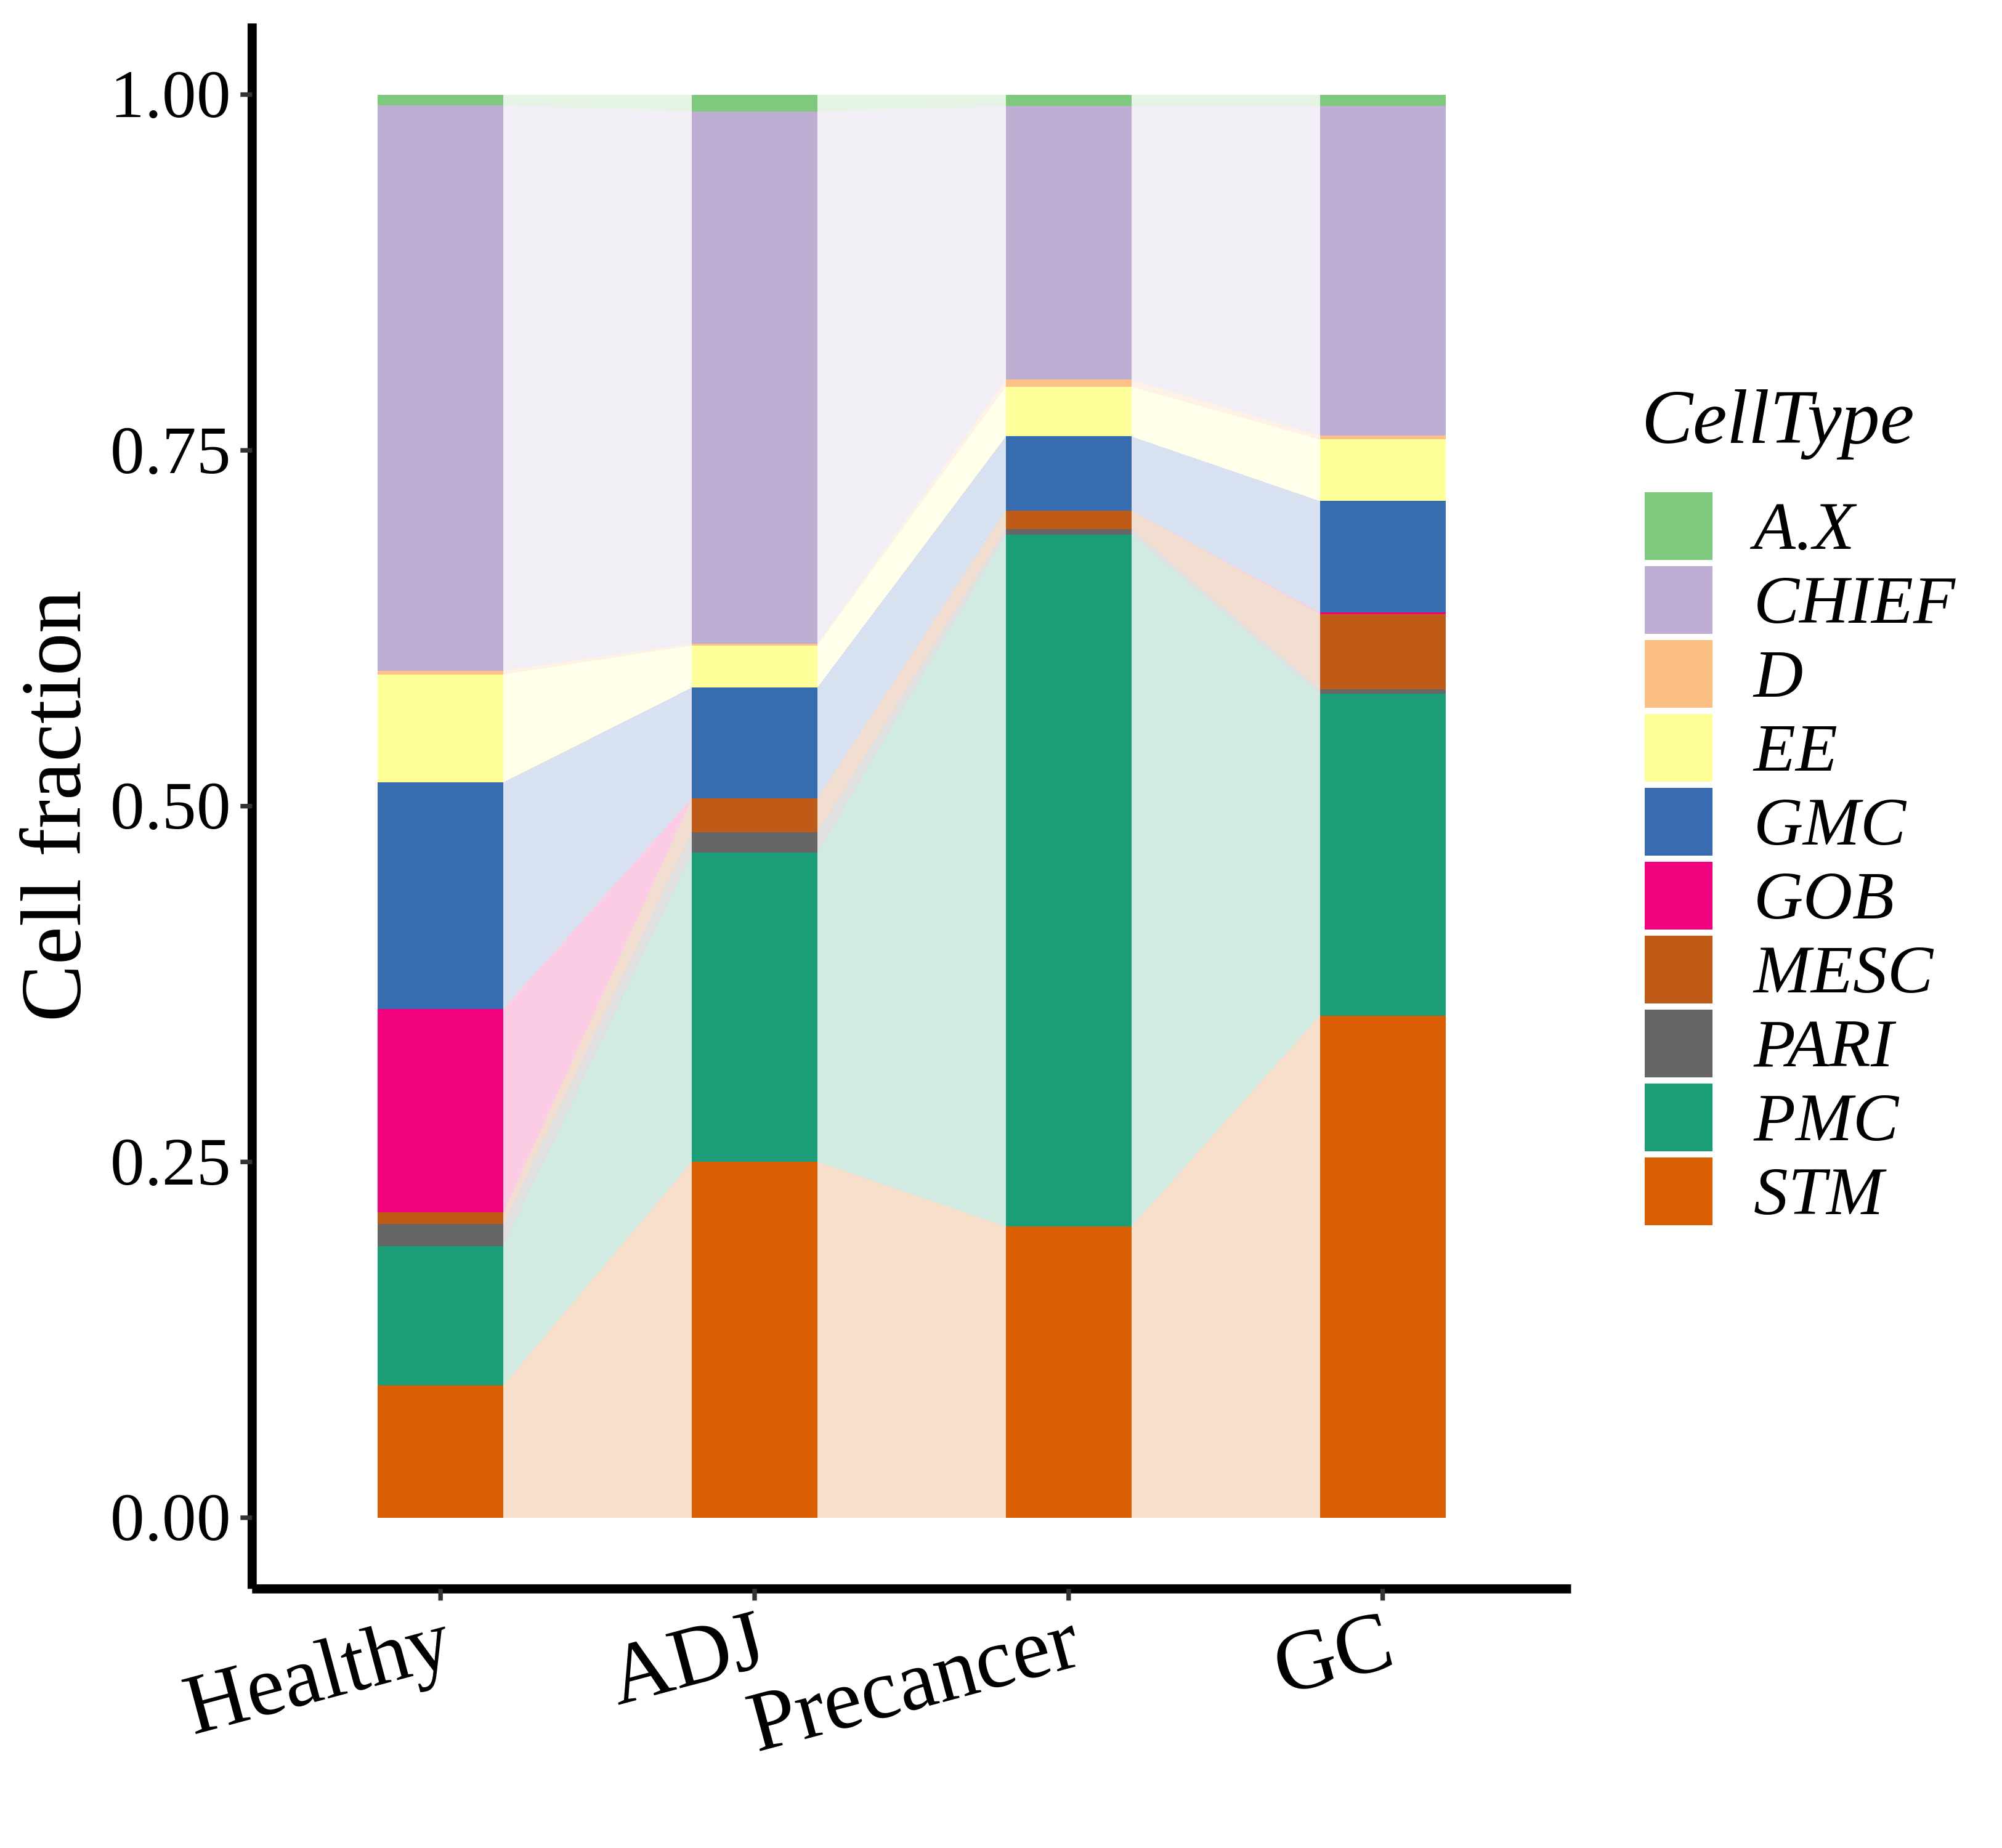
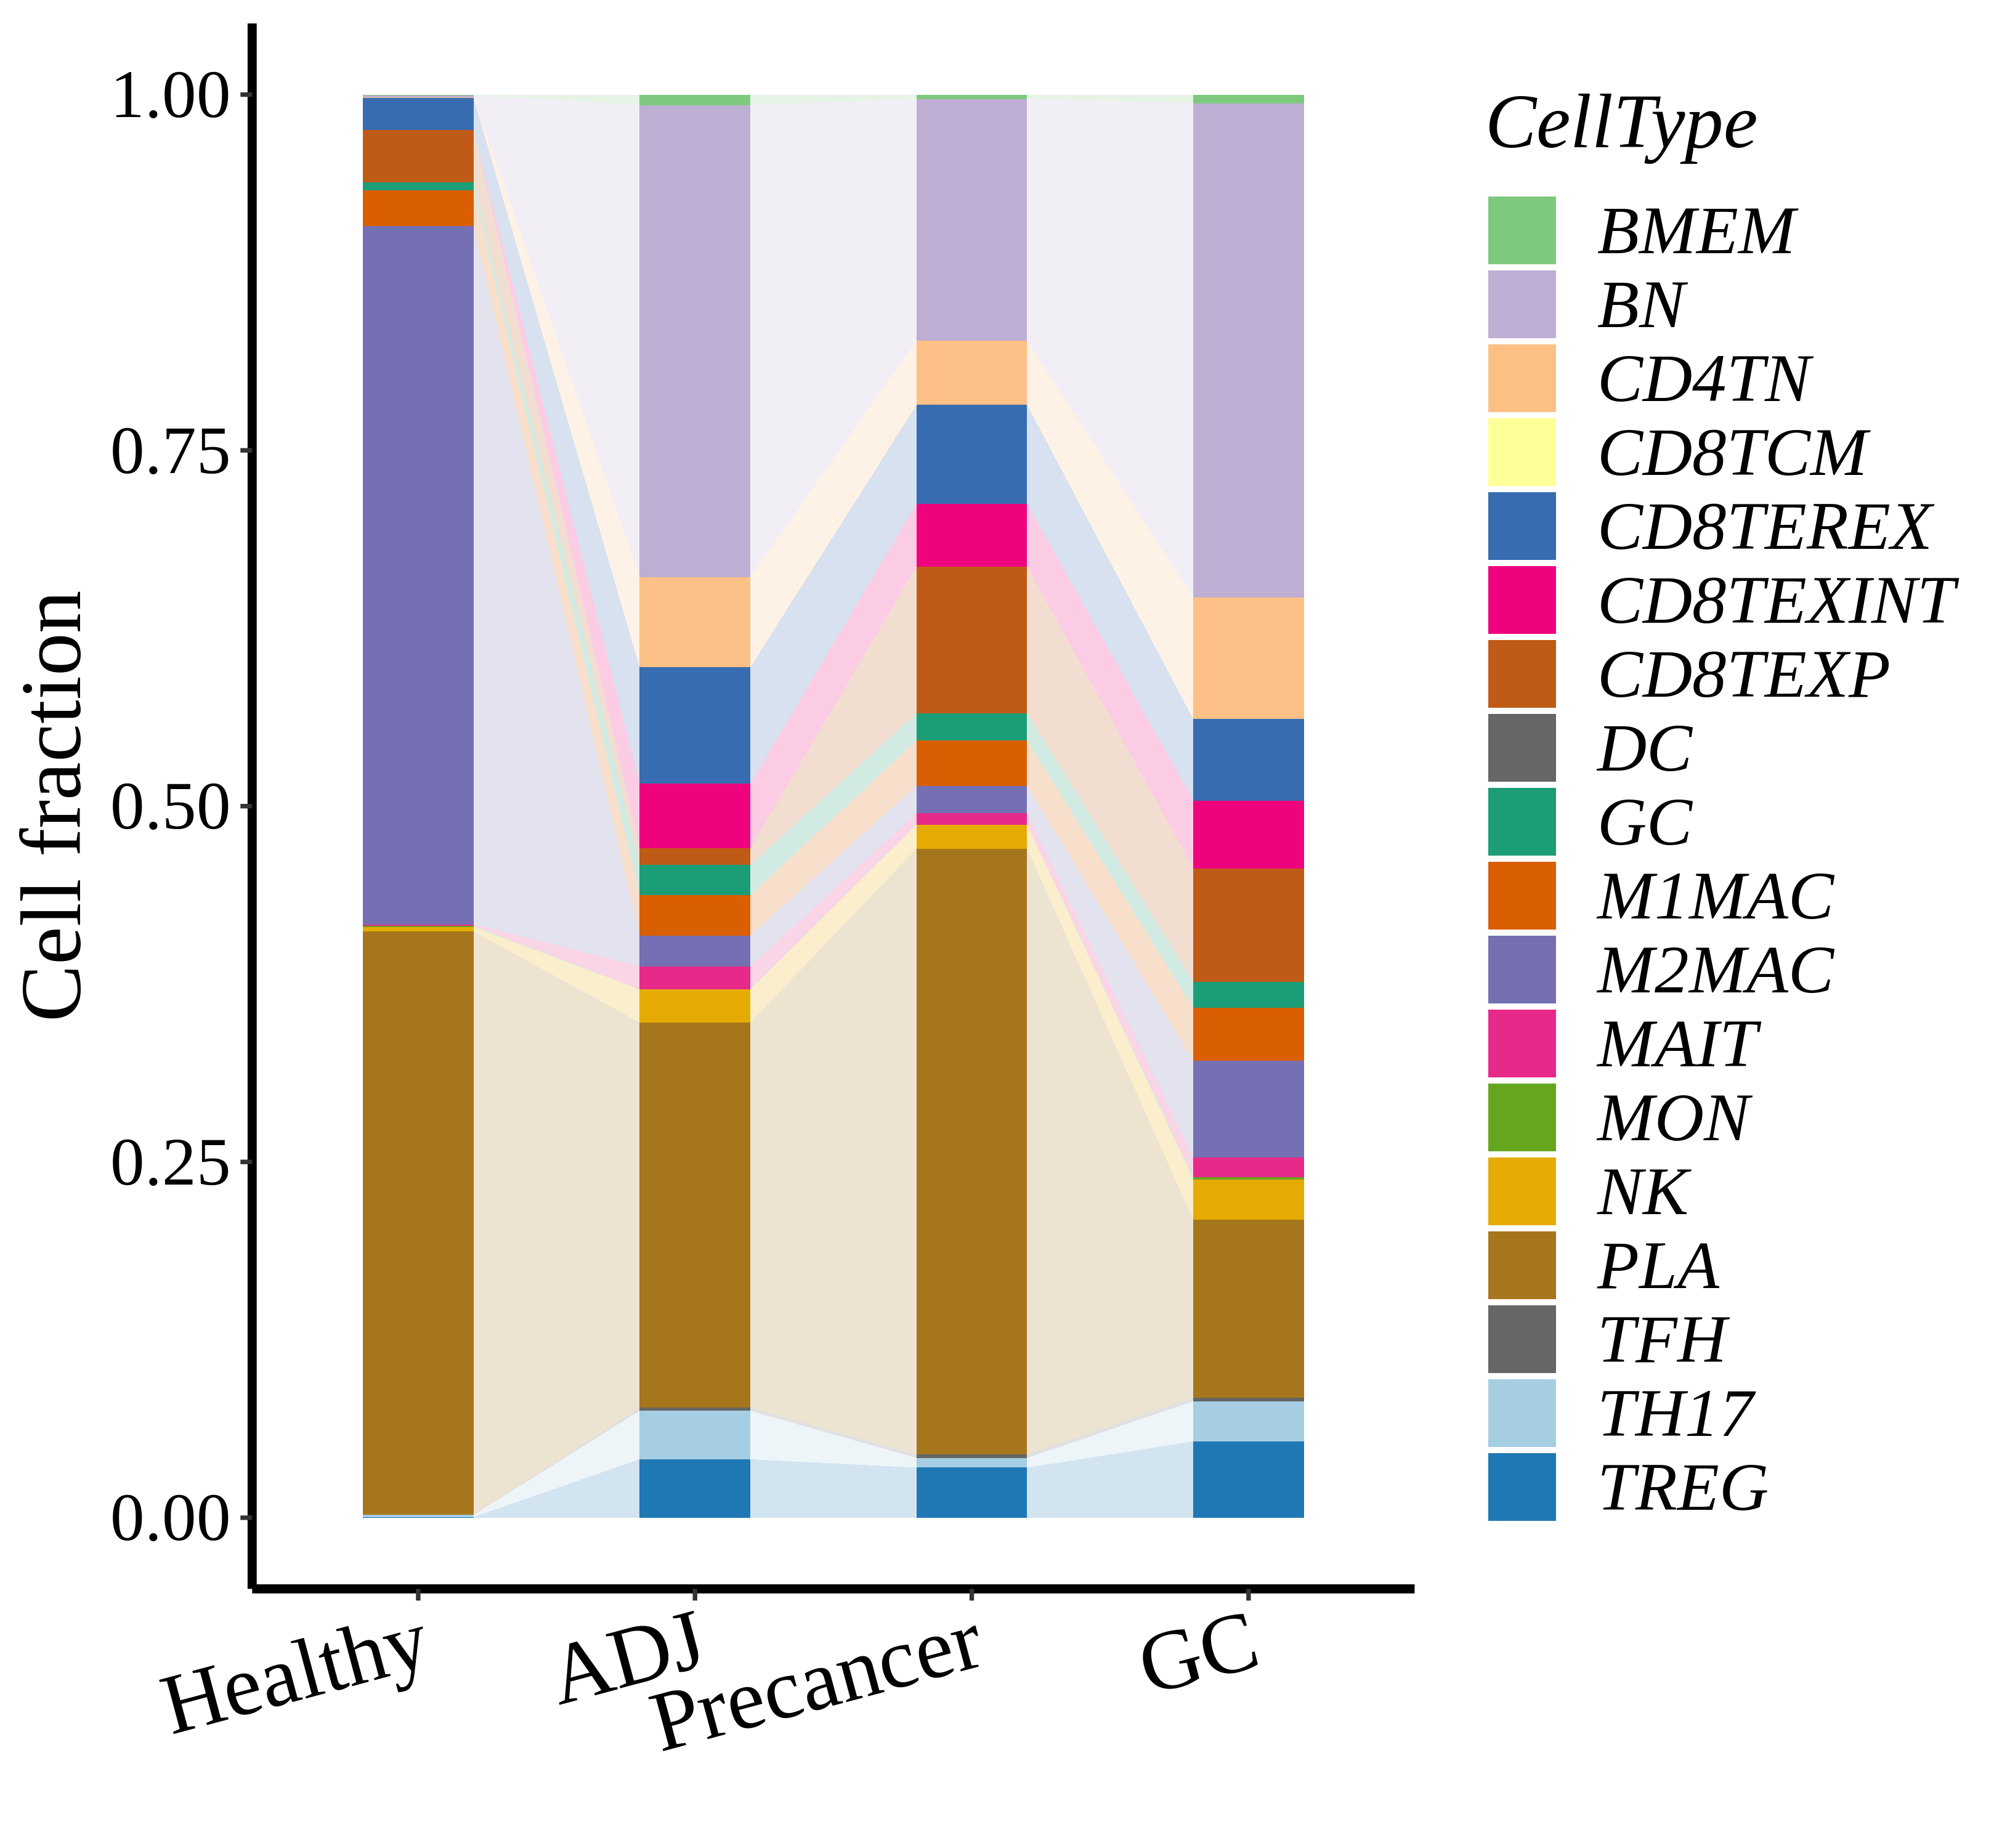
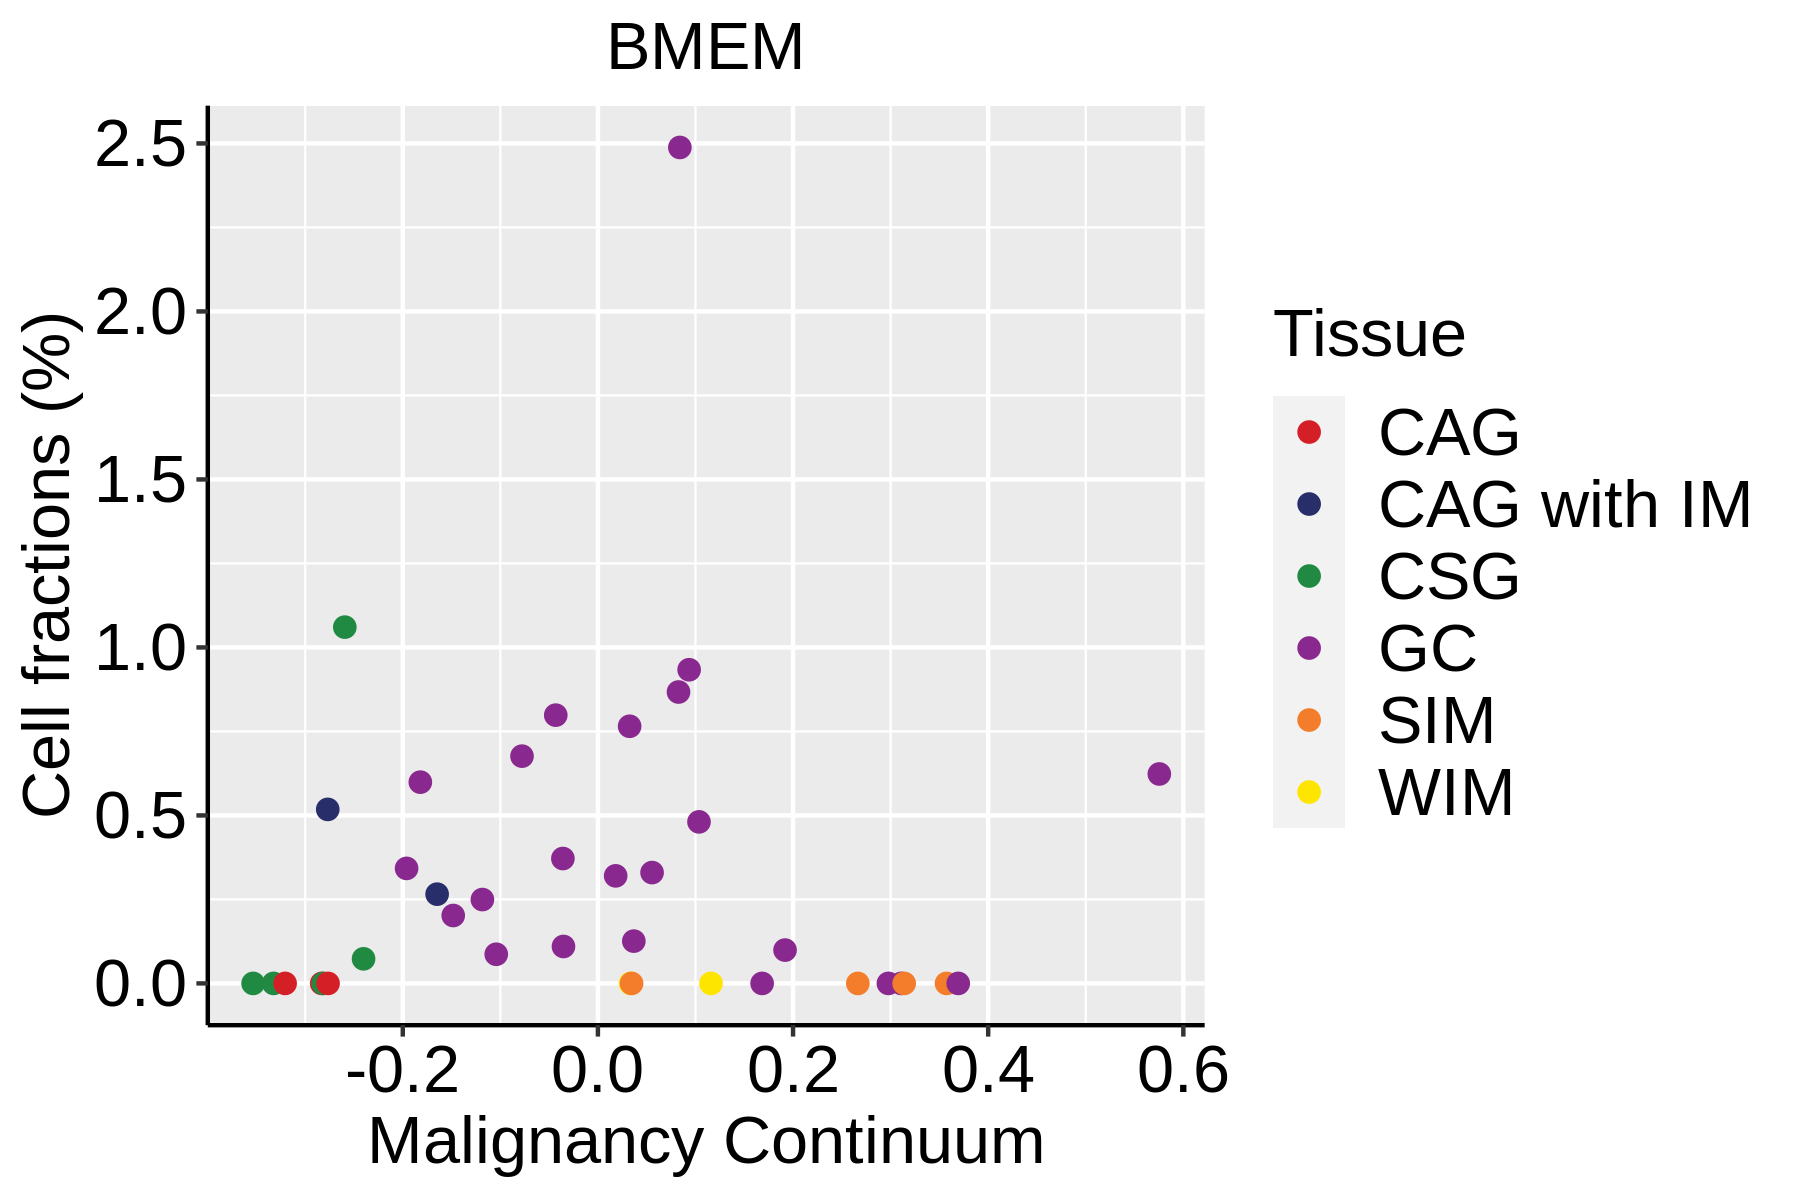
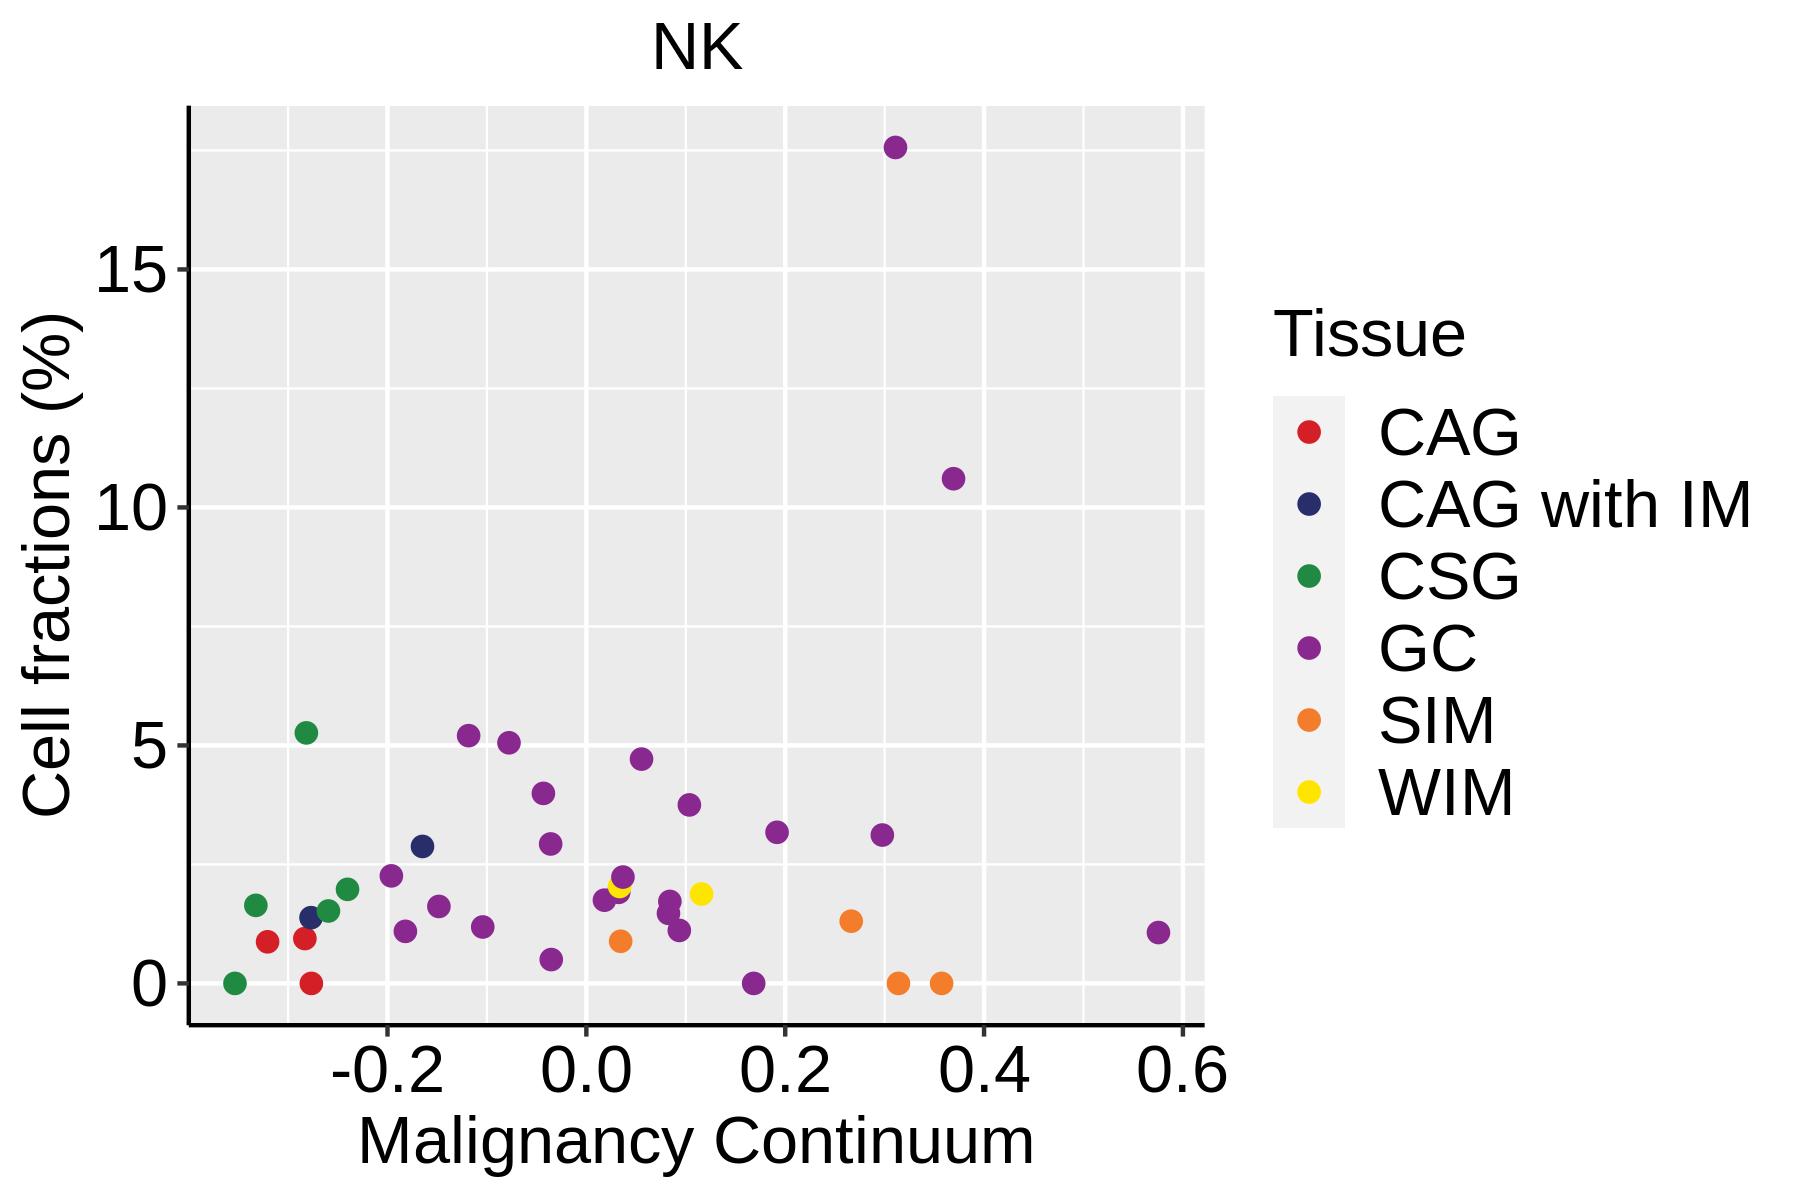
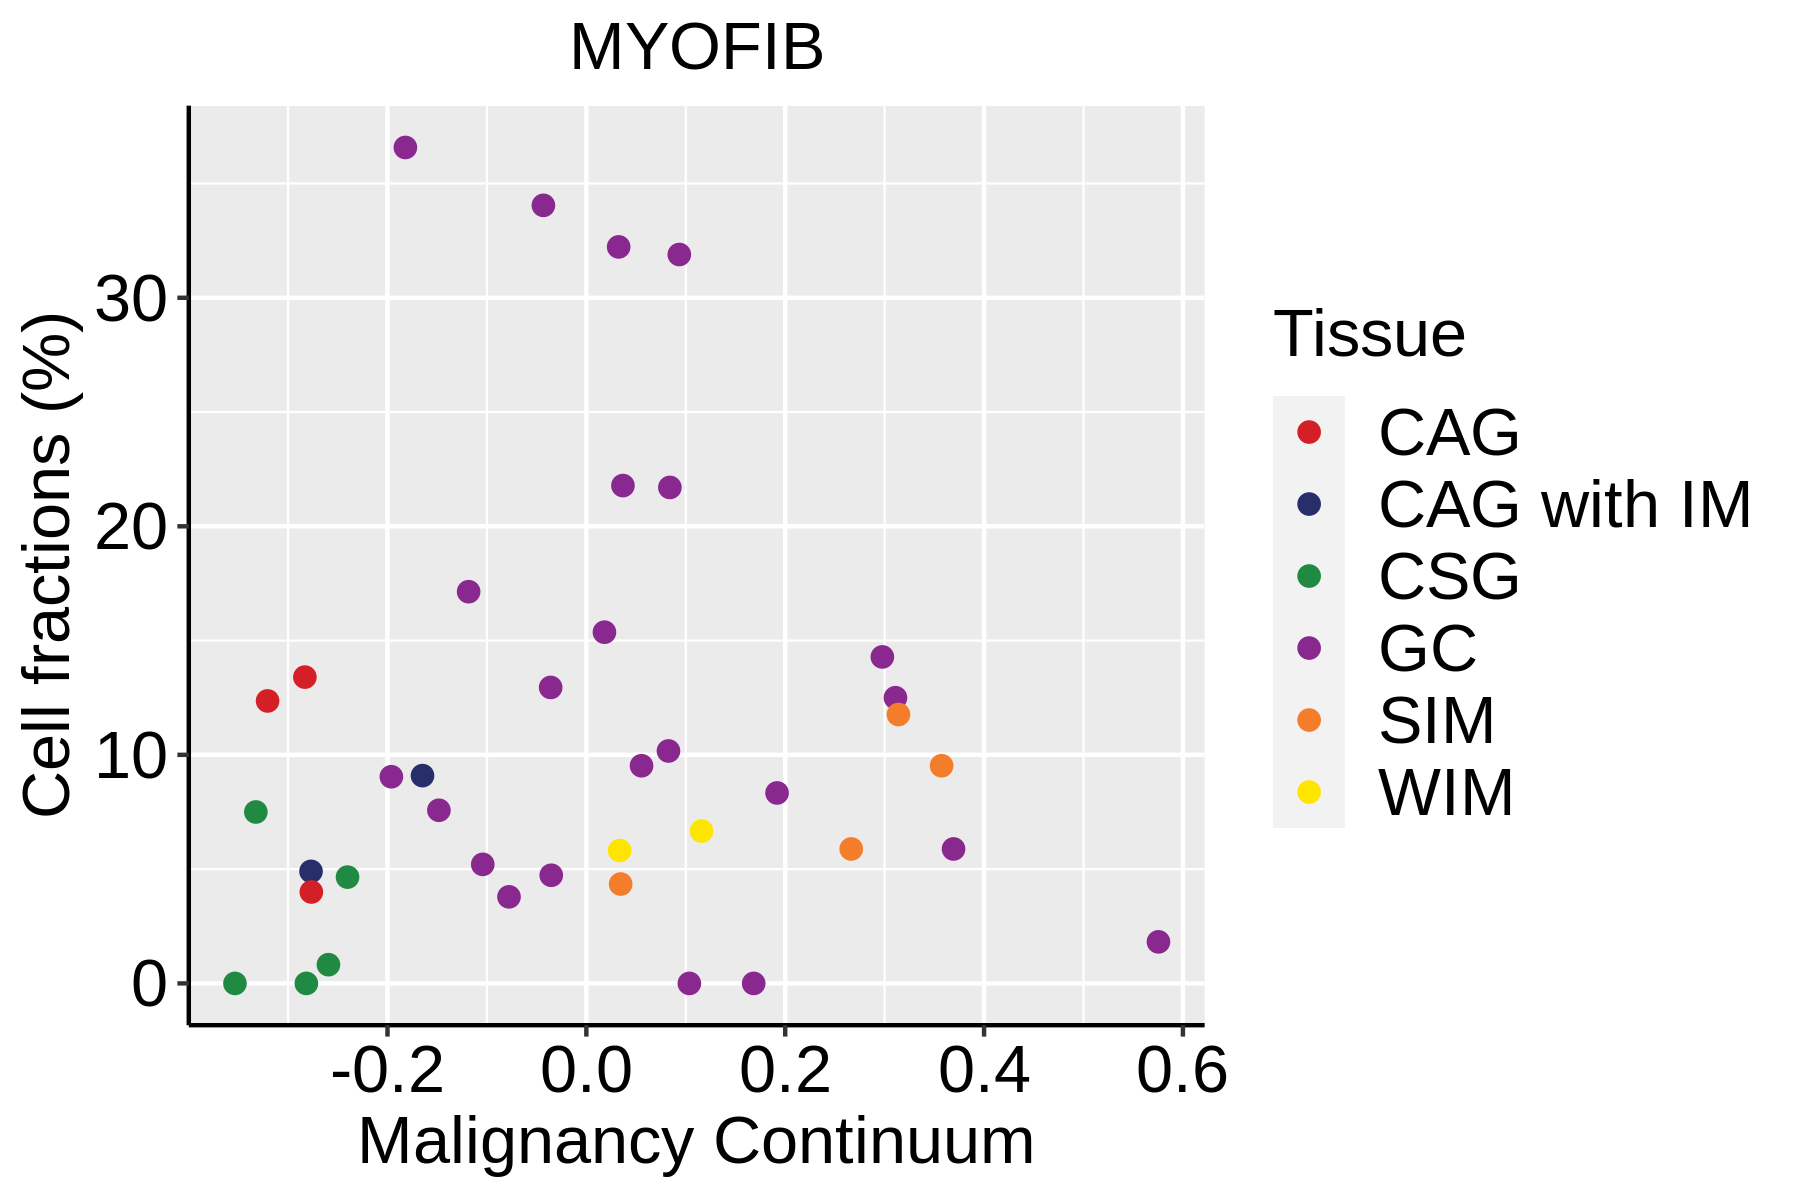
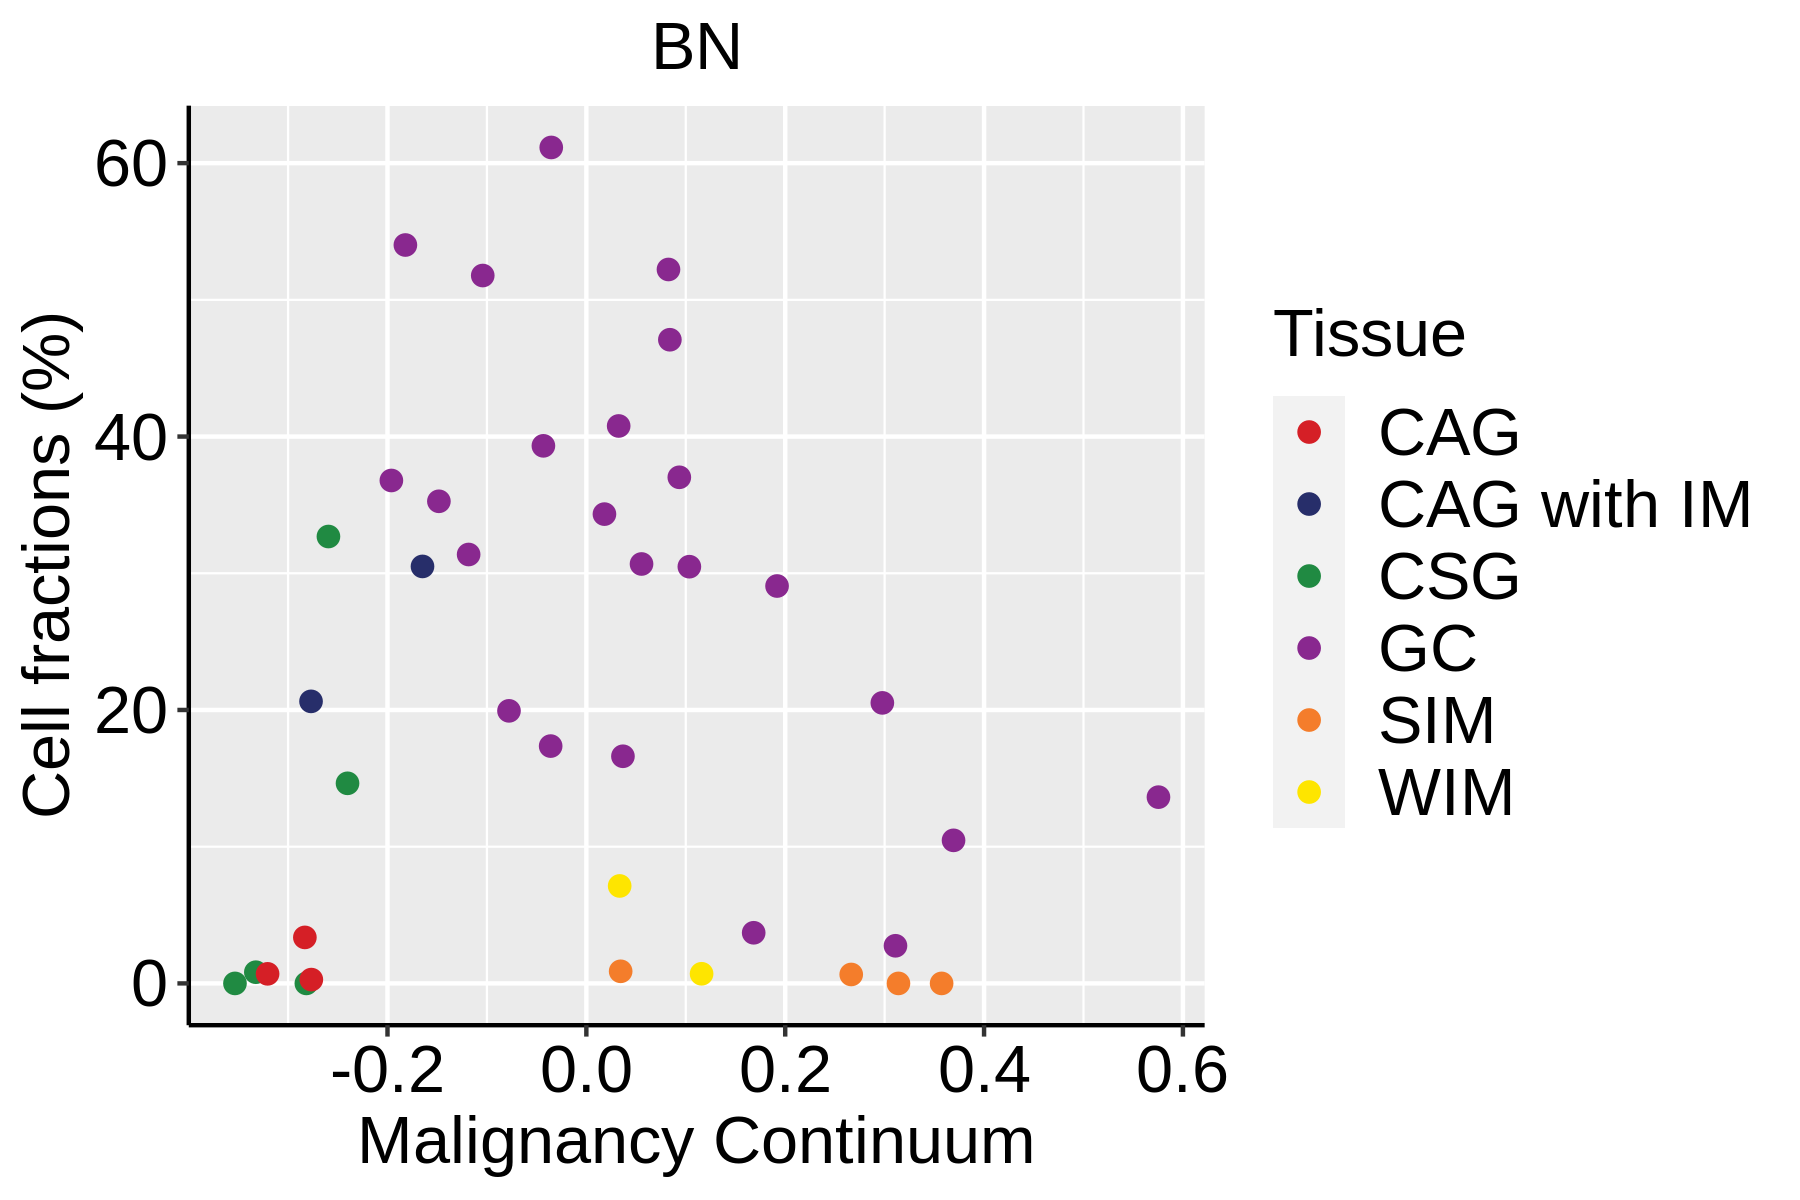
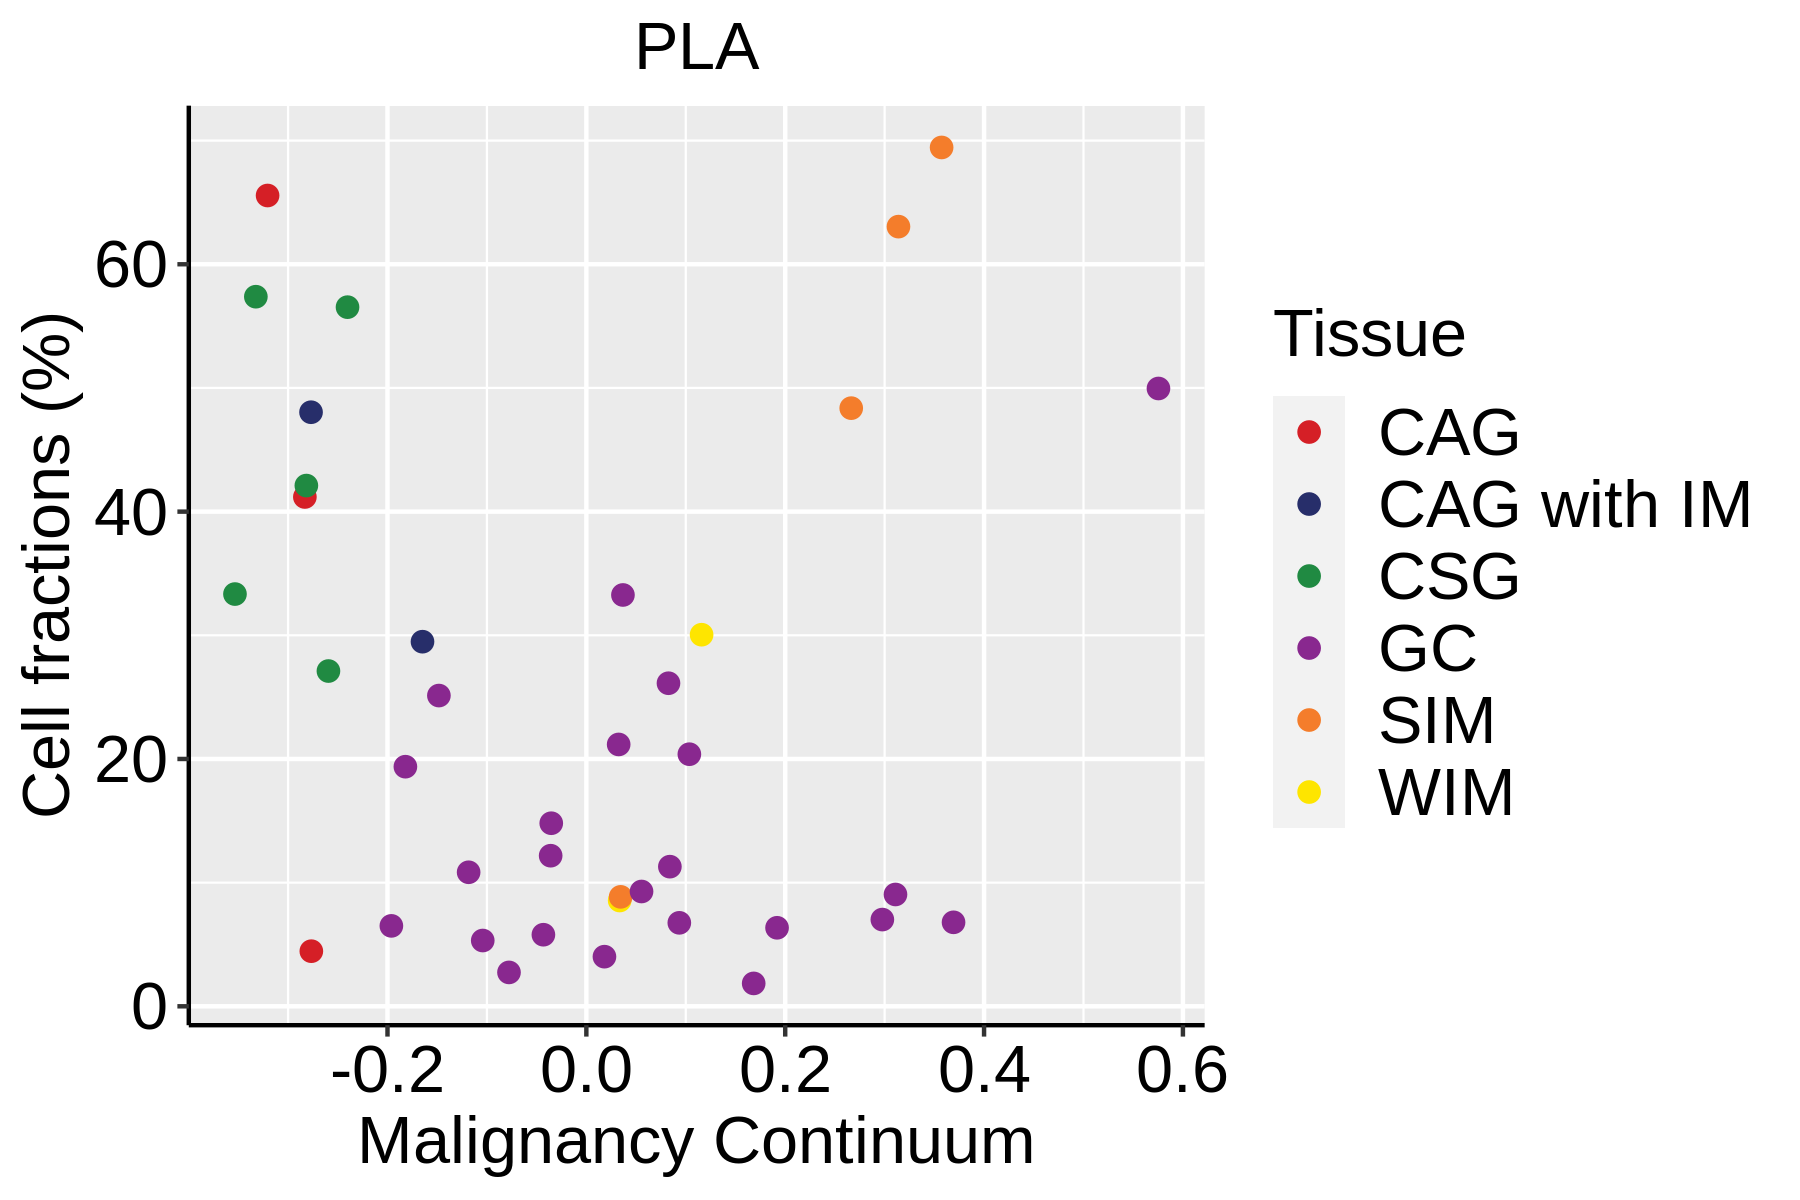
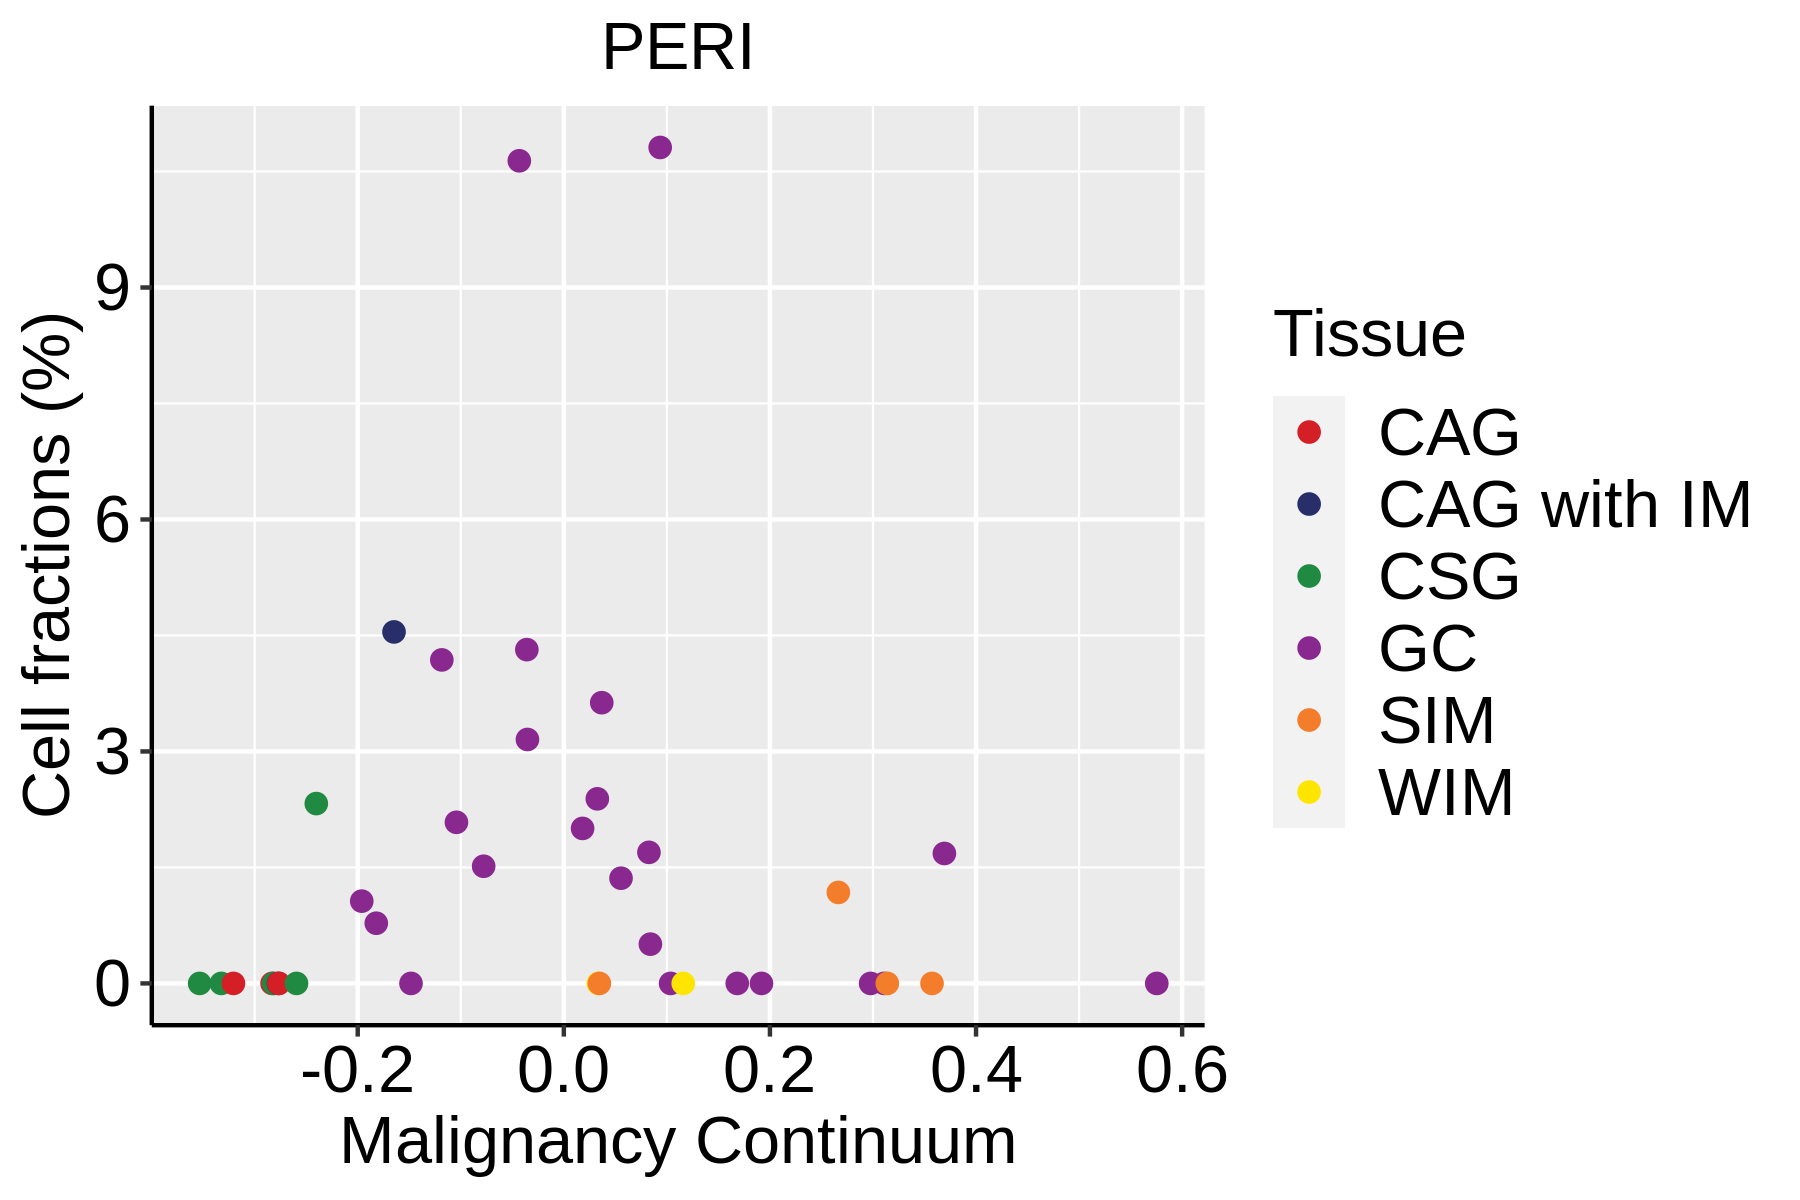
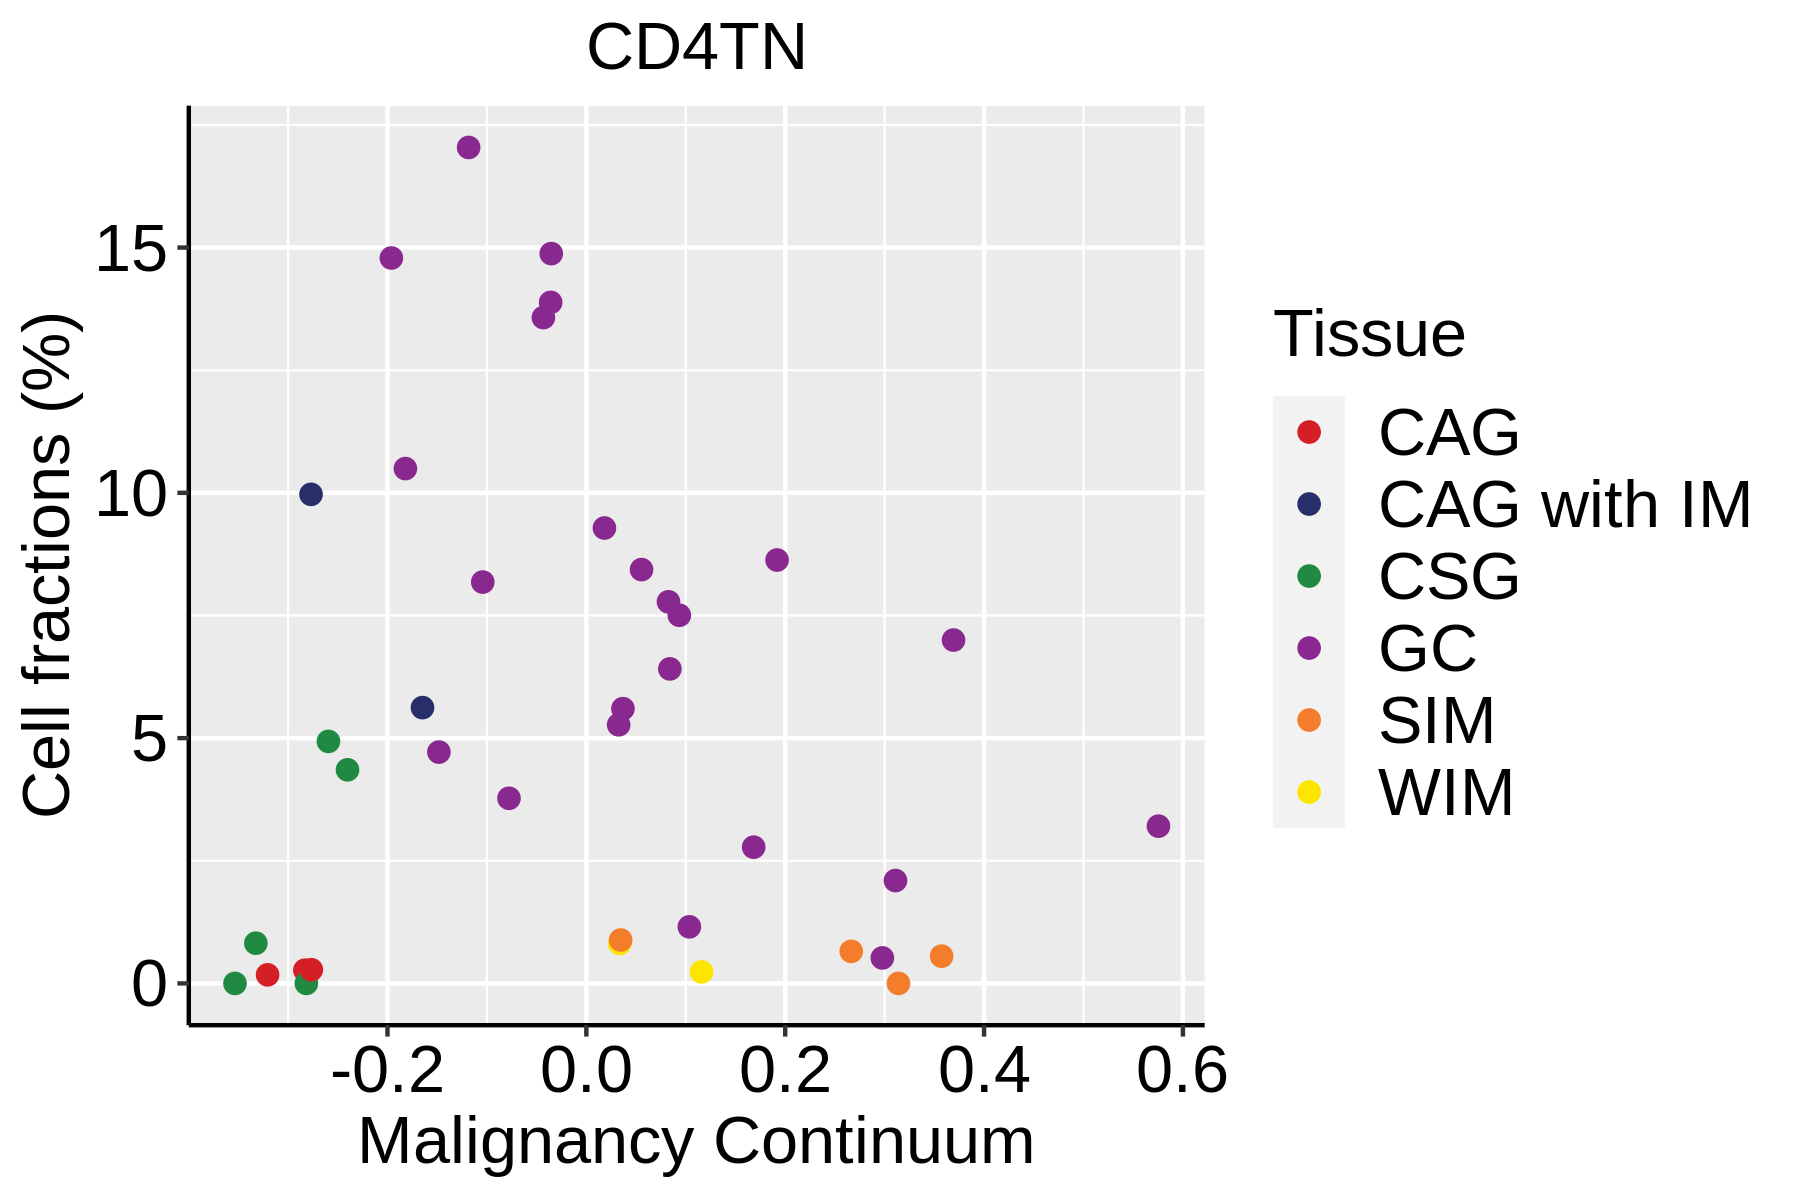
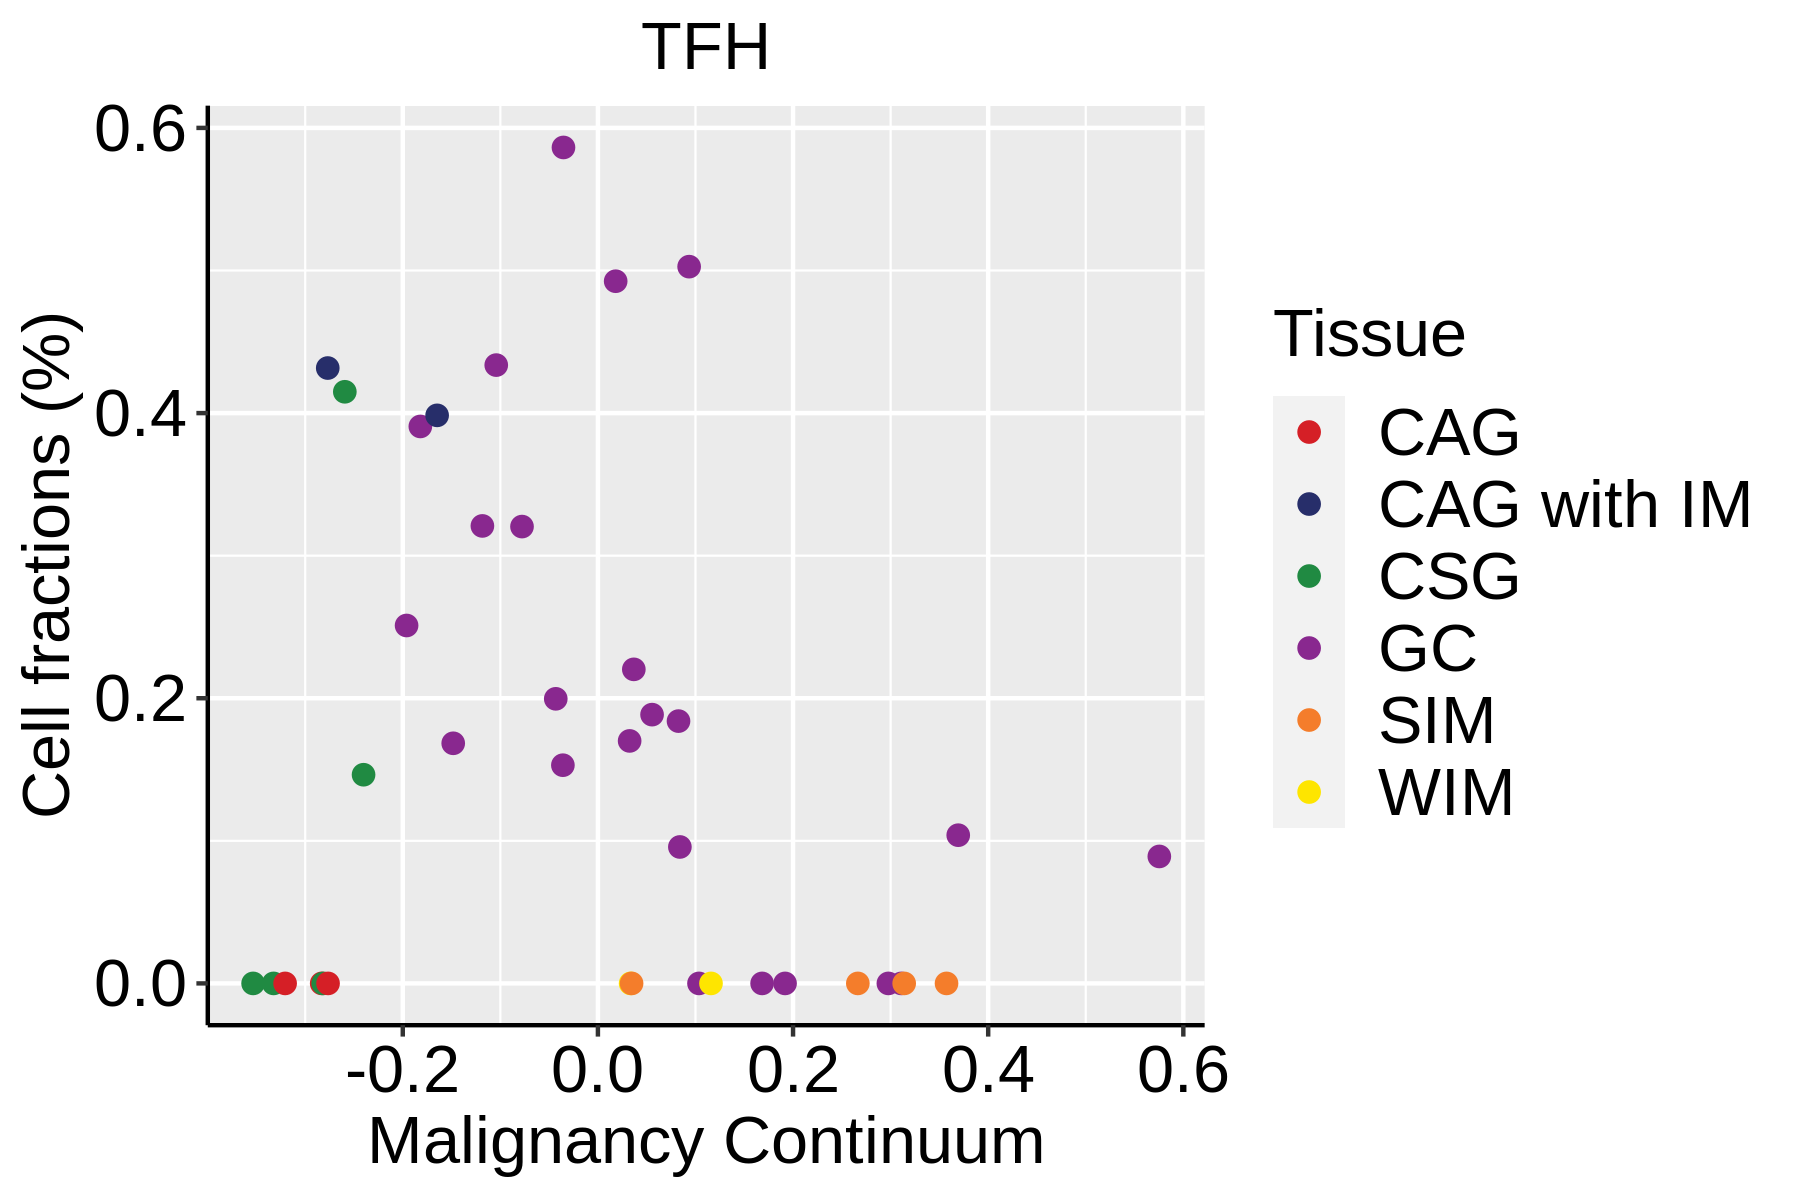
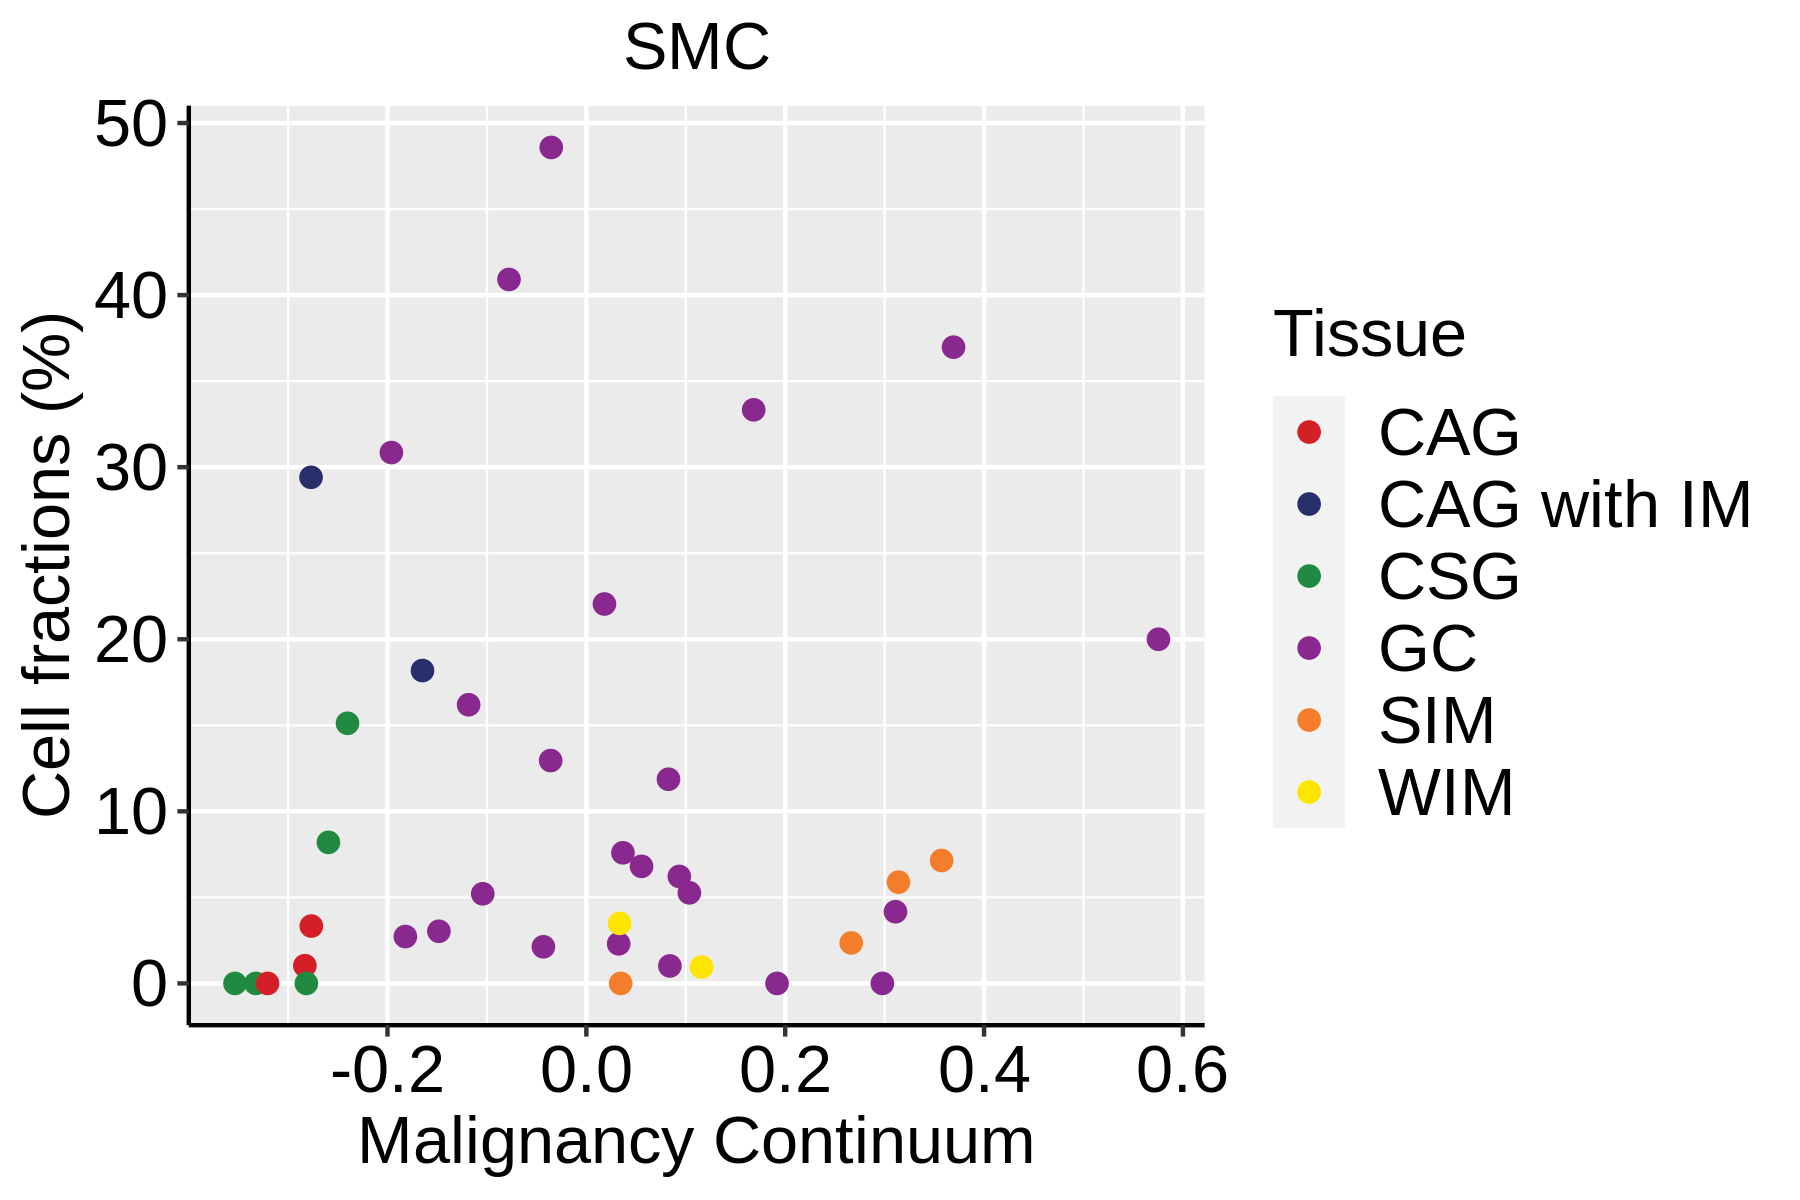
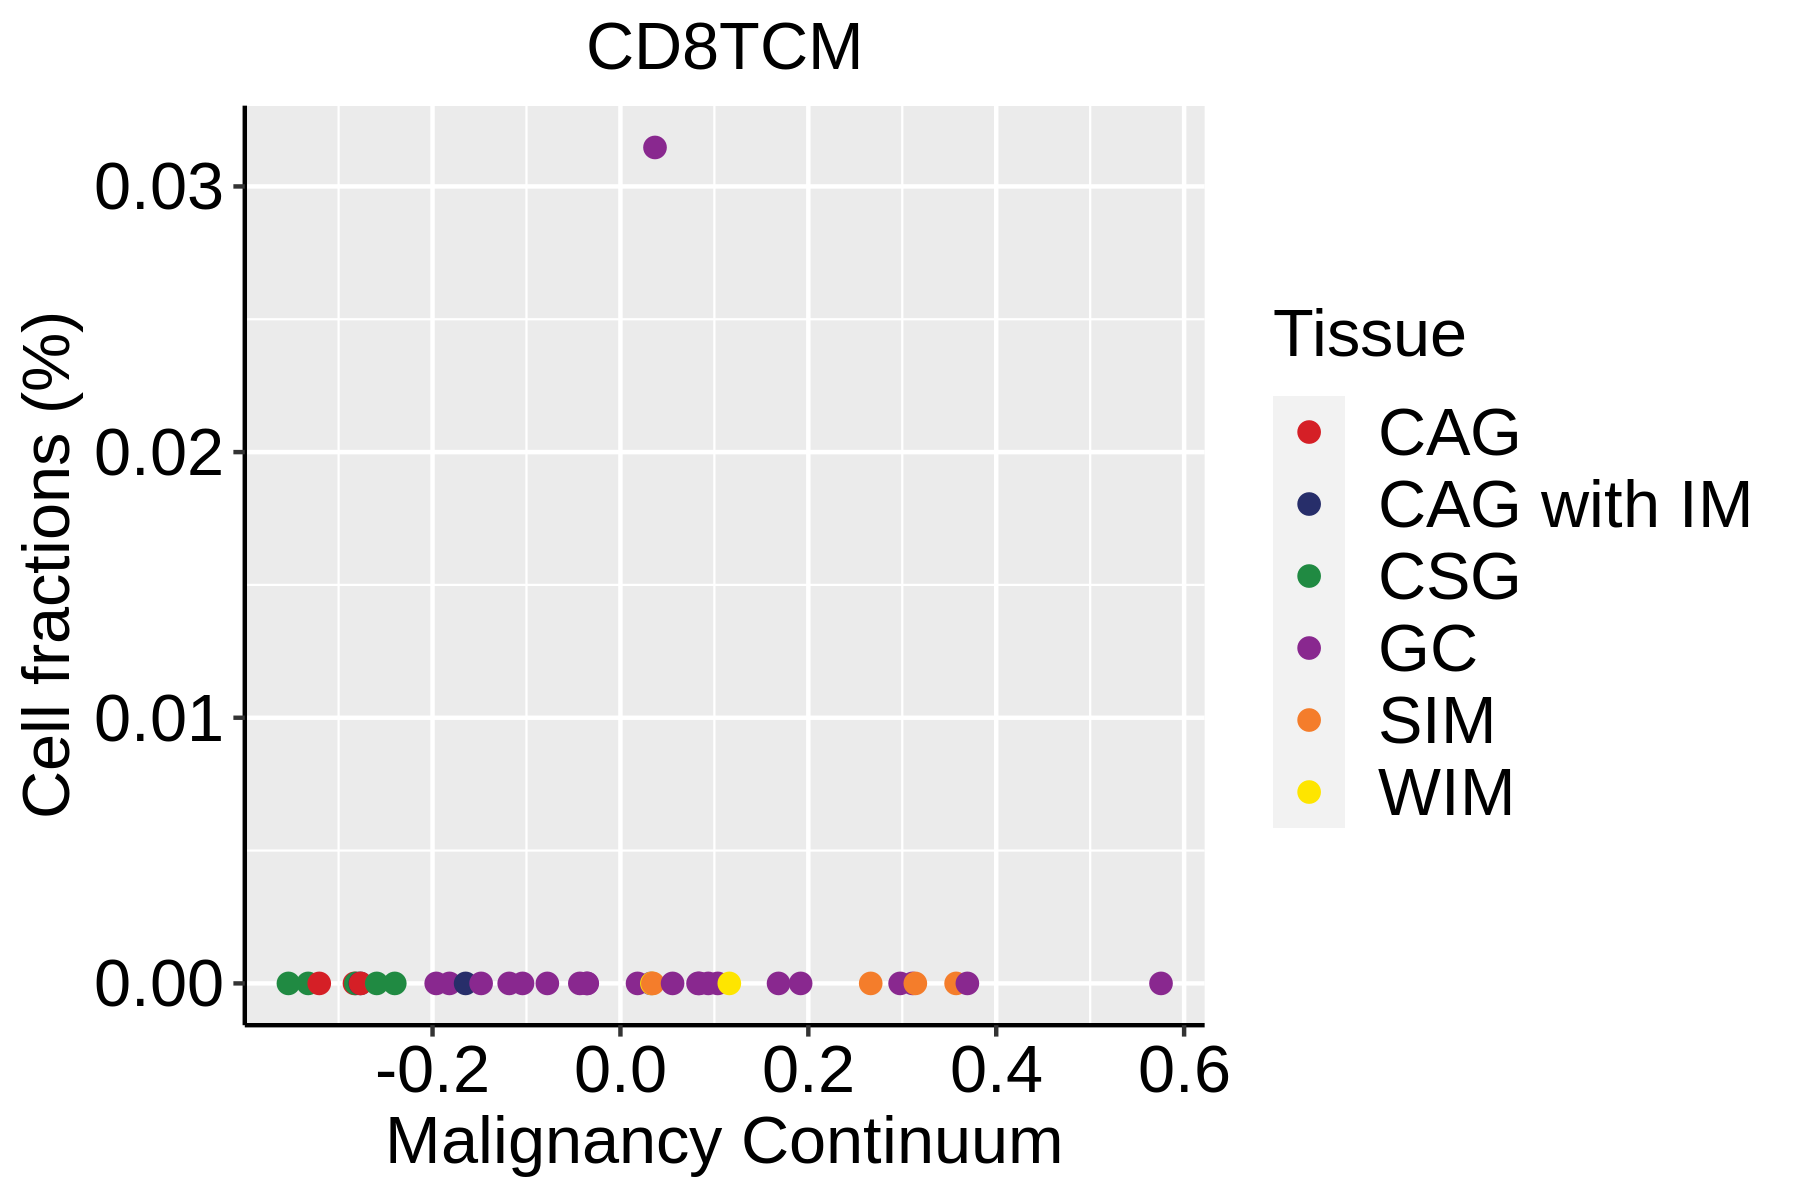
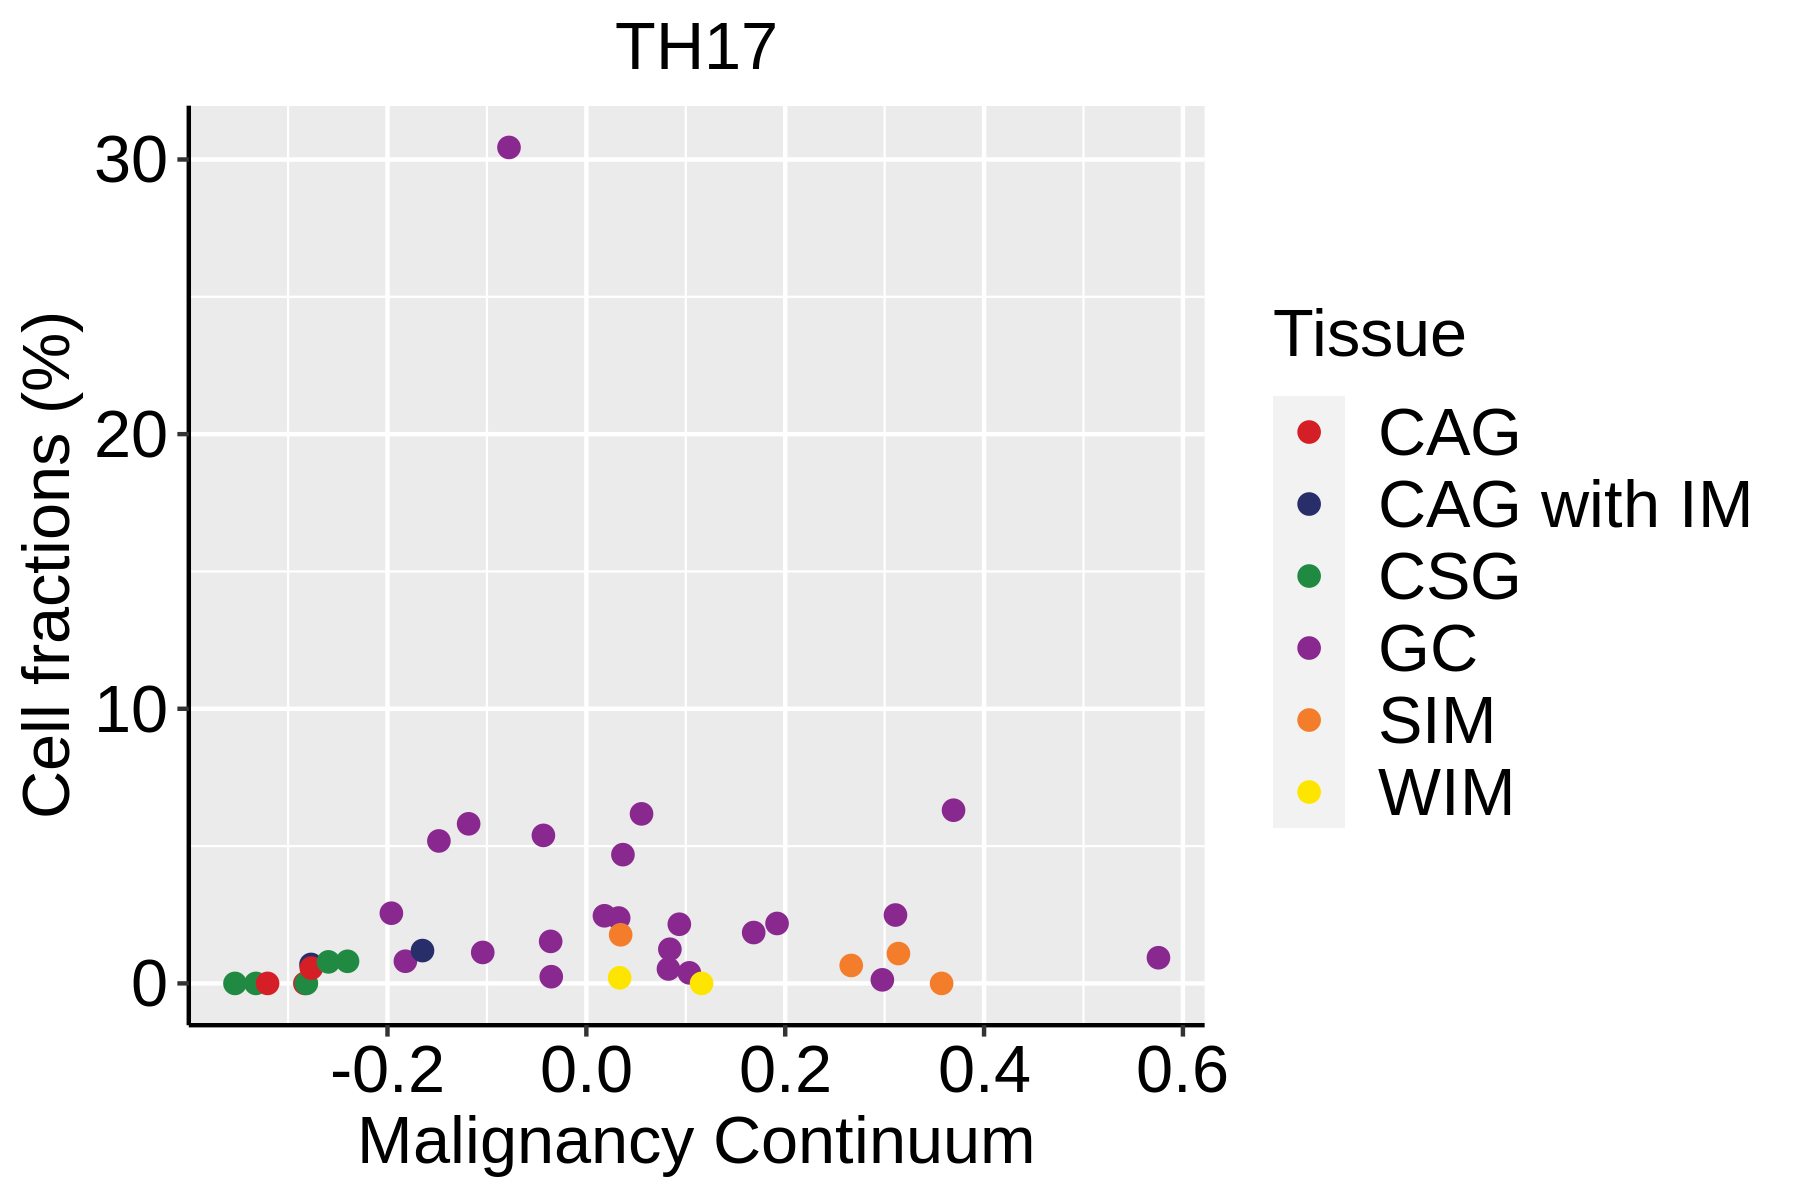
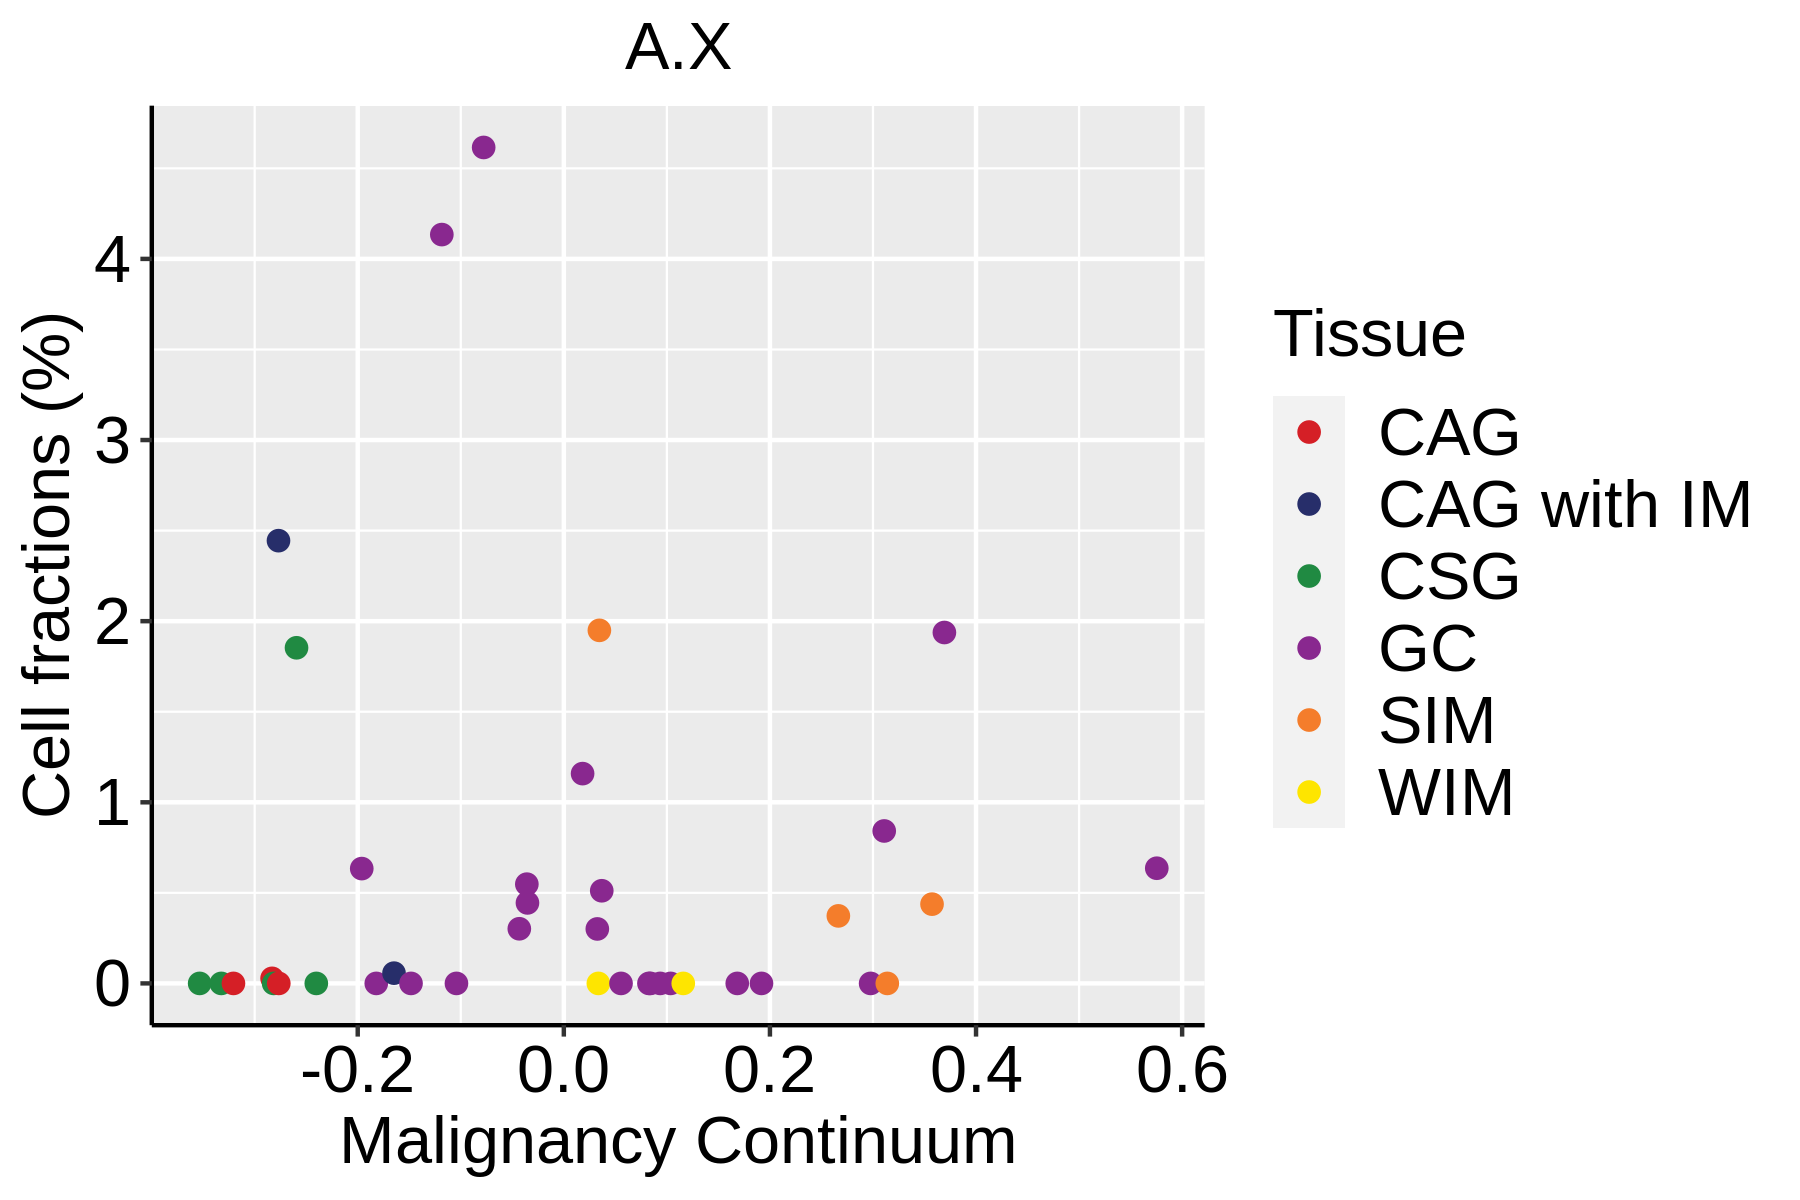
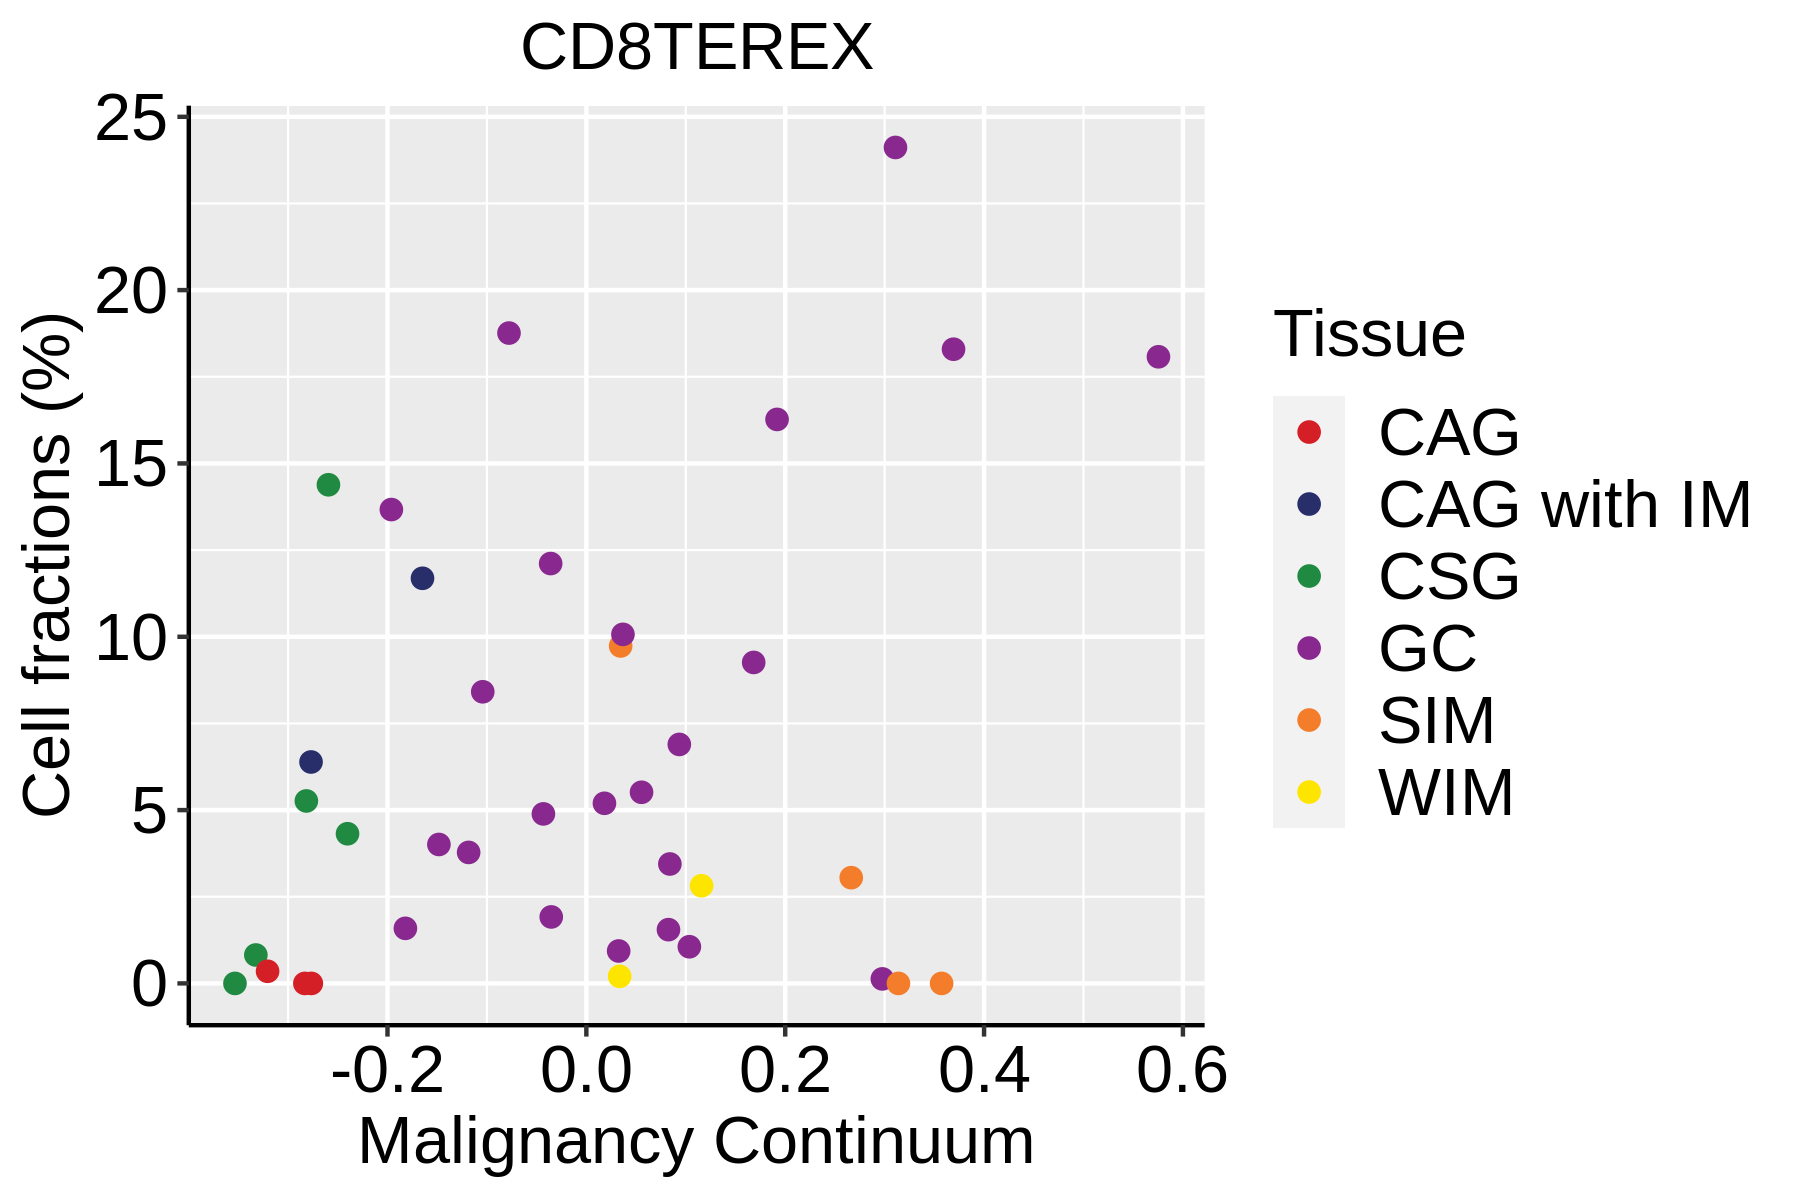
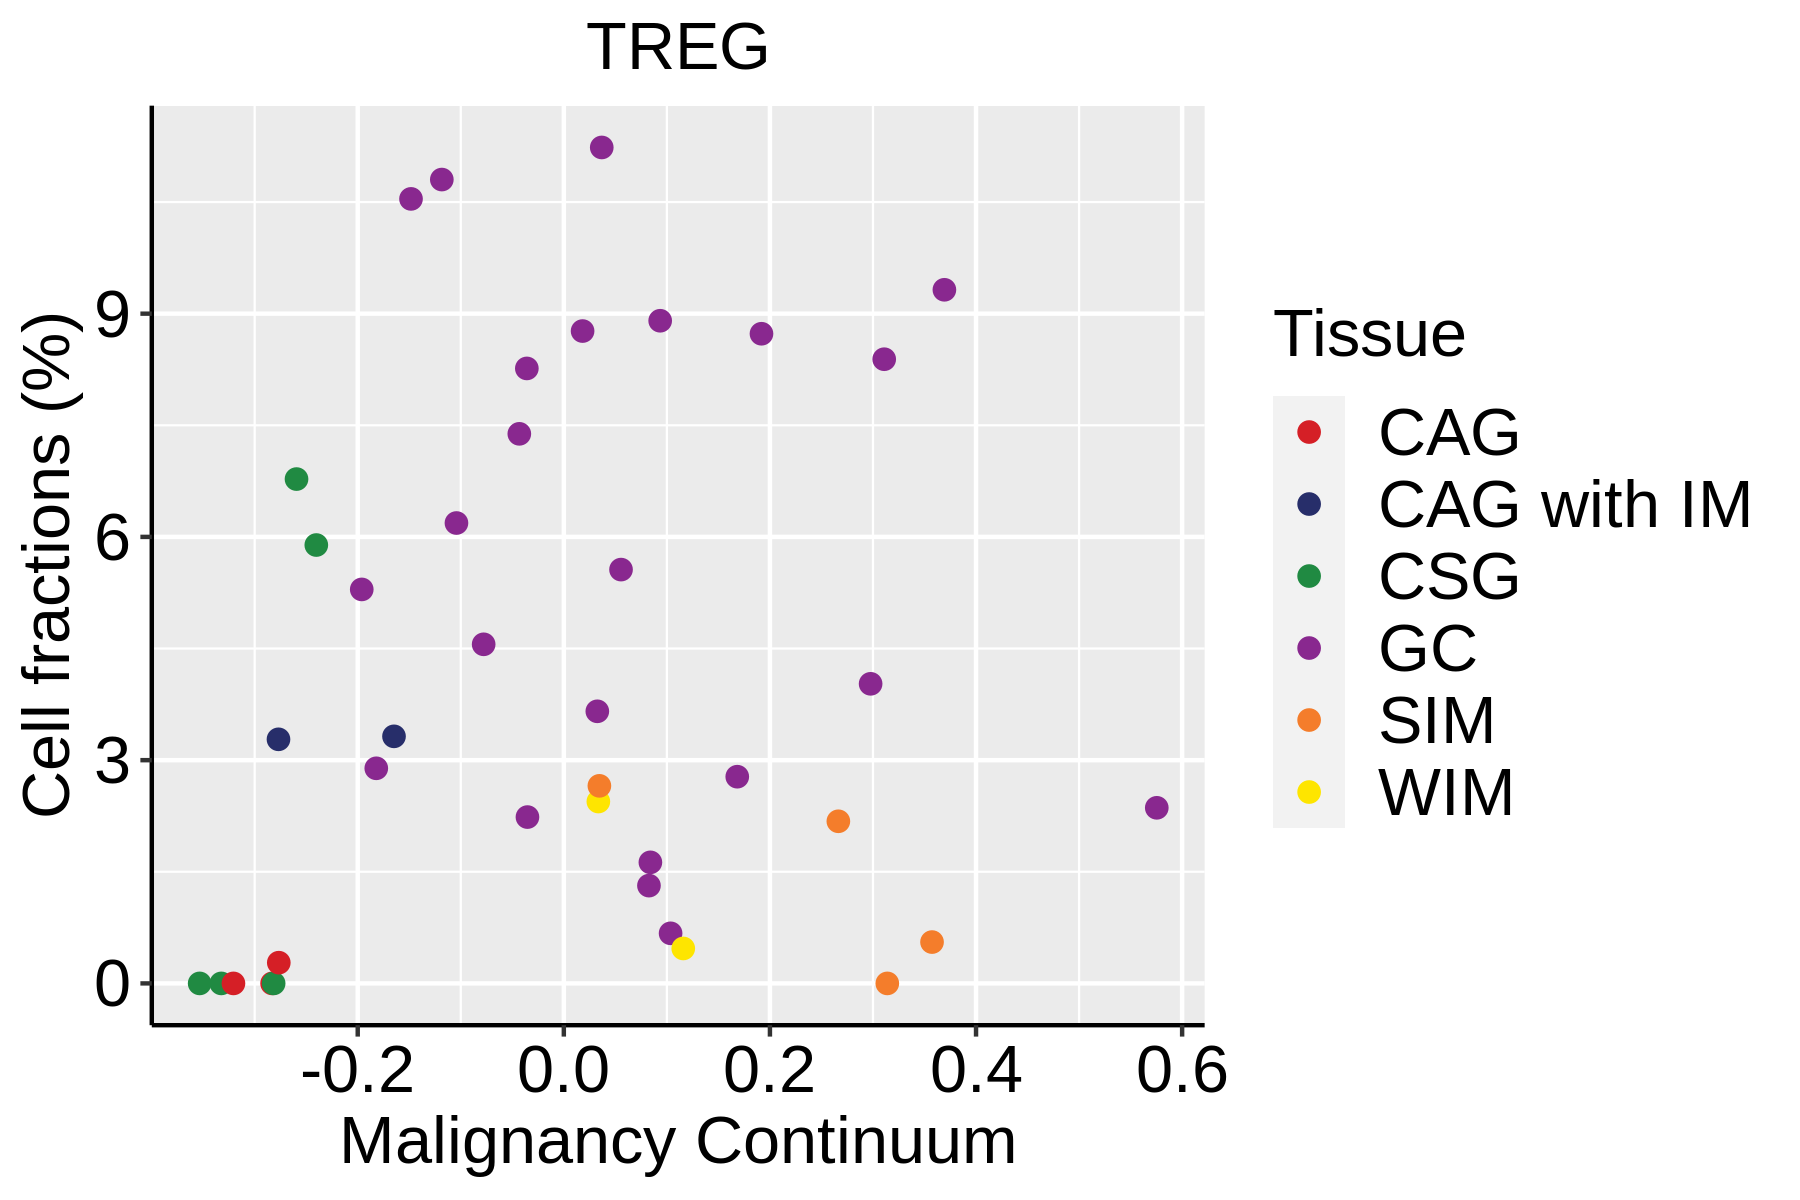
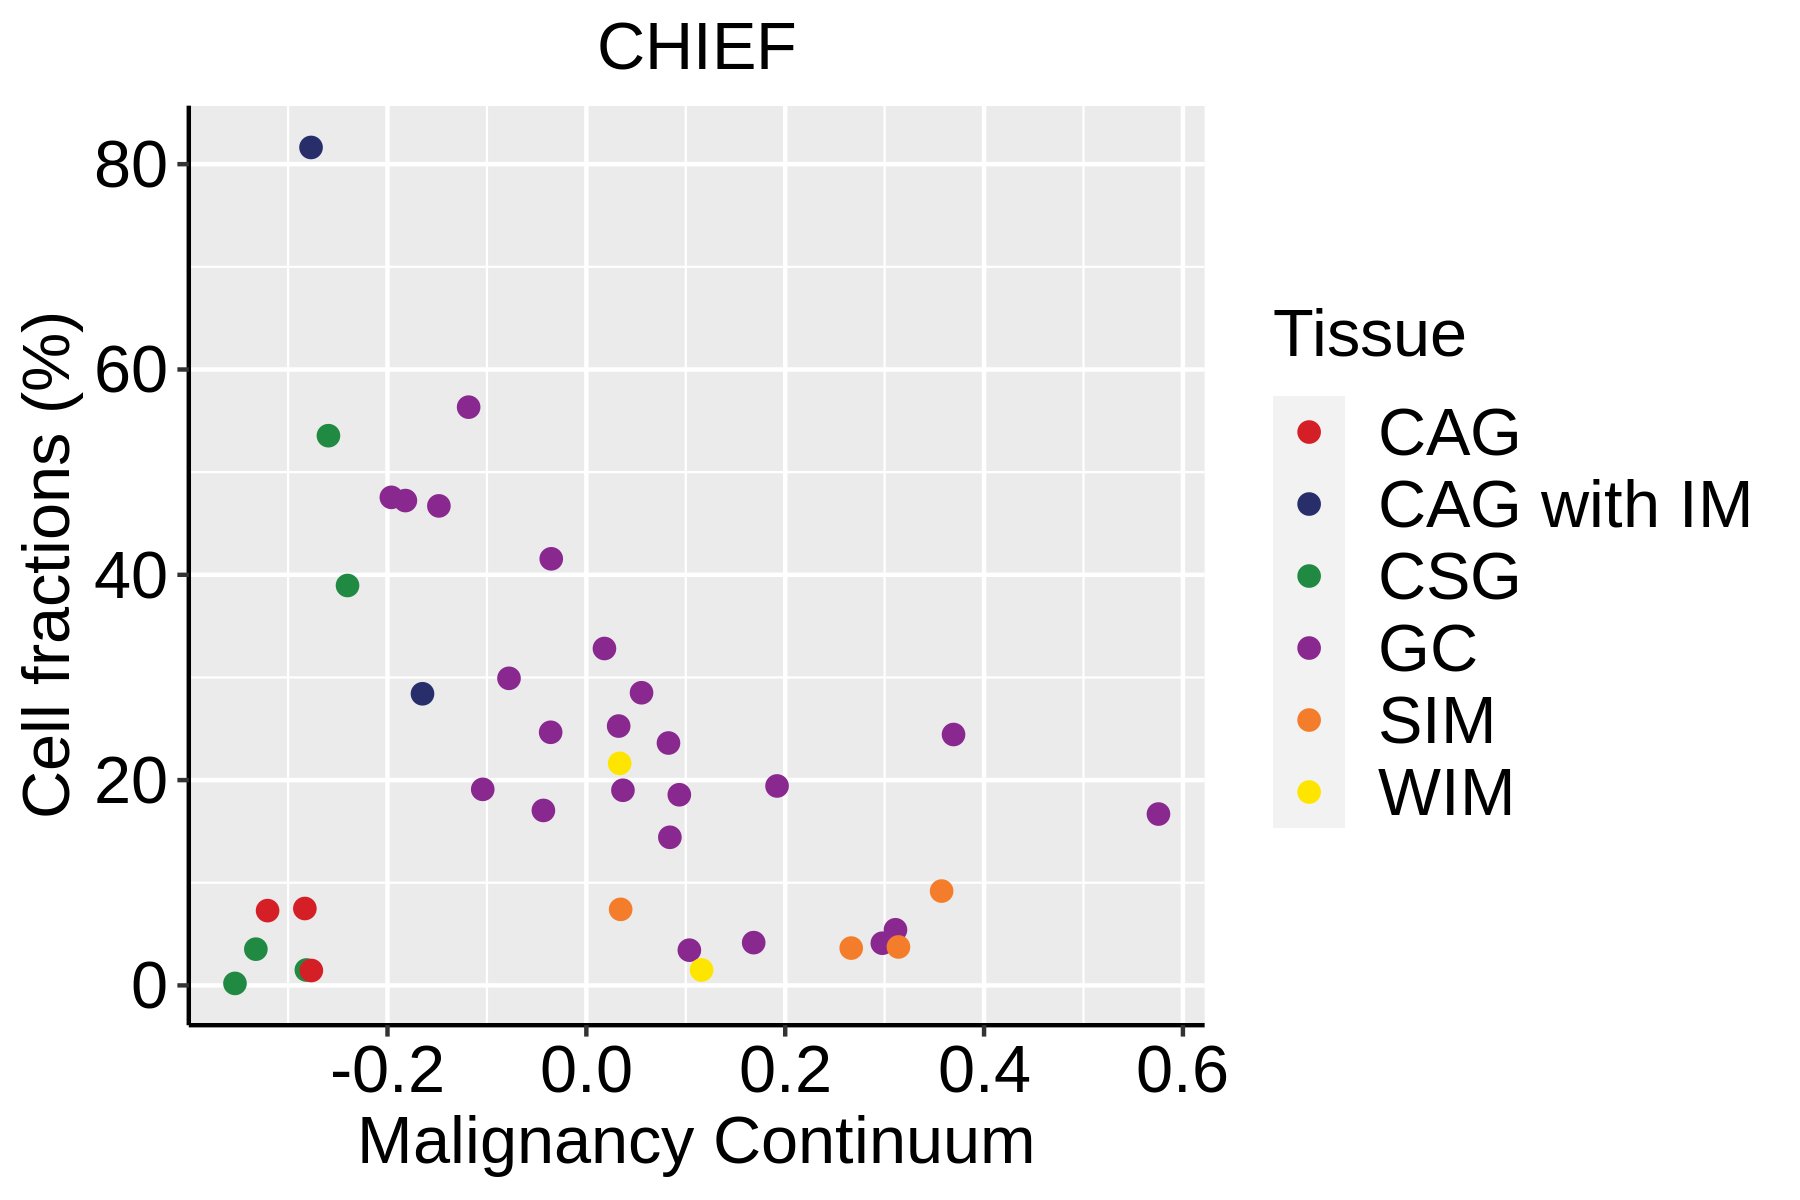
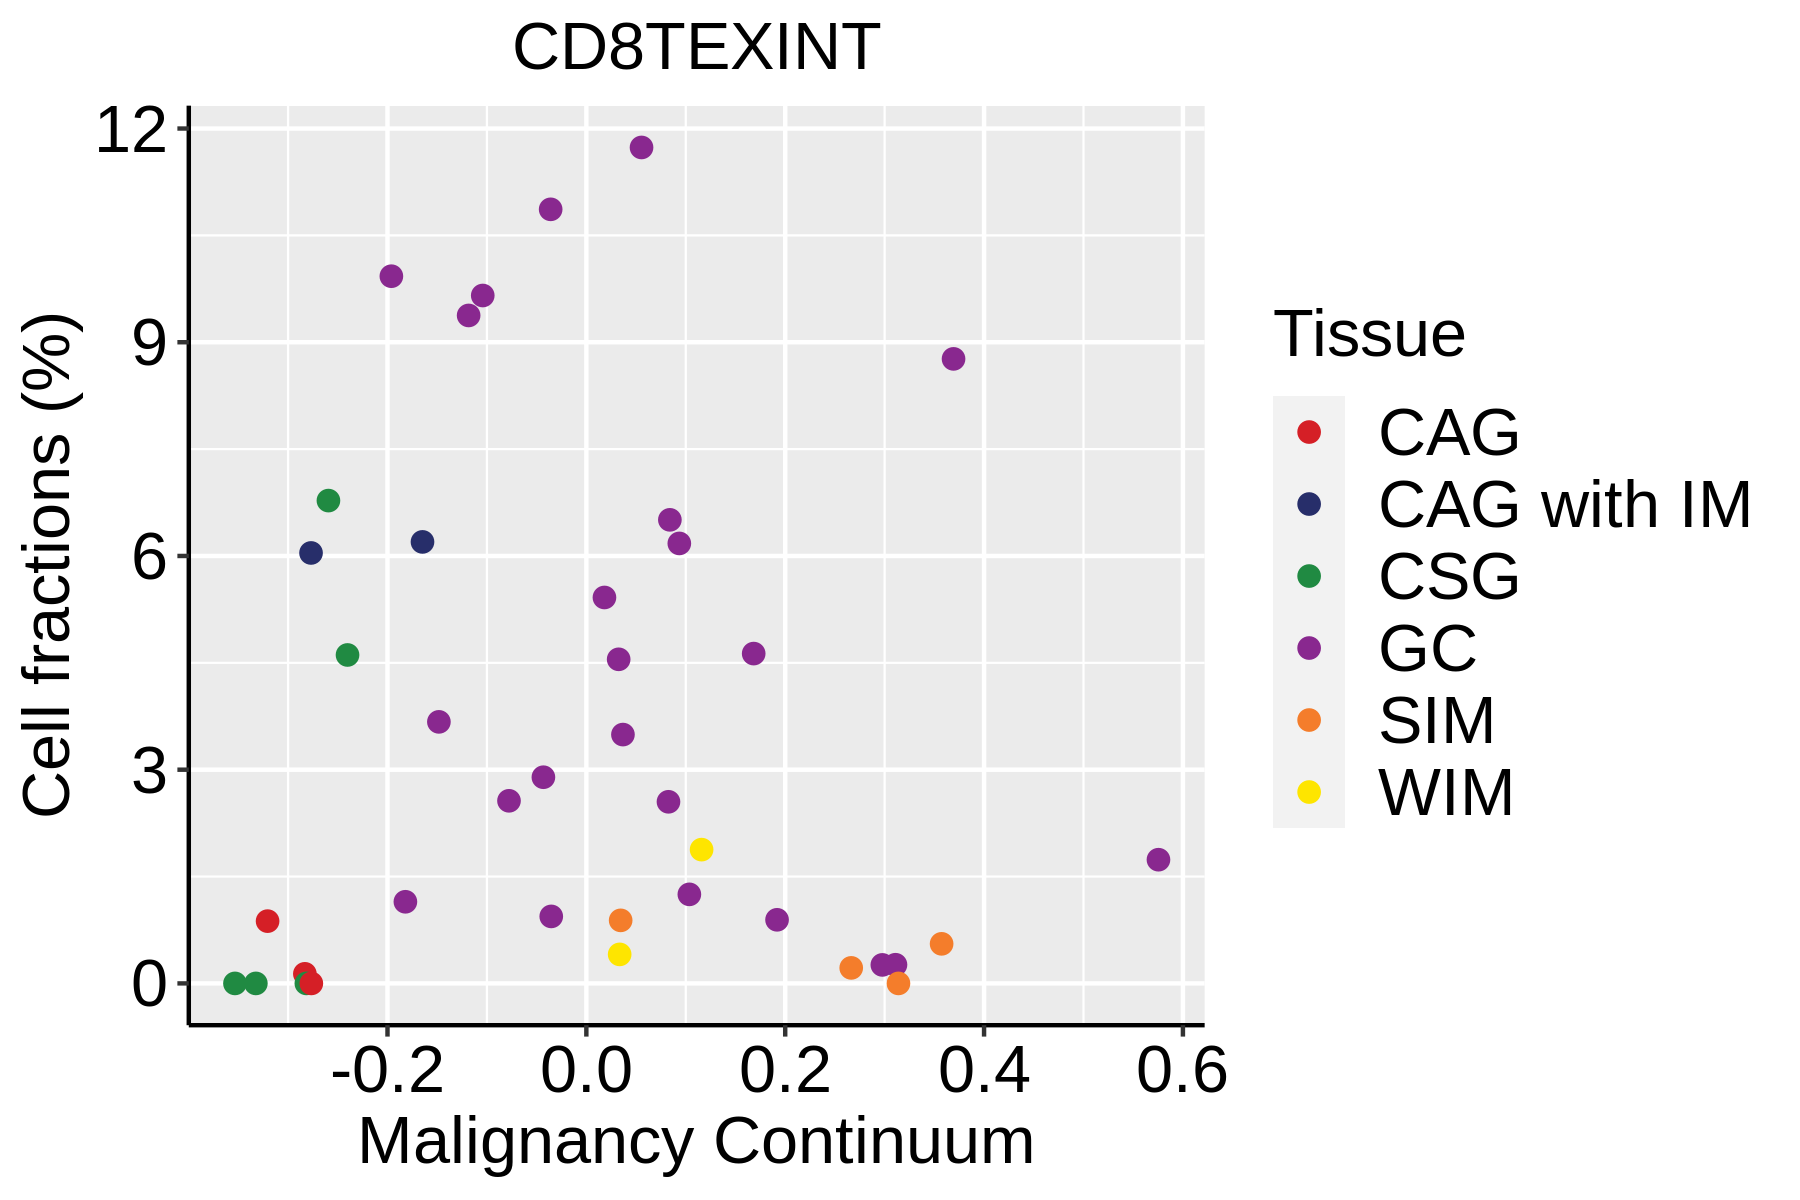
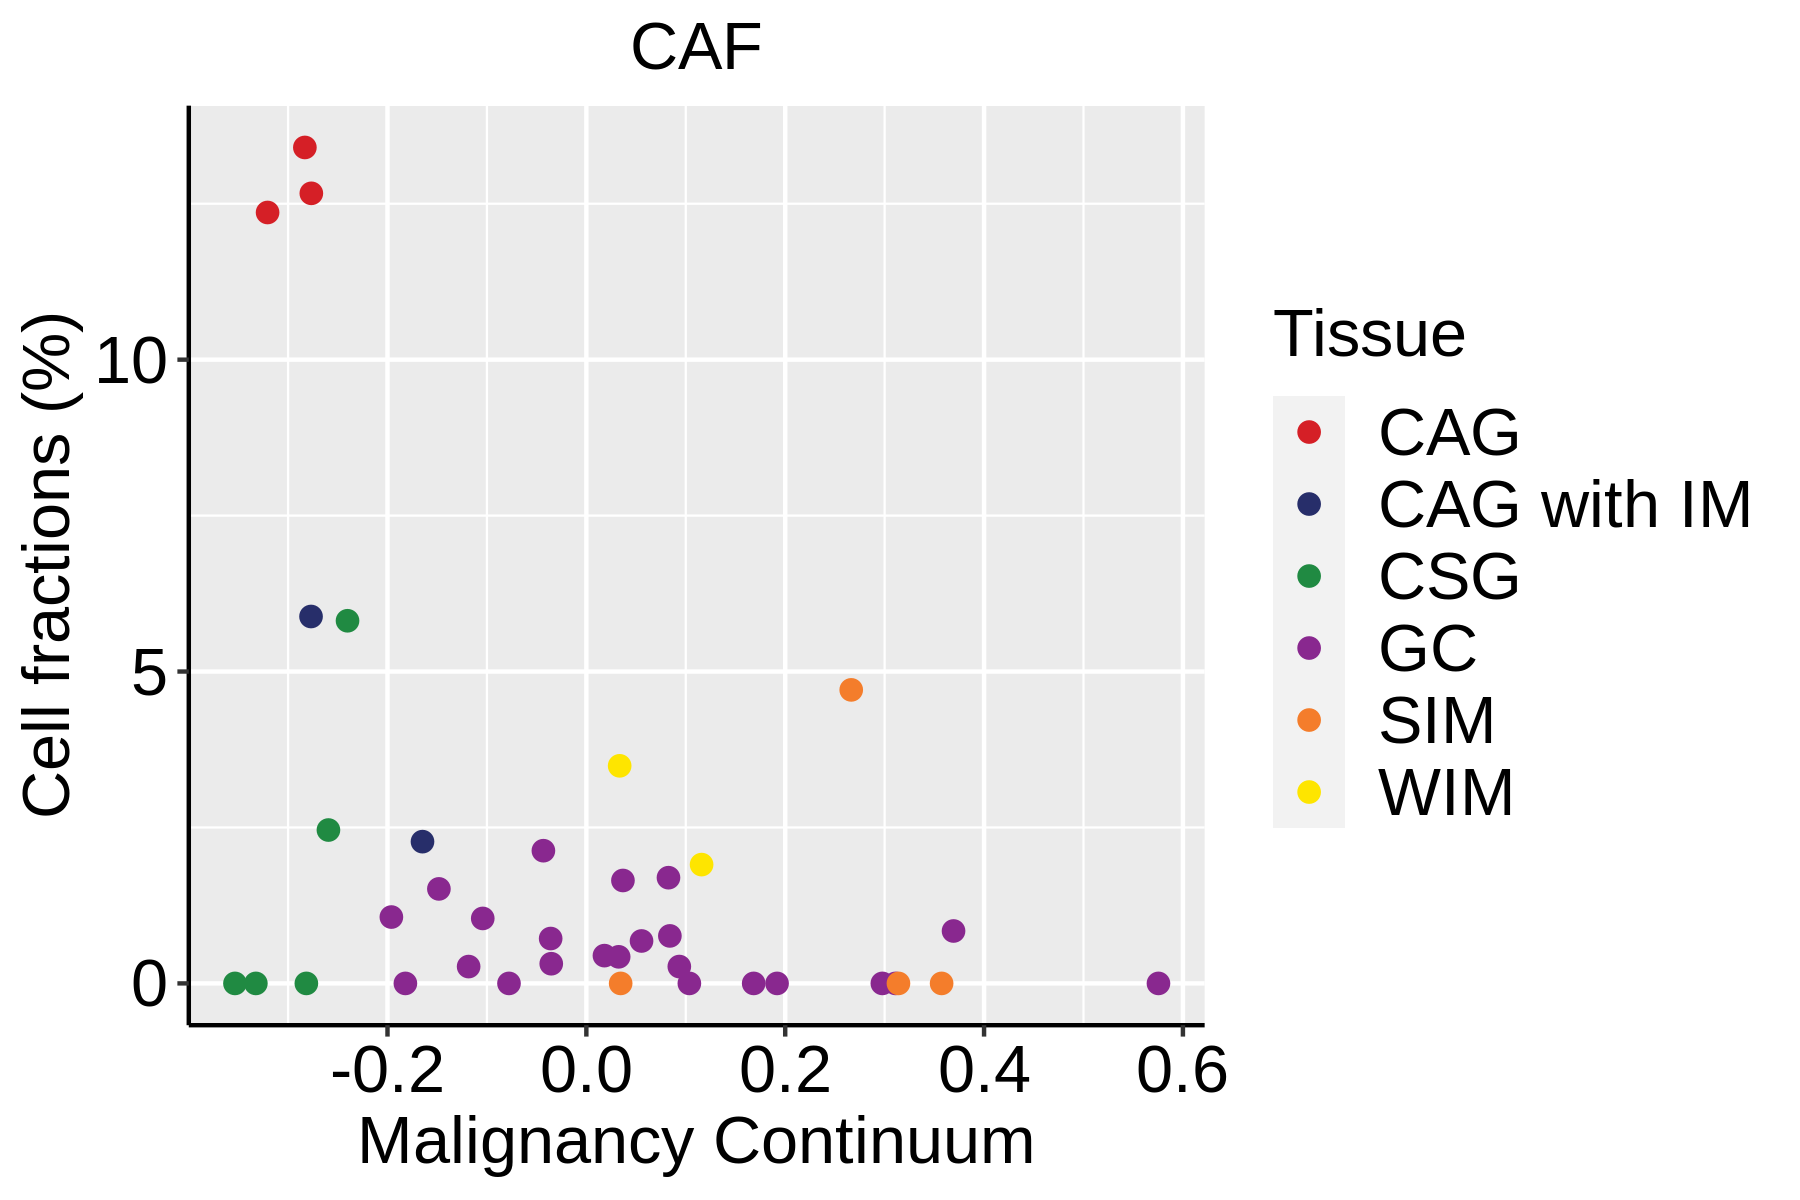
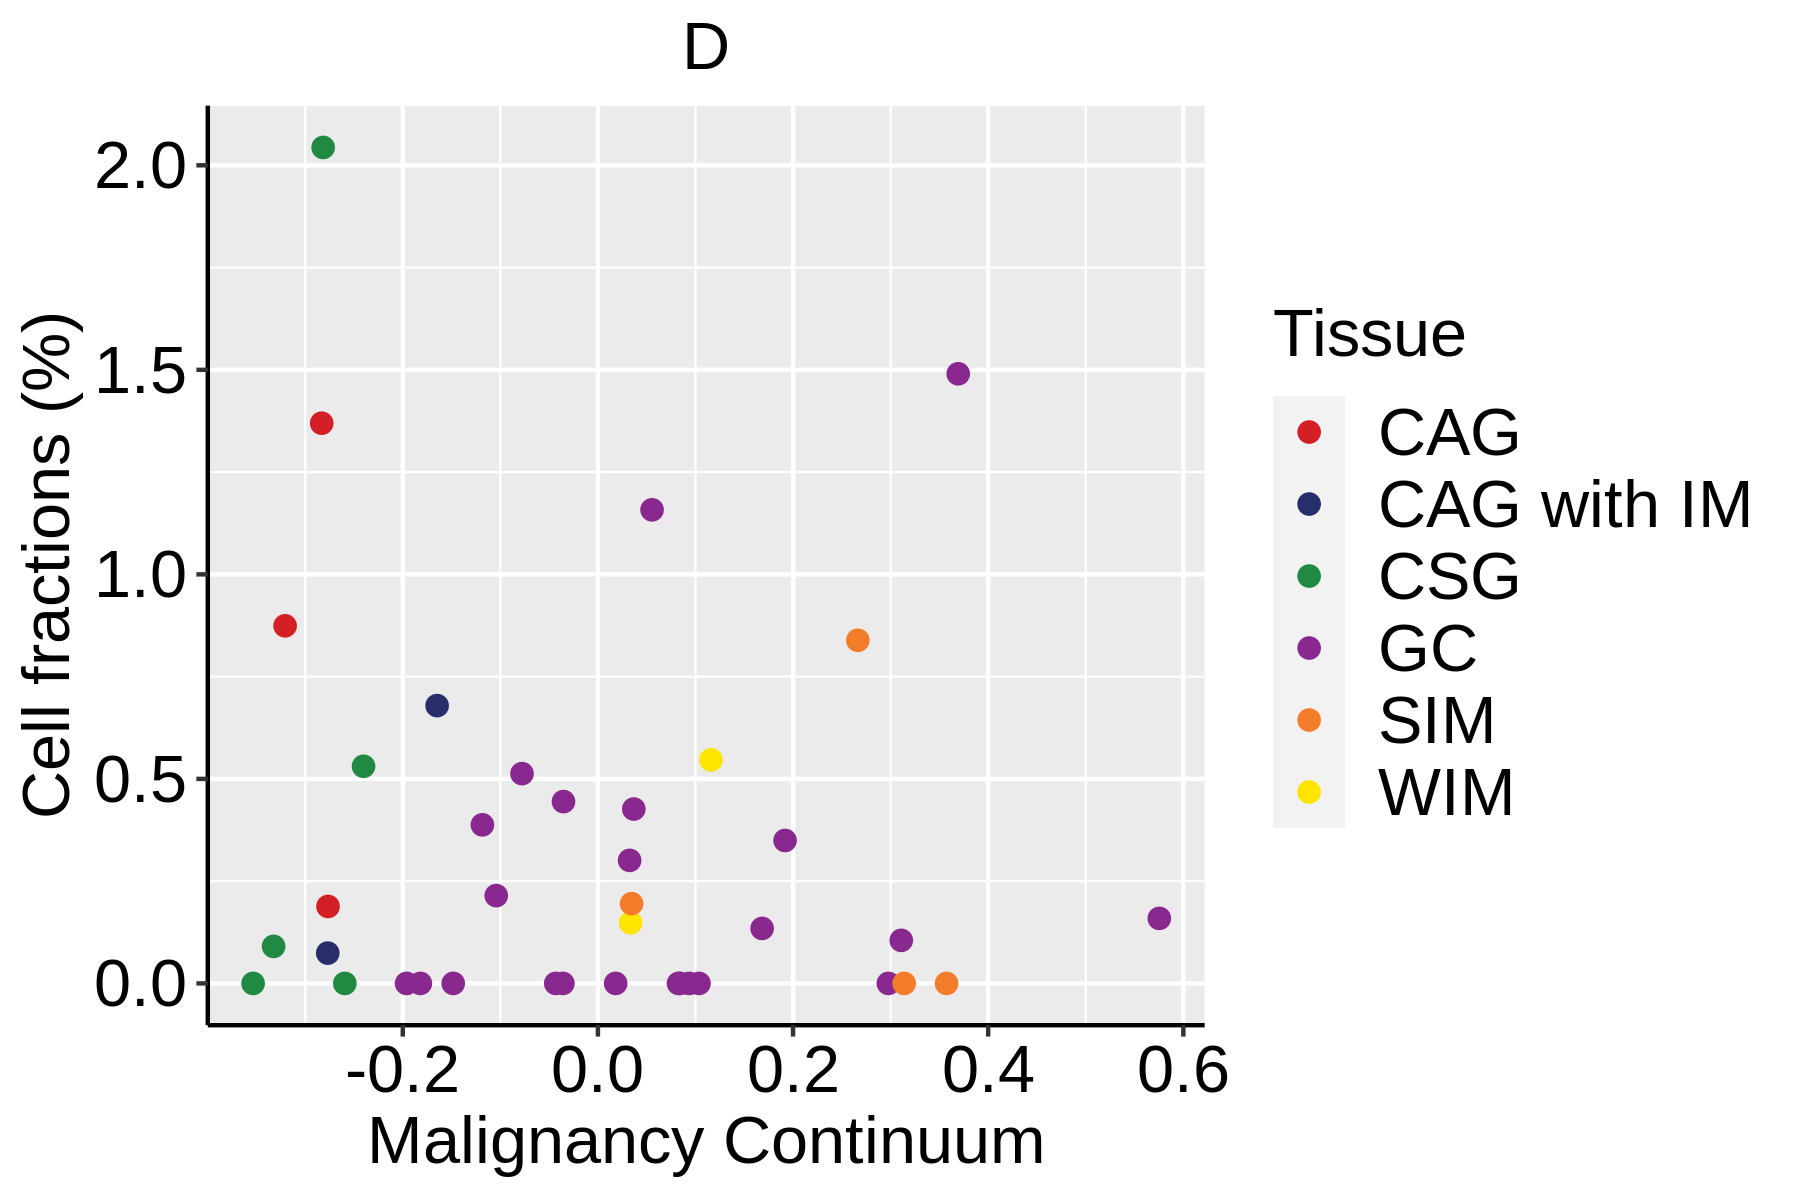
Fraction of cell type in each scRNA-seq sample plotted against position of the sample in the malignancy continuum for all cell types in the selected tissue. Samples are colored based on if they are derived from different Disease States.Fraction of cell type in each scRNA-seq sample plotted against position of the sample in the malignancy continuum for all cell types in the selected tissue. Samples are colored based on if they are derived from different Disease States.Fraction of cell type in each scRNA-seq sample plotted against position of the sample in the malignancy continuum for all cell types in the selected tissue. Samples are colored based on if they are derived from different Disease States.
∗Fraction of cell type in each scRNA-seq sample plotted against position of the sample in the malignancy continuum for all cell types in Stomach tissue. Samples are colored based on if they are derived from different Disease States. Cell fractions are computed by dividing the number of cells of a given cell type by the total number of cells in the compartment (epithelial versus immune versus stromal).
Page: 1 2 3 

Top

Cell lineage trajectory inference

Disease StateEpitheliaImmuneStromal
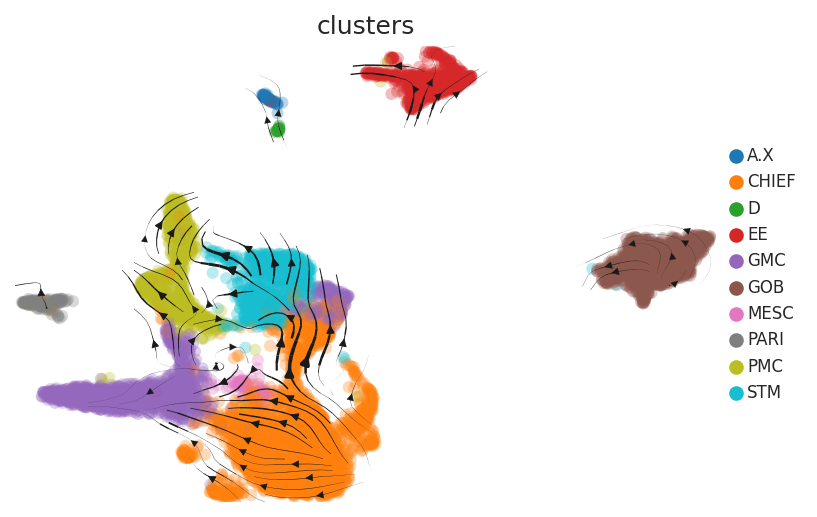
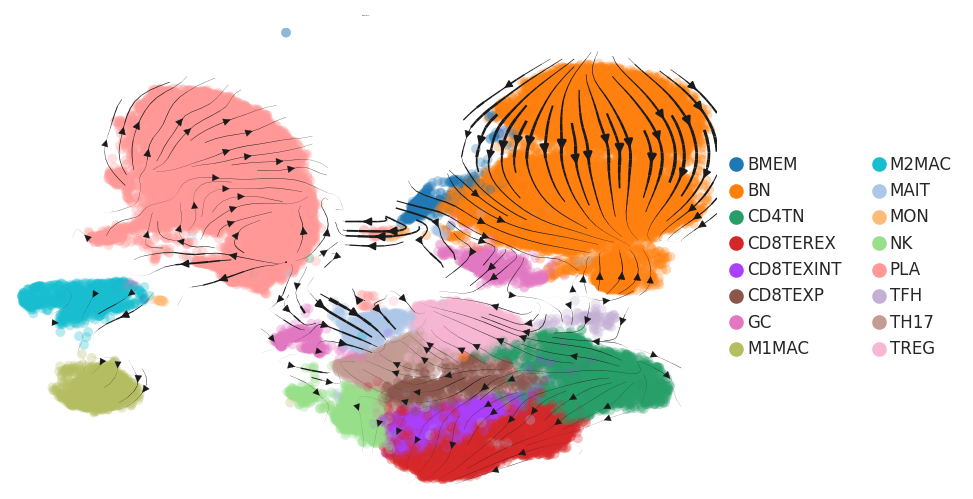
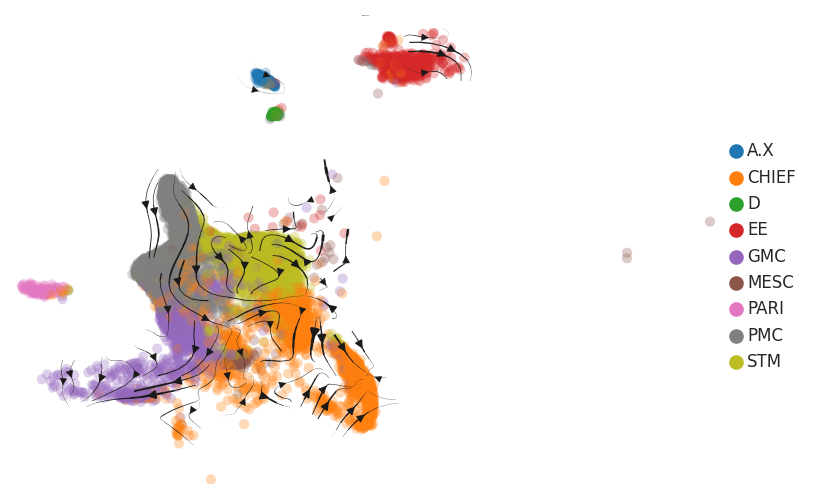
HealthyTrajectory analysis of cells of epithelial compartment in Healthy-derived samples of Stomach tissue by using scvelo package in Python.Trajectory analysis of cells of immune compartment in ADJ-derived samples of Stomach tissue by using scvelo package in Python.Trajectory analysis of cells of stromal compartment in ADJ-derived samples of Stomach tissue by using scvelo package in Python.
ADJTrajectory analysis of cells of epithelial compartment in ADJ-derived samples of Stomach tissue by using scvelo package in Python.
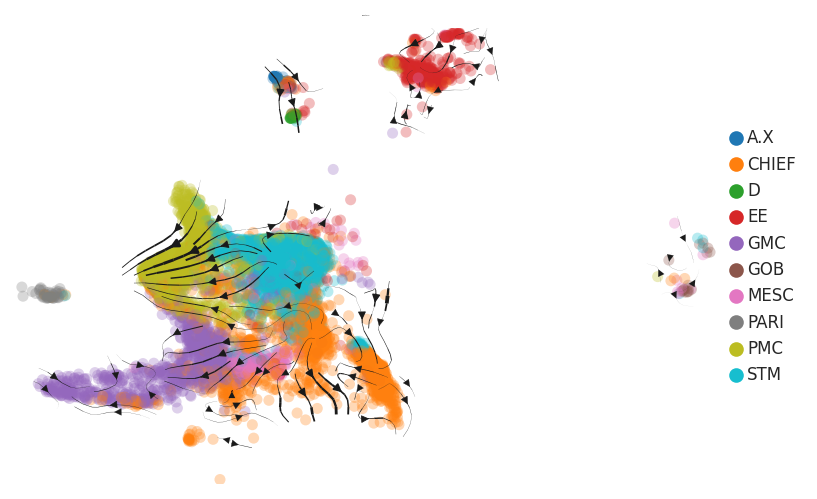
PrecancerTrajectory analysis of cells of epithelial compartment in Precancer-derived samples of Stomach tissue by using scvelo package in Python.Trajectory analysis of cells of immune compartment in Precancer-derived samples of Stomach tissue by using scvelo package in Python.Trajectory analysis of cells of stromal compartment in Precancer-derived samples of Stomach tissue by using scvelo package in Python.
GCTrajectory analysis of cells of epithelial compartment in GC-derived samples of Stomach tissue by using scvelo package in Python.Trajectory analysis of cells of immune compartment in GC-derived samples of Stomach tissue by using scvelo package in Python.Trajectory analysis of cells of stromal compartment in GC-derived samples of Stomach tissue by using scvelo package in Python.
∗RNA velocity maps for epithelial, immune and stromal compartments of Stomach tissue with different disease states.

Top

TF regulatory network analysis

Disease StateEpitheliaImmuneStromal
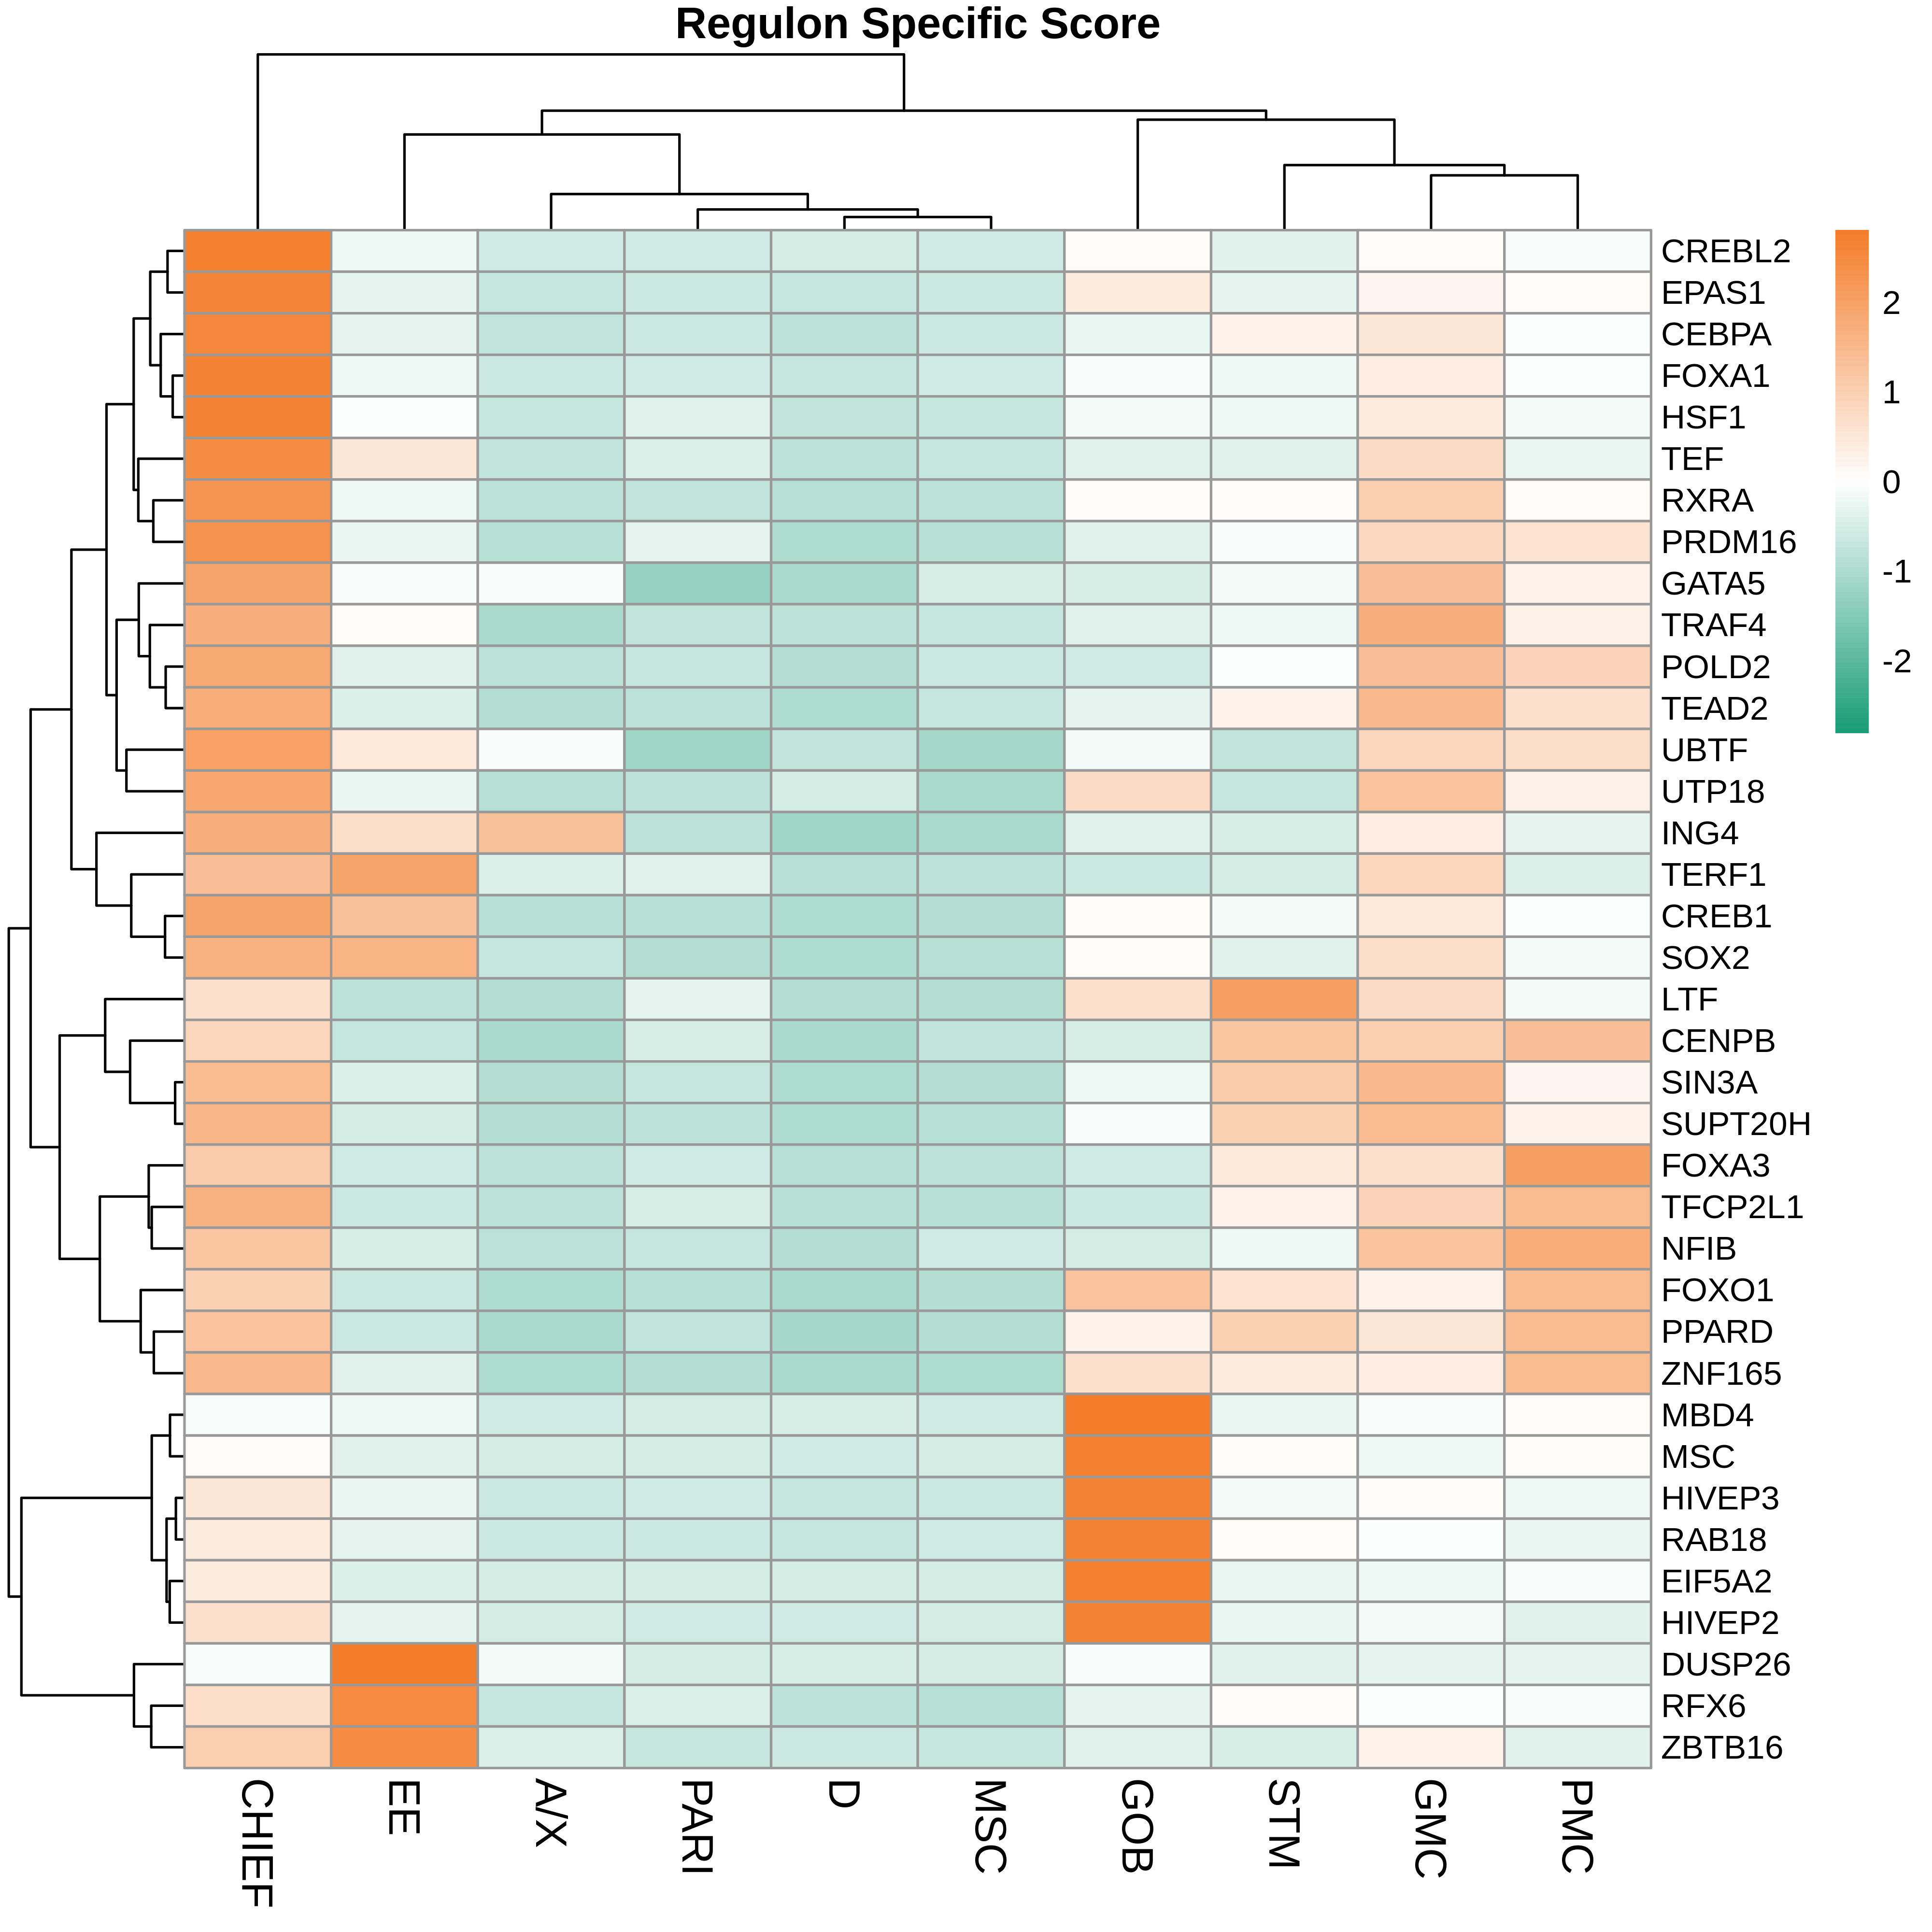
HealthyHeatmap representation of significantly different TFs among all cell types of epithelial compartment in Healthy-derived samples of Stomach tissue by comparing their average AUC by using pySCENIC in Python.Heatmap representation of significantly different TFs among all cell types of immune compartment in Healthy-derived samples of Stomach tissue by comparing their average AUC by using pySCENIC in Python.Heatmap representation of significantly different TFs among all cell types of stromal compartment in Healthy-derived samples of Stomach tissue by comparing their average AUC by using pySCENIC in Python.
TF target networkTF target networkTF target network
ADJHeatmap representation of significantly different TFs among all cell types of epithelial compartment in ADJ-derived samples of Stomach tissue by comparing their average AUC by using pySCENIC in Python.Heatmap representation of significantly different TFs among all cell types of immune compartment in ADJ-derived samples of Stomach tissue by comparing their average AUC by using pySCENIC in Python.Heatmap representation of significantly different TFs among all cell types of stromal compartment in ADJ-derived samples of Stomach tissue by comparing their average AUC by using pySCENIC in Python.
TF target networkTF target networkTF target network
PrecancerHeatmap representation of significantly different TFs among all cell types of epithelial compartment in Precancer-derived samples of Stomach tissue by comparing their average AUC by using pySCENIC in Python.Heatmap representation of significantly different TFs among all cell types of immune compartment in Precancer-derived samples of Stomach tissue by comparing their average AUC by using pySCENIC in Python.Heatmap representation of significantly different TFs among all cell types of stromal compartment in Precancer-derived samples of Stomach tissue by comparing their average AUC by using pySCENIC in Python.
TF target networkTF target networkTF target network
GCHeatmap representation of significantly different TFs among all cell types of epithelial compartment in GC-derived samples of Stomach tissue by comparing their average AUC by using pySCENIC in Python.Heatmap representation of significantly different TFs among all cell types of immune compartment in GC-derived samples of Stomach tissue by comparing their average AUC by using pySCENIC in Python.Heatmap representation of significantly different TFs among all cell types of stromal compartment in GC-derived samples of Stomach tissue by comparing their average AUC by using pySCENIC in Python.
TF target networkTF target networkTF target network
∗Heatmap: Heatmap representation of significantly different TFs among all cell types of epithelial compartment in Healthy-derived samples of Stomach tissue by comparing their average AUC by using pySCENIC in Python. Regulon specific score for each cell type is colored.
∗Network: TF target network created from Healthy-derived samples of Stomach tissue using Top 50 predicted target genes of each regulon. Edge lengths are the inferred TF-target weightings.

Top

Cell-cell interaction analysis

Disease StateCell TypeCircleSourceTarget
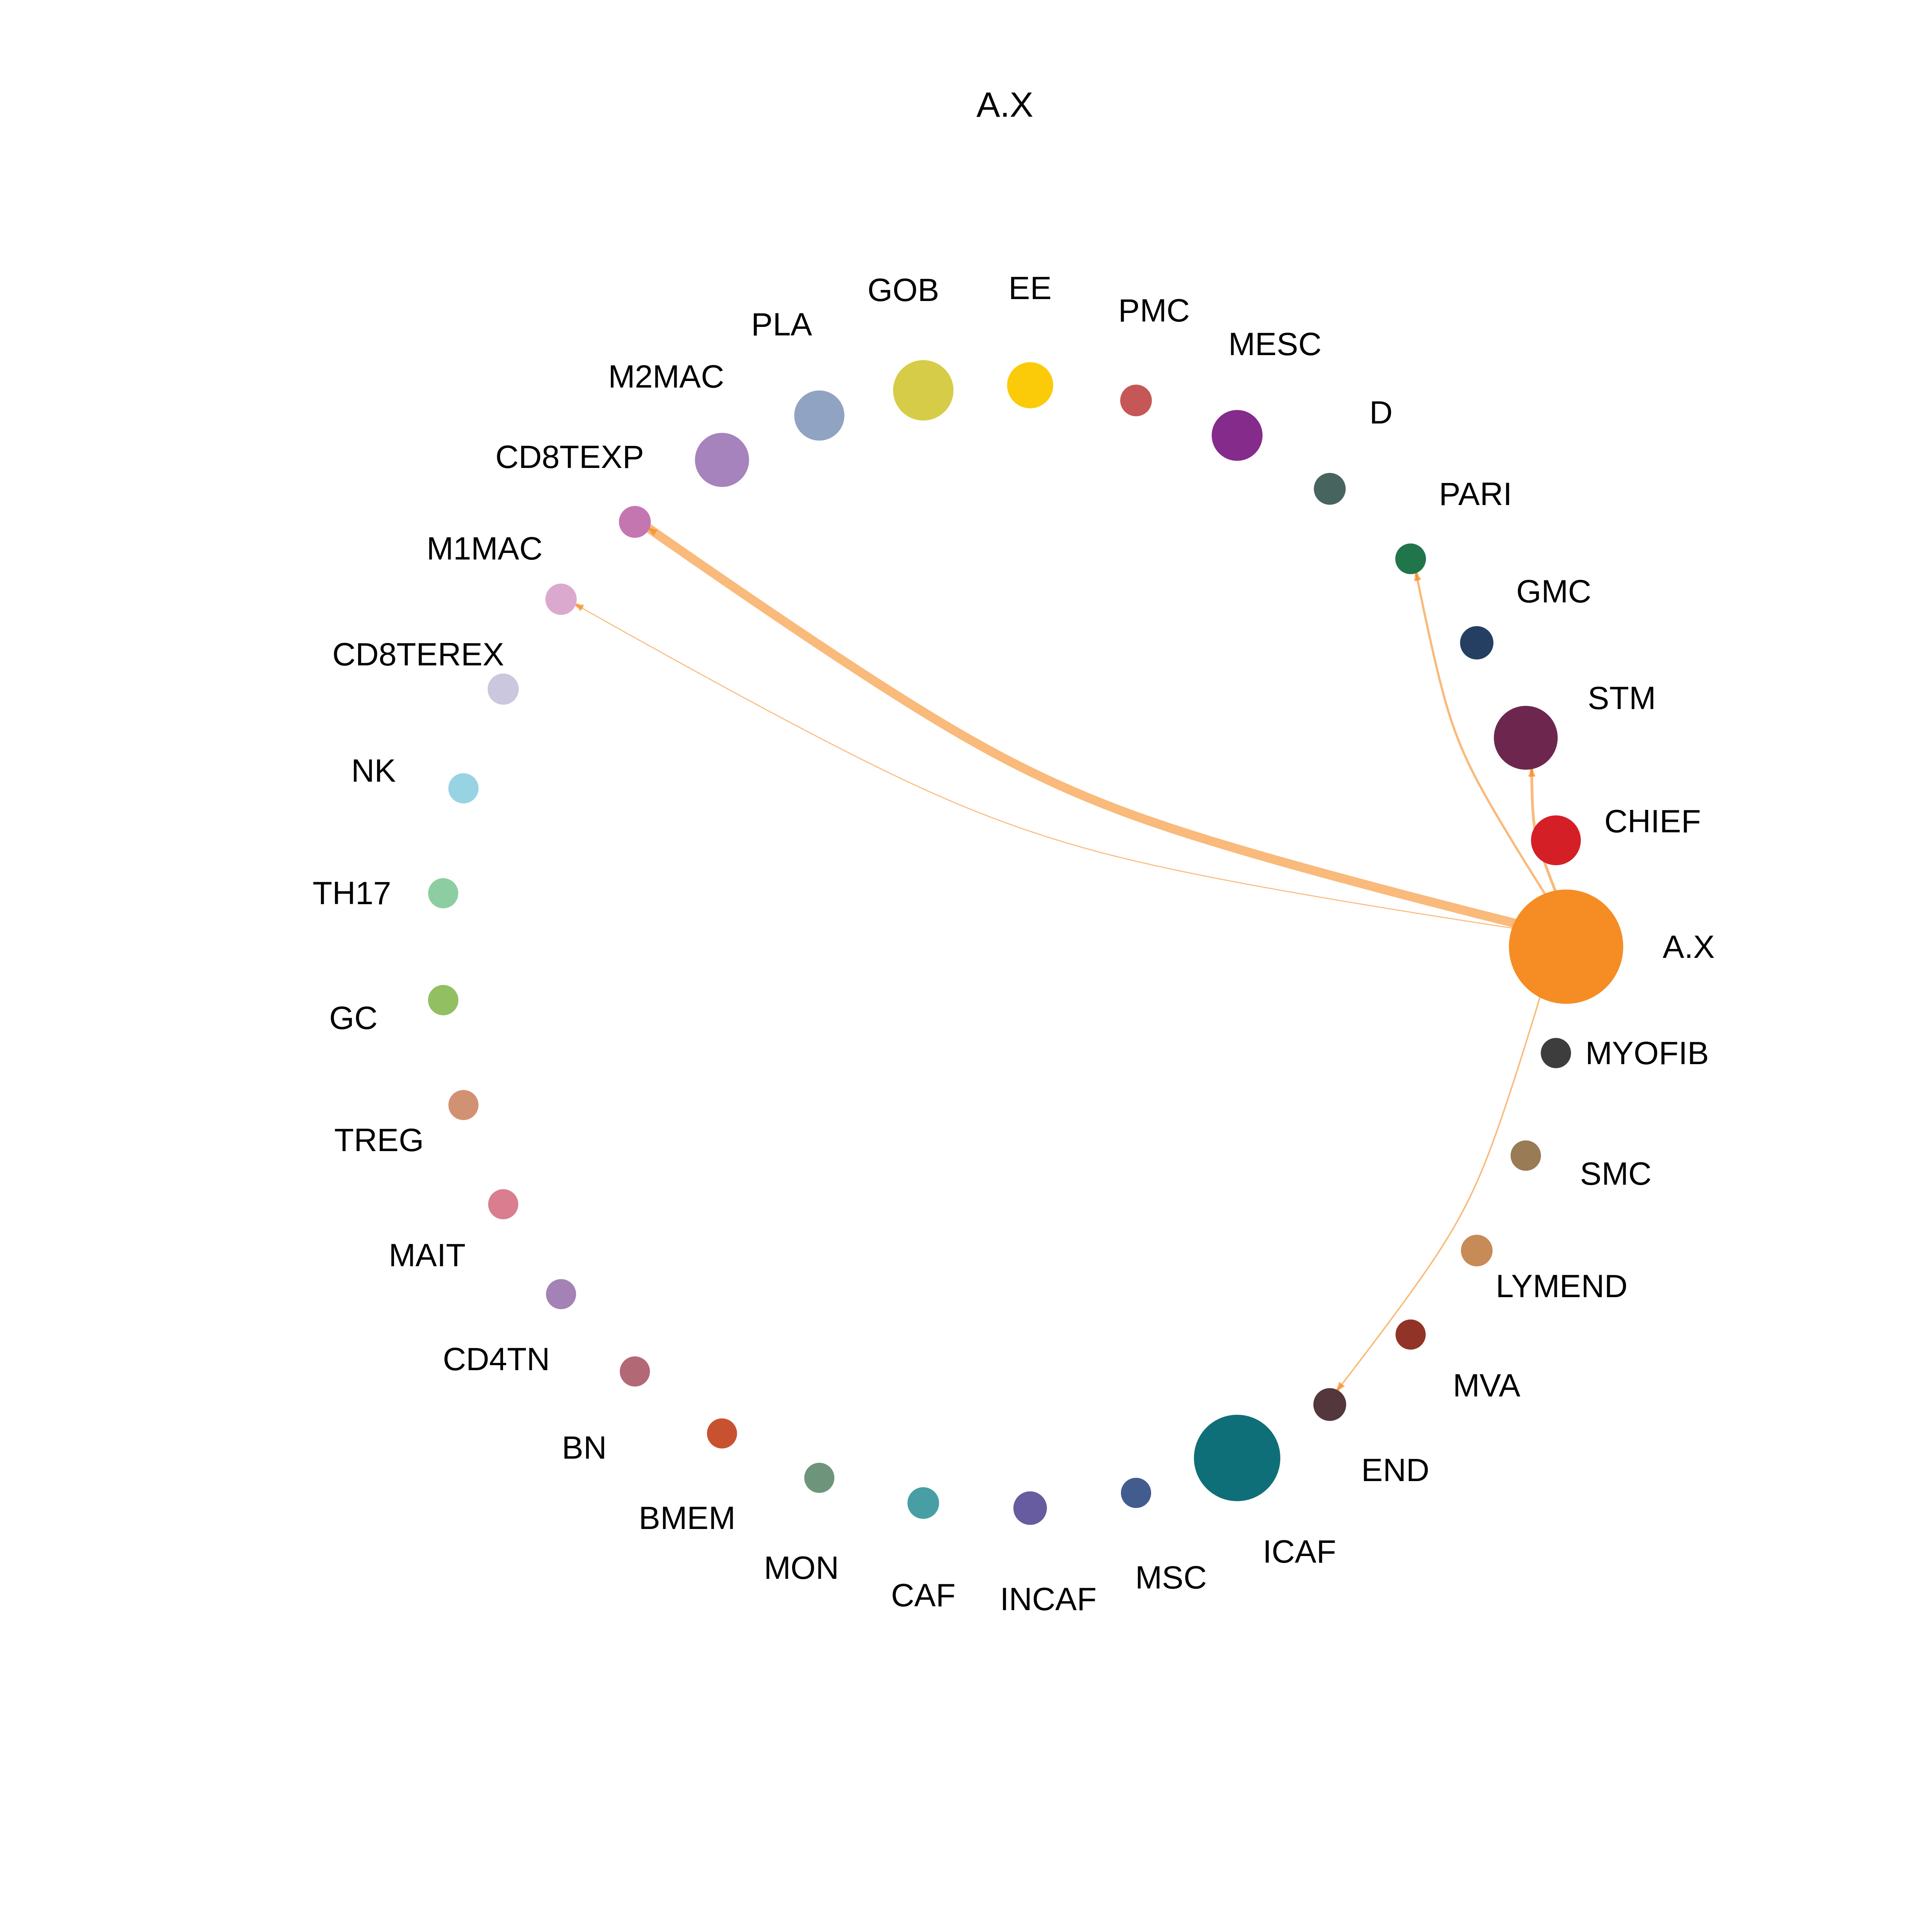
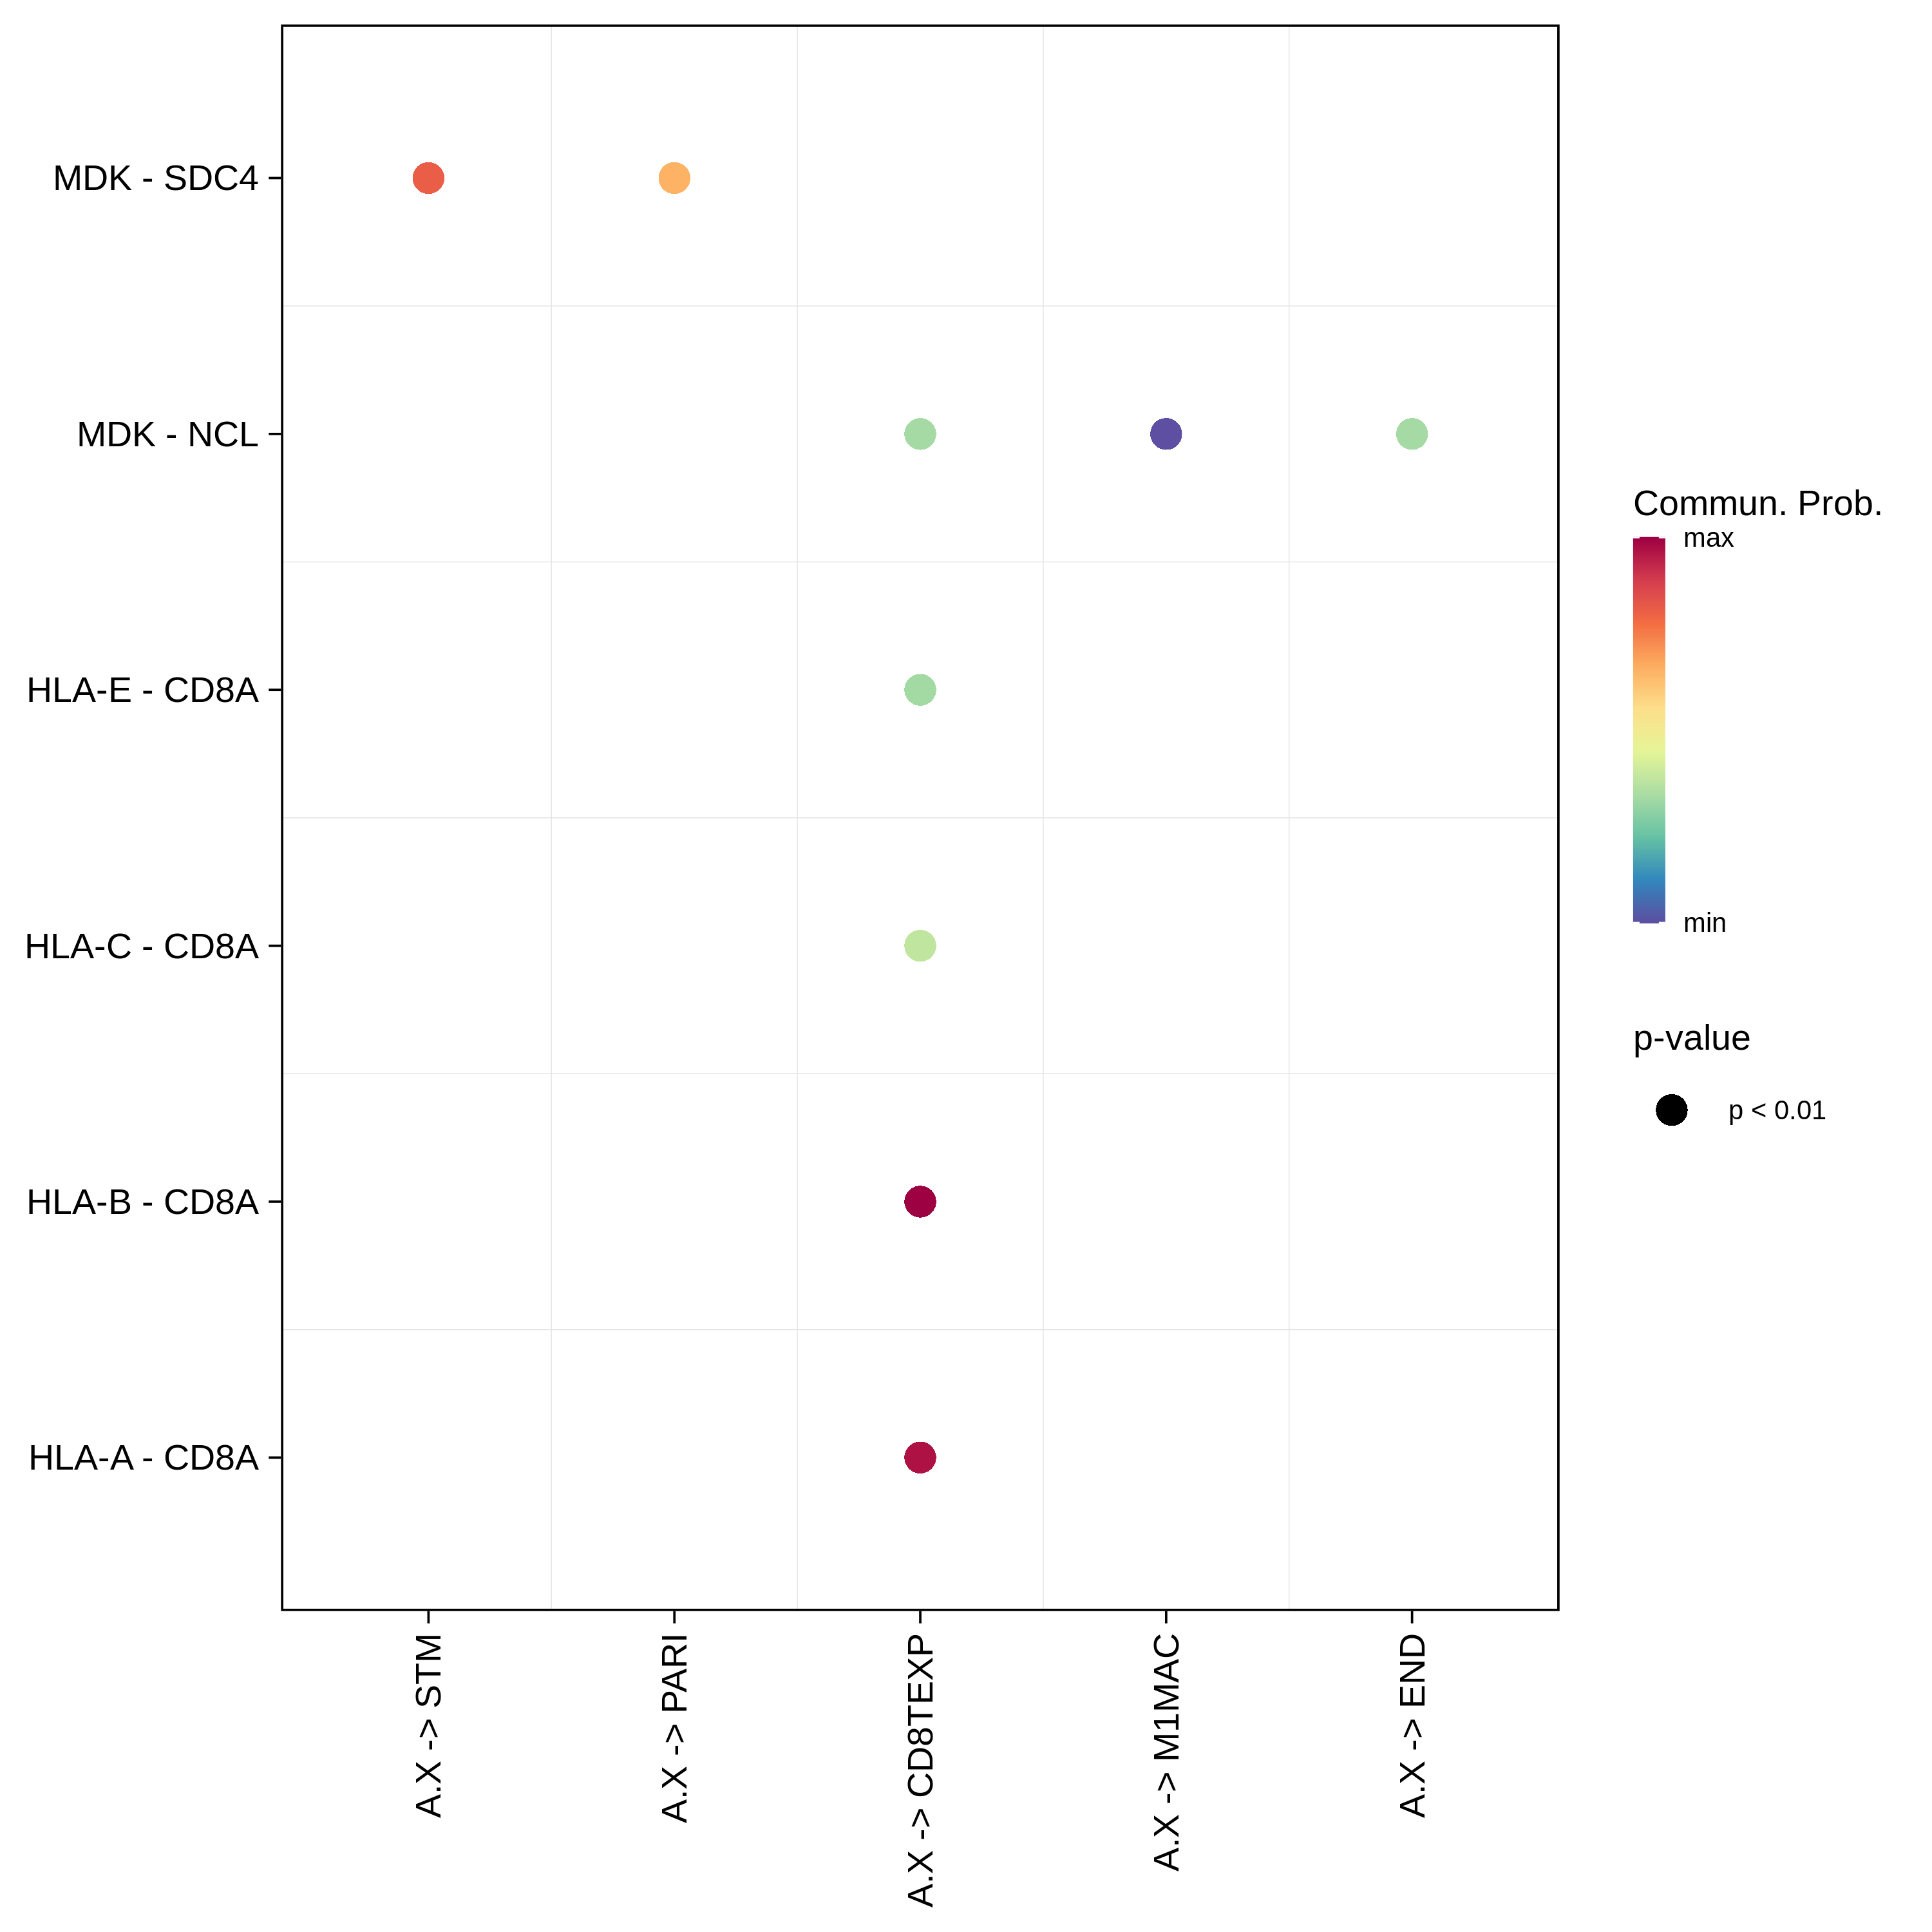
HealthyA.XThe cell-cell communications between each two interacting cell types in Healthy-derived samples of the selected tissue. Different colors in the circle plot represent different cell groups and the edge width is proportional to the indicated number of ligand-receptor pairs.Bubble plot of proportion to the communication probability in significant signaling pathways between this cell type and its source cell population in Healthy-derived samples of the selected tissue. Each row represents the significant ligand and receptor gene pairs.Bubble plot of proportion to the communication probability in significant signaling pathways between this cell type and its target cell population in Healthy-derived samples of the selected tissue. Each row represents the significant ligand and receptor gene pairs.
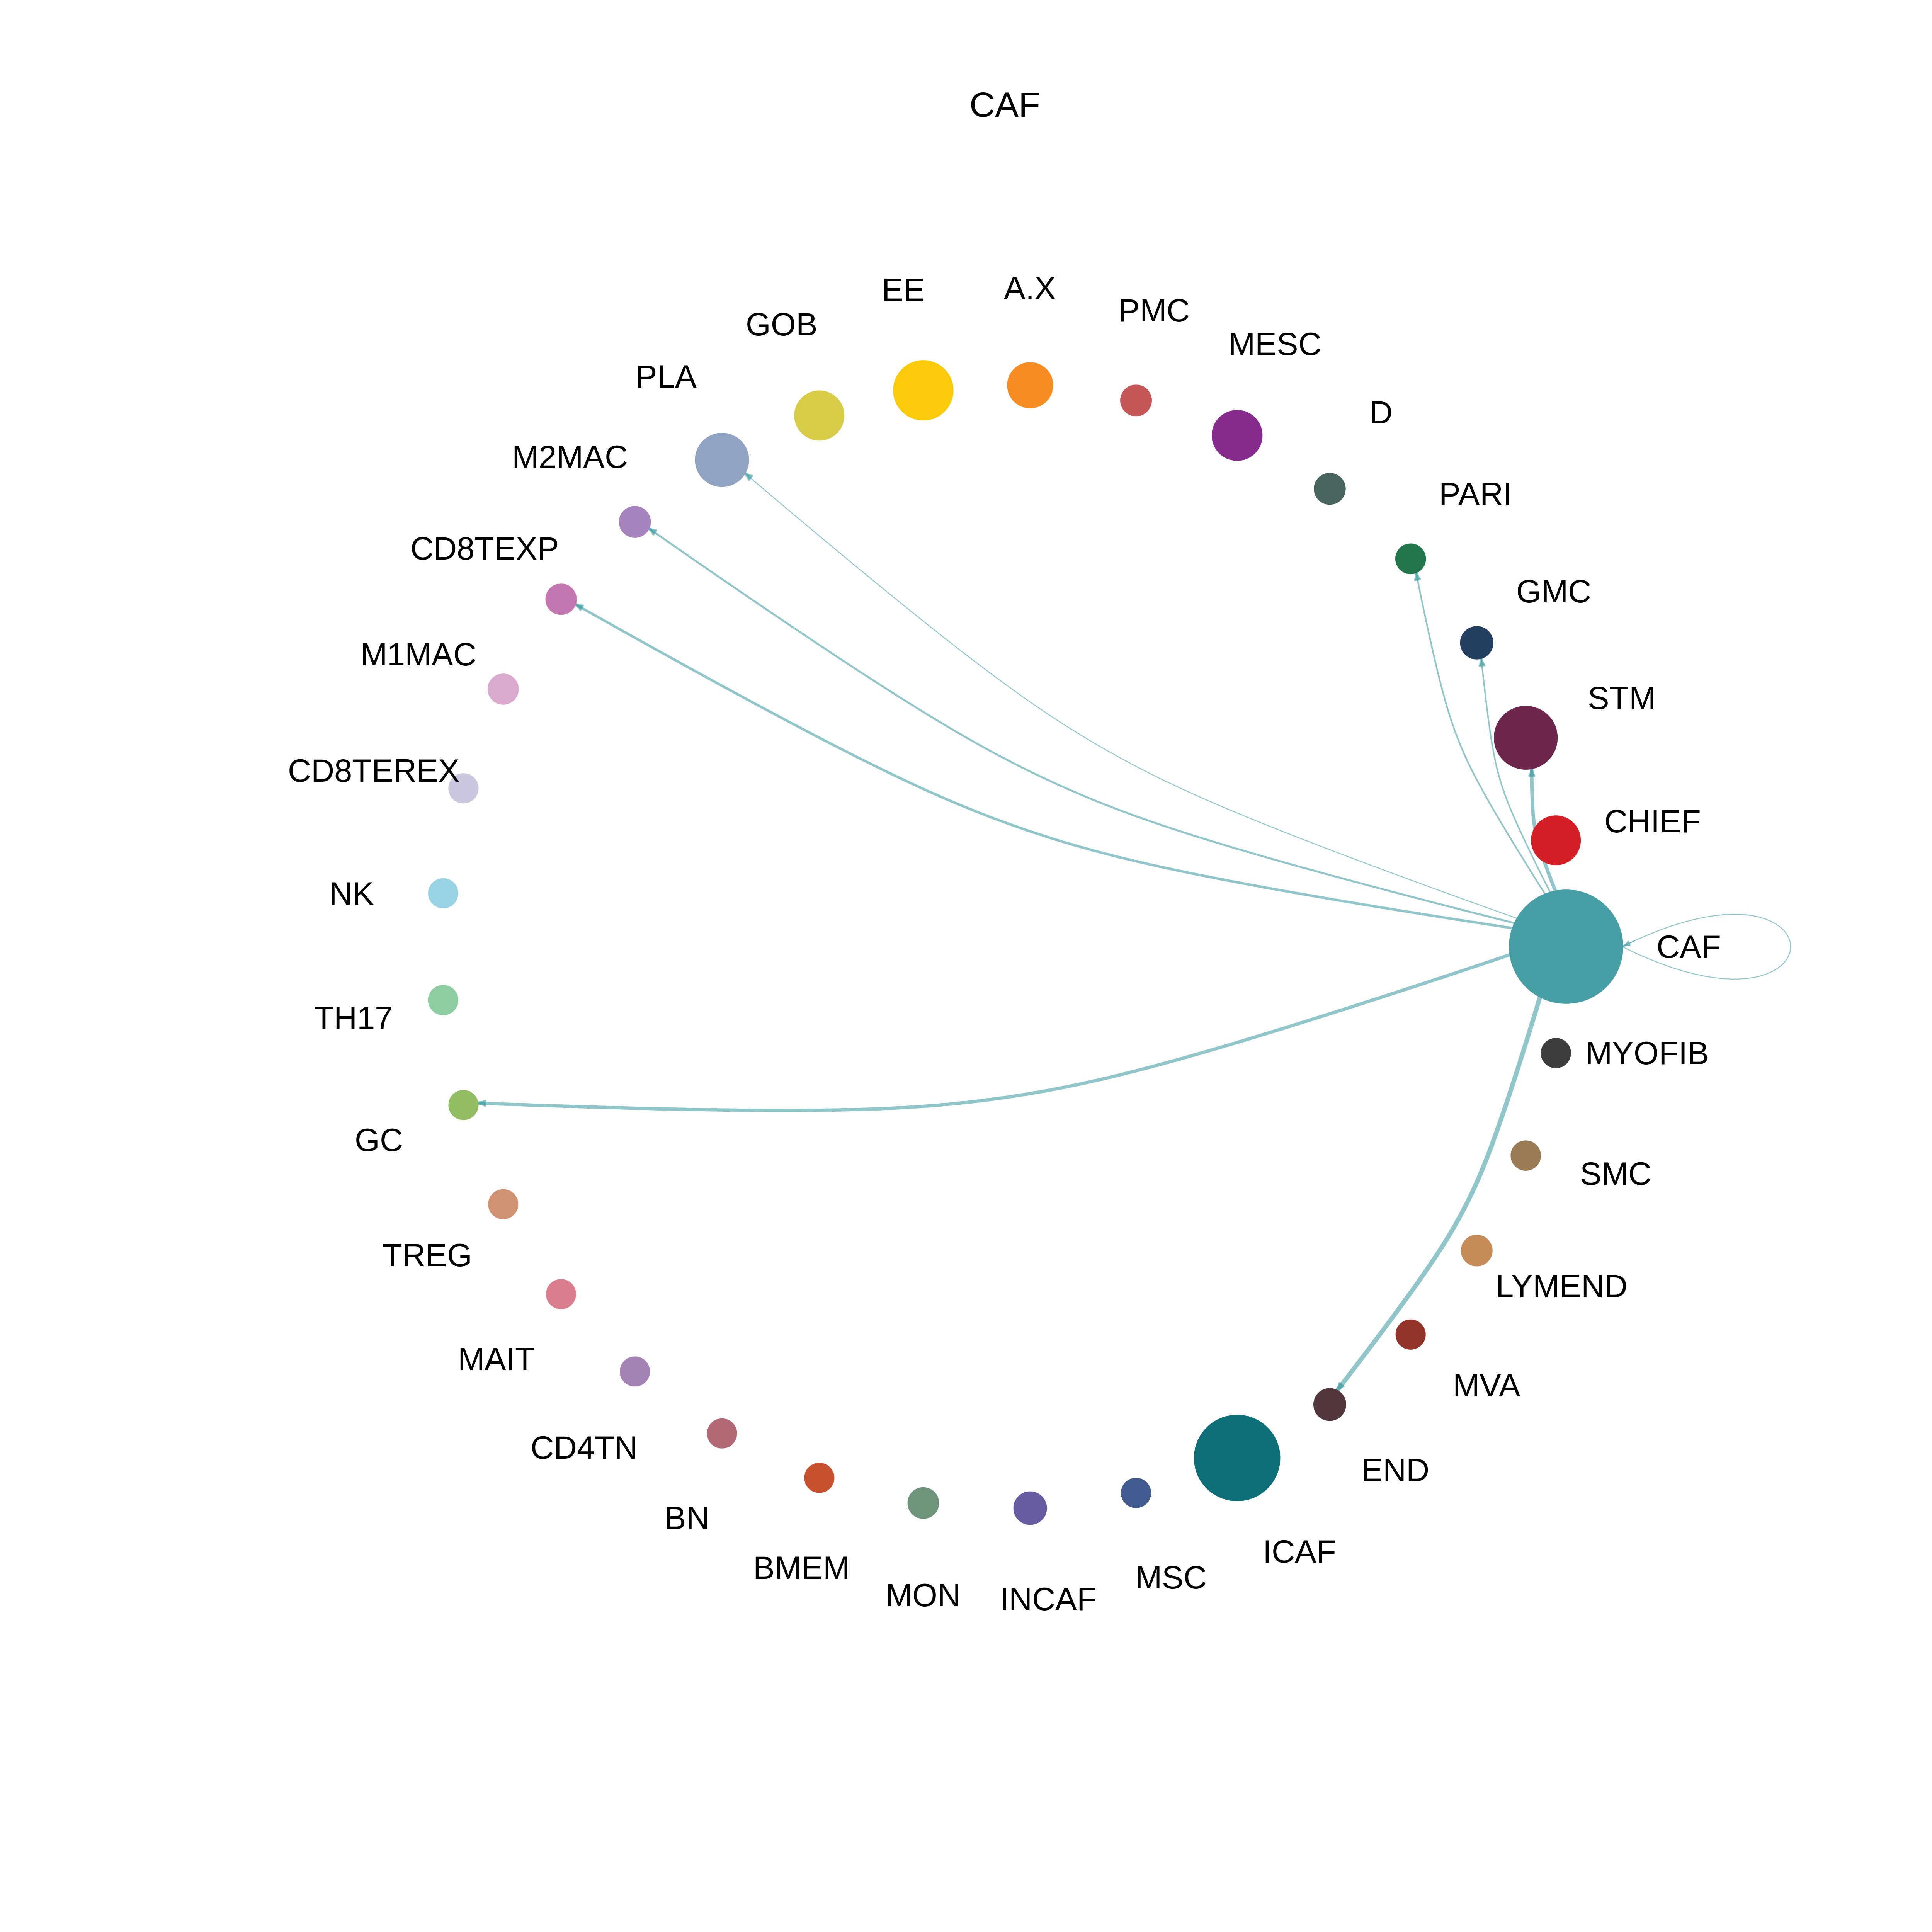
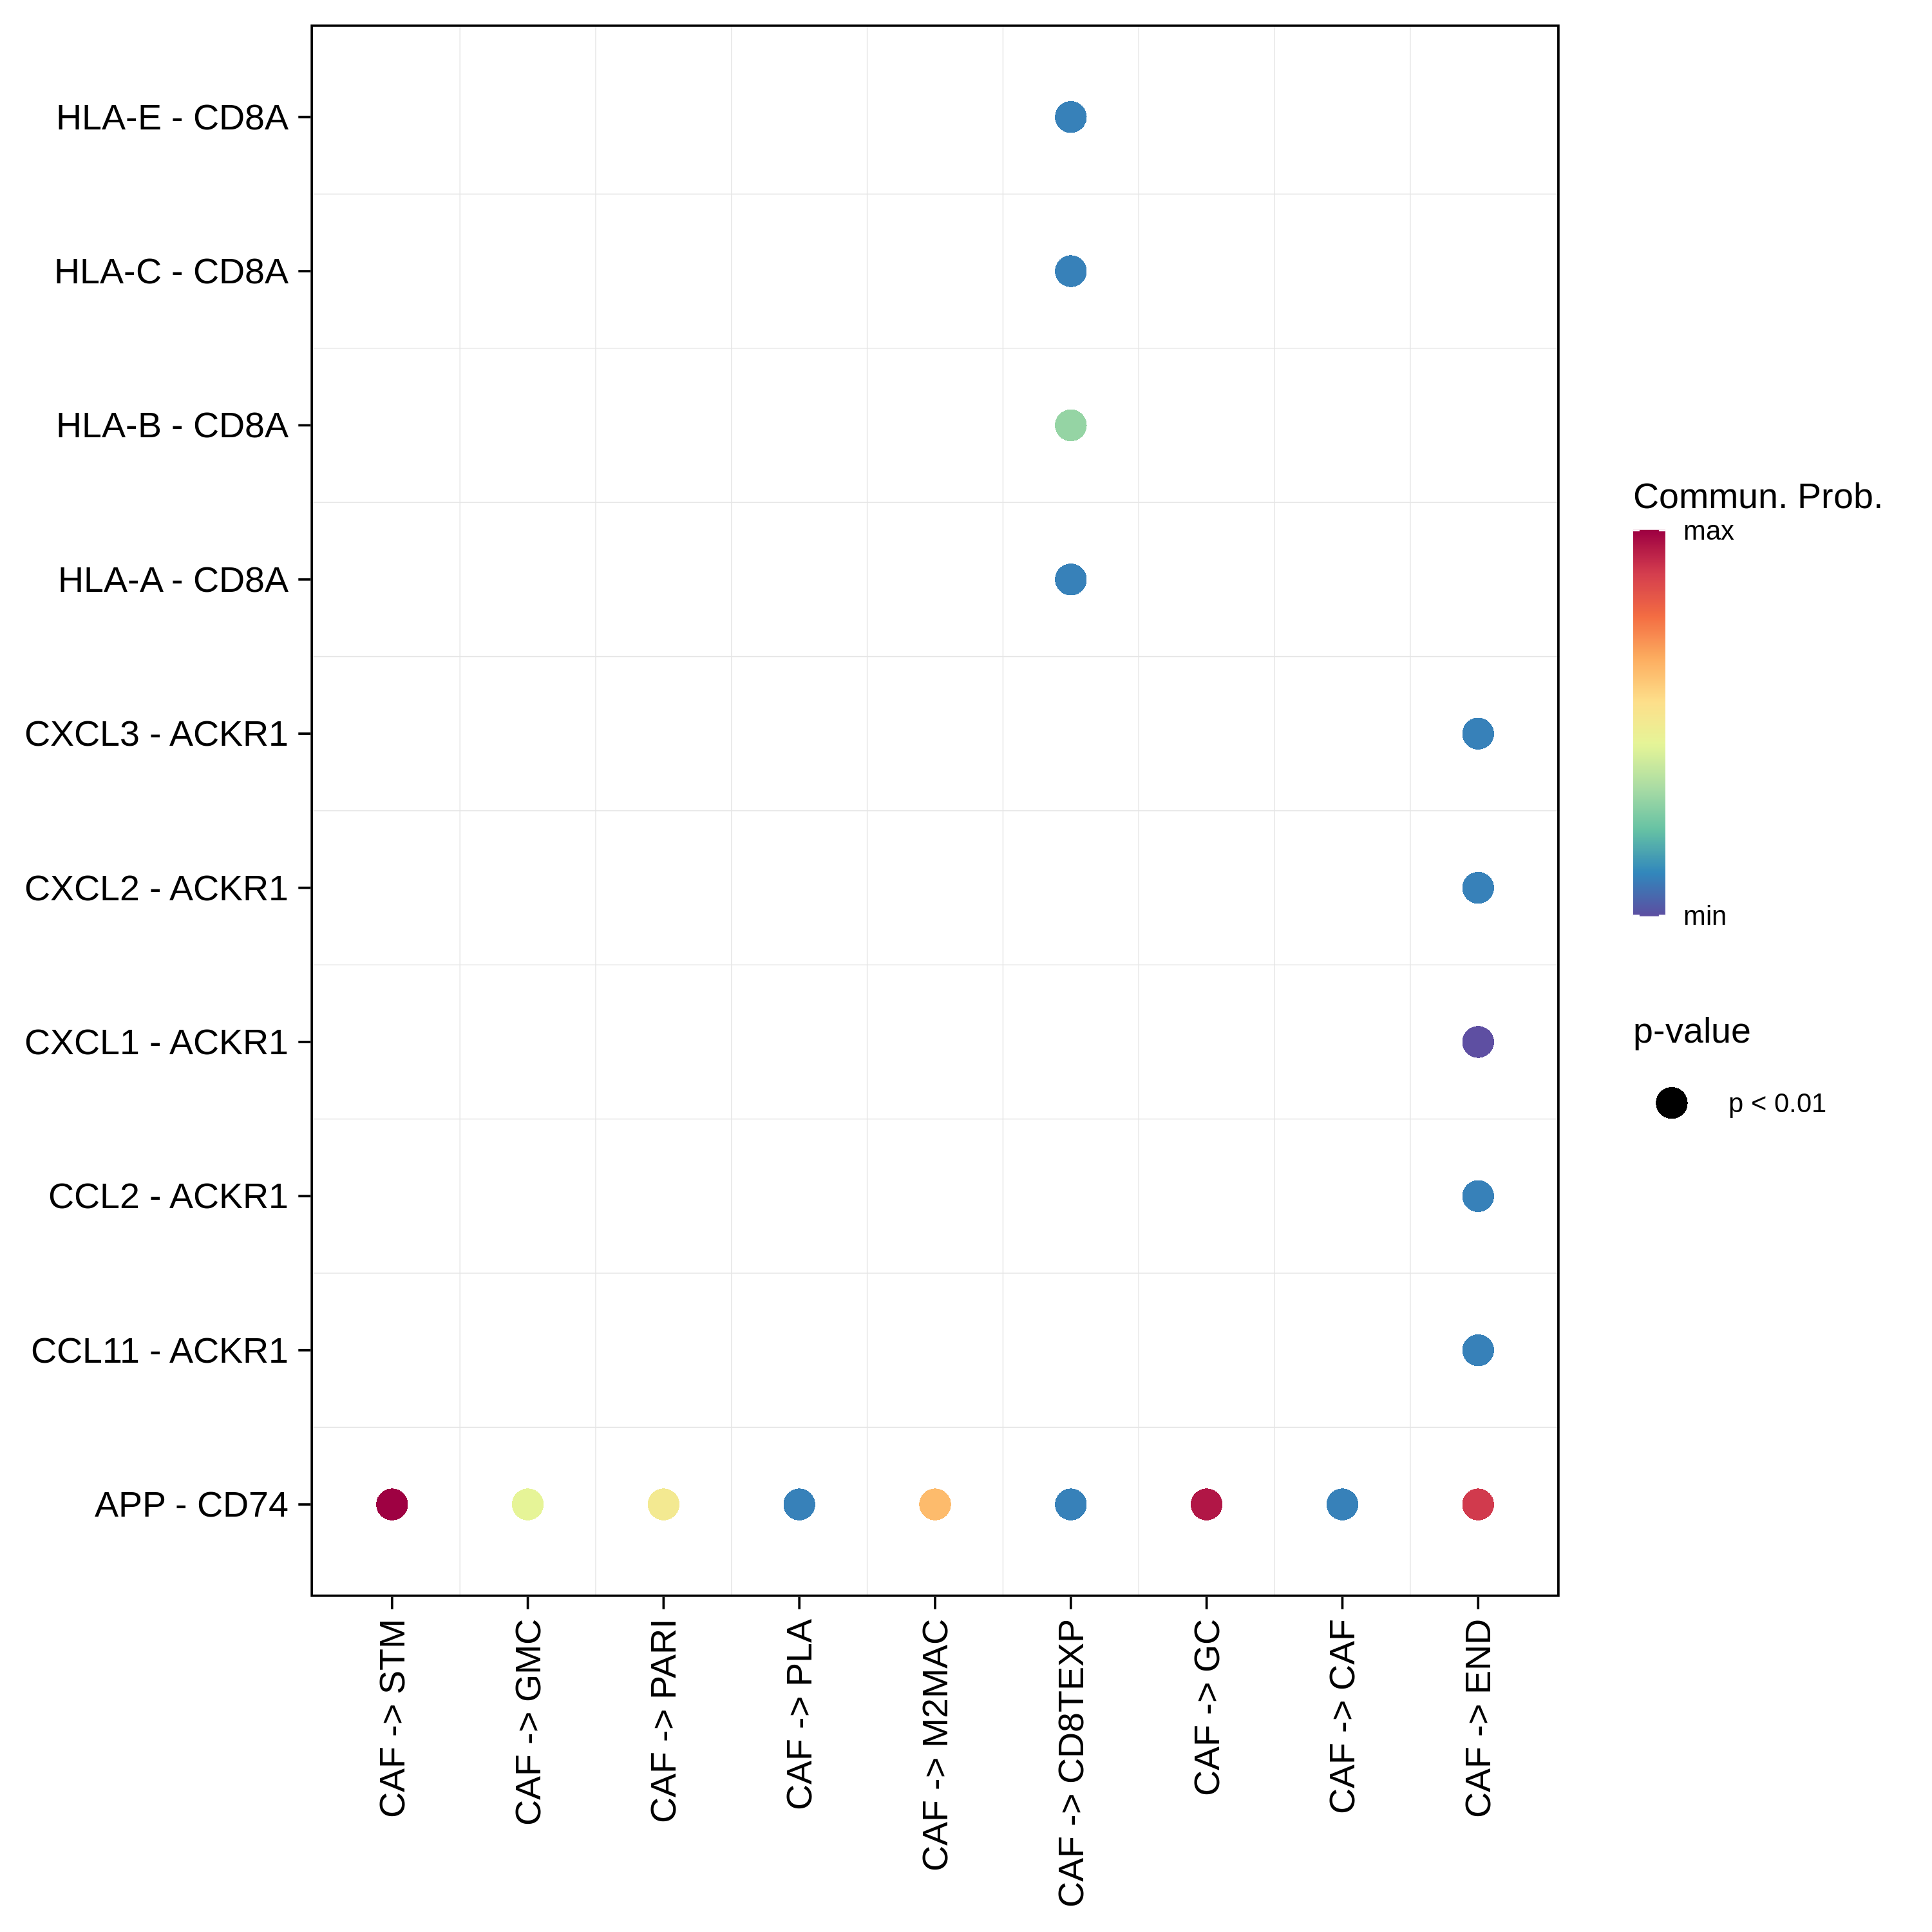
CAFThe cell-cell communications between each two interacting cell types in Healthy-derived samples of the selected tissue. Different colors in the circle plot represent different cell groups and the edge width is proportional to the indicated number of ligand-receptor pairs.Bubble plot of proportion to the communication probability in significant signaling pathways between this cell type and its source cell population in Healthy-derived samples of the selected tissue. Each row represents the significant ligand and receptor gene pairs.Bubble plot of proportion to the communication probability in significant signaling pathways between this cell type and its target cell population in Healthy-derived samples of the selected tissue. Each row represents the significant ligand and receptor gene pairs.
Page: 1 2 3 4 5 6 7 8 9 10 11 

Disease StateCell TypeCircleSourceTarget
ADJA.XThe cell-cell communications between each two interacting cell types in ADJ-derived samples of the selected tissue. Different colors in the circle plot represent different cell groups and the edge width is proportional to the indicated number of ligand-receptor pairs. Bubble plot of proportion to the communication probability in significant signaling pathways between this cell type and its source cell population in ADJ-derived samples of the selected tissue. Each row represents the significant ligand and receptor gene pairs.Bubble plot of proportion to the communication probability in significant signaling pathways between this cell type and its target cell population in ADJ-derived samples of the selected tissue. Each row represents the significant ligand and receptor gene pairs.
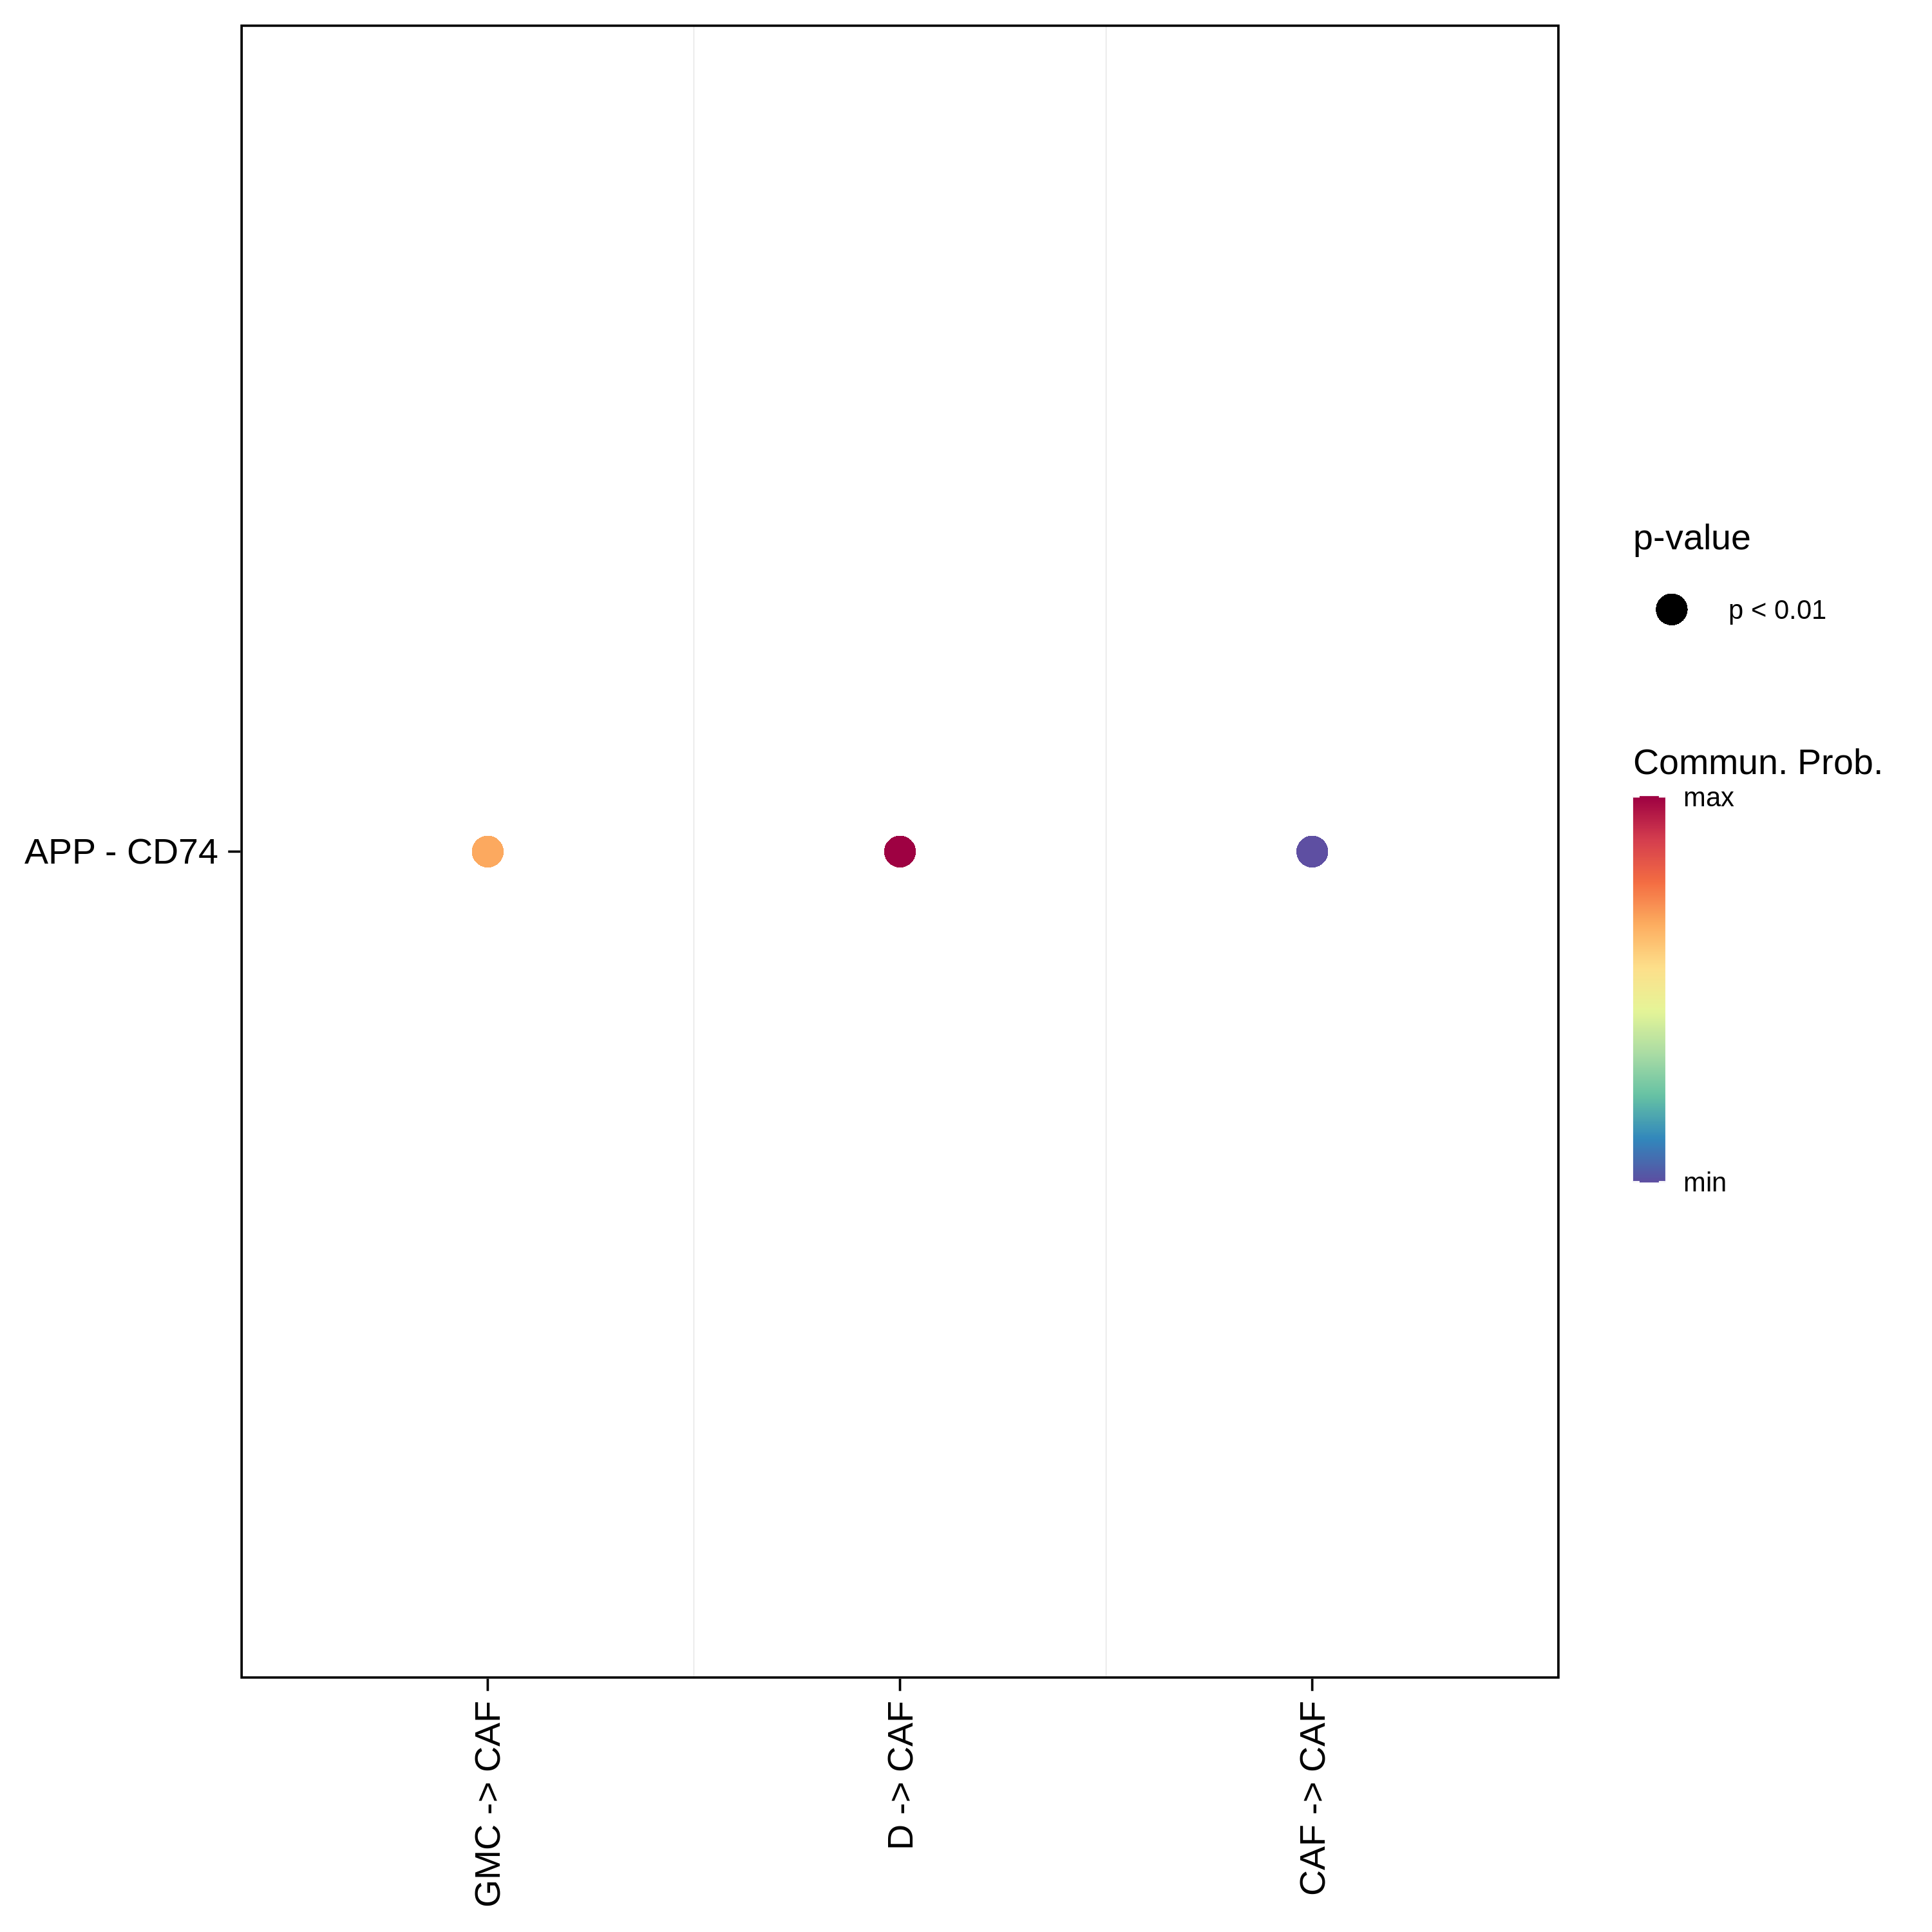
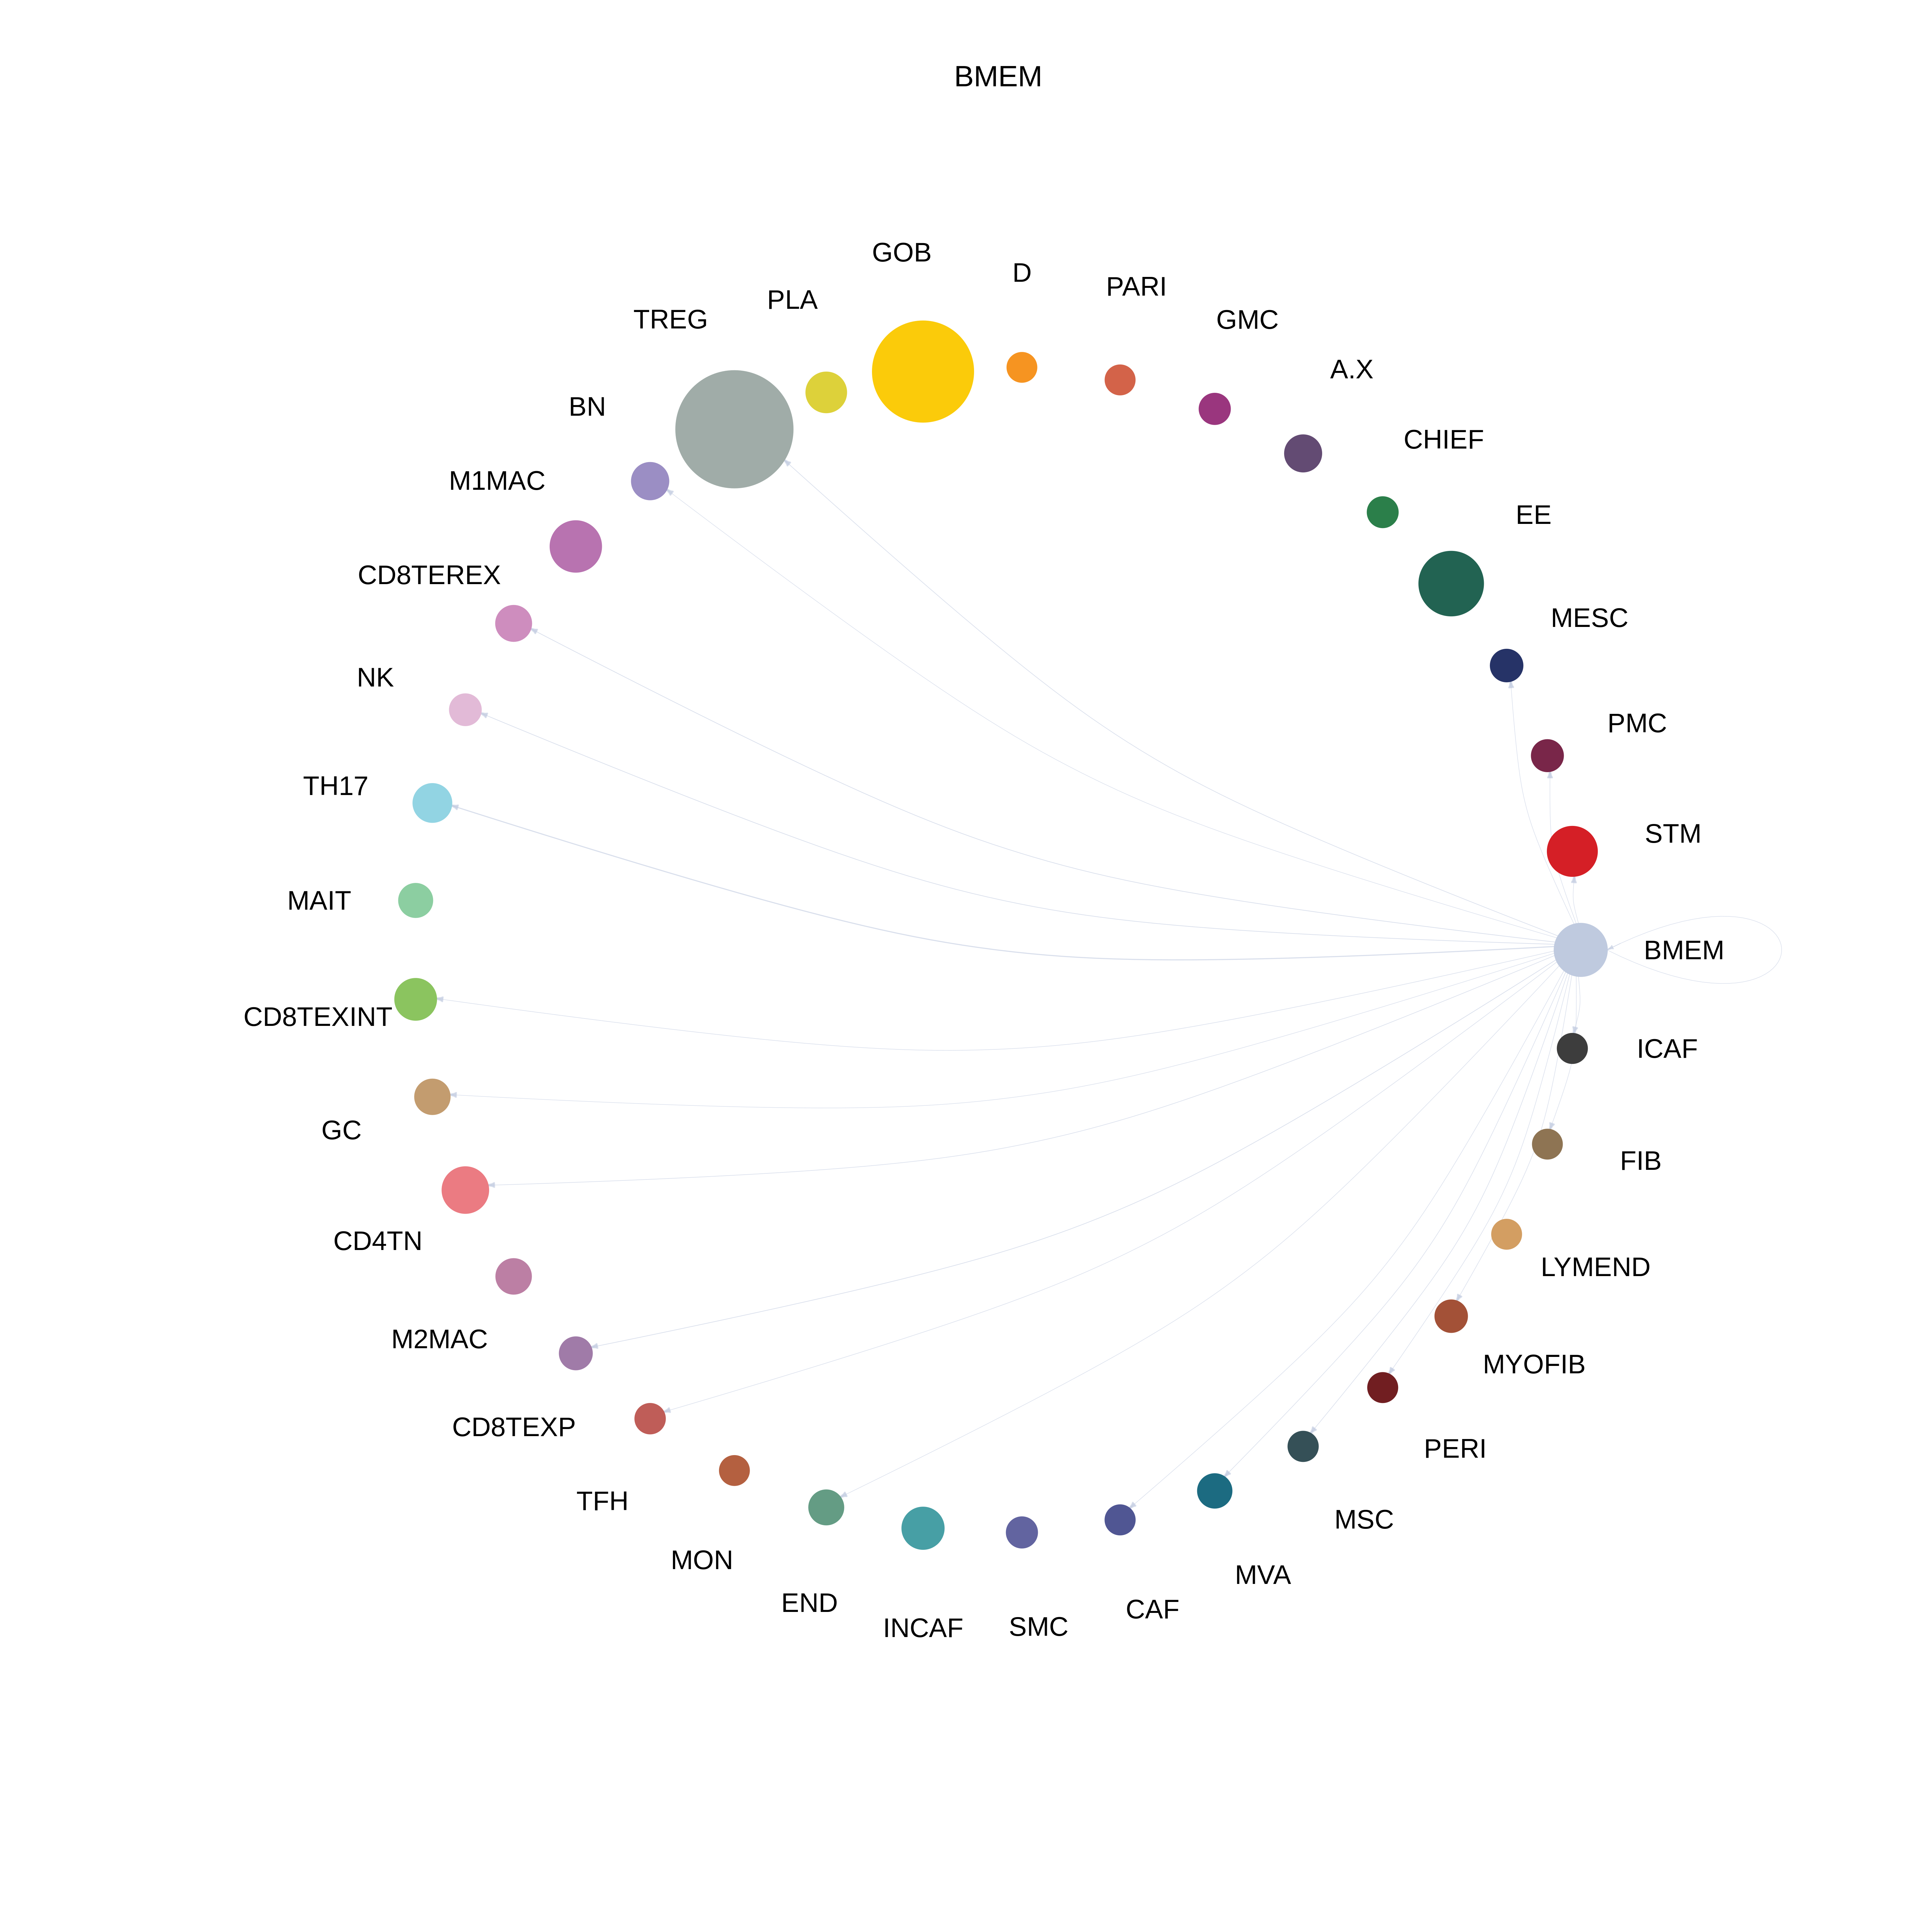
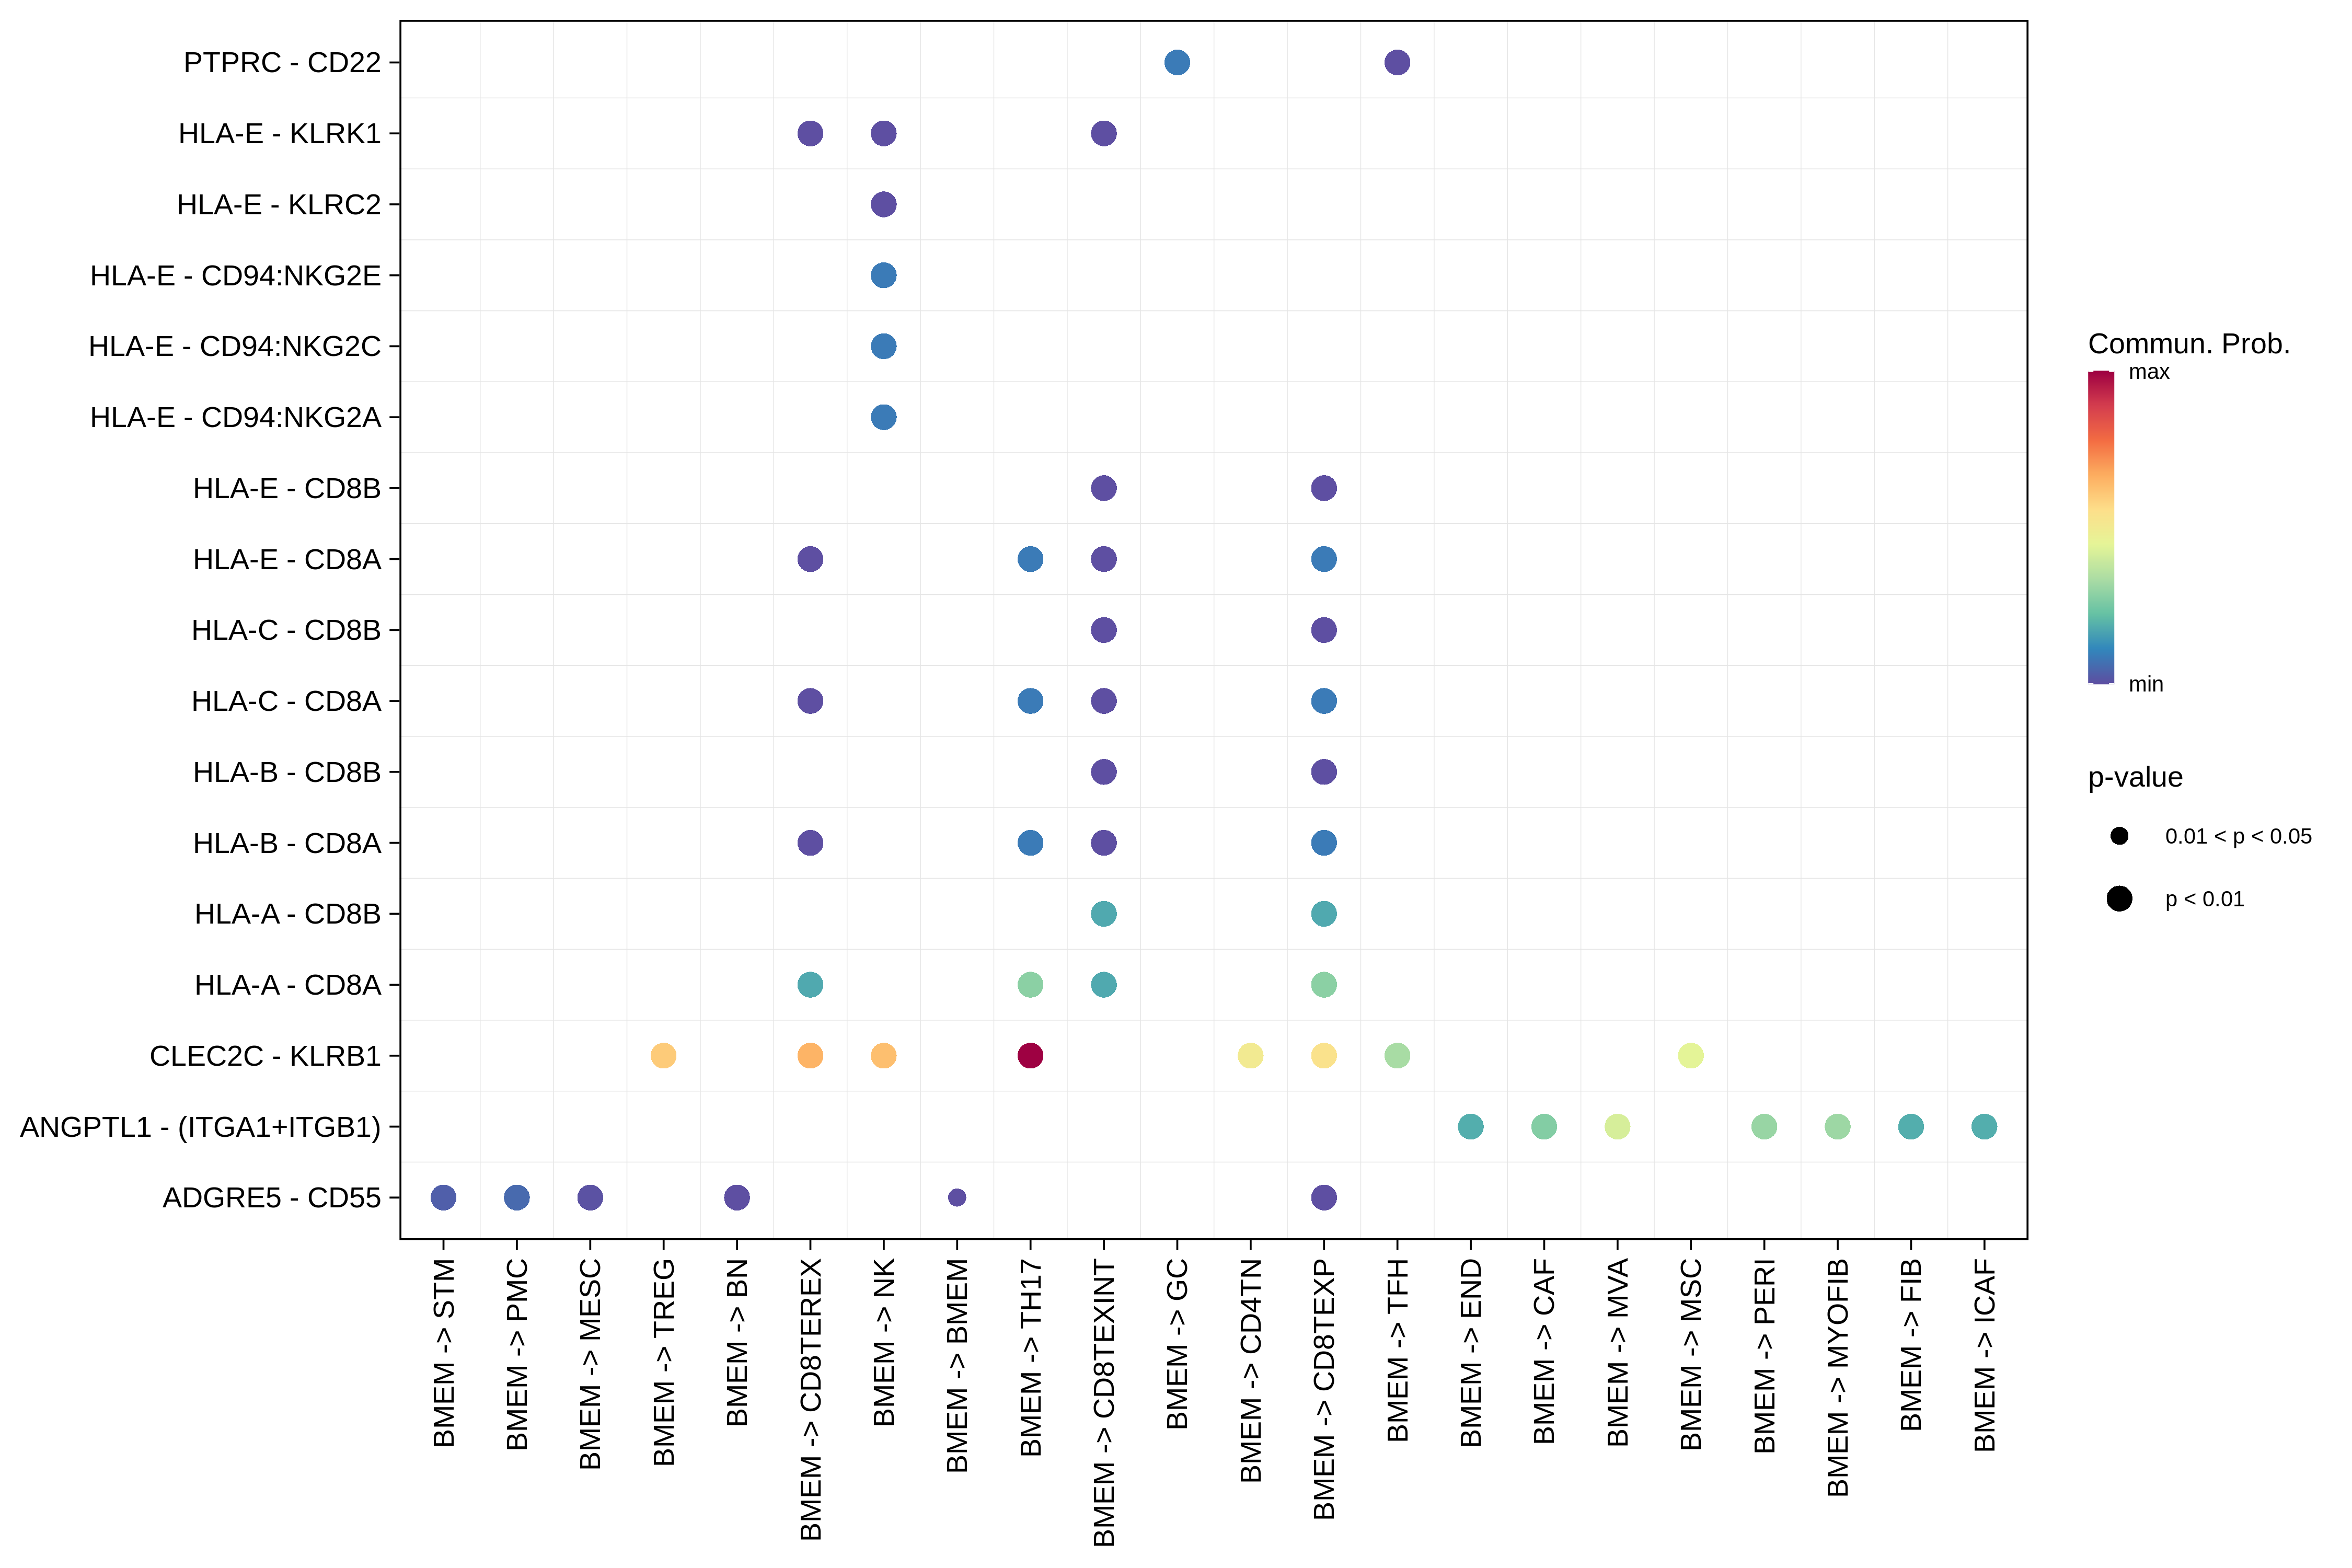
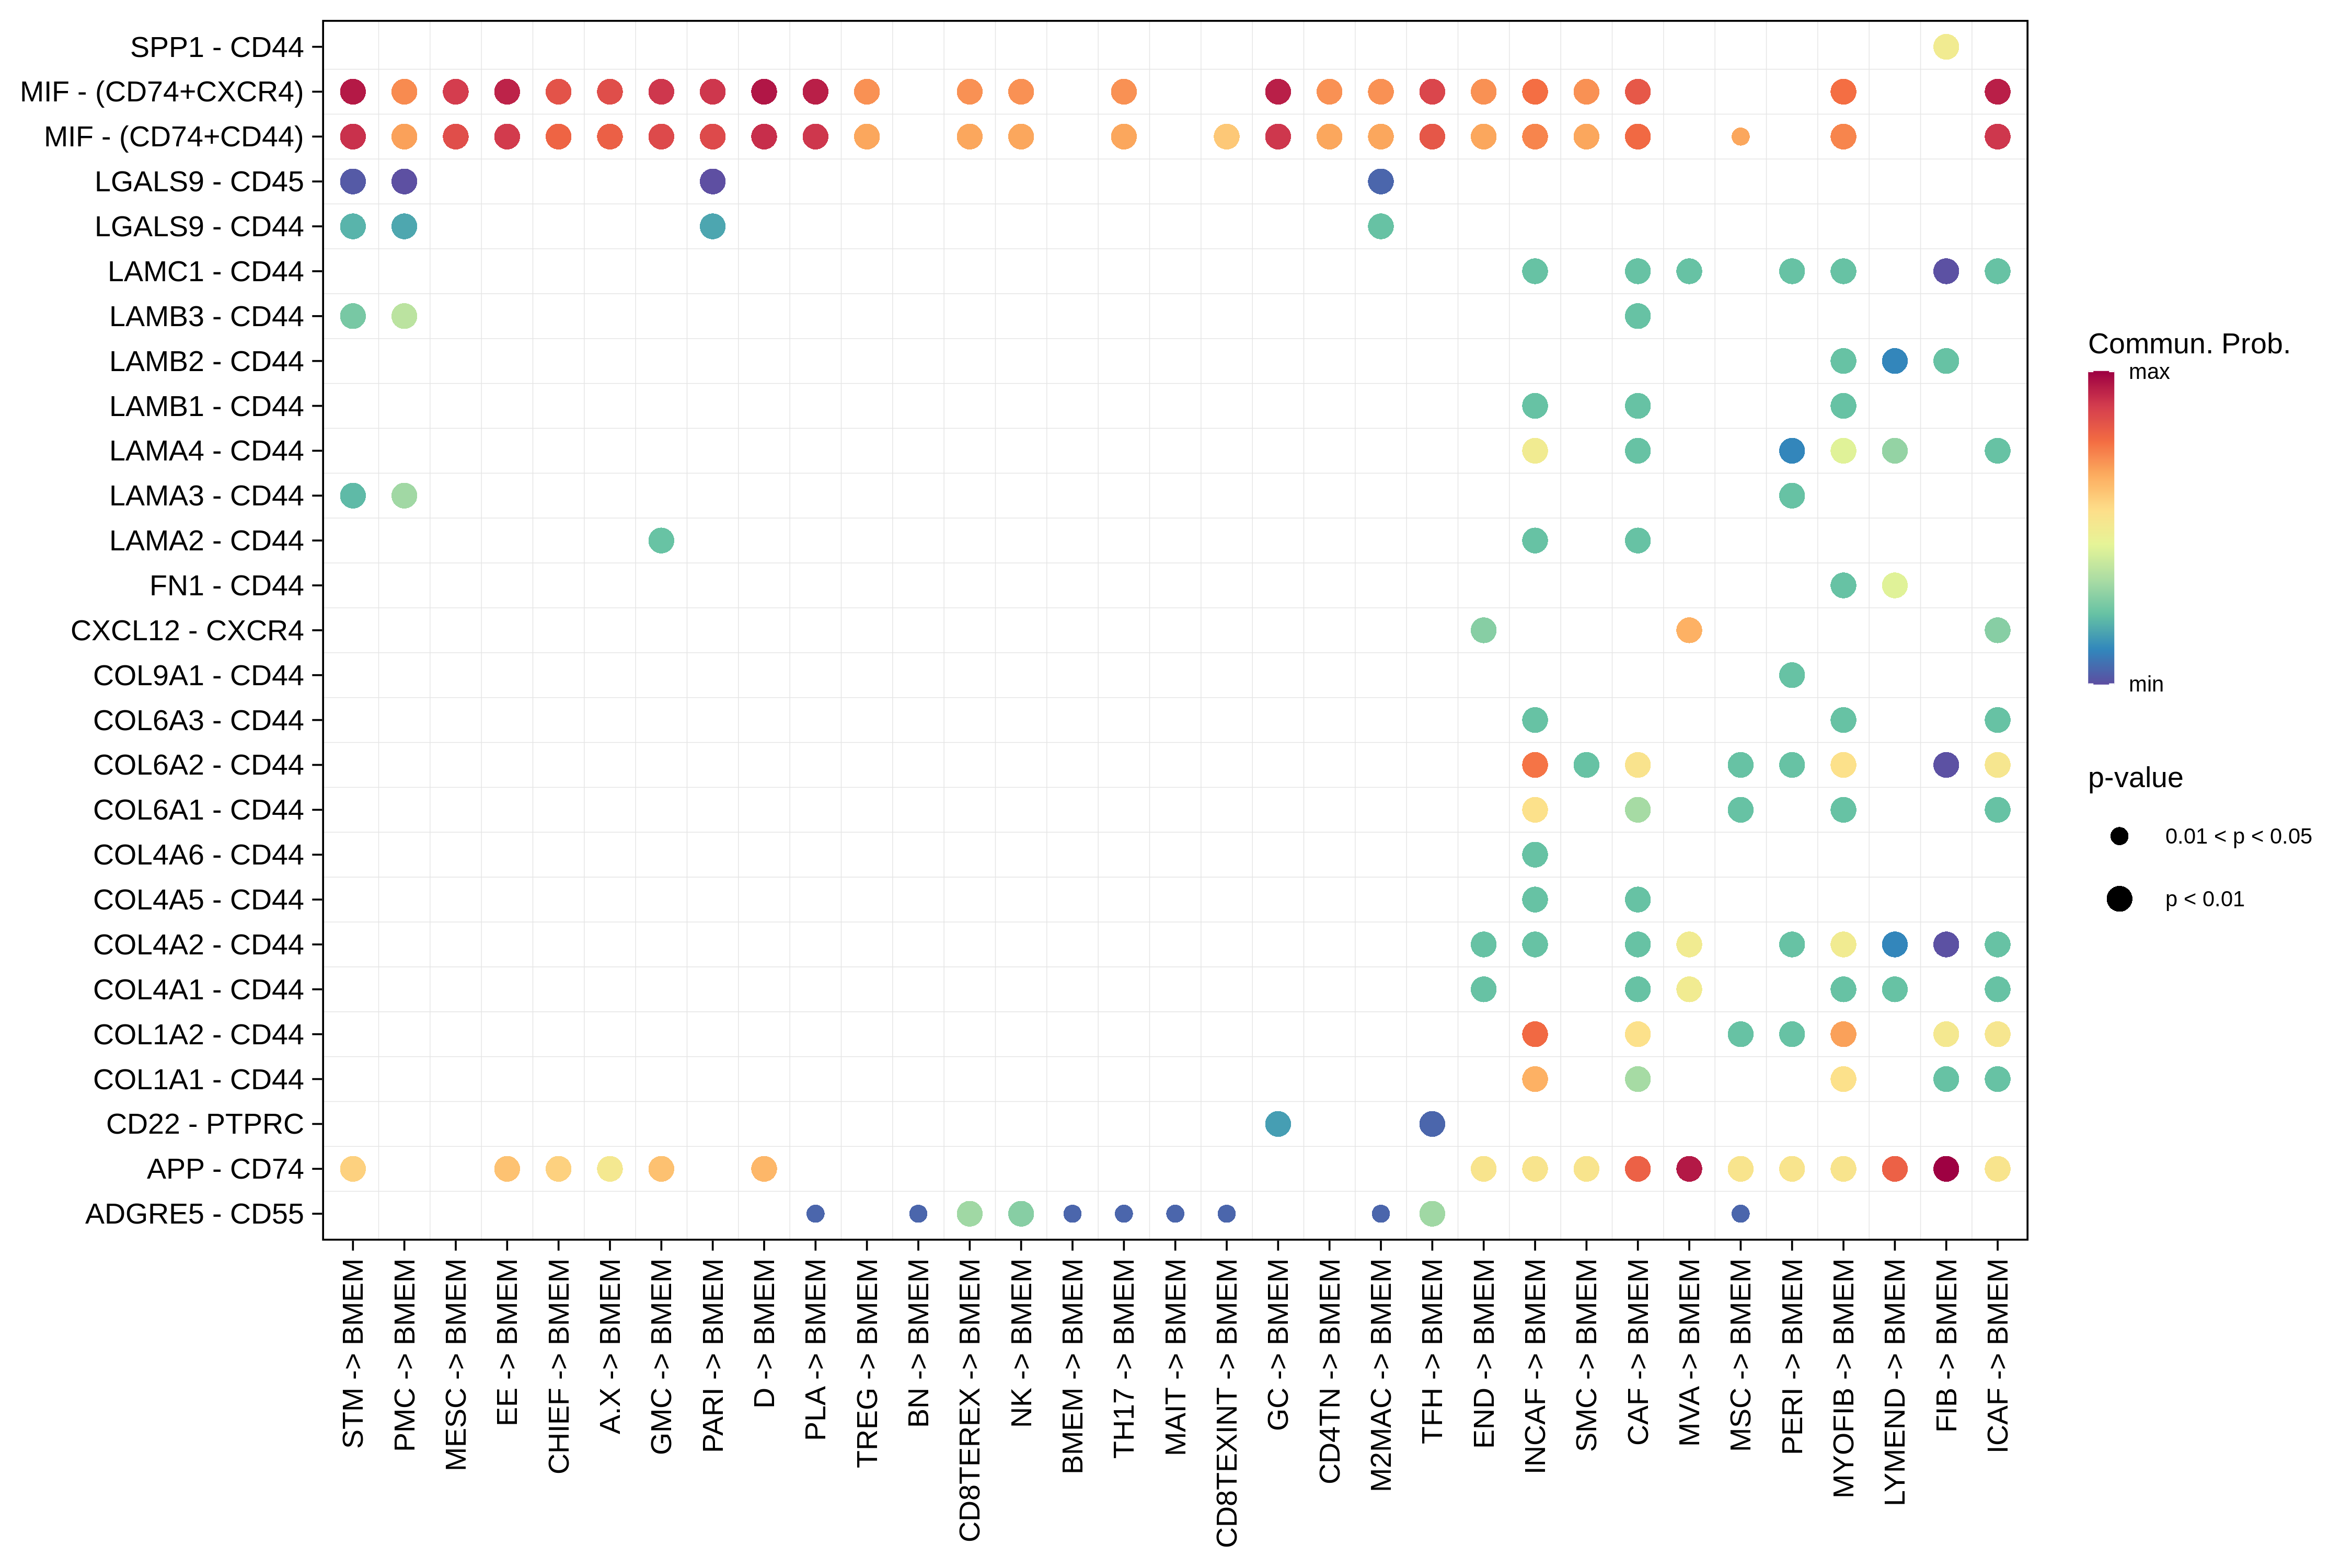
BMEMThe cell-cell communications between each two interacting cell types in ADJ-derived samples of the selected tissue. Different colors in the circle plot represent different cell groups and the edge width is proportional to the indicated number of ligand-receptor pairs. Bubble plot of proportion to the communication probability in significant signaling pathways between this cell type and its source cell population in ADJ-derived samples of the selected tissue. Each row represents the significant ligand and receptor gene pairs.Bubble plot of proportion to the communication probability in significant signaling pathways between this cell type and its target cell population in ADJ-derived samples of the selected tissue. Each row represents the significant ligand and receptor gene pairs.
Page: 1 2 3 4 5 6 7 8 9 10 11 12 13 14 15 16 17 18 

Disease StateCell TypeCircleSourceTarget
PrecancerA.XThe cell-cell communications between each two interacting cell types in Precancer-derived samples of the selected tissue. Different colors in the circle plot represent different cell groups and the edge width is proportional to the indicated number of ligand-receptor pairs. Bubble plot of proportion to the communication probability in significant signaling pathways between this cell type and its source cell population in Precancer-derived samples of the selected tissue. Each row represents the significant ligand and receptor gene pairs.Bubble plot of proportion to the communication probability in significant signaling pathways between this cell type and its target cell population in Precancer-derived samples of the selected tissue. Each row represents the significant ligand and receptor gene pairs.
BMEMThe cell-cell communications between each two interacting cell types in Precancer-derived samples of the selected tissue. Different colors in the circle plot represent different cell groups and the edge width is proportional to the indicated number of ligand-receptor pairs. Bubble plot of proportion to the communication probability in significant signaling pathways between this cell type and its source cell population in Precancer-derived samples of the selected tissue. Each row represents the significant ligand and receptor gene pairs.Bubble plot of proportion to the communication probability in significant signaling pathways between this cell type and its target cell population in Precancer-derived samples of the selected tissue. Each row represents the significant ligand and receptor gene pairs.
Page: 1 2 3 4 5 6 7 8 9 10 11 12 13 14 15 16 17 

Disease StateCell TypeCircleSourceTarget
GCA.XThe cell-cell communications between each two interacting cell types in GC-derived samples of Stomach tissue. Different colors in the circle plot represent different cell groups and the edge width is proportional to the indicated number of ligand-receptor pairs.Bubble plot of proportion to the communication probability in significant signaling pathways between this cell type and its source cell population in GC-derived samples of Stomach tissue. Each row represents the significant ligand and receptor gene pairs.Bubble plot of proportion to the communication probability in significant signaling pathways between this cell type and its target cell population in GC-derived samples of Stomach tissue. Each row represents the significant ligand and receptor gene pairs.
BMEMThe cell-cell communications between each two interacting cell types in GC-derived samples of Stomach tissue. Different colors in the circle plot represent different cell groups and the edge width is proportional to the indicated number of ligand-receptor pairs.Bubble plot of proportion to the communication probability in significant signaling pathways between this cell type and its source cell population in GC-derived samples of Stomach tissue. Each row represents the significant ligand and receptor gene pairs.Bubble plot of proportion to the communication probability in significant signaling pathways between this cell type and its target cell population in GC-derived samples of Stomach tissue. Each row represents the significant ligand and receptor gene pairs.
∗The cell-cell communications between each two interacting cell types in different states-derived samples of Stomach tissue. Different colors in the circle plot represent different cell groups and the edge width is proportional to the indicated number of ligand-receptor pairs.
∗Bubble plot of proportion to the communication probability in significant signaling pathways between this cell type and its source and target cell population. Each row represents the significant ligand and receptor gene pairs.
Page: 1 2 3 4 5 6 7 8 9 10 11 12 13 14 15 16 17 18 19 

Top

Stemness, Senescence, Metaplasia and NeoTCR signature analysis

check button Developmental potential inference using CytoTRACE.
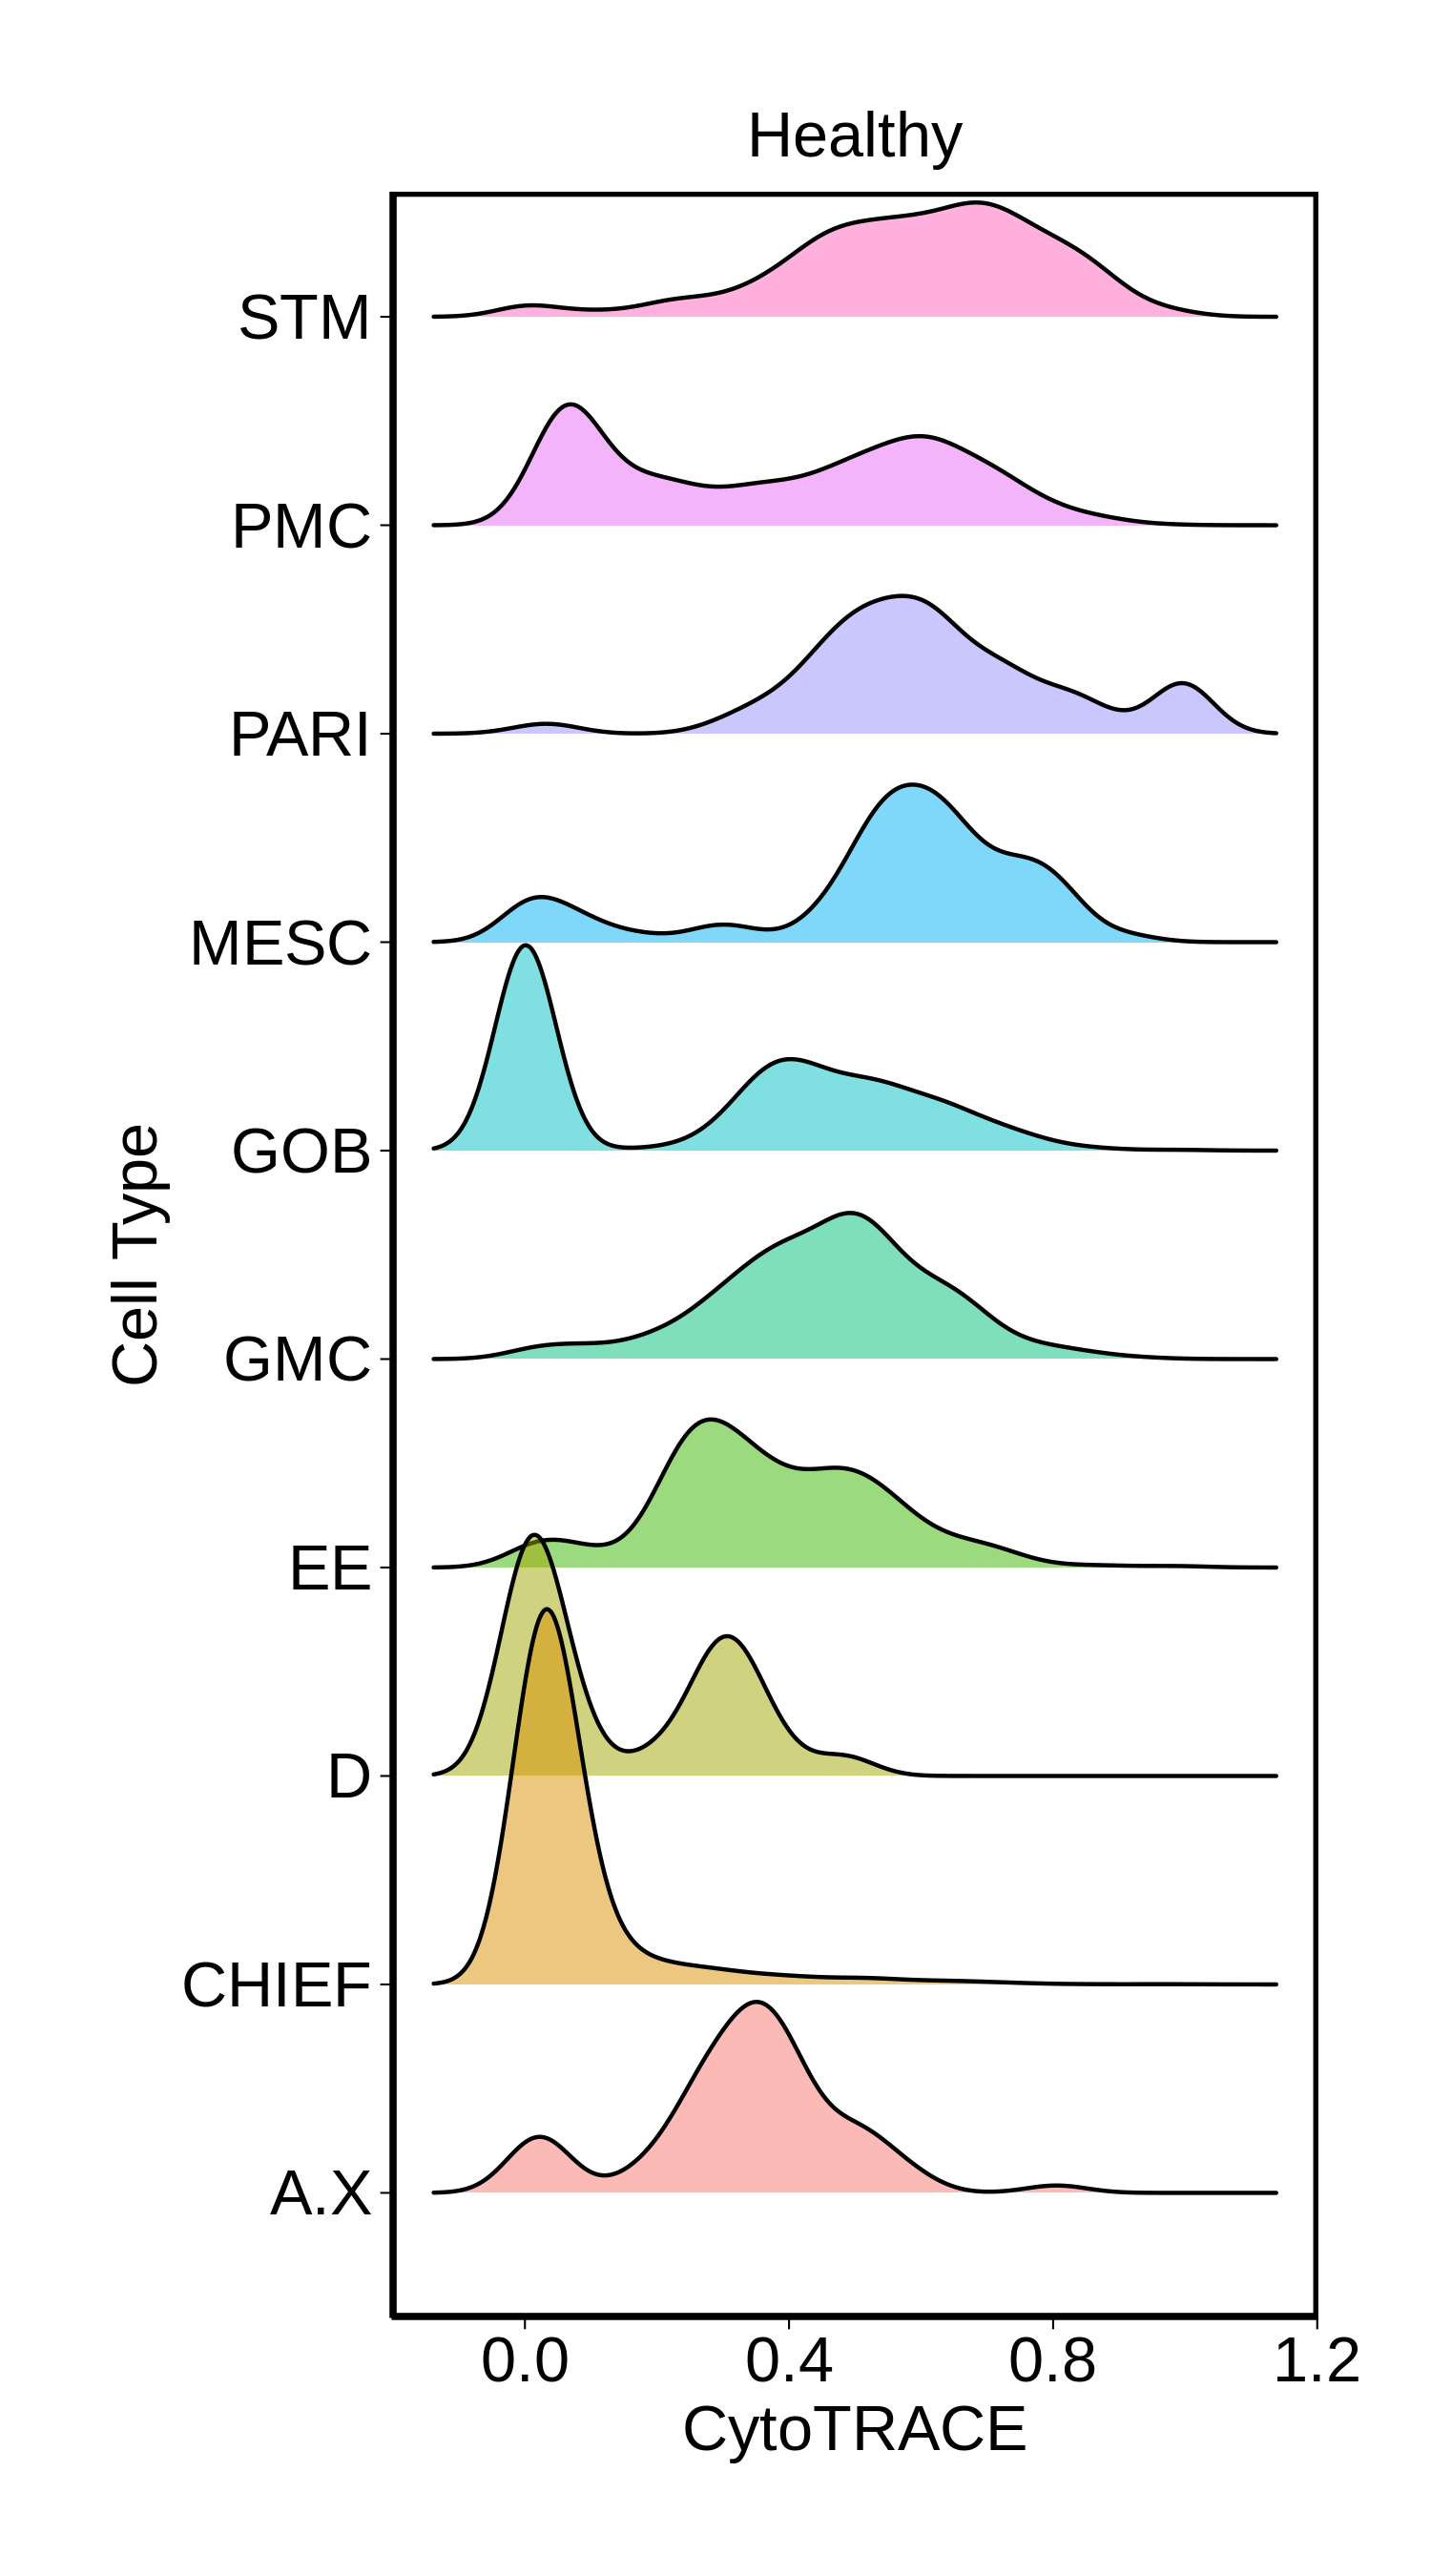
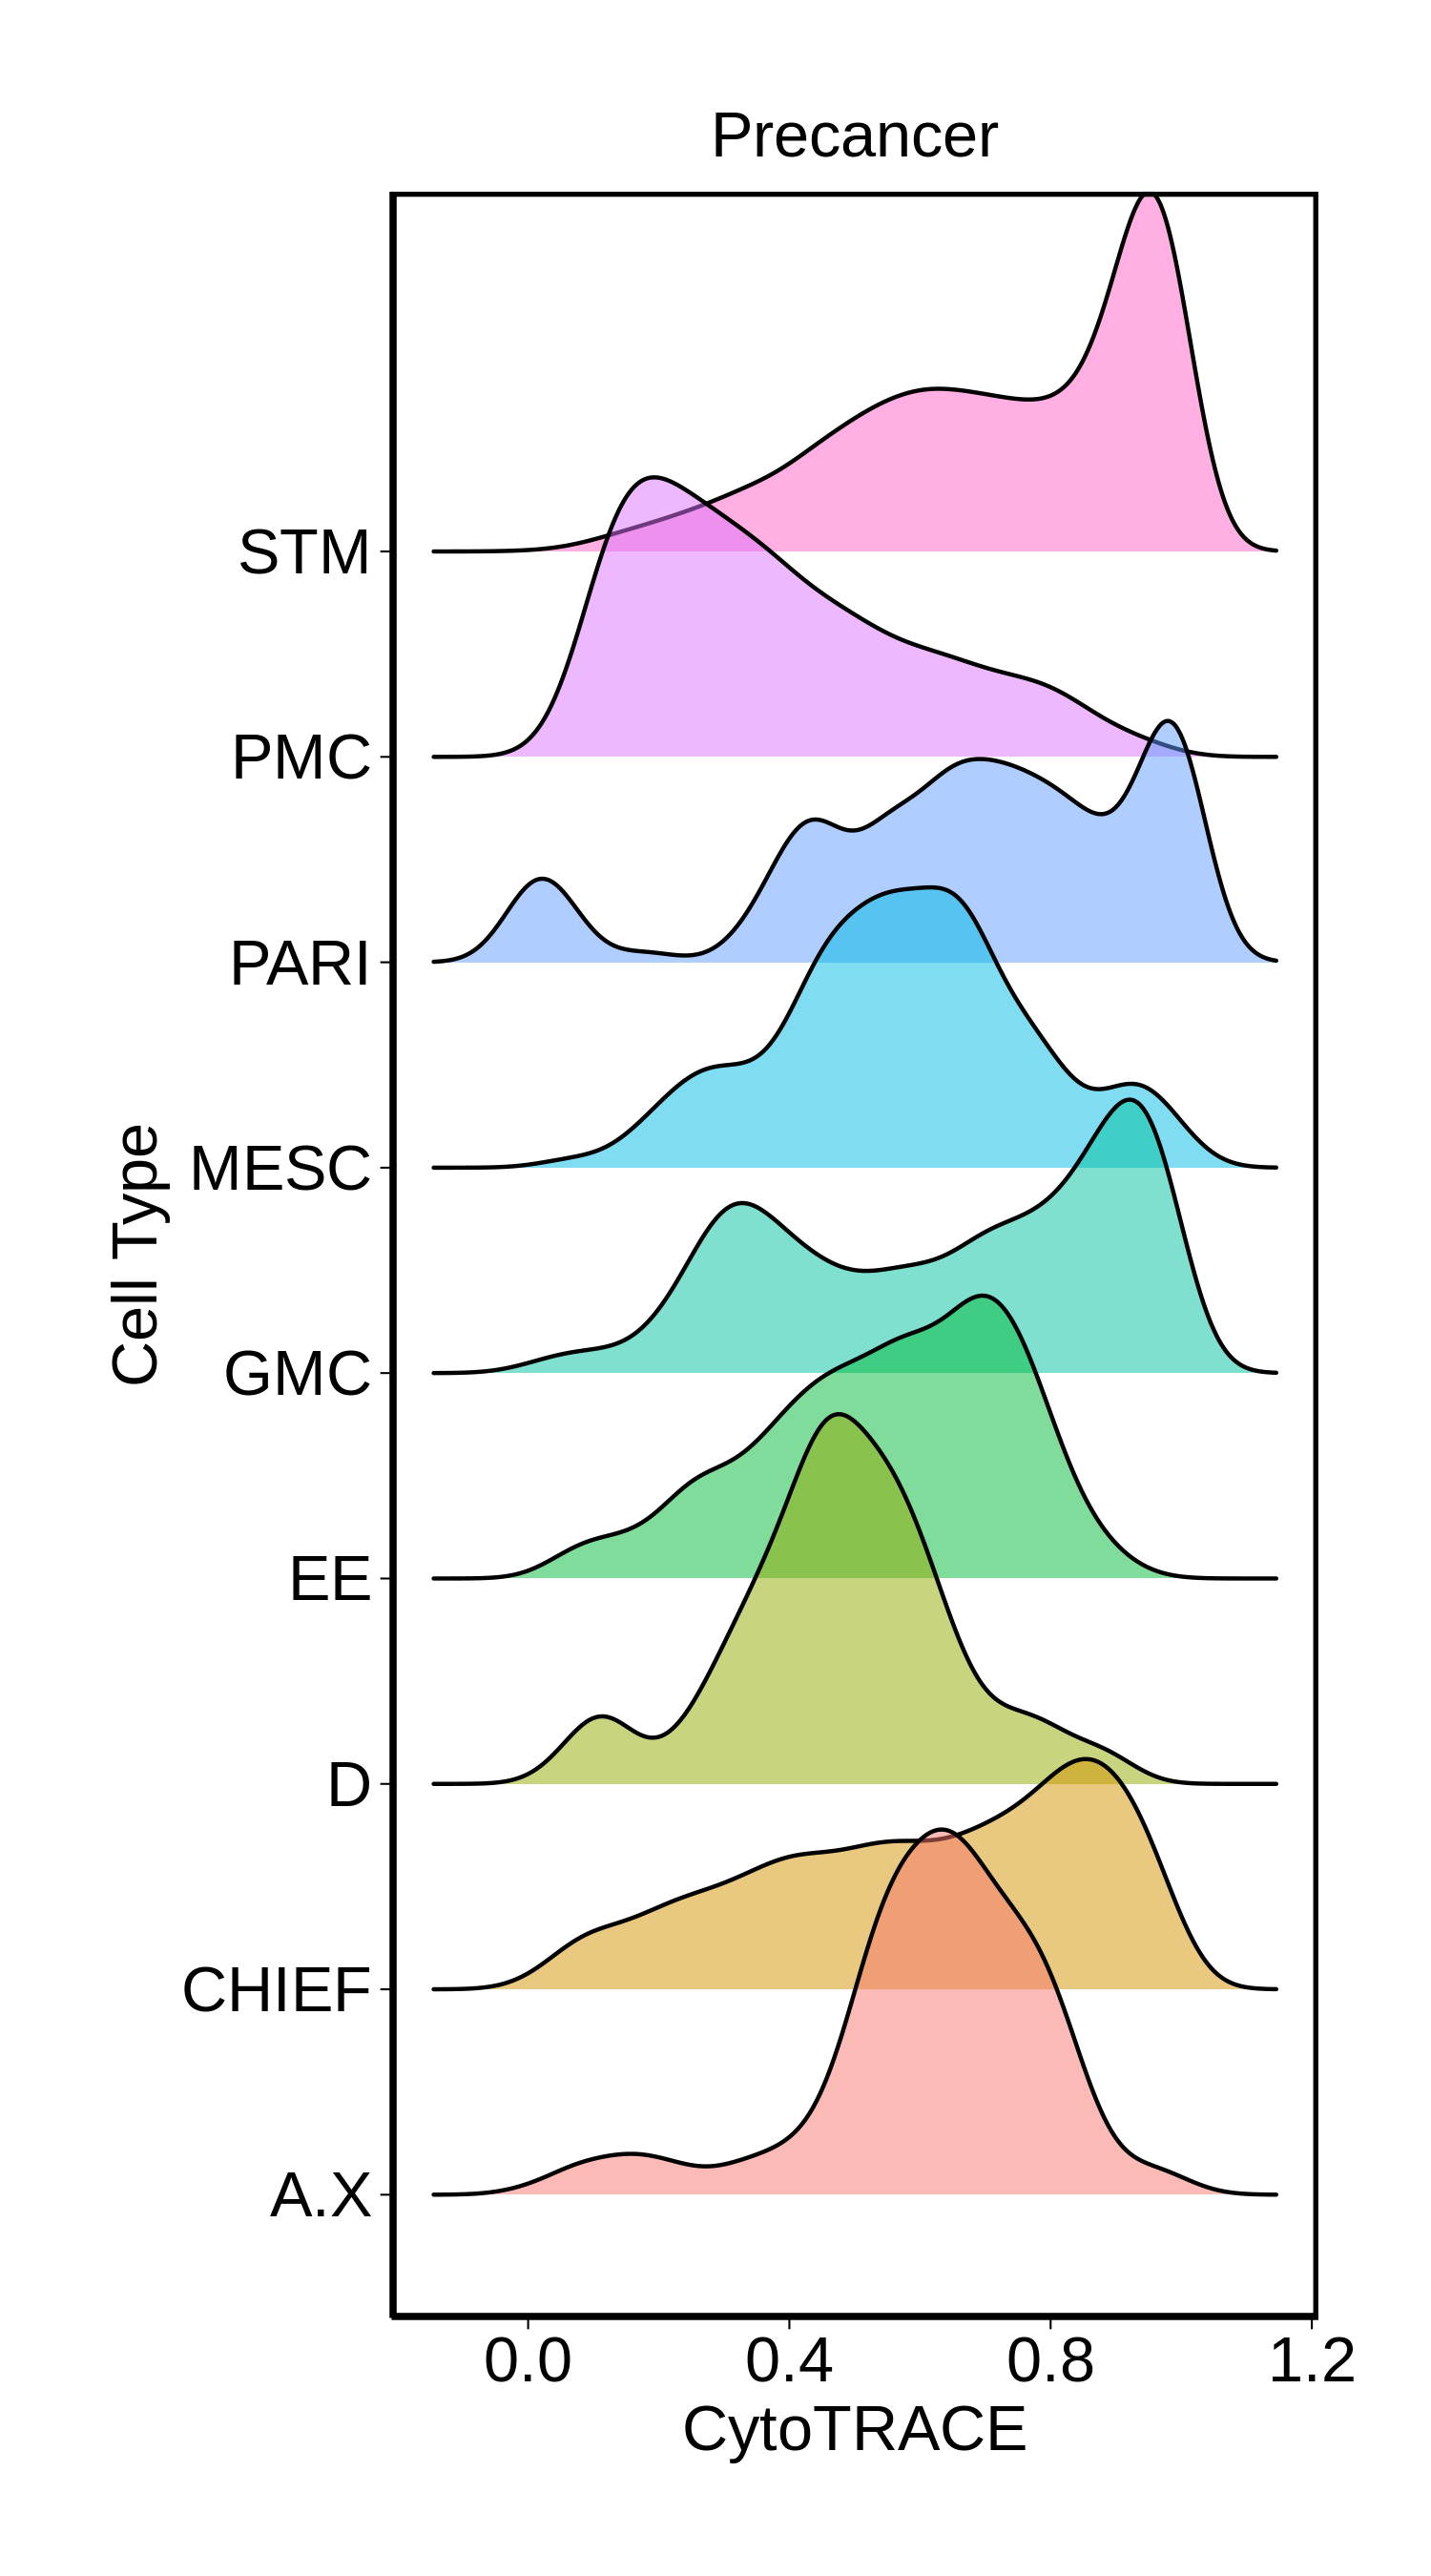
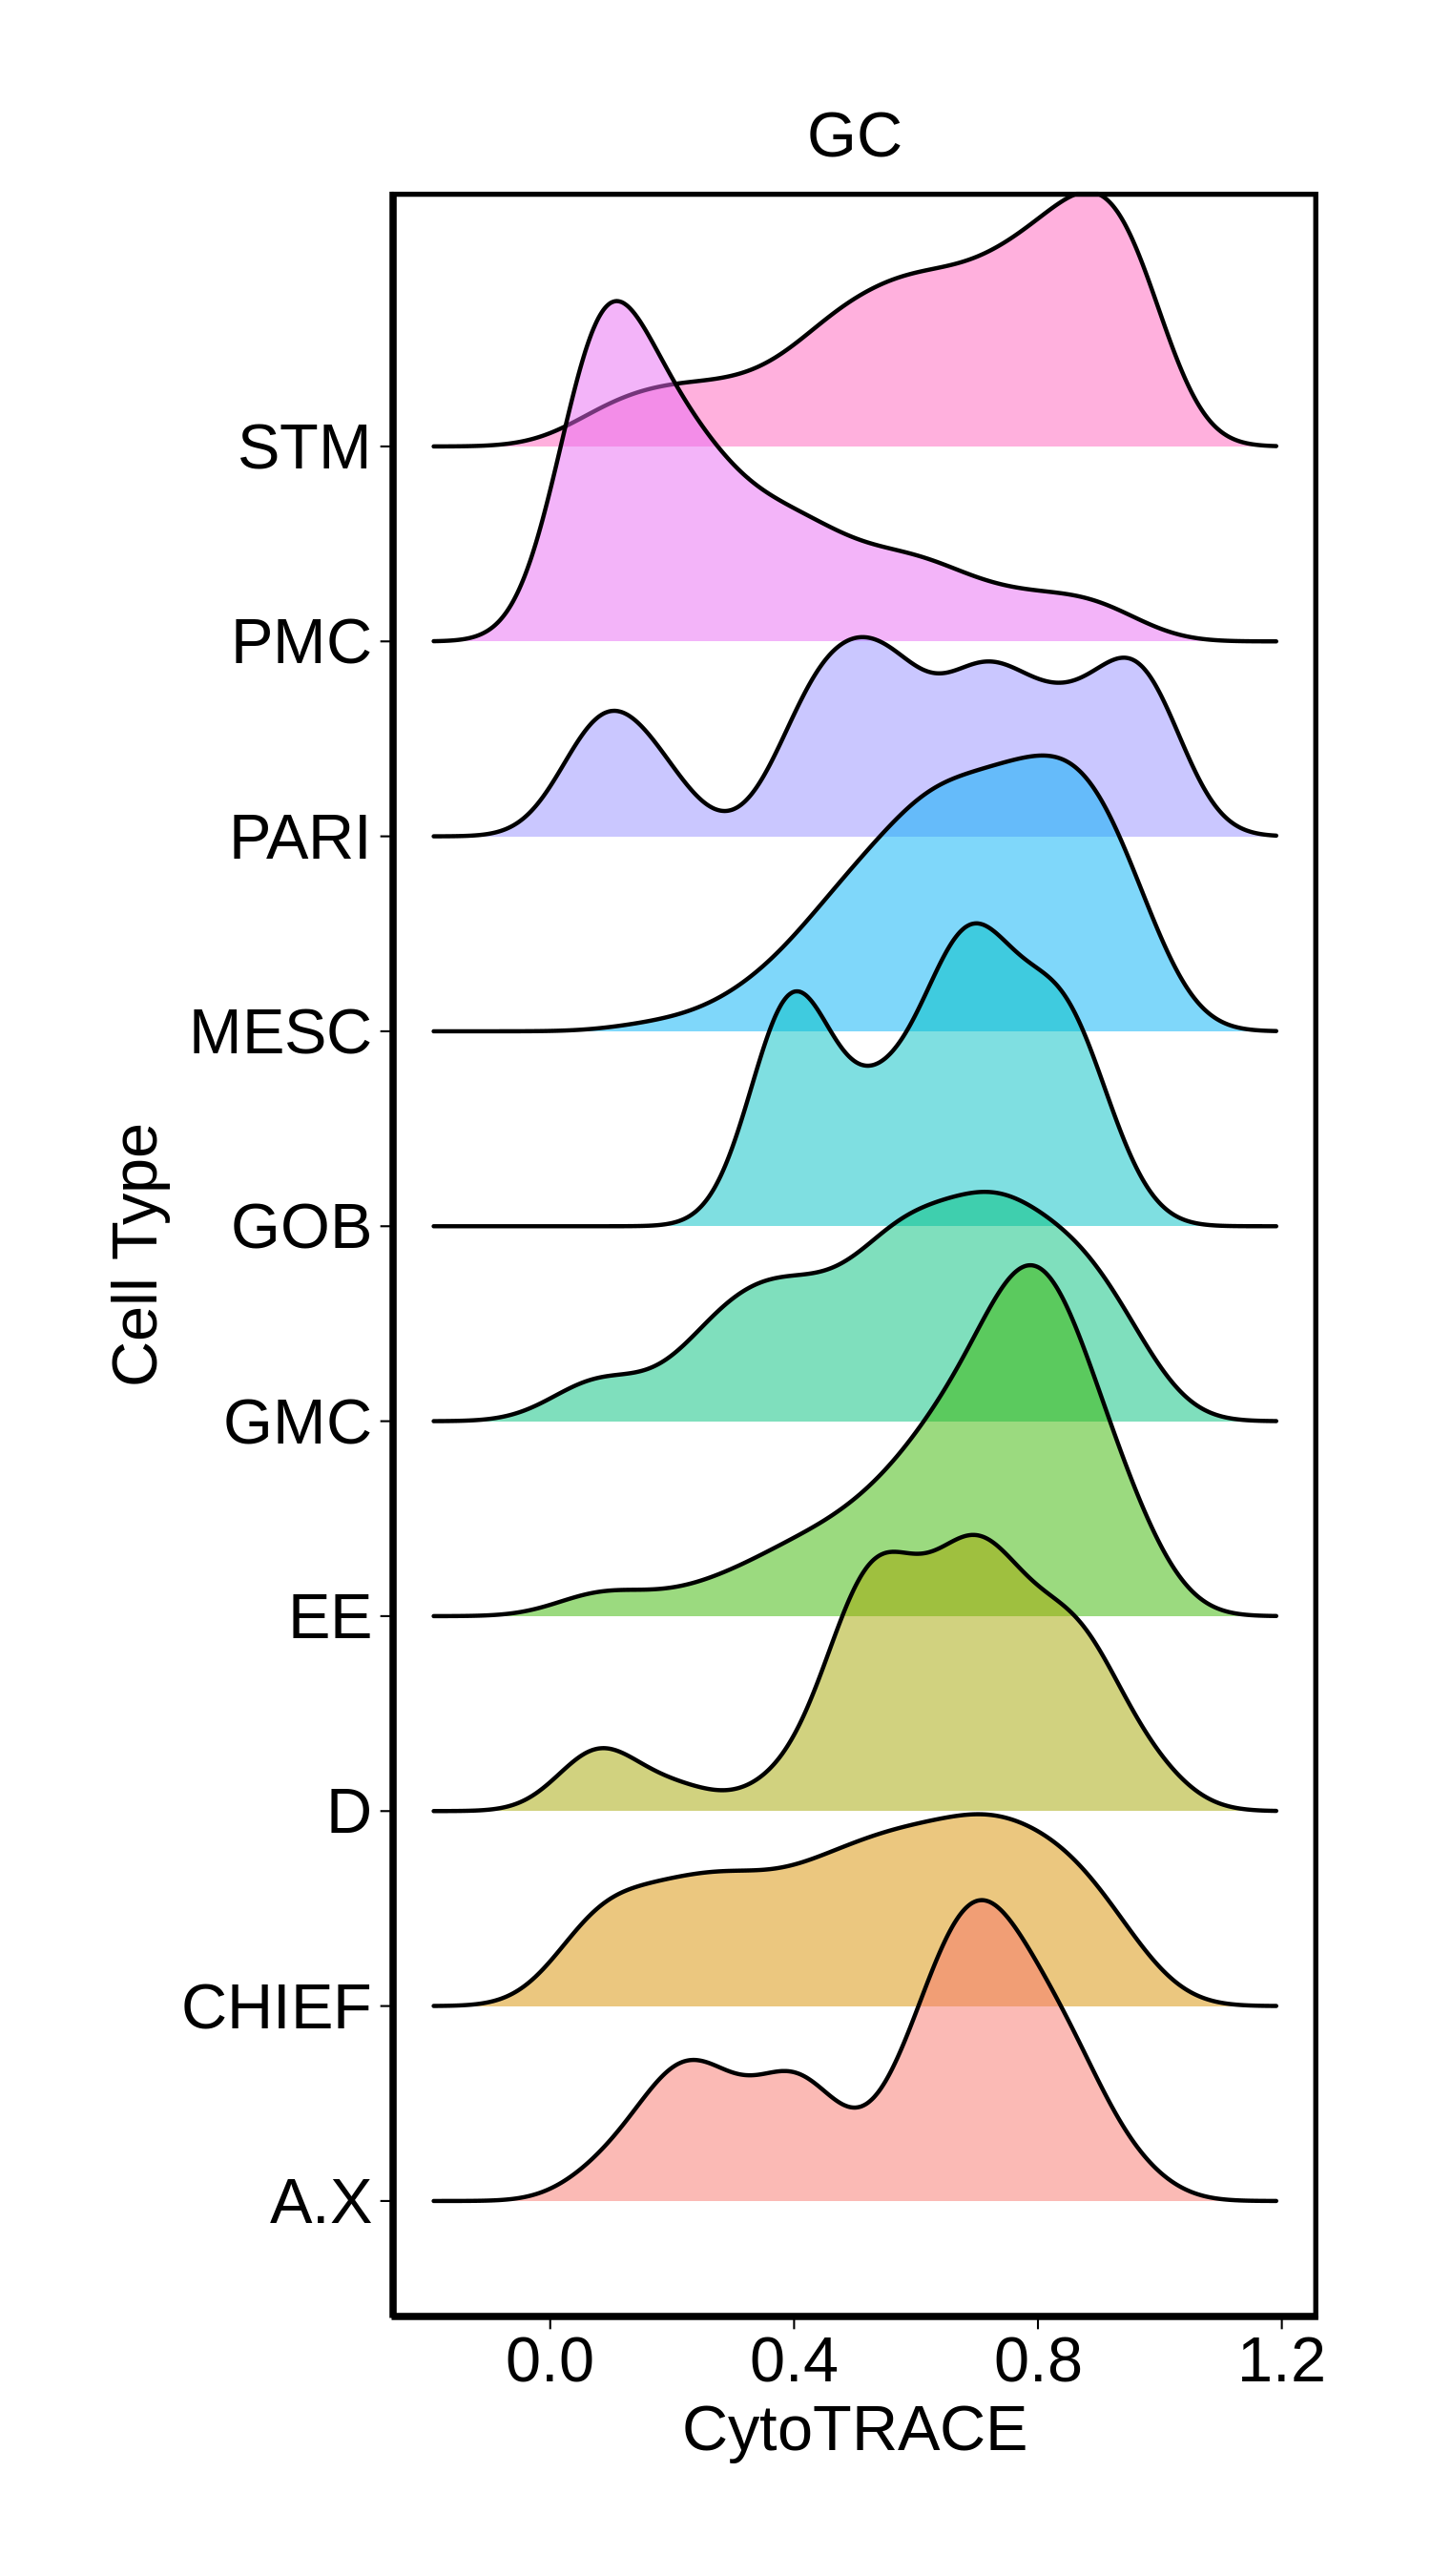
1_developmental_potential_in_Healthy.png shows the analysis results of stemness, senescence, and metaplasia signatures2_developmental_potential_in_Precancer.png shows the analysis results of stemness, senescence, and metaplasia signatures3_developmental_potential_in_GC.png shows the analysis results of stemness, senescence, and metaplasia signatures
∗Ridge plots of CytoTRACE score distributions for epithelial cells.

check button Cellular senescence signature (for three compartments).
Disease StateEpitheliaImmuneStromal
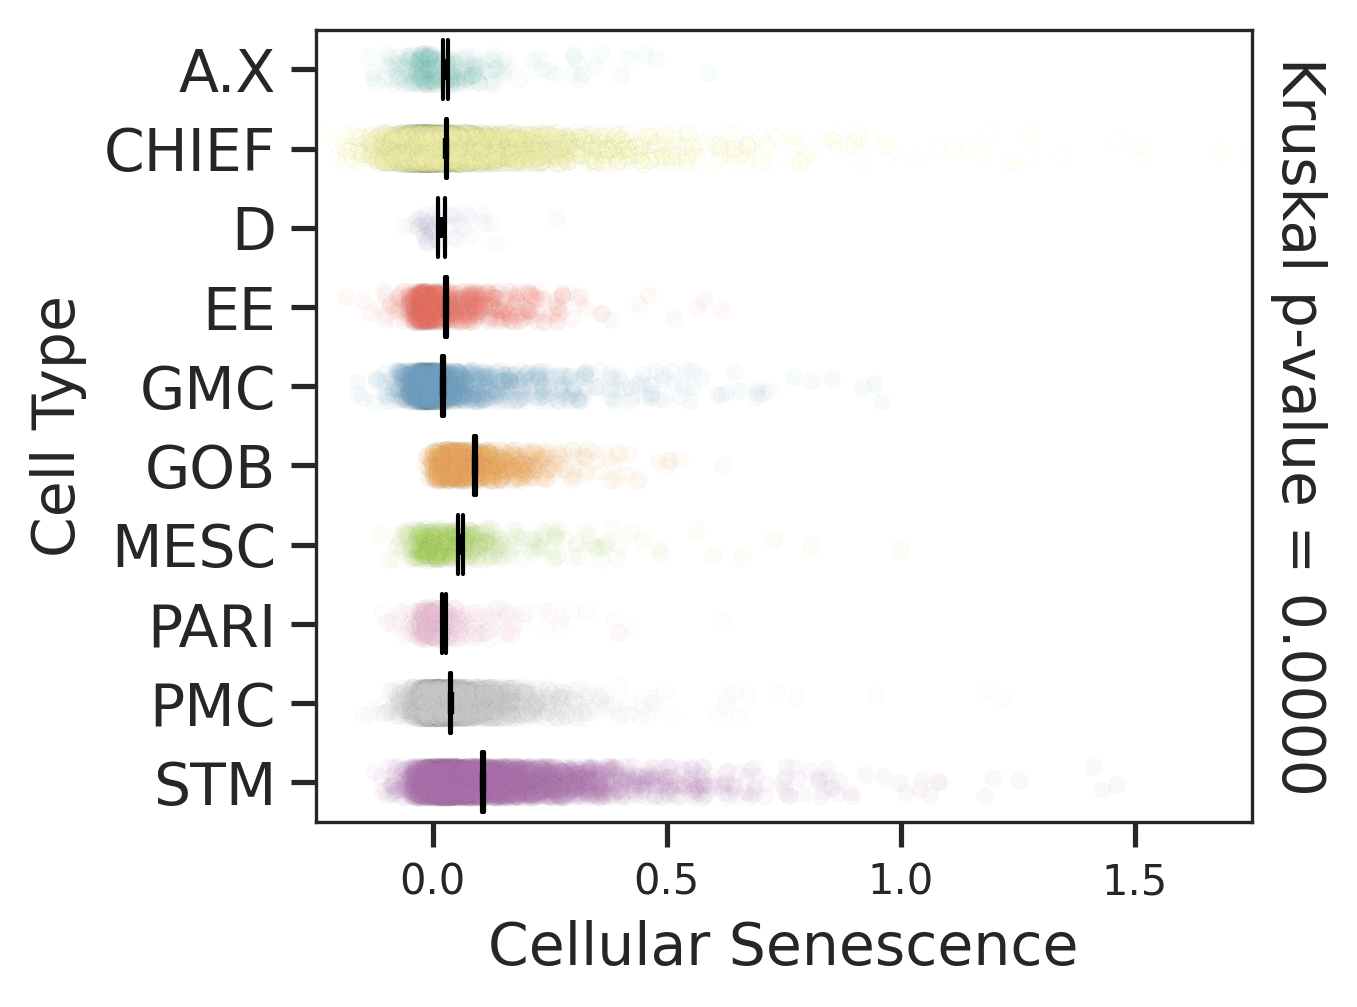
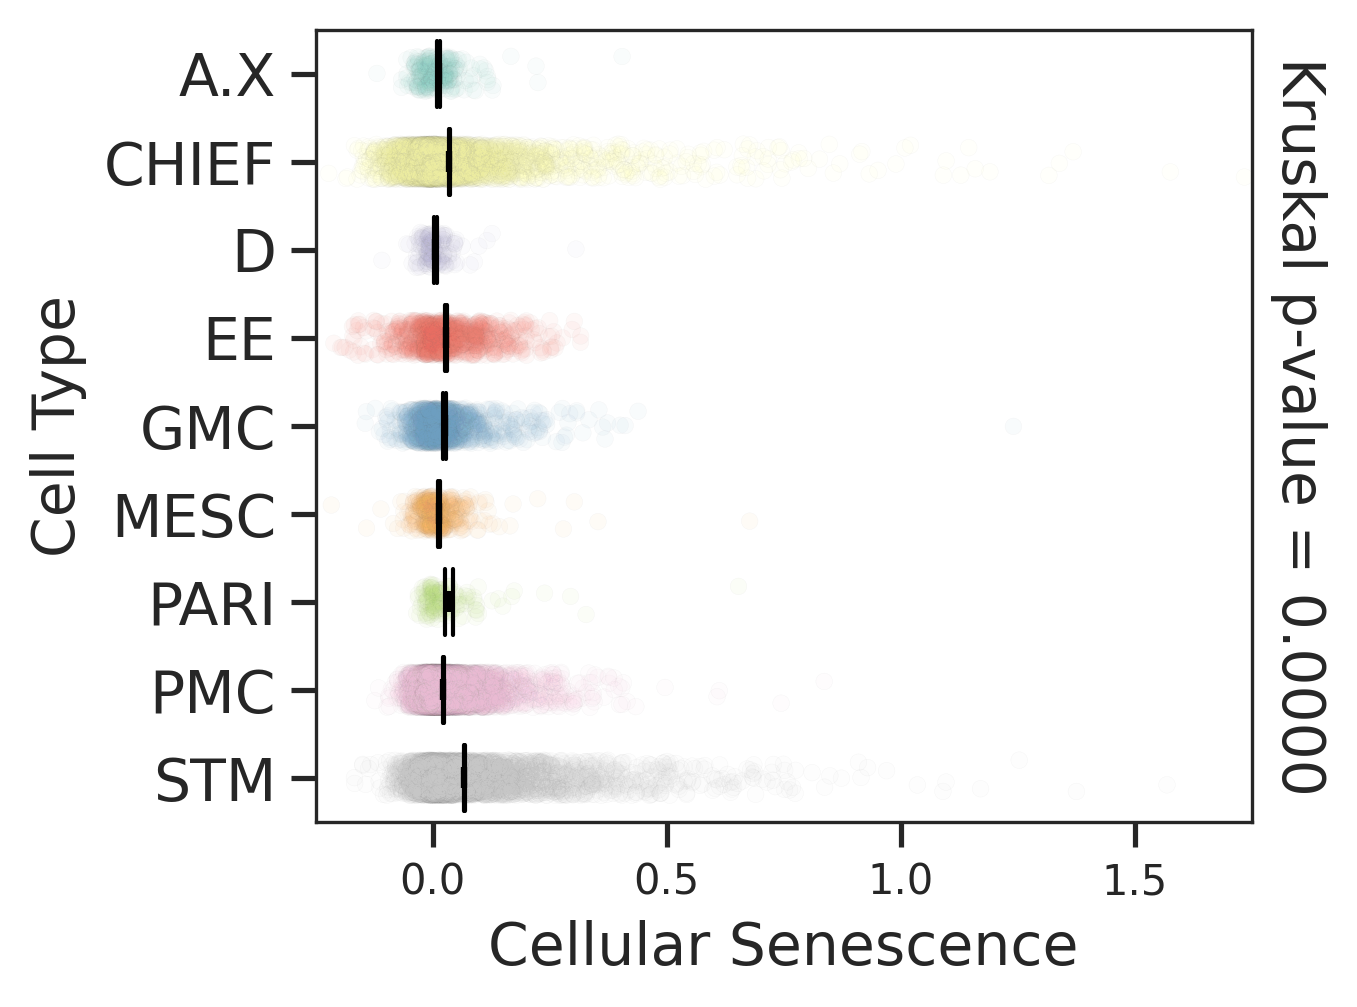
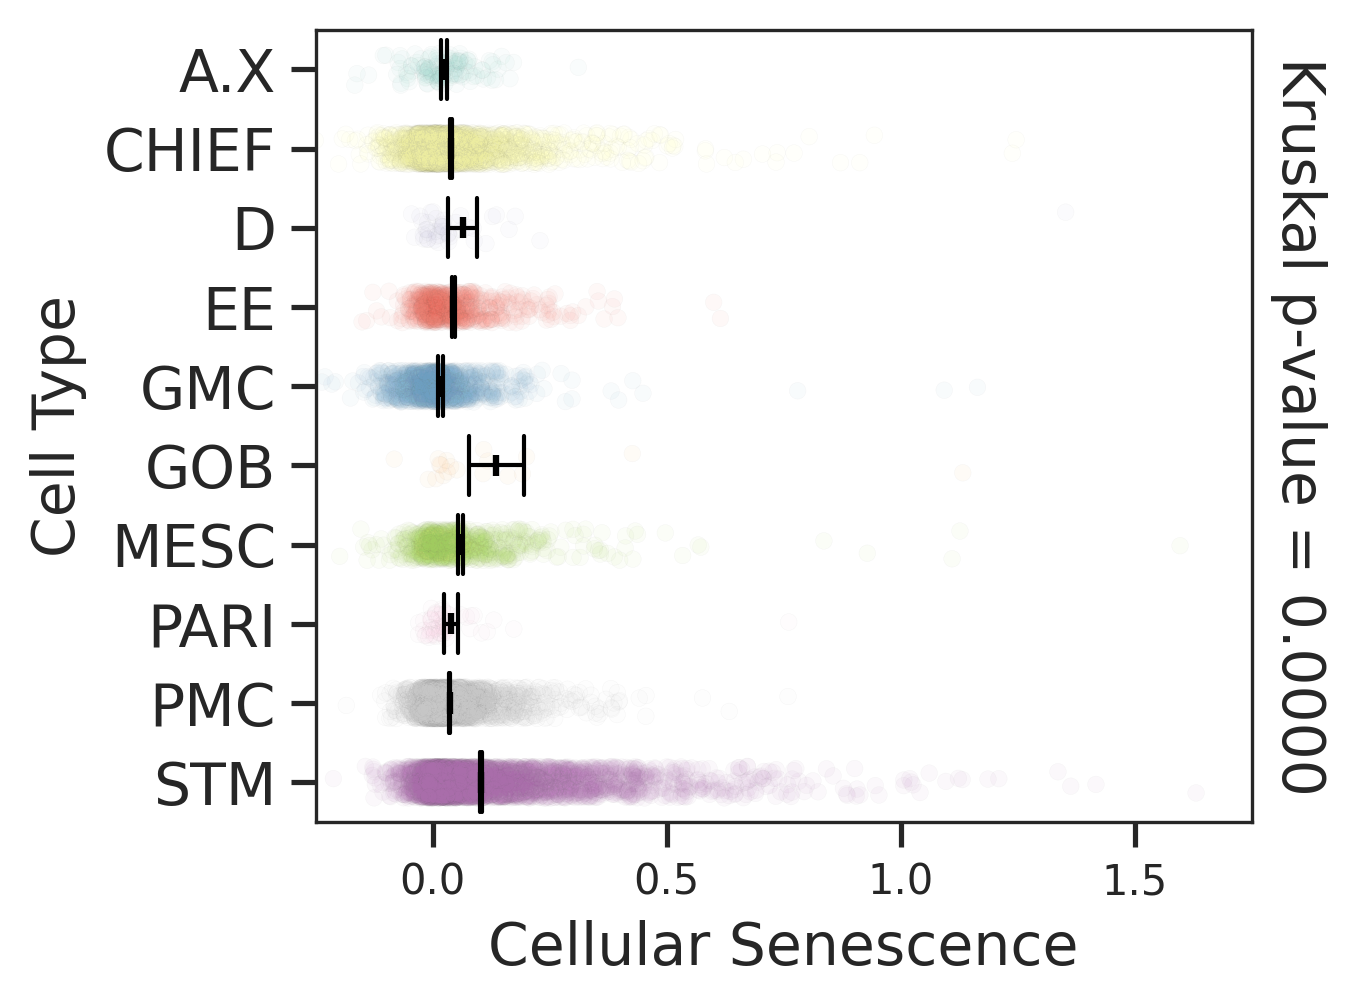
HealthyComparisons for degree of cellular senescence of epithelial compartment in Healthy-derived samples of Stomach tissue.Comparisons for degree of cellular senescence of immune compartment in ADJ-derived samples of Stomach tissue.Comparisons for degree of cellular senescence of stromal compartment in ADJ-derived samples of Stomach tissue.
PrecancerComparisons for degree of cellular senescence of epithelial compartment in Precancer-derived samples of Stomach tissue.Comparisons for degree of cellular senescence of immune compartment in Precancer-derived samples of Stomach tissue.Comparisons for degree of cellular senescence of stromal compartment in Precancer-derived samples of Stomach tissue.
GCComparisons for degree of cellular senescence of epithelial compartment in GC-derived samples of Stomach tissue.Comparisons for degree of cellular senescence of immune compartment in GC-derived samples of Stomach tissue.Comparisons for degree of cellular senescence of stromal compartment in GC-derived samples of Stomach tissue.
∗Comparisons for degree of cellular senescence among epithelial, immune and stromal cell populations of Stomach tissue with different disease states.

check button Metaplasia and damage response signature (for epithelial cells).
HealthyPrecancerGC
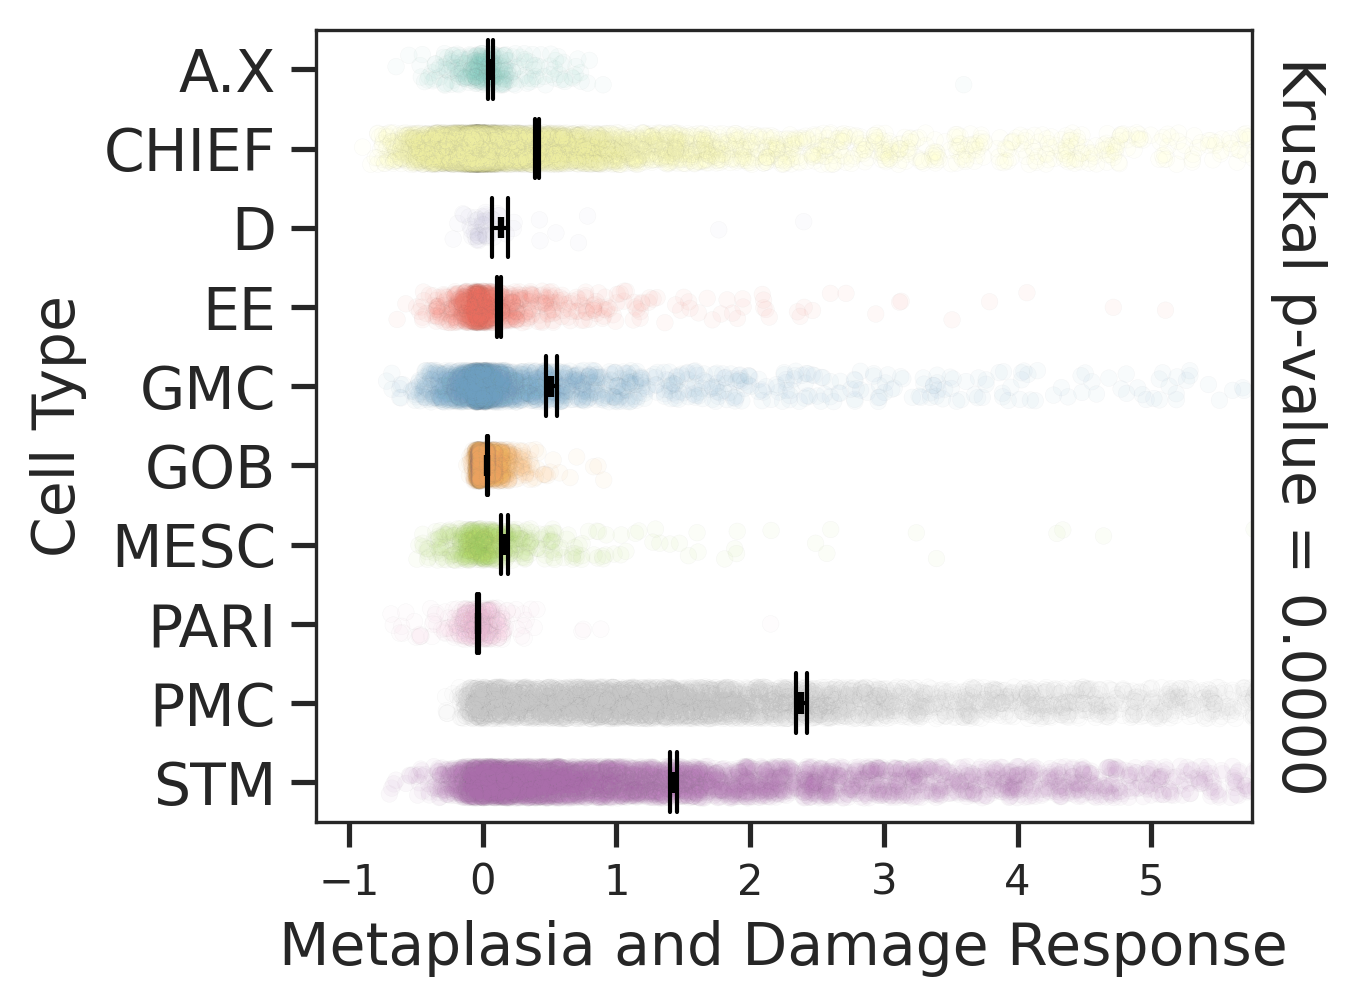
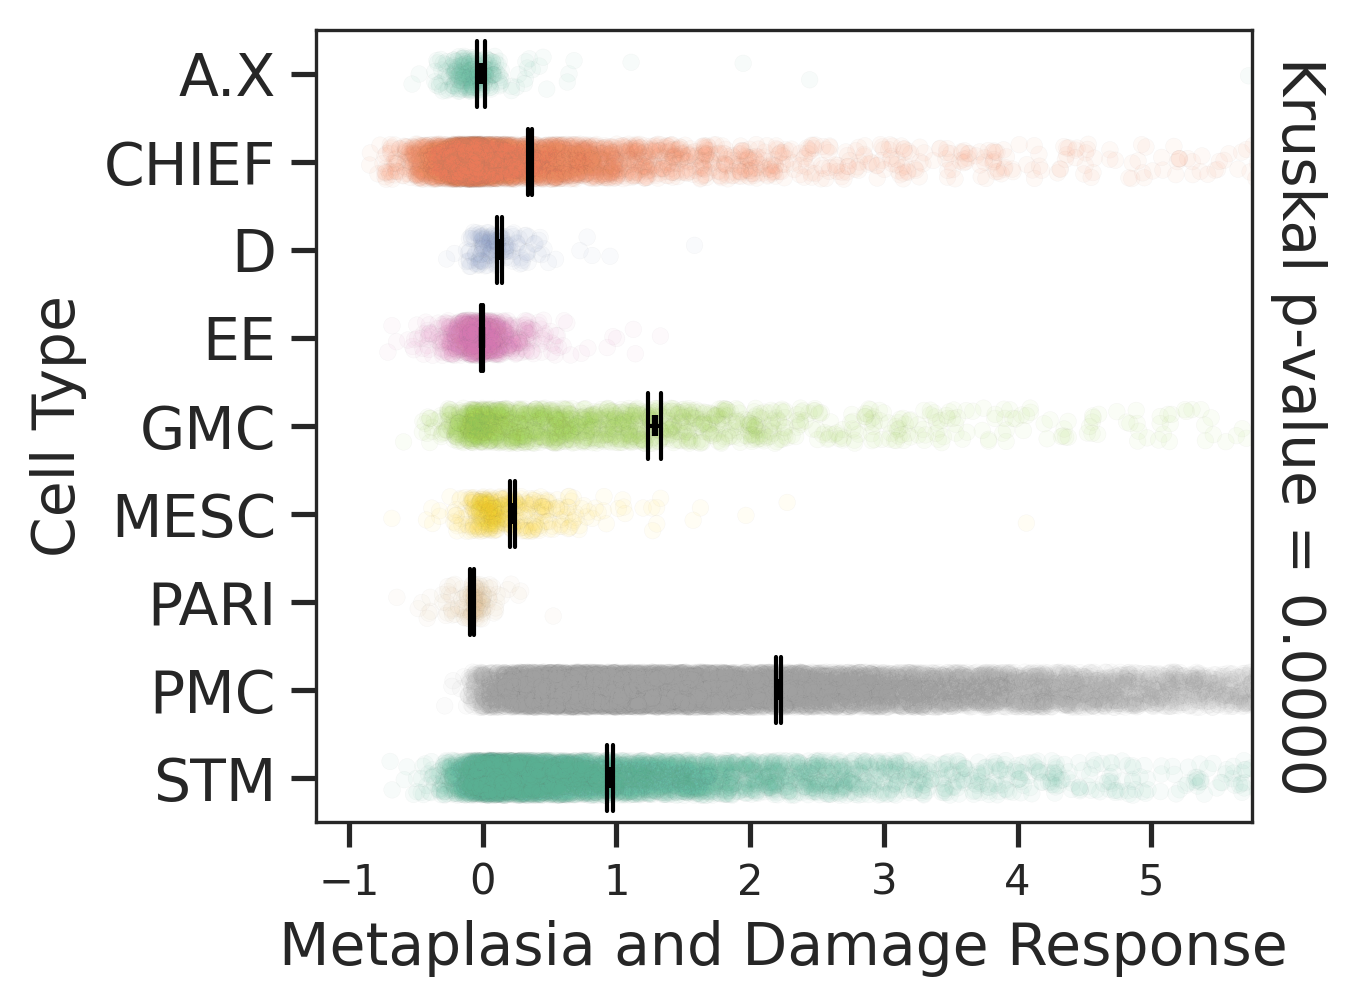
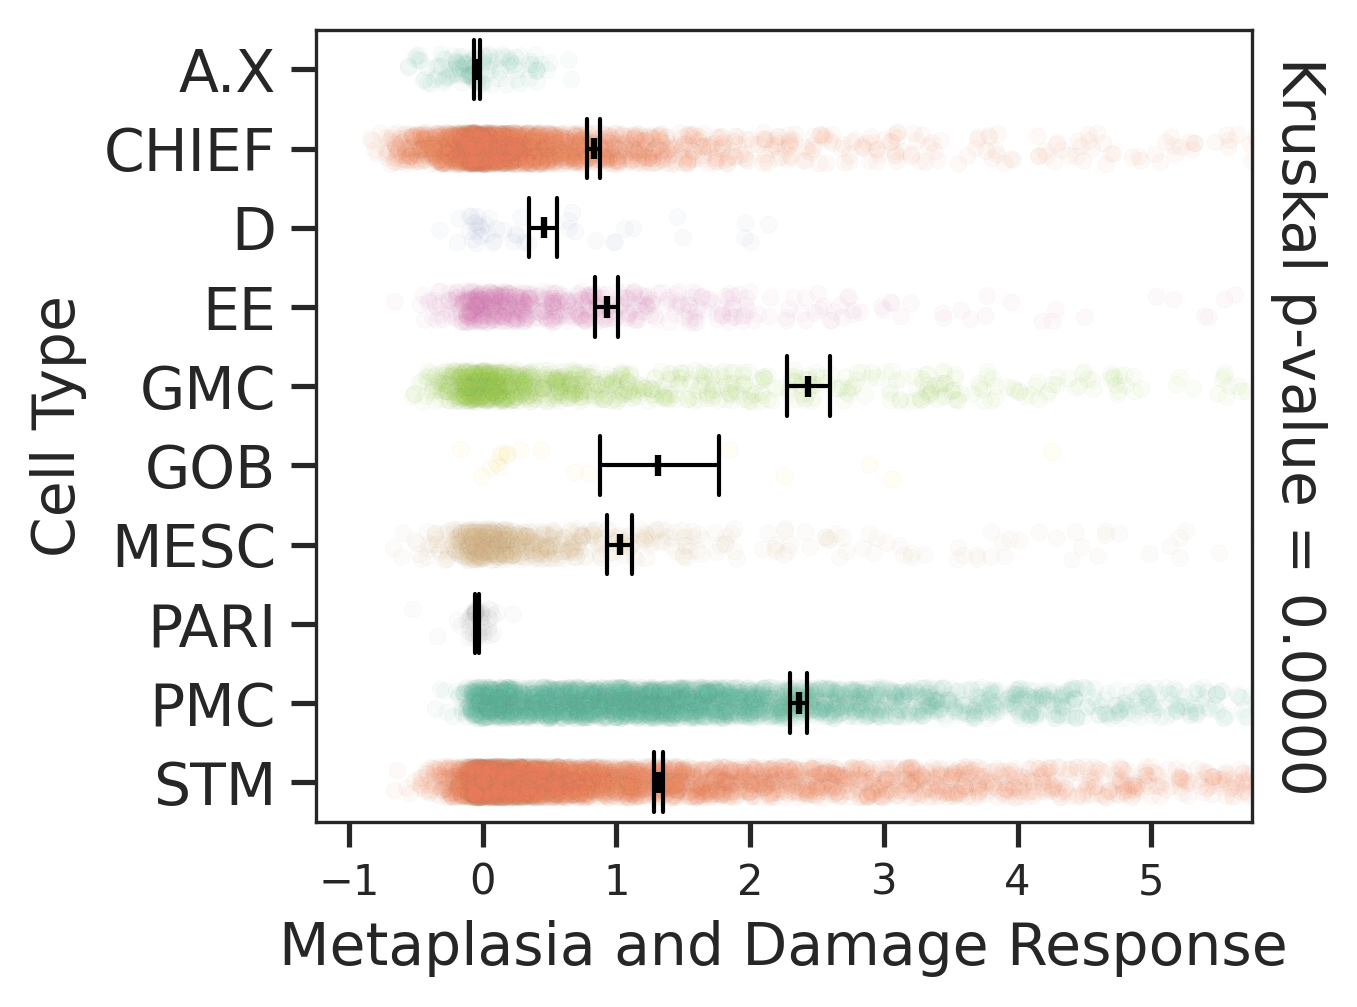
Comparisons of Metaplasia-associated damage scores among epithelial cell subpopulations.Comparisons of Metaplasia-associated damage scores among epithelial cell subpopulations.Comparisons of Metaplasia-associated damage scores among epithelial cell subpopulations.
∗Comparisons of Metaplasia-associated damage scores among epithelial cell subpopulations.

check button Neoantigen-specific TCR clonotypes (NeoTCR) signature.
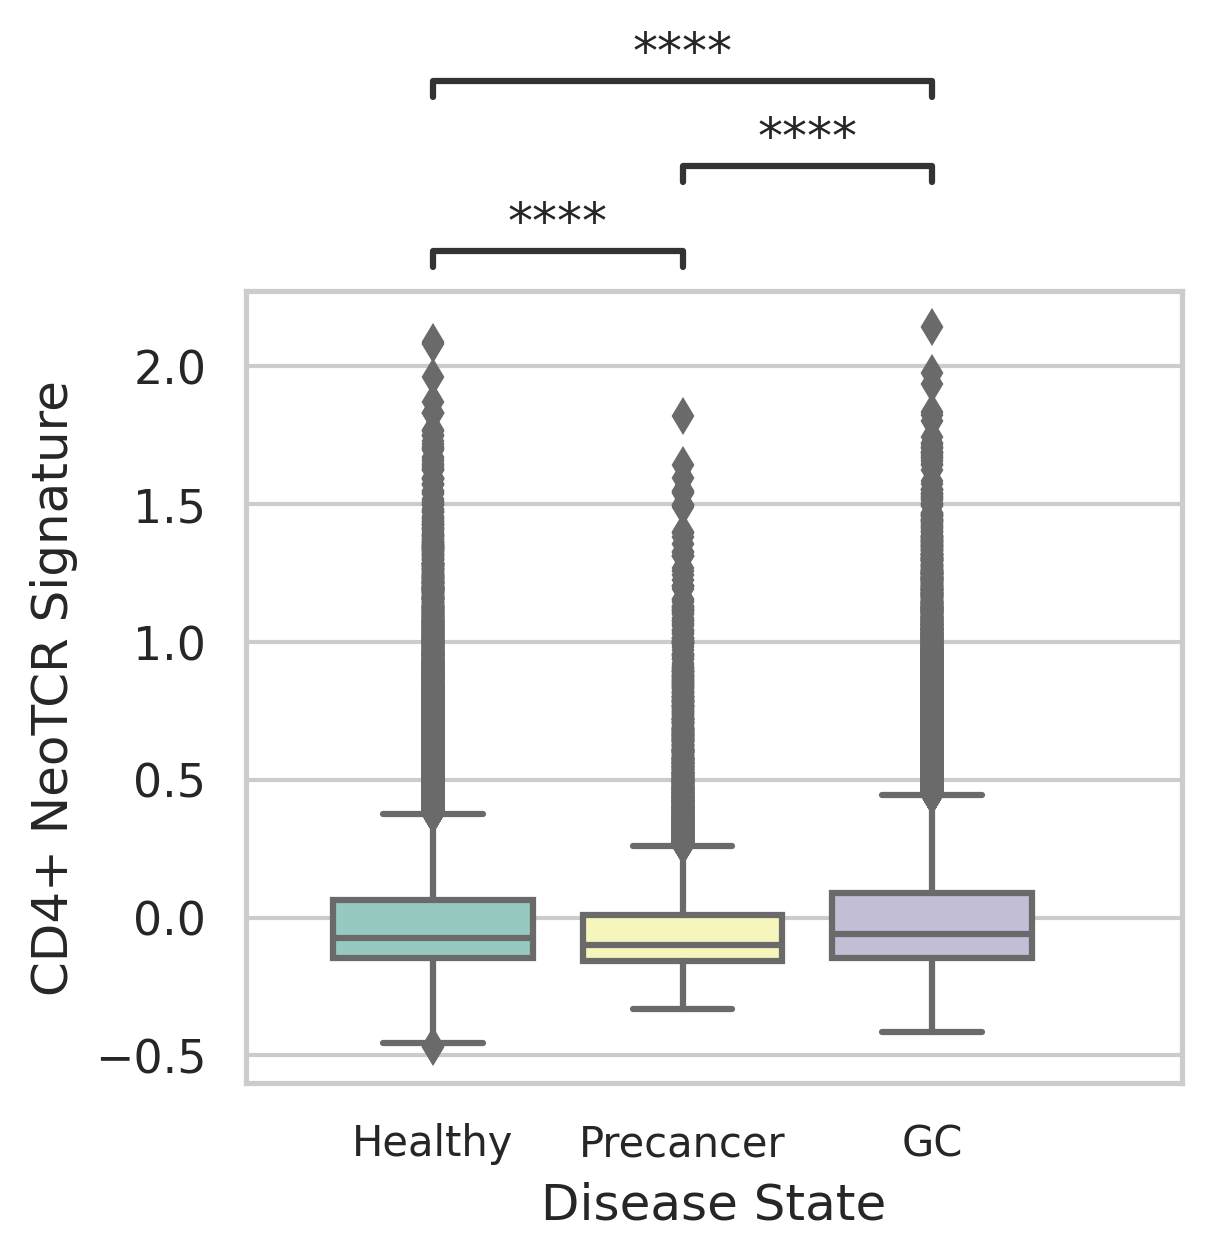
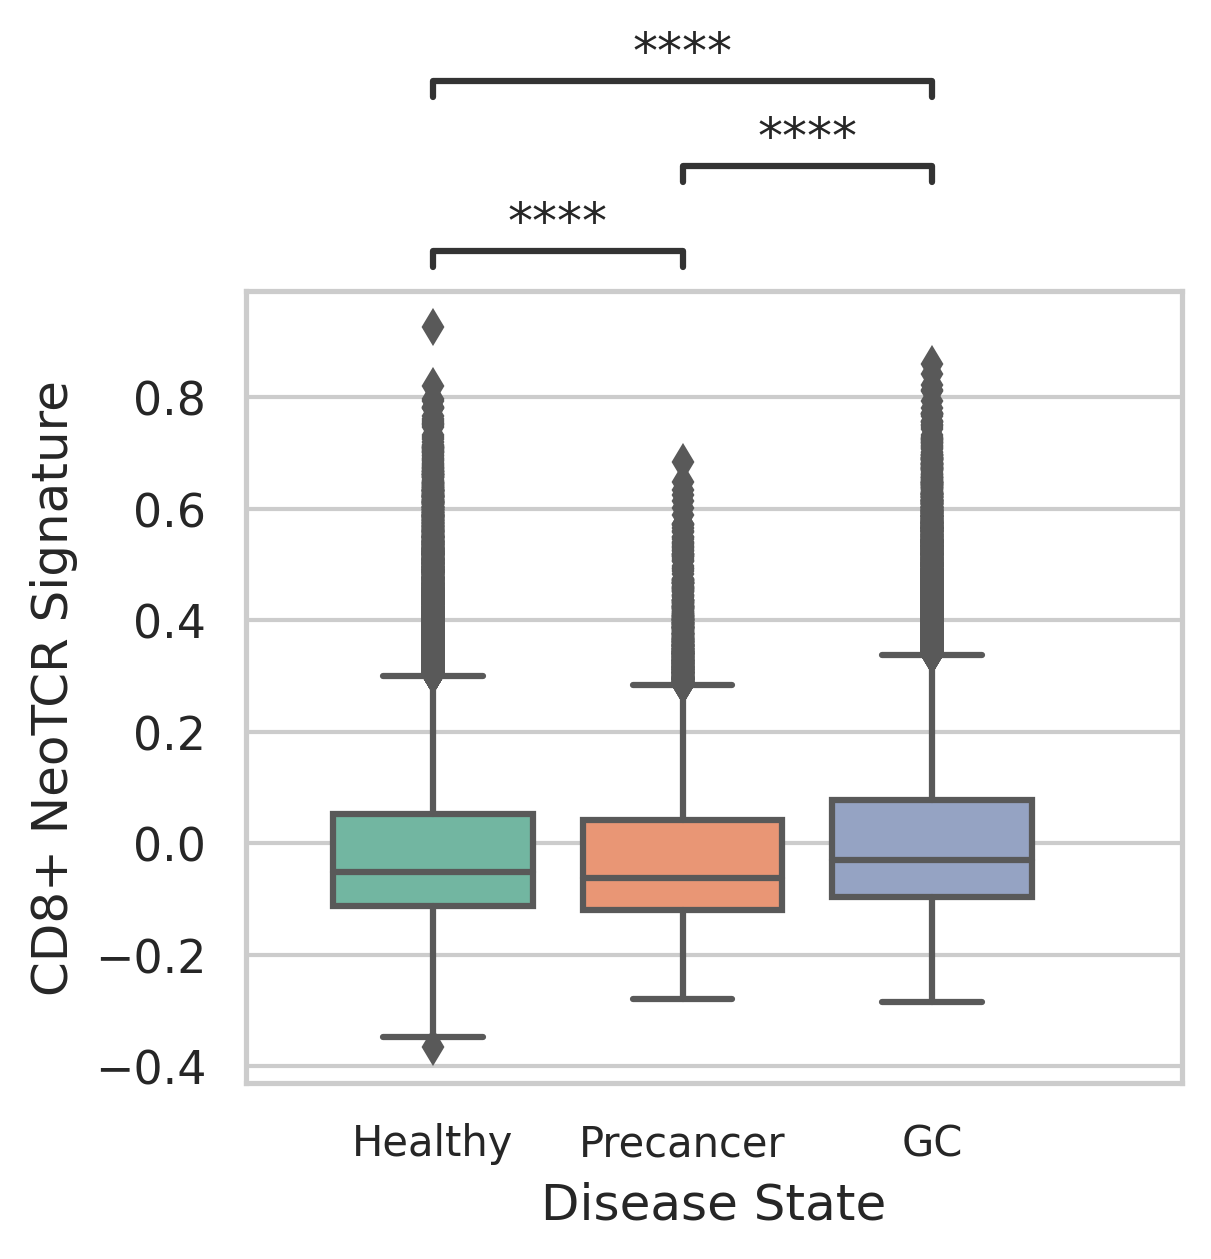
Comparisons of CD4+ and CD8+ NeoTCR signature scores among different disease states.Comparisons of CD4+ and CD8+ NeoTCR signature scores among different disease states.
∗Comparisons of CD4+ and CD8+ NeoTCR signature scores among different disease states.