
|
Home |
Download |
Statistics |
Help |
Contact |
About PCTanno
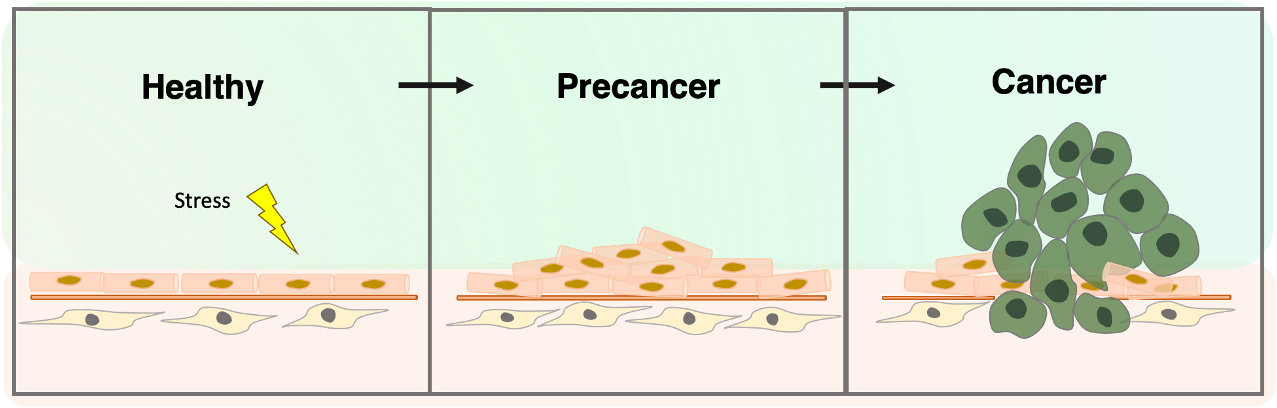
The PCTanno database includes 62 datasets from 57 single cell RNA-sequencing (RNA-seq) studies, 12 whole exome sequencing (WES), 12 bulk RNA-seq datasets that across 13 organs from healthy to premalignant lesion to cancer. We carried out functional impact prediction of mutations. PCTanno provides systematic functional annotations of the dynamic biological processes involved in tumorigenesis, including the cell annotations, cell composition by disease state, uniform manifold approximation and projection (UMAP) plots, inferred CNV and somatic mutations, differentiation trajectory inference, cell-cell communication, gene regulatory network inference, gene ontology and pathway enrichment analysis. The application of PCTanno will help to identify novel biomarkers across transitions from healthy to diseased tissues, and dissect the sequential molecular and cellular events that promote oncogenesis leading to precision prevention and interception strategies.
∗Logo description: The atlas of critical transition in cancer: from pre-cancerous lesions (pink) to local malignancy(green), invading through the basement membrane into deeper tissue layers. This transition involves complex interactions between pre-malignant, malignant, and/or non-malignant cells within the tumor ecosystem.
 Search by gene
|
|
Search by tissue
|
|
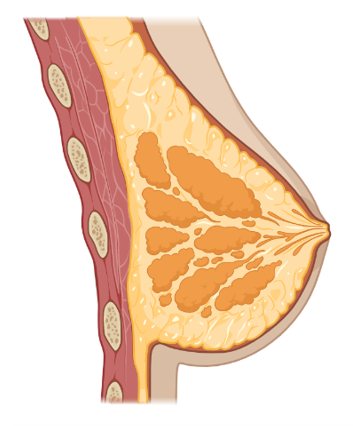
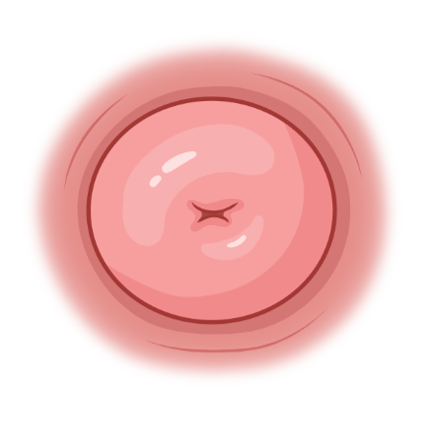
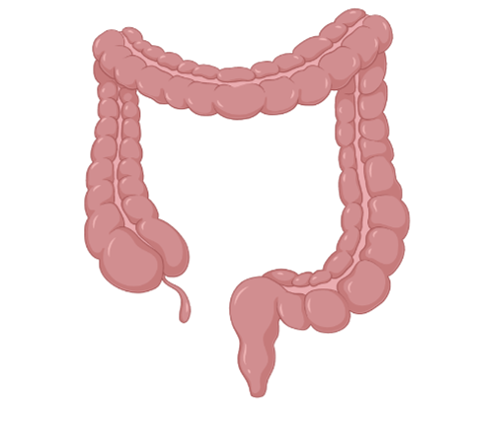
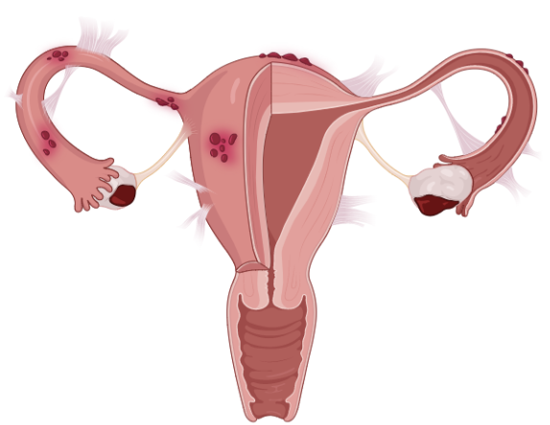
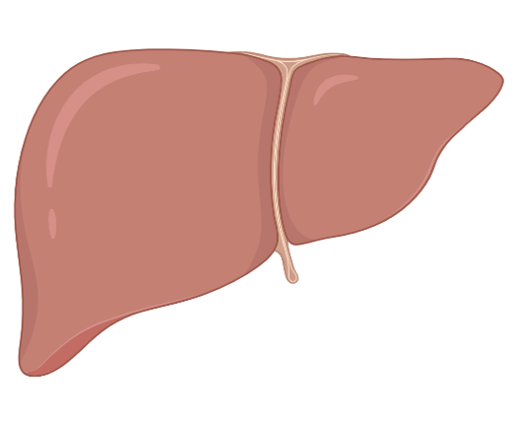
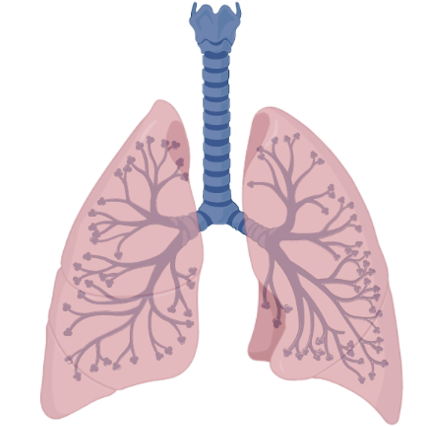
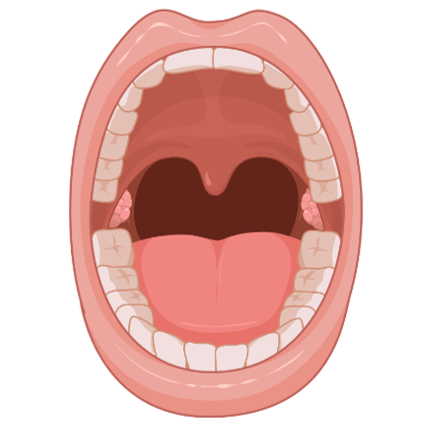
Browse by tissue
We performed expression dynamics analysis to delineate transcriptomic changes that occur on the phenotypic continuum from healthy tissues to invasive carcinoma. And we detected 14,193 unique genes in 13 human tissues. For each tissue type, the malignant transformation related genes are listed as below (Tissue: number of malignant transformation related genes).


Copyright 2023-Present -The University of Texas Health Science Center at Houston
Web File Viewing | Emergency Information |Site Policies Free-Counters