
|
Home |
Download |
Statistics |
Help |
Contact |
Instructions for Navigating the Site
1. PCTanno information2. Understanding gene annotation of PCTanno
a. Search by Gene symbol or Entrez gene ID, example: Gene symbol: HNF4A, Entrez gene ID: 3172
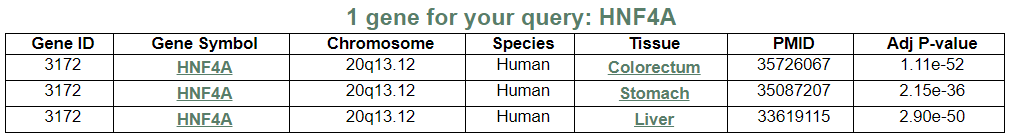
b. Gene search result page
c. Gene annotation result page
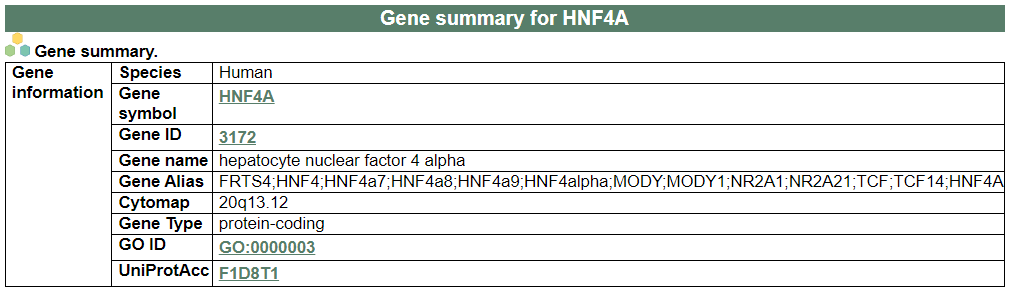
i. Gene summary
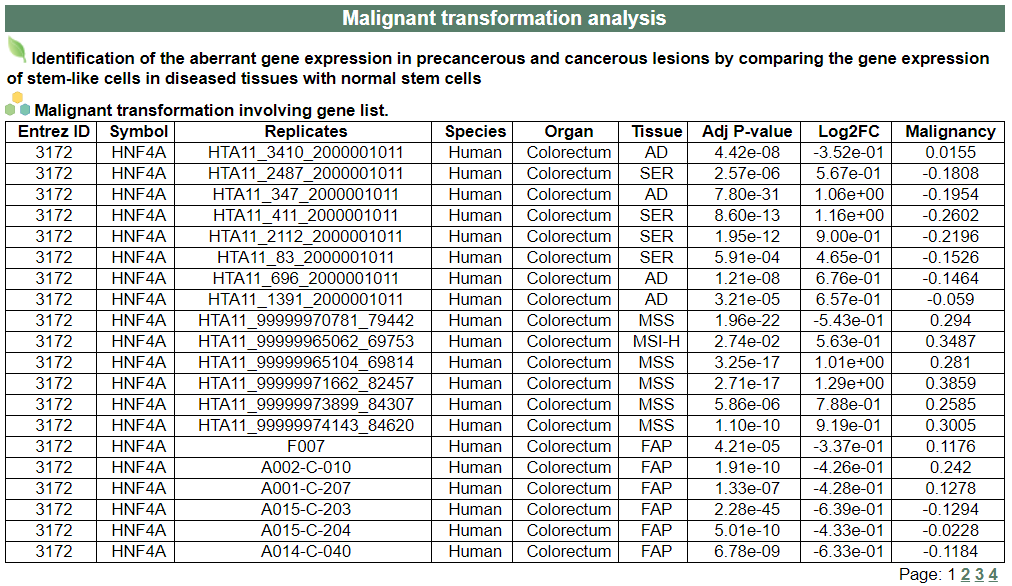
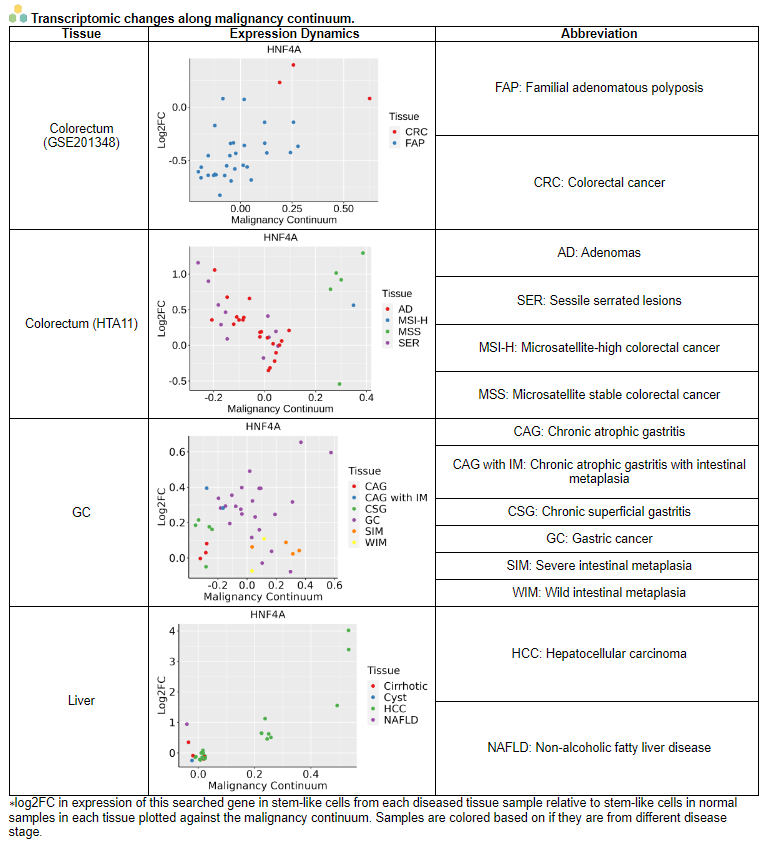
ii. Malignant transformation analysis
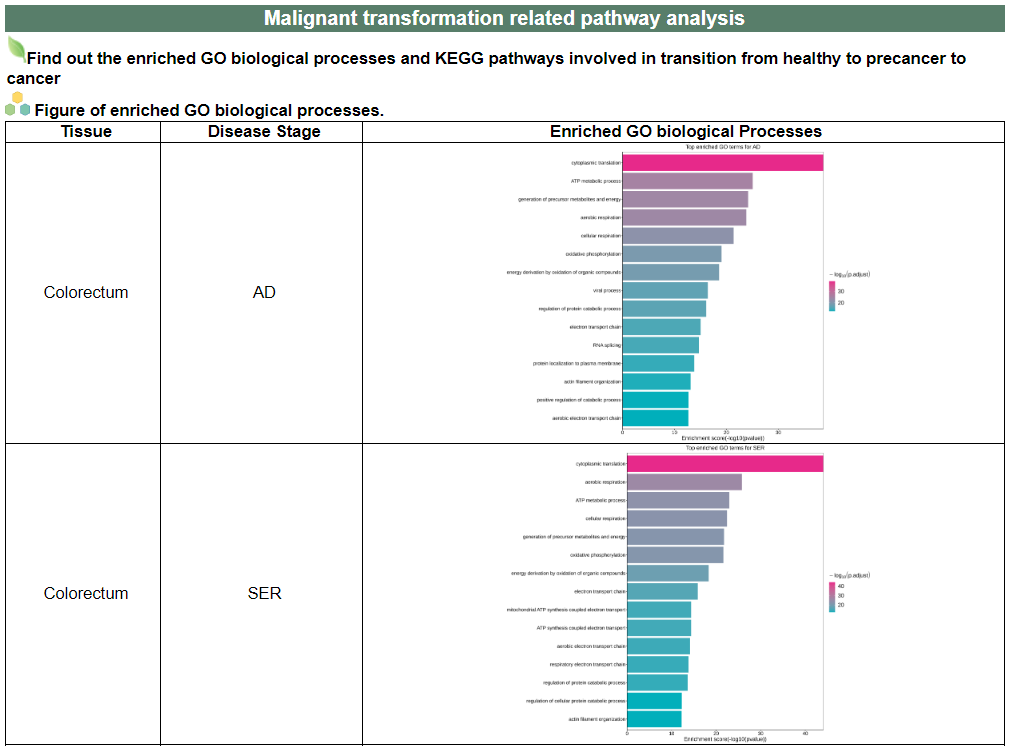
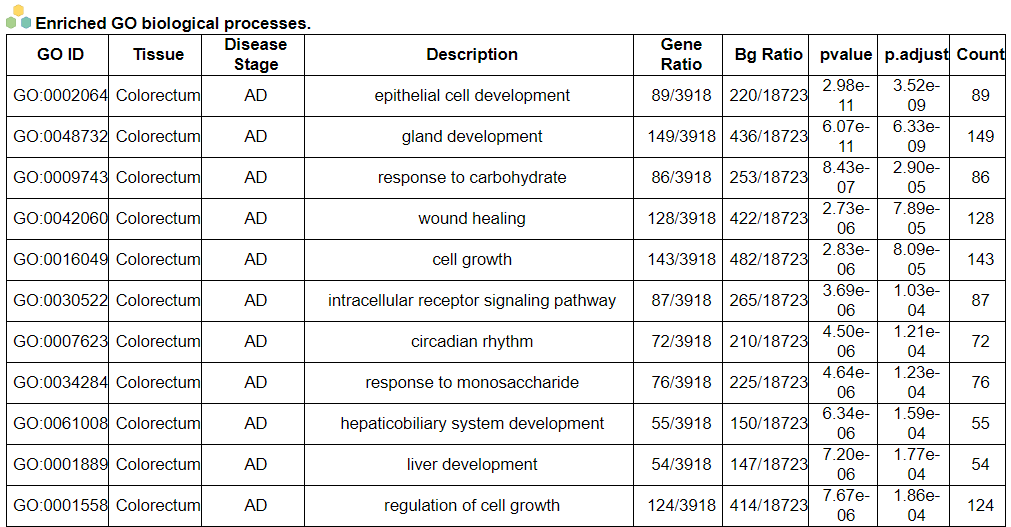
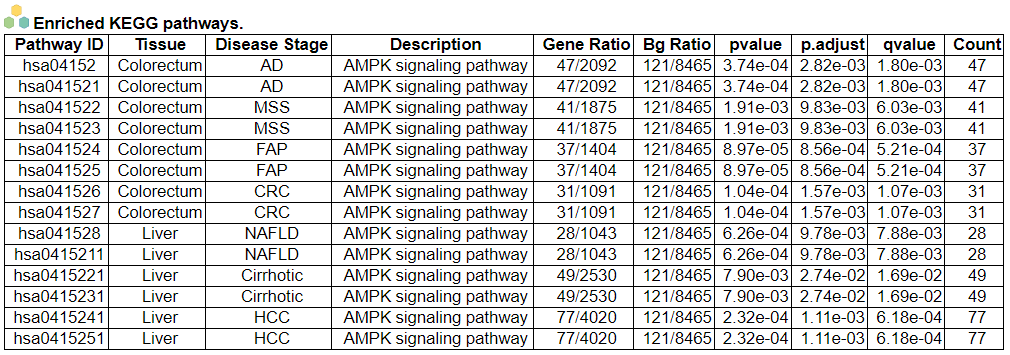
iii. Malignant transformation related pathway analysis
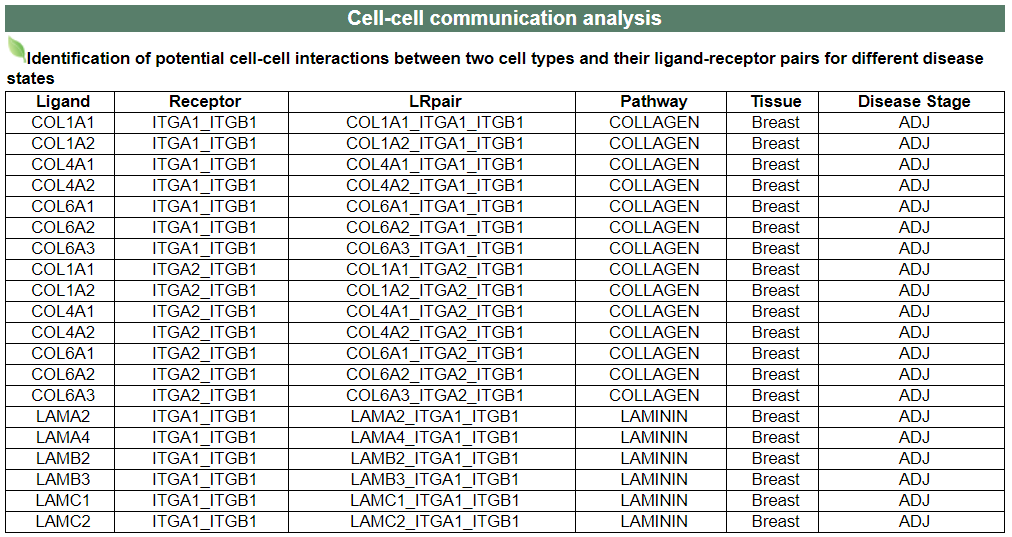
iv. Cell-cell communication analysis
v. Single-cell gene regulatory network inference analysis
vi. Somatic mutation of malignant transformation related genes
vii. Related drugs of malignant transformation related genes
3. Understanding tissue annotation of PCTanno
a. Search by tissue, example: Liver
b. Tissue annotation result page
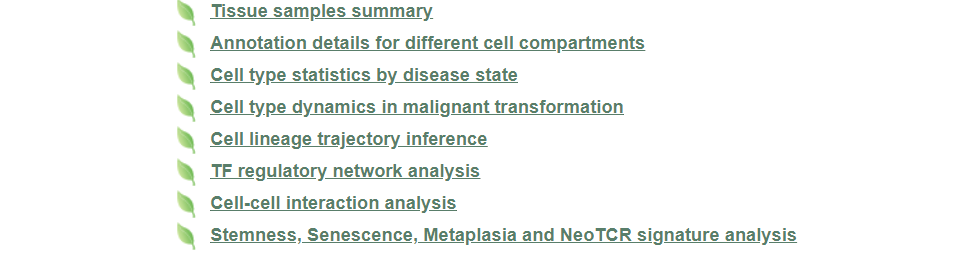
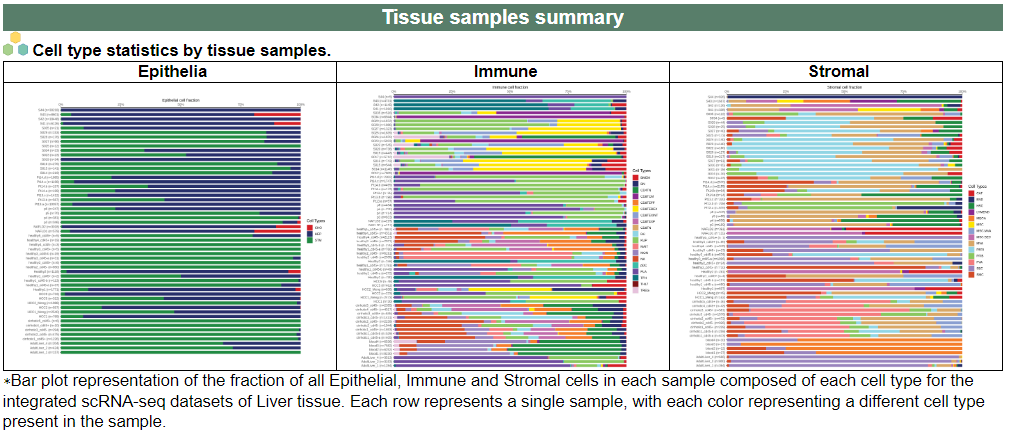
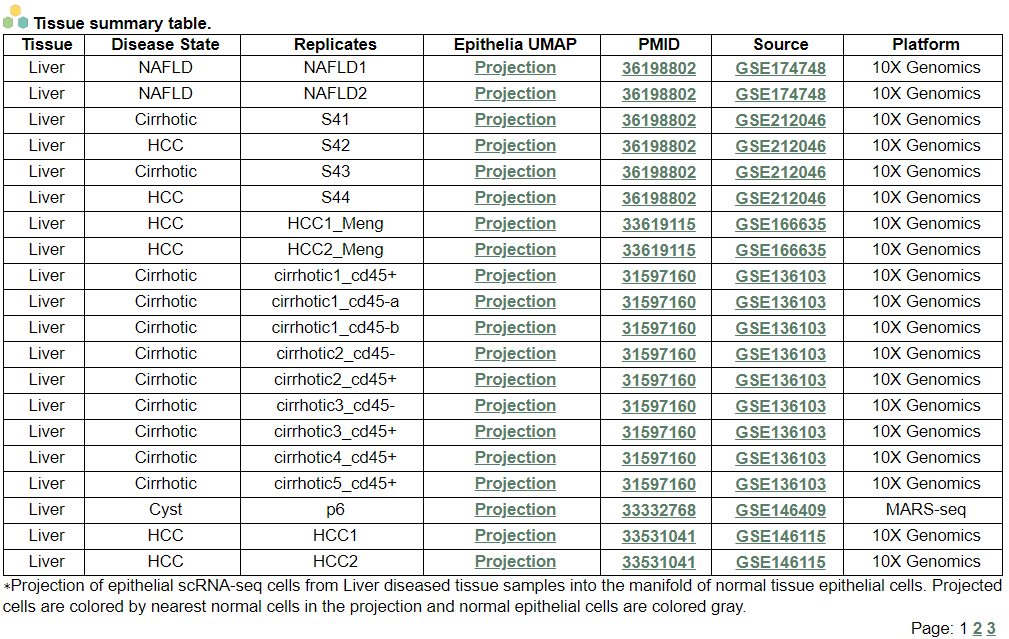
i. Tissue samples summary
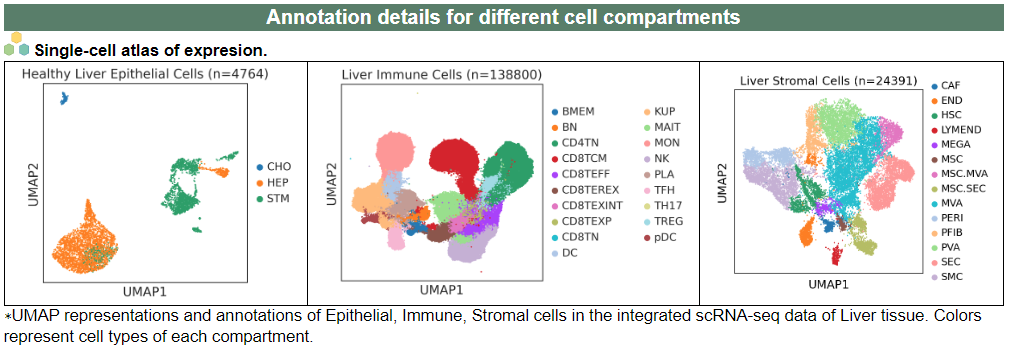
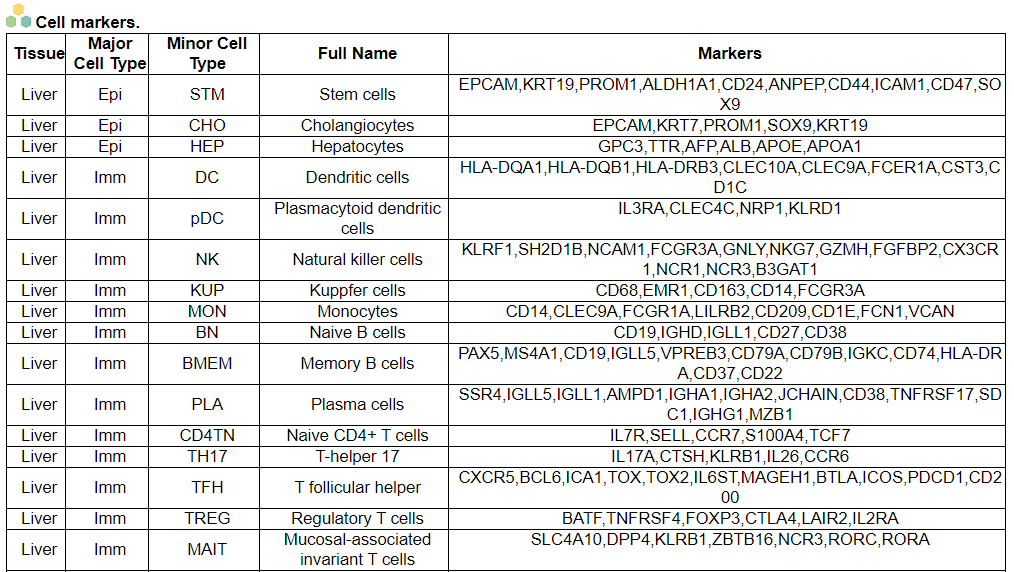
ii. Annotation details for different cell compartments
iii. Cell type statistics by disease state
iv. Cell type dynamics in malignant transformation
v. Cell lineage trajectory inference
vi. TF regulatory network analysis
vii. Cell-cell interaction analysis
viii. Stemness, Senescence, Metaplasia and NeoTCR signature analysis
4. Download data and contact us
We analyzed 2 datasets from 52 single cell RNA sequencing (scRNA-seq) studies and 12 whole exome sequencing (WES) datasets that across 12 tissues from healthy to premalignant lesion to cancer.
- Input query: Gene symbol or Entrez gene ID.

This image shows the gene list according to your search.
This image shows PCTanno's annotation categories for your query with links to their corresponding annotation parts.

 i. 'Gene summary' category
This image category shows the information of the PCTanno.
 ii. 'Malignant transformation analysis' category
This image category provides the result of Malignant transformation analysis.
 iii. 'Malignant transformation related pathway analysis' category
This image category provides the result of malignant transformation related pathway analysis.
 iv. 'Cell-cell communication analysis' category
This image category provides the result of cell-cell communication analysis.
Note: There is no result of HNF4A in this category. Here is the result of ITGB1 as an example.
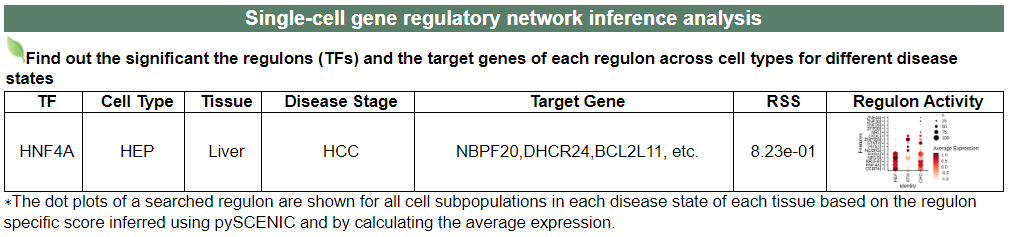
 v. 'Single-cell gene regulatory network inference analysis' category
This image category provides the result of single-cell gene regulatory network inference analysis.
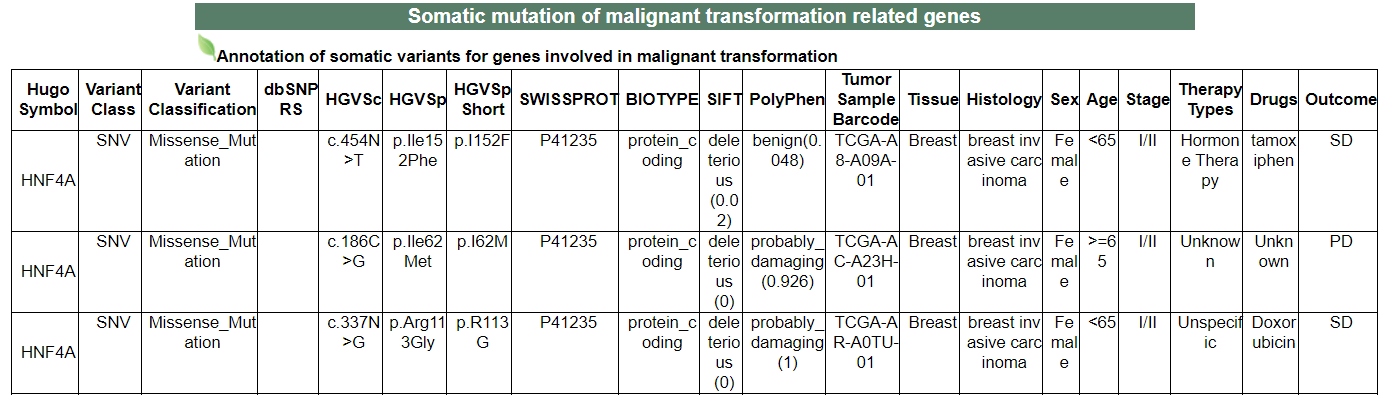
 vi. 'Somatic mutation of malignant transformation related genes' category
This image category provides the somatic mutation of malignant transformation related genes.
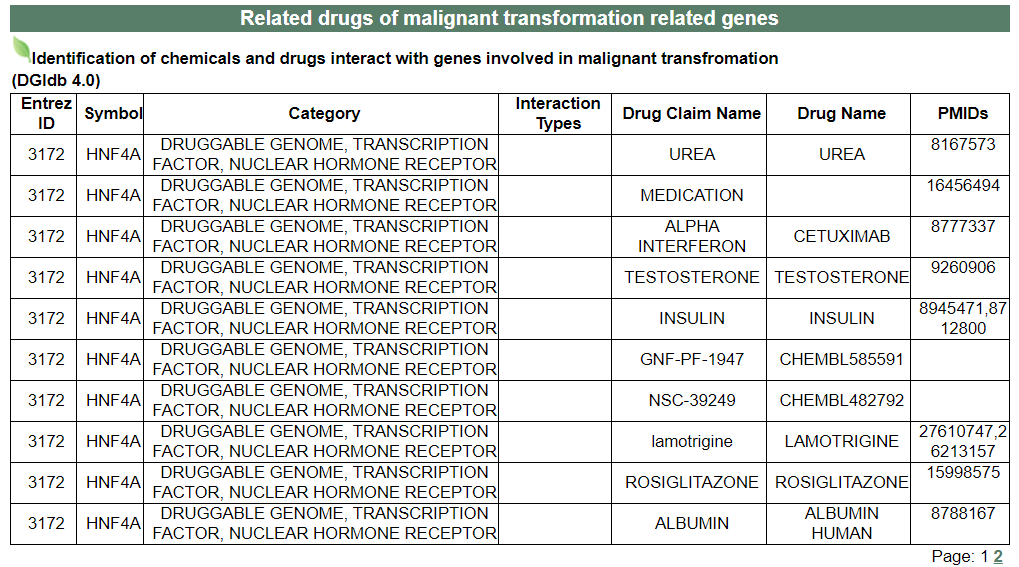
 vii. 'Related drugs of malignant transformation related genes' category
This image category provides the related drugs of malignant transformation related genes.
Select your interested tissue.

This image shows the tissue annotation of PCTanno for your query with links to their corresponding annotation parts.
 i. 'Tissue samples summary' category
This image category provides the tissue samples summary.
 ii. 'Annotation details for different cell compartments' category
This image category provides the annotation details for different cell compartments.
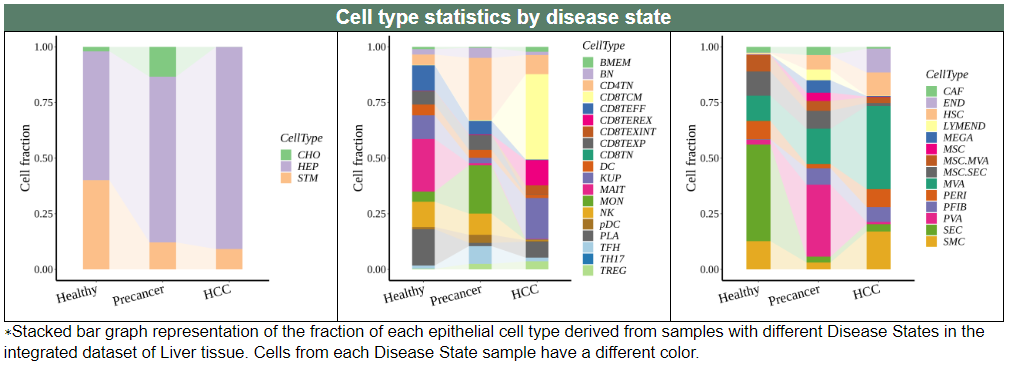
 iii. 'Cell type statistics by disease state' category
This image category provides the cell type statistics by disease state.
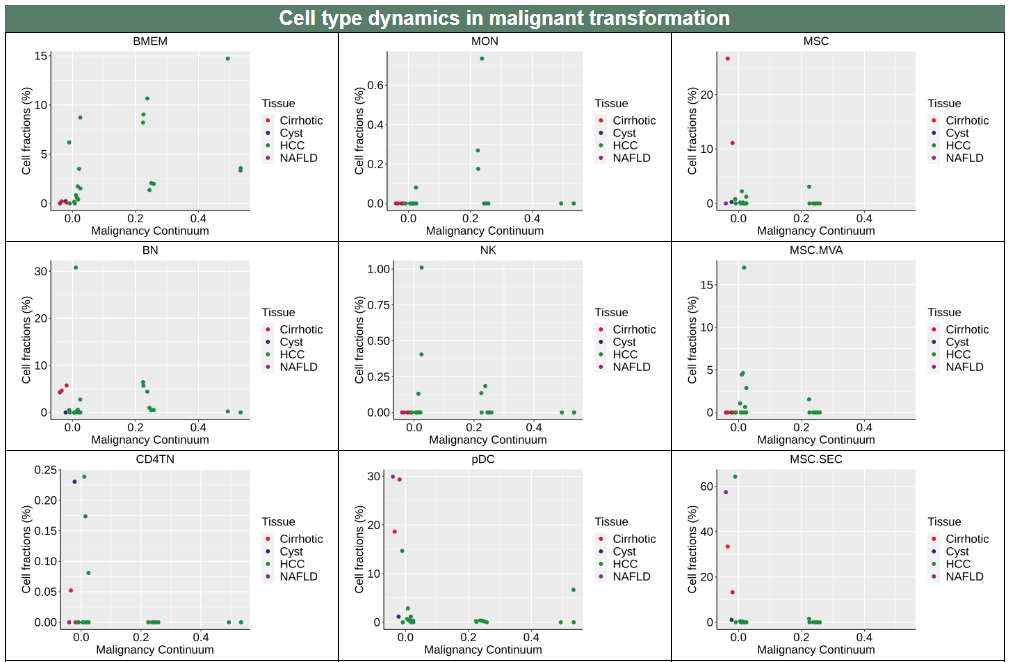
 iv. 'Cell type dynamics in malignant transformation' category
This image category provides the cell type dynamics in malignant transformation.
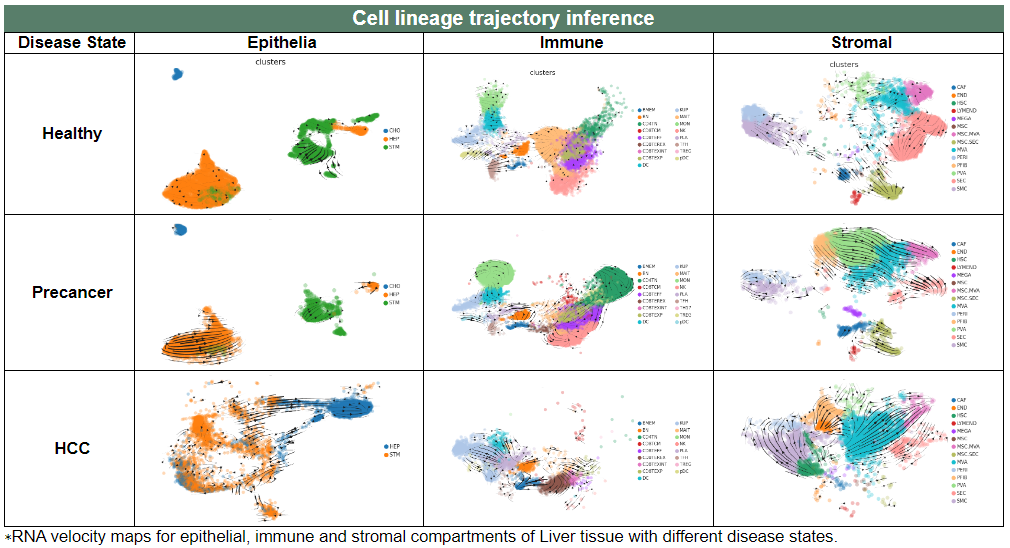
 v. 'Cell lineage trajectory inference' category
This image category provides the result cell lineage trajectory inference.
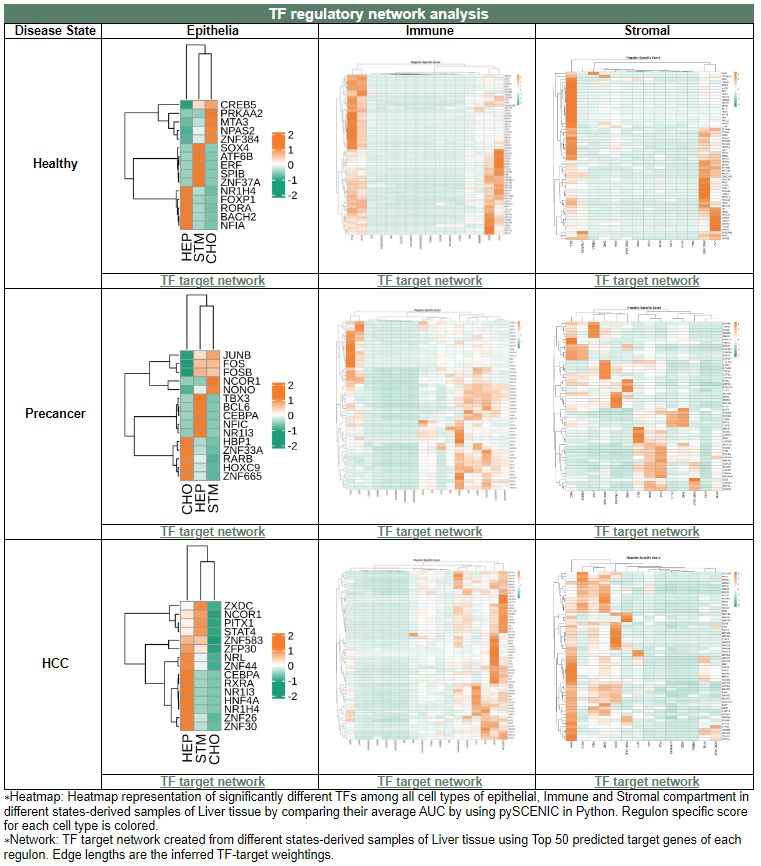
 vi. 'TF regulatory network analysis' category
This image category provides the result of TF regulatory network analysis.
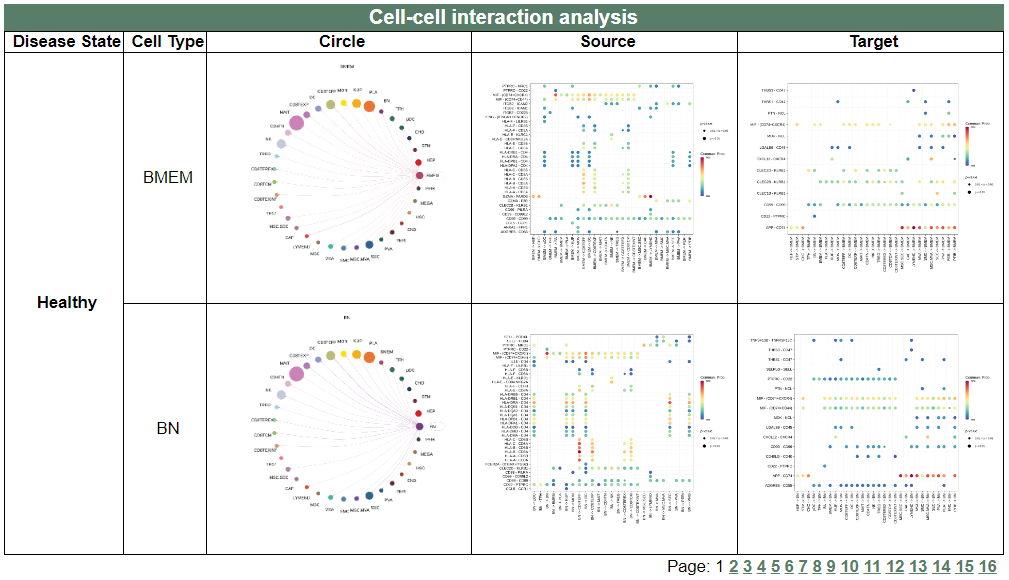
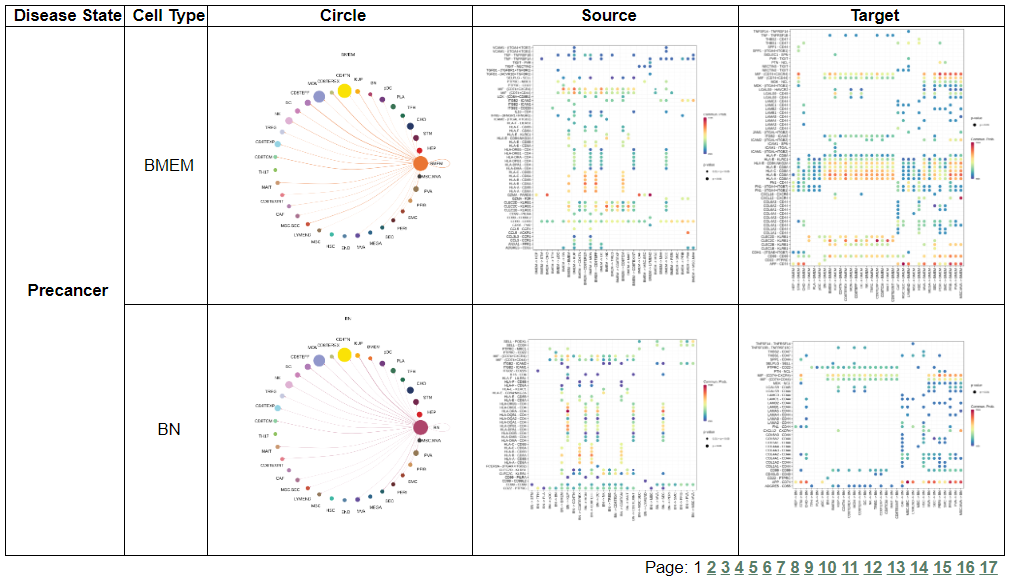
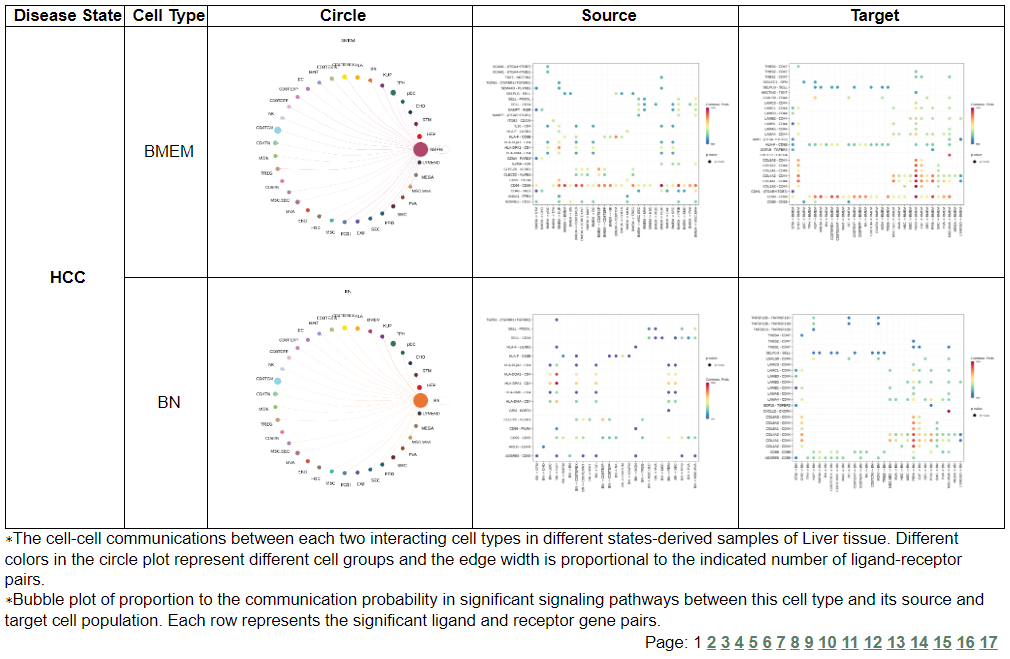
 vii. 'Cell-cell interaction analysis' category
This image category provides the result of cell-cell interaction analysis.
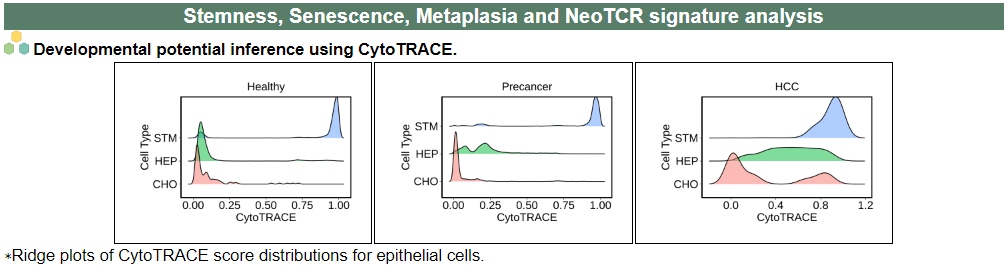
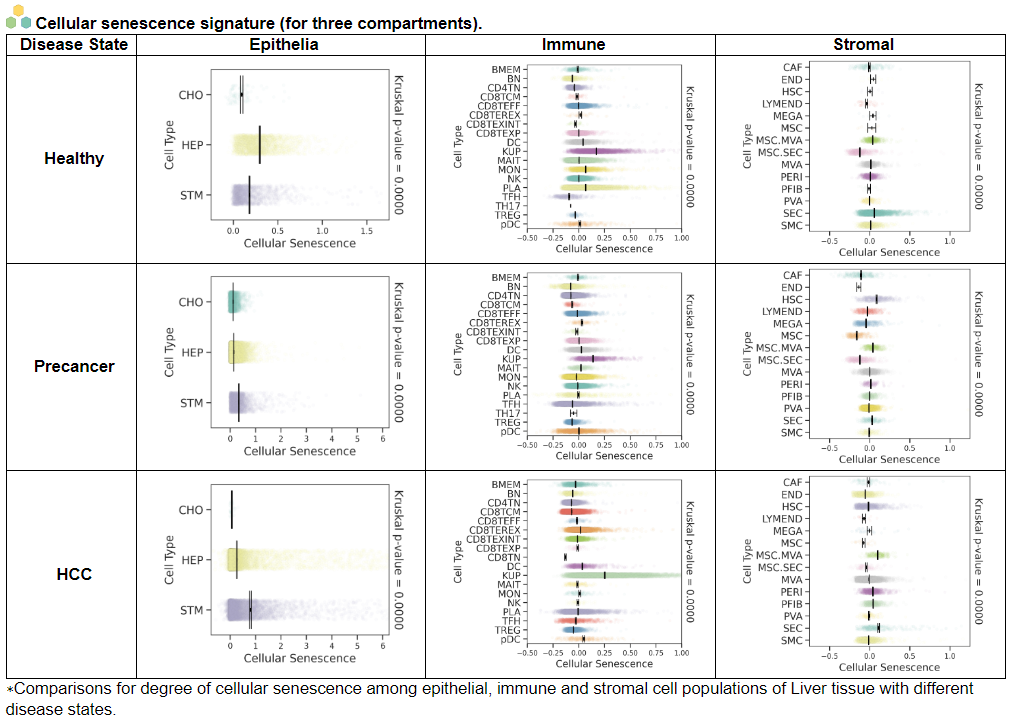
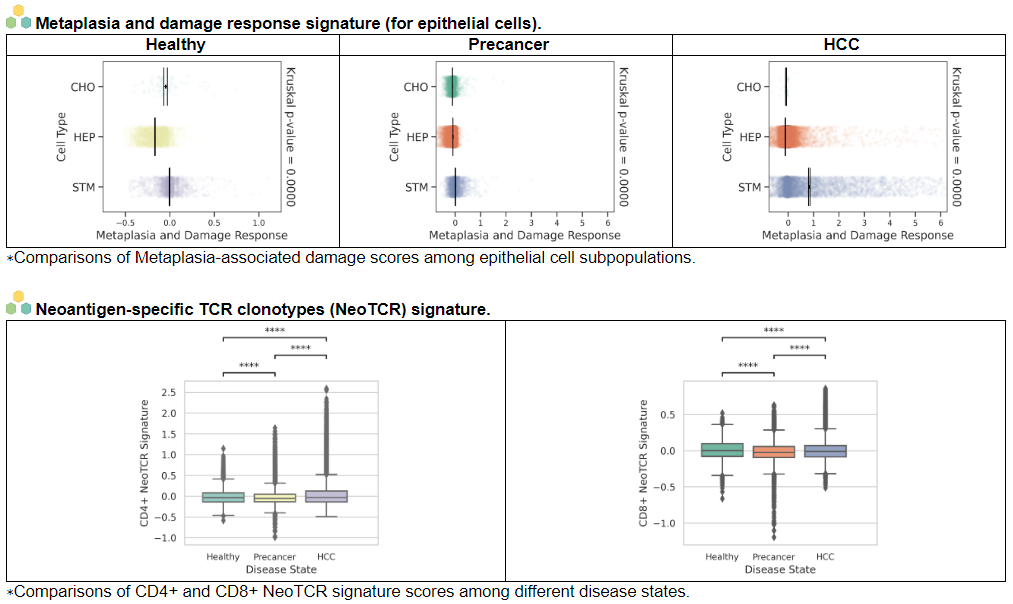
 viii. 'Stemness, Senescence, Metaplasia and NeoTCR signature analysis' category
This image category provides the result of Stemness, Senescence, Metaplasia and NeoTCR signature analysis.
Please go to download page and contact page.
