
|
|||||
|
 | |
| |
| |
| |
| |
| |
| |
| Stemness, Senescence, Metaplasia and NeoTCR signature analysis |
Tissue: Colorectum |
Tissue samples summary |
| Epithelia | Immune | Stromal |
 |  |  |
| ∗Bar plot representation of the fraction of all Epithelial, Immune and Stromal cells in each sample composed of each cell type for the integrated scRNA-seq datasets of Colorectum tissue. Each row represents a single sample, with each color representing a different cell type present in the sample. |
| Tissue | Disease State | Replicates | Epithelia UMAP | PMID | Source | Platform |
| Colorectum | FAP | F007 | Projection | 35726067 | GSE201348 | 10X Genomics |
| Colorectum | ADJ | A014-C-201 | Projection | 35726067 | GSE201348 | 10X Genomics |
| Colorectum | FAP | A002-C-010 | Projection | 35726067 | GSE201348 | 10X Genomics |
| Colorectum | FAP | A001-C-207 | Projection | 35726067 | GSE201348 | 10X Genomics |
| Colorectum | ADJ | A001-C-124 | Projection | 35726067 | GSE201348 | 10X Genomics |
| Colorectum | FAP | A002-C-106 | Projection | 35726067 | GSE201348 | 10X Genomics |
| Colorectum | ADJ | A001-C-223 | Projection | 35726067 | GSE201348 | 10X Genomics |
| Colorectum | FAP | A002-C-204 | Projection | 35726067 | GSE201348 | 10X Genomics |
| Colorectum | ADJ | A014-C-111 | Projection | 35726067 | GSE201348 | 10X Genomics |
| Colorectum | FAP | A015-C-203 | Projection | 35726067 | GSE201348 | 10X Genomics |
| Colorectum | FAP | A015-C-204 | Projection | 35726067 | GSE201348 | 10X Genomics |
| Colorectum | FAP | A014-C-040 | Projection | 35726067 | GSE201348 | 10X Genomics |
| Colorectum | FAP | A002-C-201 | Projection | 35726067 | GSE201348 | 10X Genomics |
| Colorectum | FAP | A002-C-203 | Projection | 35726067 | GSE201348 | 10X Genomics |
| Colorectum | ADJ | A015-C-008 | Projection | 35726067 | GSE201348 | 10X Genomics |
| Colorectum | ADJ | A015-C-208 | Projection | 35726067 | GSE201348 | 10X Genomics |
| Colorectum | ADJ | A014-C-114 | Projection | 35726067 | GSE201348 | 10X Genomics |
| Colorectum | FAP | A014-C-043 | Projection | 35726067 | GSE201348 | 10X Genomics |
| Colorectum | FAP | A001-C-202 | Projection | 35726067 | GSE201348 | 10X Genomics |
| Colorectum | FAP | A001-C-119 | Projection | 35726067 | GSE201348 | 10X Genomics |
| ∗Projection of epithelial scRNA-seq cells from Colorectum diseased tissue samples into the manifold of normal tissue epithelial cells. Projected cells are colored by nearest normal cells in the projection and normal epithelial cells are colored gray. |
| Page: 1 2 3 4 5 6 7 8 9 10 11 |
Top |
Annotation details for different cell compartments |
 |  | 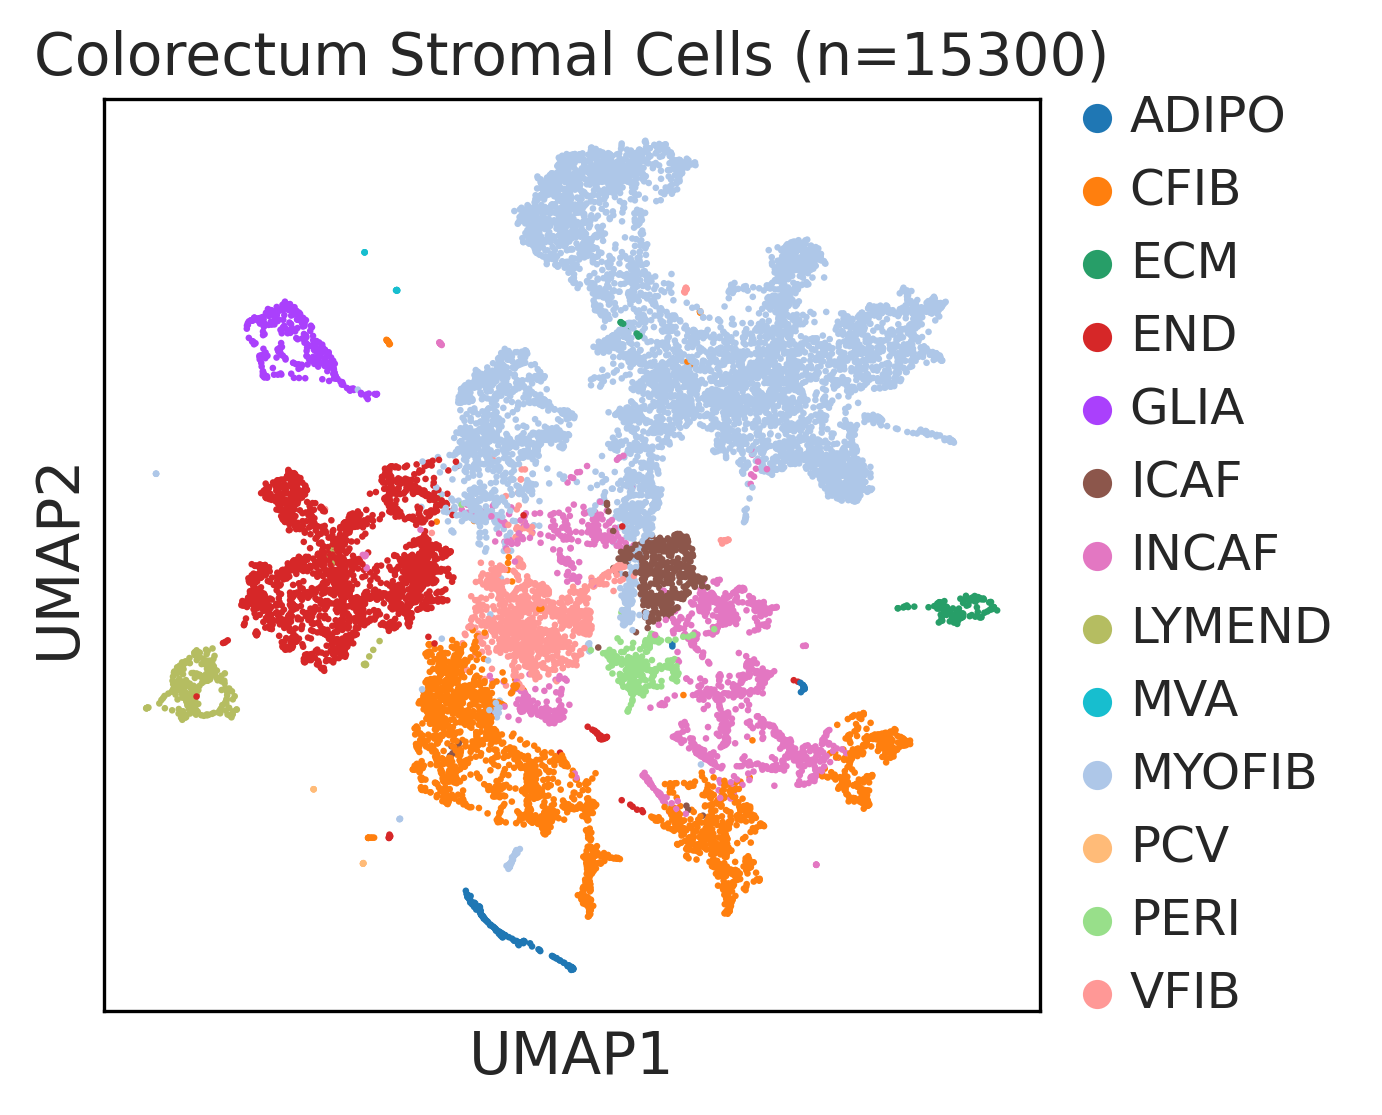 |
| ∗UMAP representations and annotations of Epithelial, Immune, Stromal cells in the integrated scRNA-seq data of Colorectum tissue. Colors represent cell types of each compartment. |
| Tissue | Major Cell Type | Minor Cell Type | Full Name | Markers |
| Colorectum | Epi | STM | Stem-like cells | SMOC2,RGMB,SOX9,LGR5,OLFM4,ASCL2,CD44,CD166 |
| Colorectum | Epi | CT | Crypt top colonocytes | OTOP2,MEIS1 |
| Colorectum | Epi | EE | Enteroendocrine | CHGA,CHGB,TPH1 |
| Colorectum | Epi | ABS | Absorptive cells | ALDOB,CA2,SI |
| Colorectum | Epi | SSC | Serrated specific cells | GSDMB,GSDMD,IL18,RELB,MDK,RARA,RXRA,PDX1,S100P |
| Colorectum | Epi | ASC | Adenoma-specific cells | AXIN2,RNF43,EPHB2,CDX2 |
| Colorectum | Epi | TAC | Transit amplifying cells | PCNA,MKI67 |
| Colorectum | Epi | GOB | Goblet | ATOH1,MUC2,TFF3 |
| Colorectum | Epi | TUF | Tuft | POU2F3,SOX9 |
| Colorectum | Epi | IMENT | Serrated specific cells | SLC26A2,CA1 |
| Colorectum | Epi | IMGOB | Immature goblet | KLK1,ITLN1,WFDC2,CLCA1,LRRC26,RETNLB,SPINK4,AGR2 |
| Colorectum | Imm | MAST | Mast cells | TPSAB1,CPA3,HDC,CTSG,TPSB2,MS4A2 |
| Colorectum | Imm | DC | Dendritic cells | HLA-DQA1,HLA-DQB1,CLEC10A,CLEC9A,FCER1A,CST3,CD1C |
| Colorectum | Imm | NK | Natural killer cells | KLRF1,SH2D1B,NCAM1,FCGR3A,GNLY,NKG7,GZMH,FGFBP2,CX3CR1,NCR1,NCR3,B3GAT1 |
| Colorectum | Imm | MAC | Macrophages | FOLR2,FABP3,PLA2G2D,ITGAM,ITGAX,CSF1R,CD68,CD163,THBD |
| Colorectum | Imm | MON | Monocytes | CD14,CLEC9A,FCGR1A,LILRB2,CD209,CD1E,FCN1,VCAN |
| Colorectum | Imm | ILC | Innate lymphoid cells | IL7R,KIT,IL2RA,NCAM1,GATA3 |
| Colorectum | Imm | BN | Naive B cells | CD19,IGHD,IGLL1,CD27,CD38 |
| Colorectum | Imm | BMEM | Memory B cells | PAX5,MS4A1,CD19,IGLL5,VPREB3,CD79A,CD79B,IGKC,CD74,HLA-DRA,CD37,CD22 |
| Colorectum | Imm | GC | Germinal center B cells | SERPINA9,HRK,HTR3A,BCL6,CD180,FCRLA |
| Colorectum | Imm | PLA | Plasma cells | SSR4,IGLL5,IGLL1,AMPD1,IGHA1,IGHA2,JCHAIN,CD38,TNFRSF17,SDC1,IGHG1,MZB1 |
| Colorectum | Imm | CD4TN | Naive CD4+ T cells | IL7R,SELL,CCR7,S100A4,TCF7 |
| Colorectum | Imm | TH17 | T-helper 17 | IL17A,CTSH,KLRB1,IL26 |
| Colorectum | Imm | TH1 | T-helper 1 | CXCL13,IFNG,CXCR3,BHLHE40,GZMB,PDCD1,HAVCR2,ICOS,IGFLR1,ITGAE |
| Colorectum | Imm | TFH | T follicular helper | CXCR5,BCL6,ICA1,TOX,TOX2,IL6ST,MAGEH1,BTLA,ICOS,PDCD1,CD200 |
| Colorectum | Imm | TREG | Regulatory T cells | BATF,TNFRSF4,FOXP3,CTLA4,LAIR2,IL2RA |
| Colorectum | Imm | CD8TEXP | Progenitor exhausted CD8+ T cells | PDCD1,IL7R,GPR183,NR4A3,REL,TCF7 |
| Colorectum | Imm | CD8TEXINT | Intermediate exhausted CD8+ T cells | PDCD1,LAG3,CD101,CD38,CXCR6,TIGIT |
| Colorectum | Imm | CD8TEREX | Terminally exhausted CD8+ T cells | TOX,GZMB,ENTPD1,ITGAE,HAVCR2,CXCL13,PDCD1,LAYN,TOX,IFNG,GZMB,MIR155HG,TNFRSF9,ITGAE |
| Colorectum | Imm | CD8TCM | Central memory CD8+ T cells | CCR7,SELL,IL7R,CD27,CD28,PRF1,GZMA,CCL5,GPR183,S1PR1 |
| Colorectum | Str | END | Endothelial cells | PECAM1,PLVAP,VWF,CLDN5,FLT1,RAMP2,FAM110D,INHBB,NPR1,NOVA2,GPIHBP1,SOX17 |
| Colorectum | Str | LYMEND | Lymphatic endothelial cells | PROX1,LYVE1,PDPN,PROCR,FLT4 |
| Colorectum | Str | CFIB | Crypt fibroblasts | WNT2B,RSPO3,BMP7,MAP3K2,COL6A1,CD36,CD44,CBLN2,SPOCK1,ACSS3,FN1,COL3A1,BGN,DCN,POSTN,C1R,MMP2,FGF7,MME,CD47 |
| Colorectum | Str | VFIB | Villus fibroblasts | WNT5B,BMP7,MAP3K2,COL6A1,CD36,CD44,CBLN2,SPOCK1,ACSS3,FN1,COL3A1,BGN,DCN,POSTN,C1R,MMP2,FGF7,MME,CD47 |
| Colorectum | Str | MYOFIB | Myofibroblasts | SYT10,SOSTDC1,DES,TAGLN,MYH11,TPM4 |
| Colorectum | Str | PERI | Pericytes | PDGFRA,CSPG4,MCAM,COX4I2,KCNJ8,HIGD1B,NOTCH3,HEYL,FAM162B |
| Colorectum | Str | ADIPO | Adipocytes | PPARG,FABP4,ADIPOQ,LEP,CD36,PLIN1 |
| Colorectum | Str | PVA | Post capillary venules | SELP,ZNF385D,FAM155A,GALNT15,MADCAM1 |
| Colorectum | Str | MVA | Microvascular cells | PLVAP,CD36,DYSF,NRP1,SH3BP5,FABP5,VWA1,BAALC,PRSS23,RAPGEF4,APLN,HTRA1 |
| Colorectum | Str | GLIA | Glia cells | GFAP |
| Colorectum | Str | ECM | Extracellular matrix | FBLN1,PCOLCE2,MFAP5 |
| Colorectum | Str | INCAF | Intermediate cancer-associated fibroblasts | PDGFRA,POSTN,ID1,ID3 |
| Colorectum | Str | ICAF | Inflammatory cancer-associated fibroblasts | TWIST1,WNT2,FAP,CXCL1,CXCL2,IL1B,IL6,HGF |
Top |
Cell type statistics by disease state |
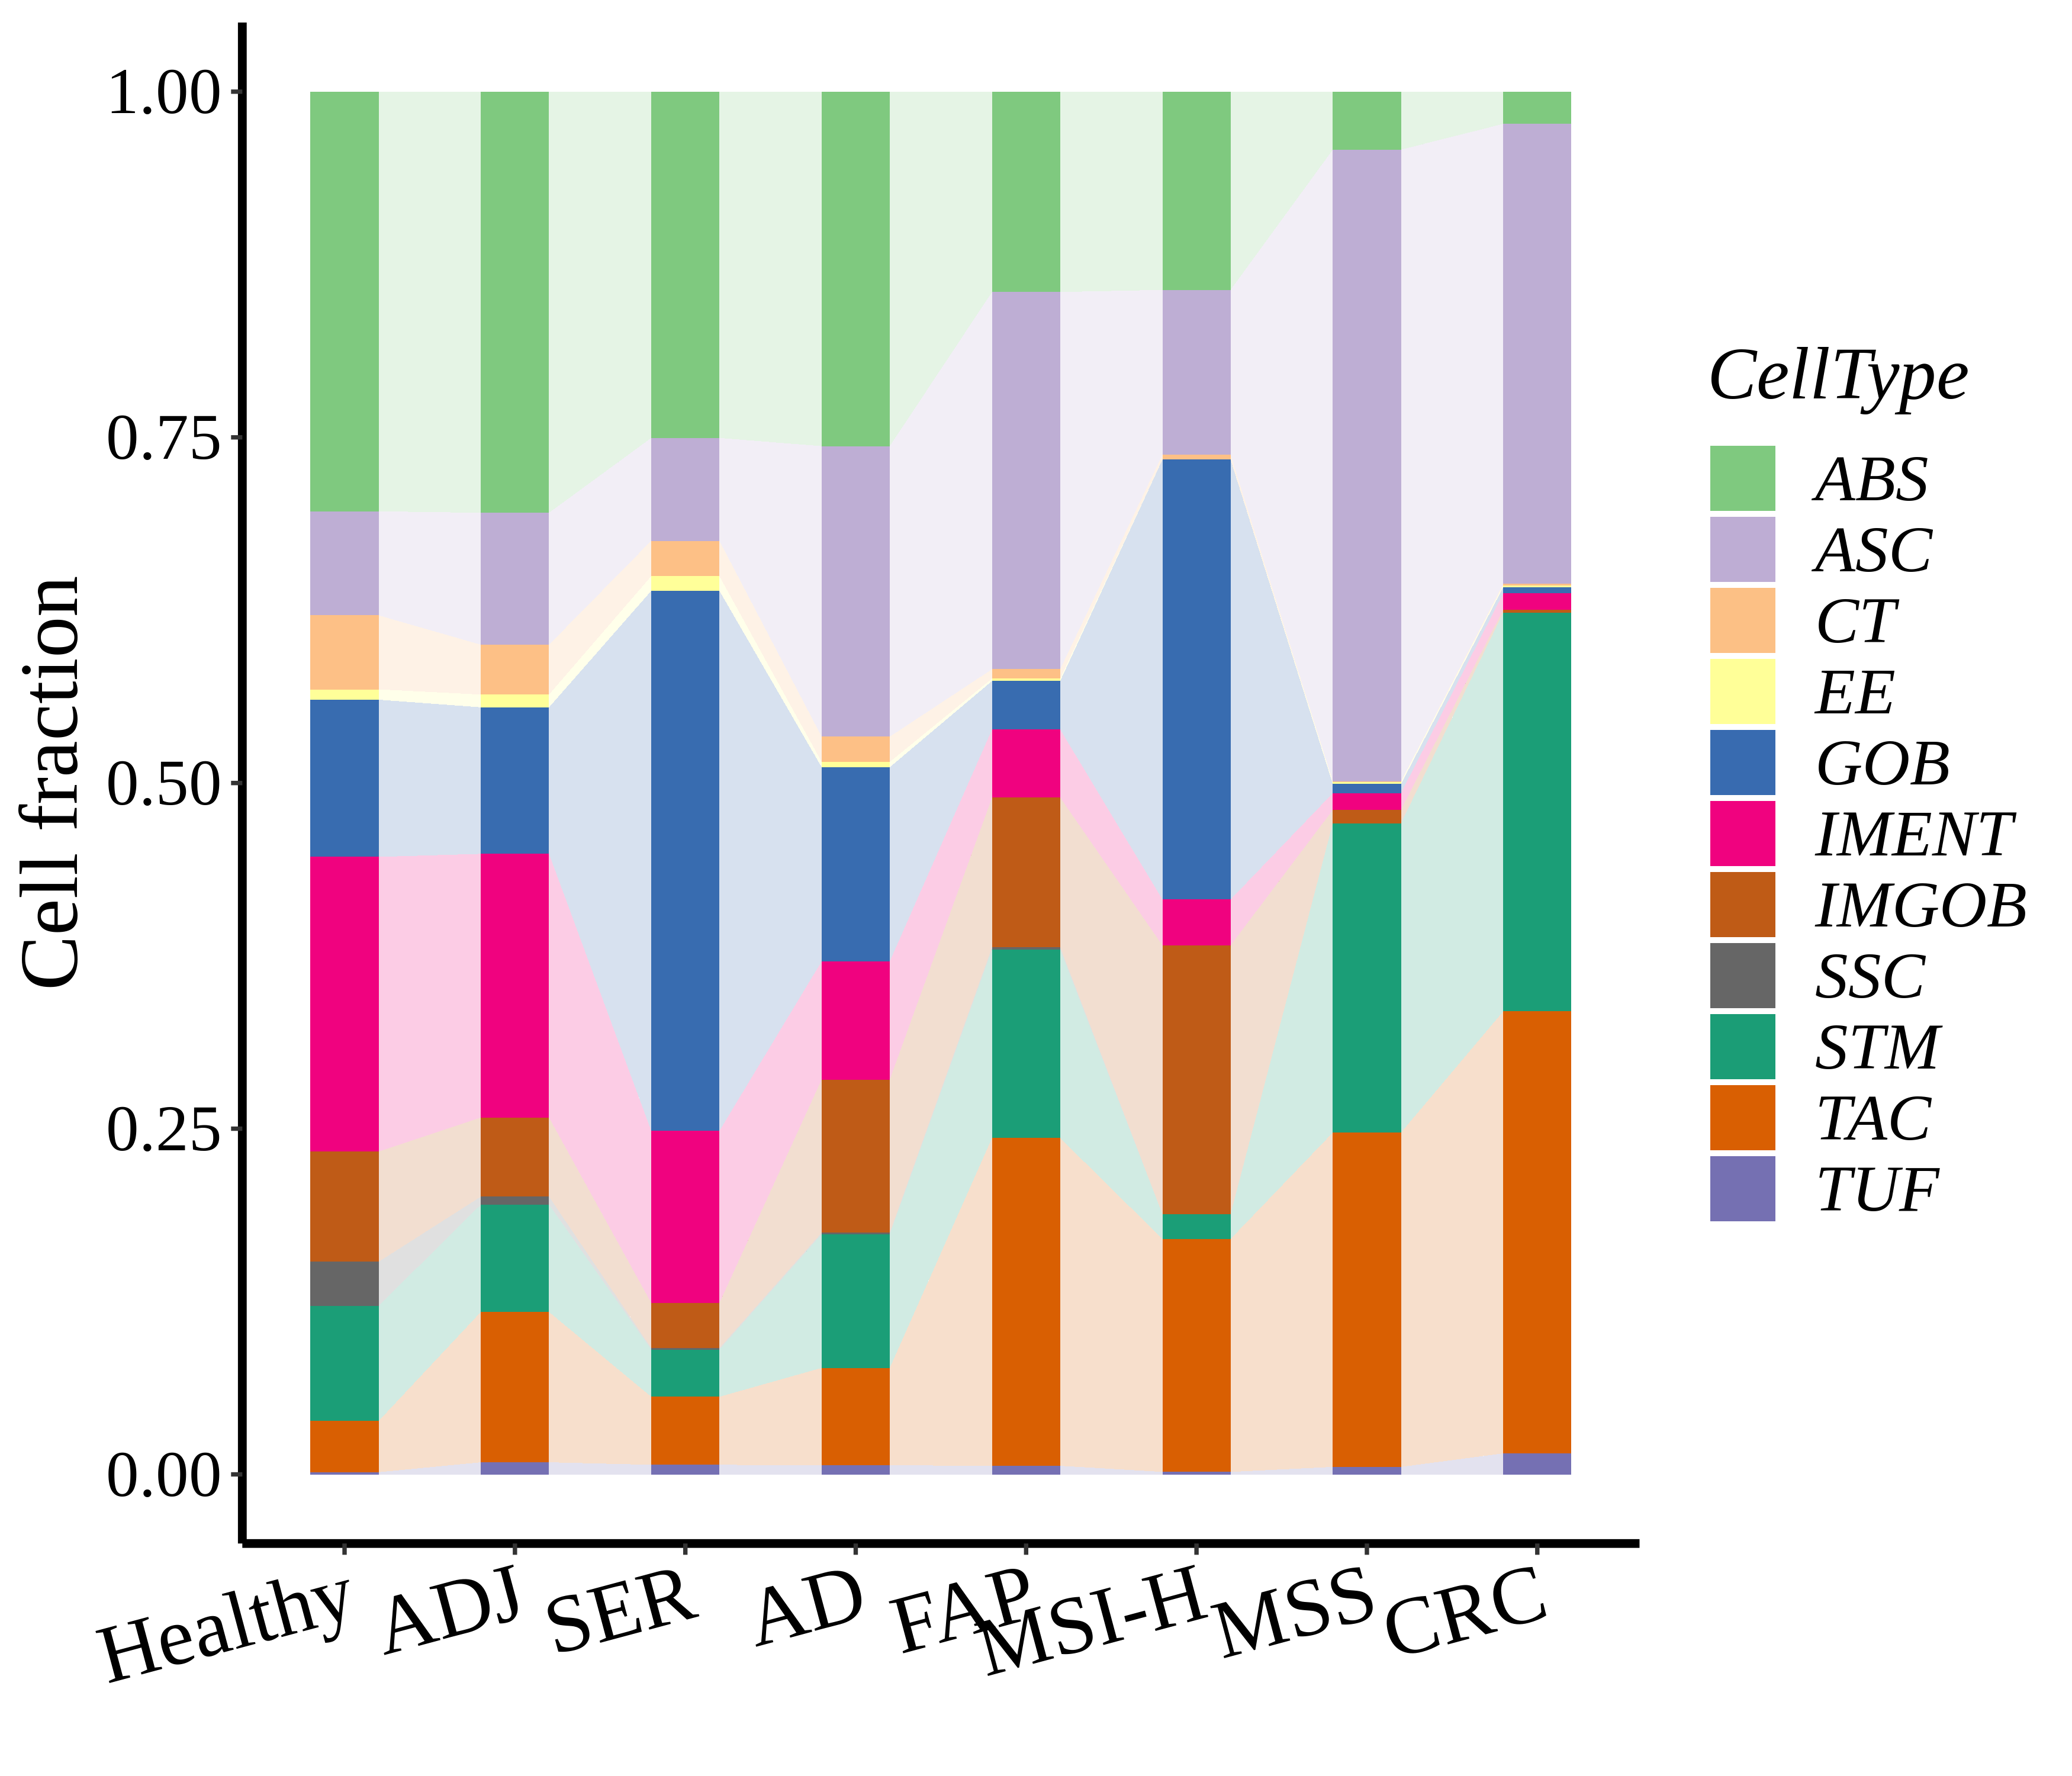 |  |  |
| ∗Stacked bar graph representation of the fraction of each epithelial cell type derived from samples with different Disease States in the integrated dataset of Colorectum tissue. Cells from each Disease State sample have a different color. |
Top |
Cell type dynamics in malignant transformation |
| Page: 1 |
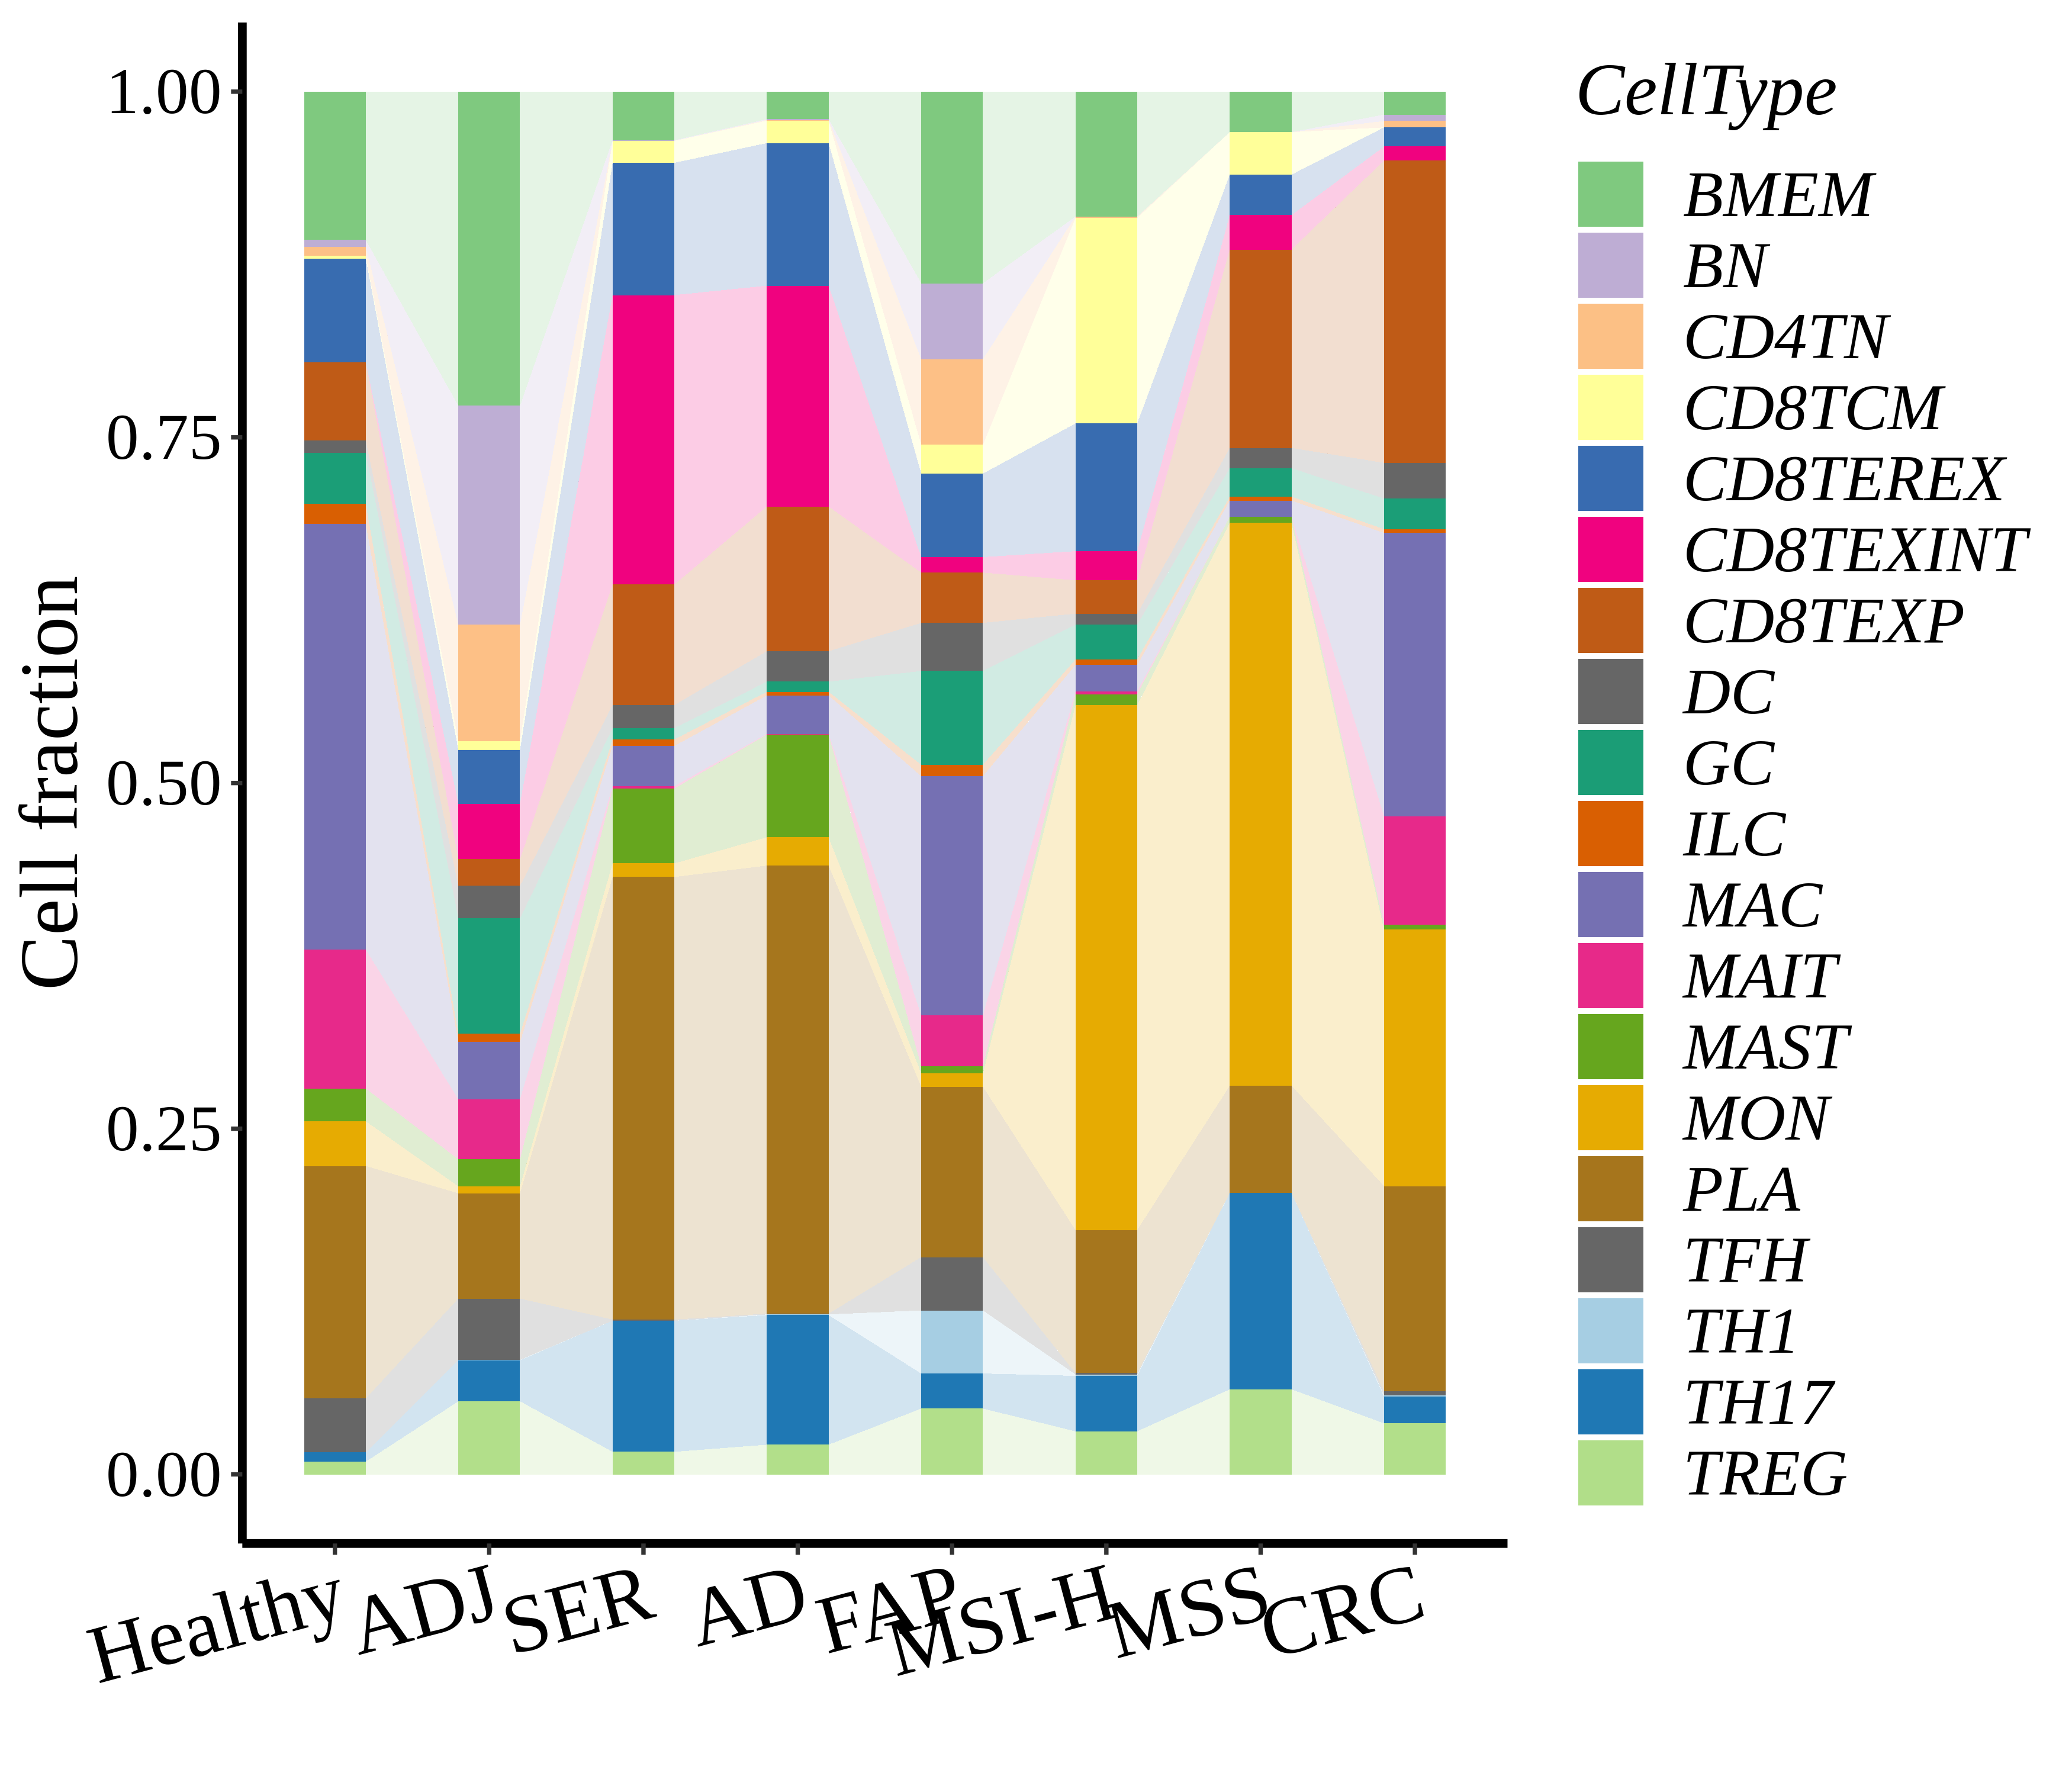
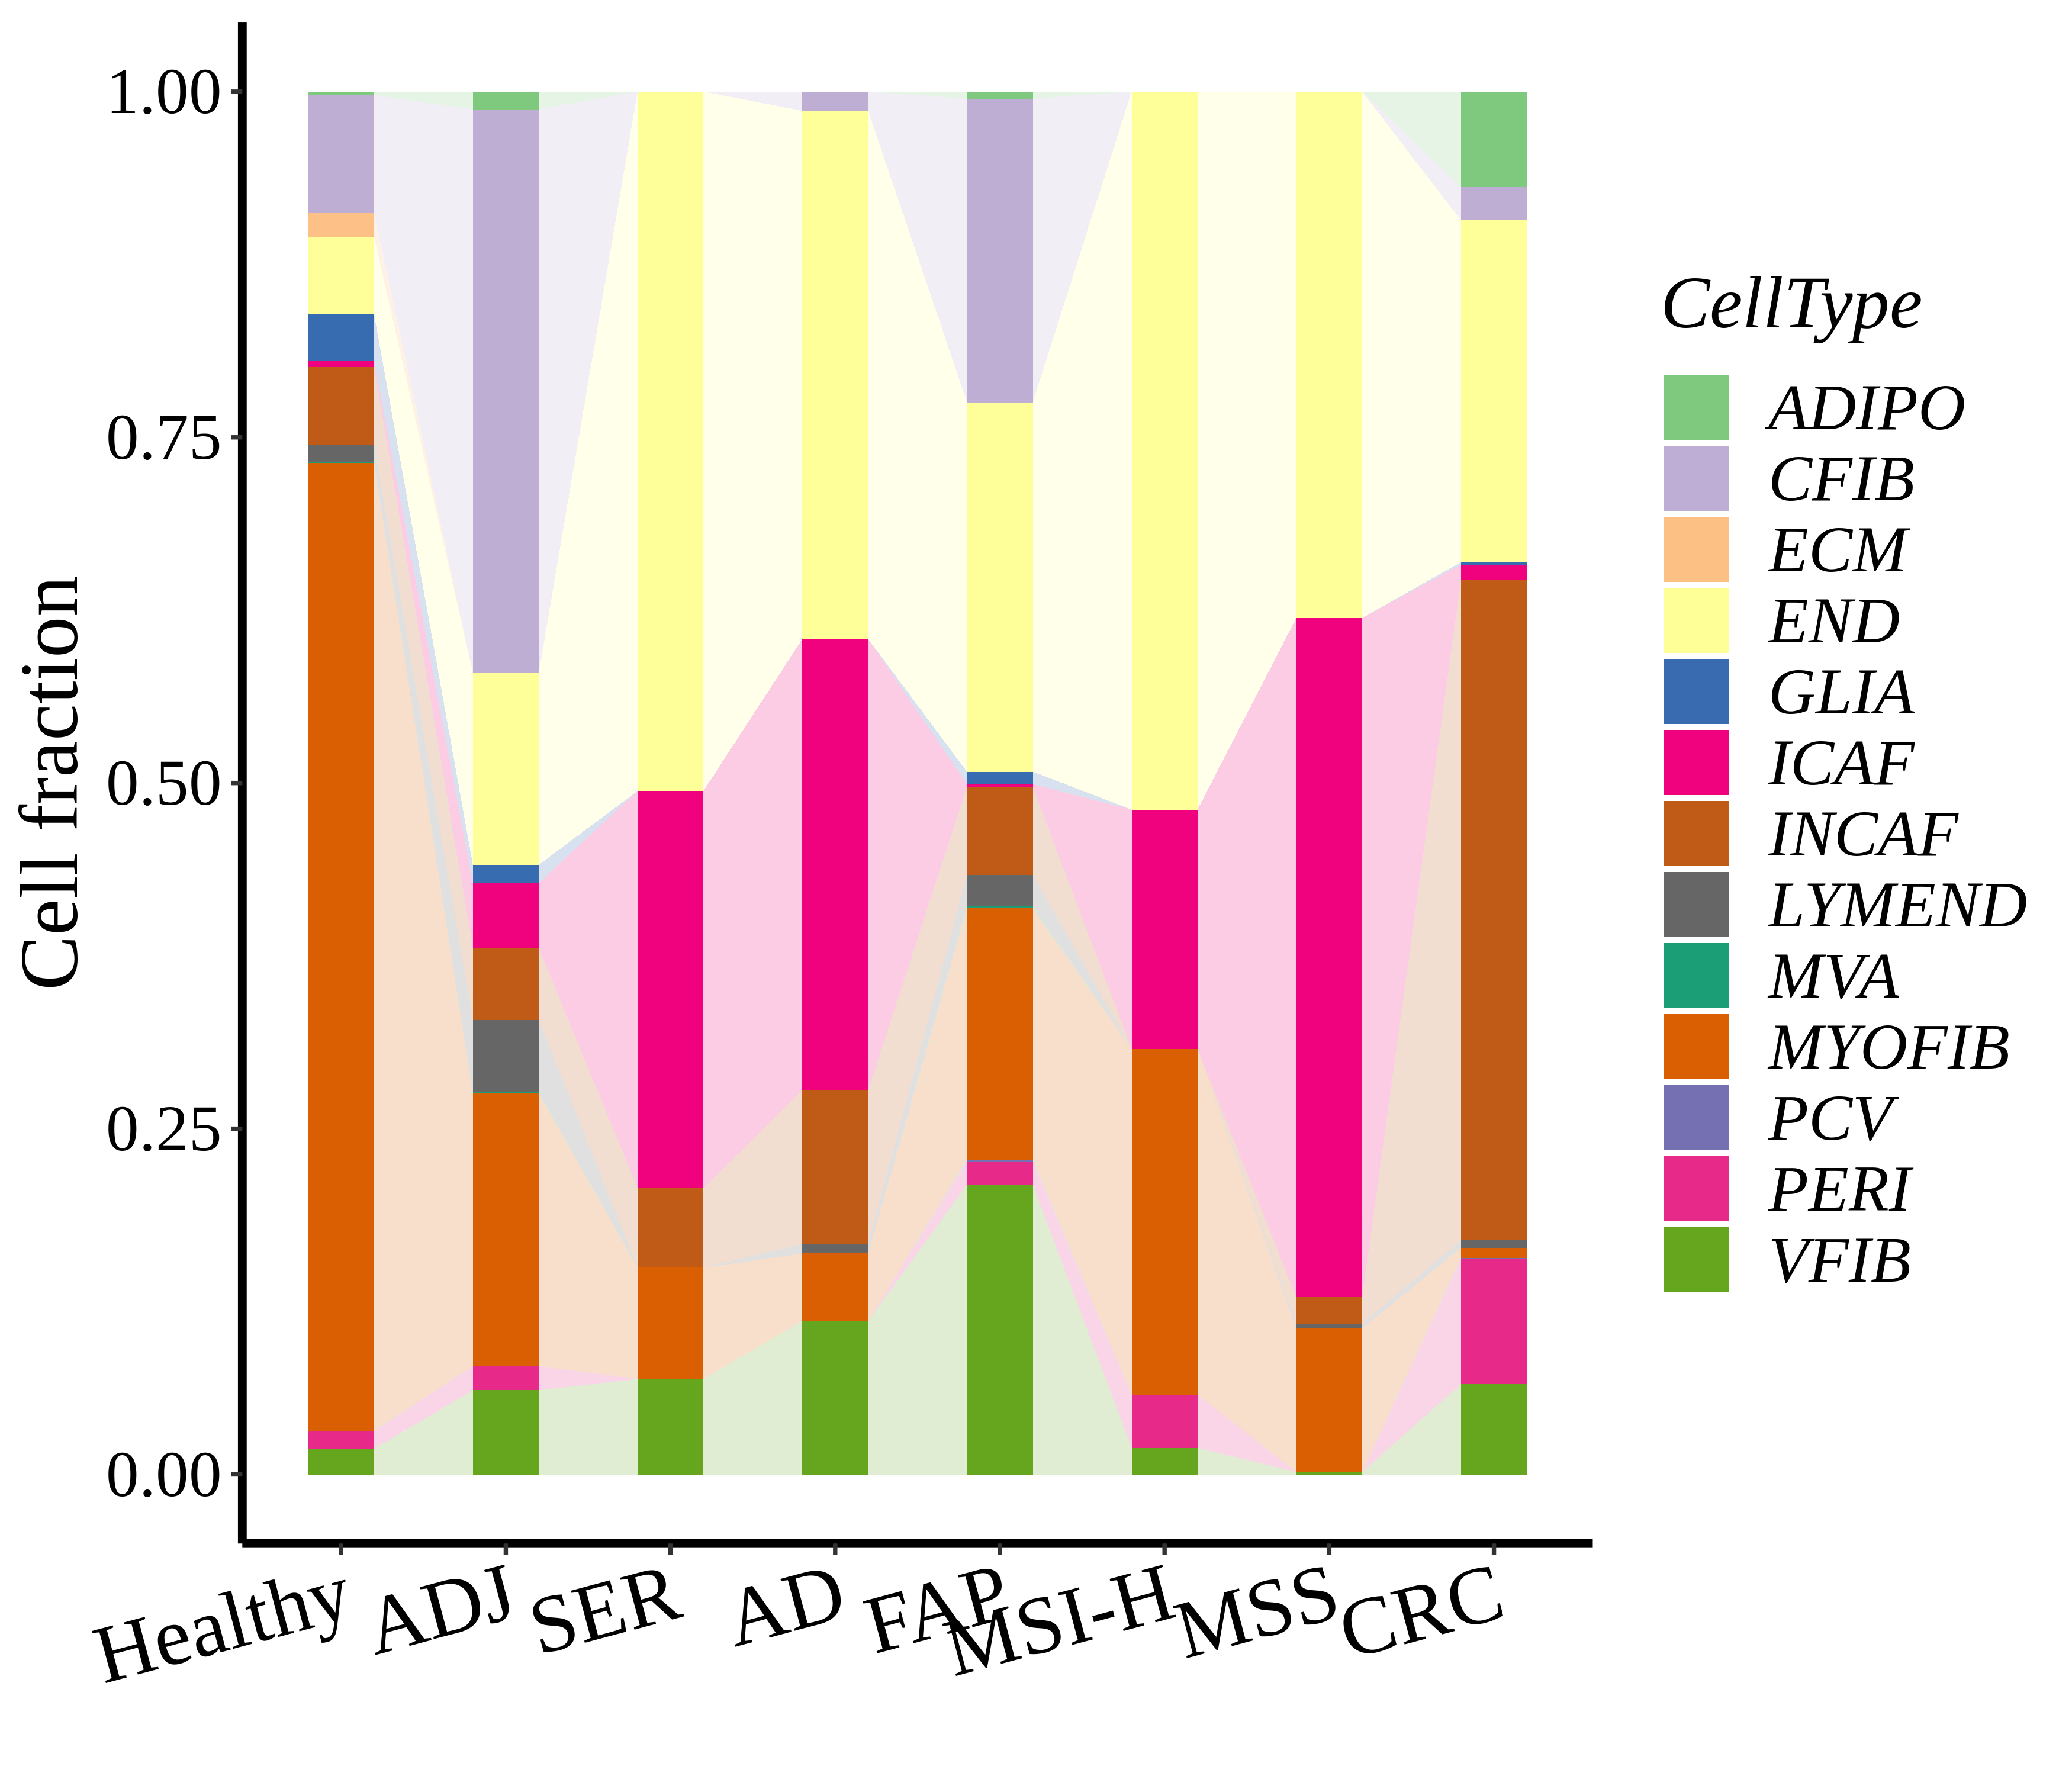
| ∗Fraction of cell type in each scRNA-seq sample plotted against position of the sample in the malignancy continuum for all cell types in Colorectum tissue. Samples are colored based on if they are derived from different Disease States. Cell fractions are computed by dividing the number of cells of a given cell type by the total number of cells in the compartment (epithelial versus immune versus stromal). |
| Page: 1 |
Top |
Cell lineage trajectory inference |
| Disease State | Epithelia | Immune | Stromal | |
| Healthy | 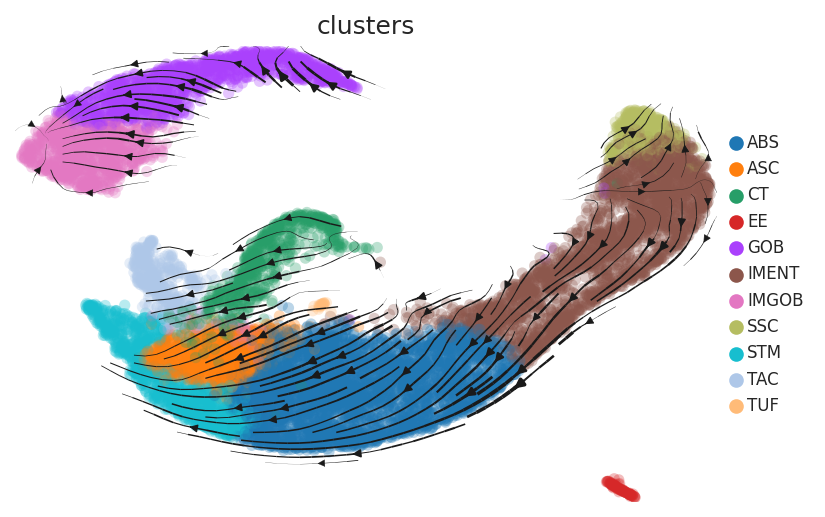 | 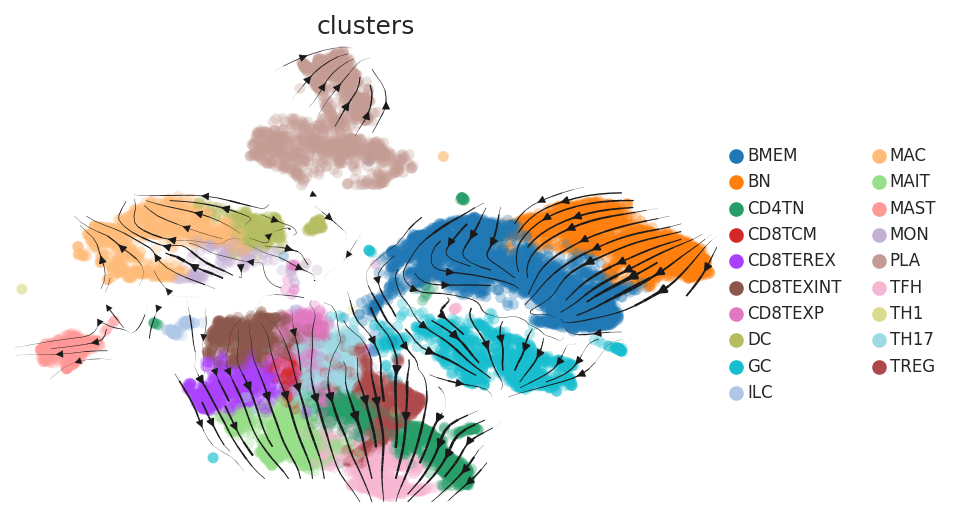 | 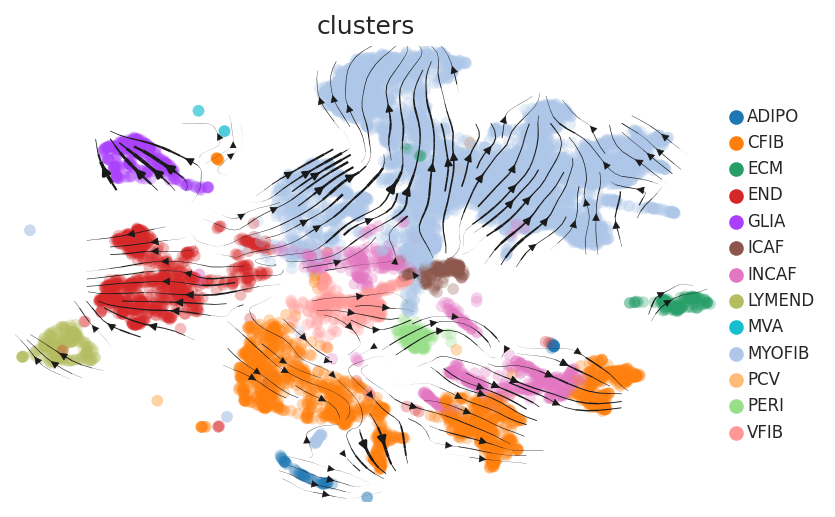 | |
| Precancer | SER | 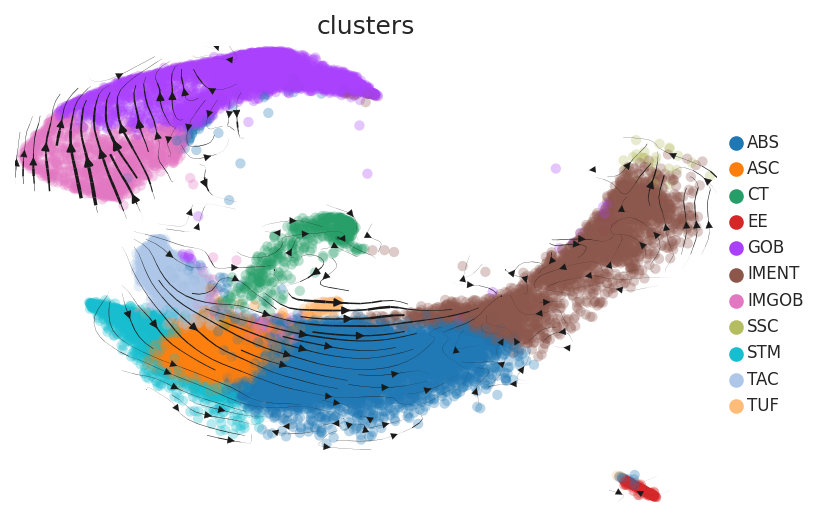 | 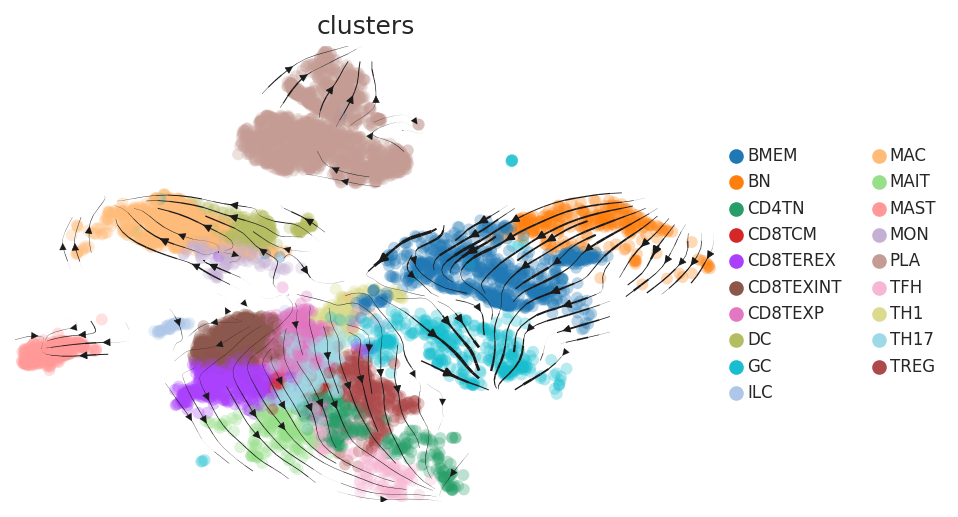 | 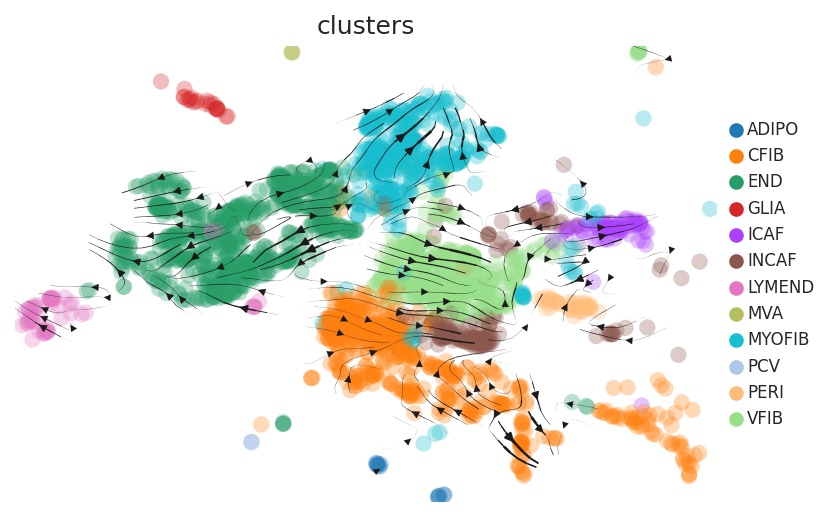 |
| TA | 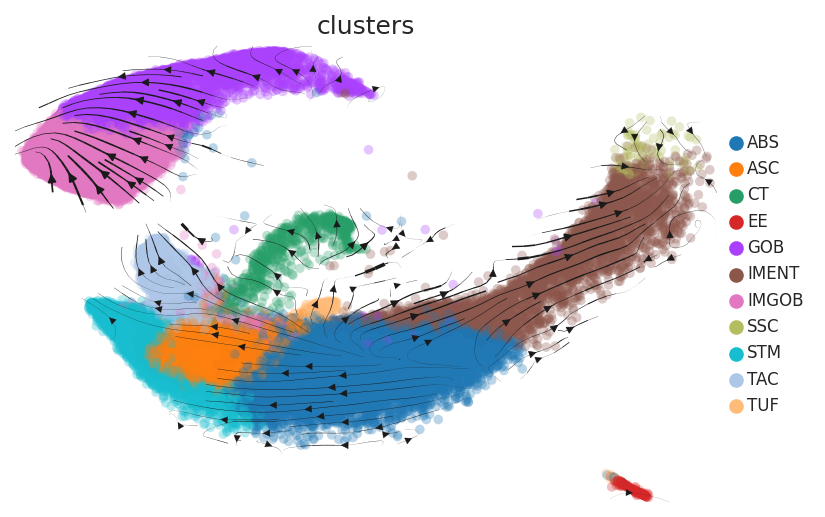 | |||
| TVA | 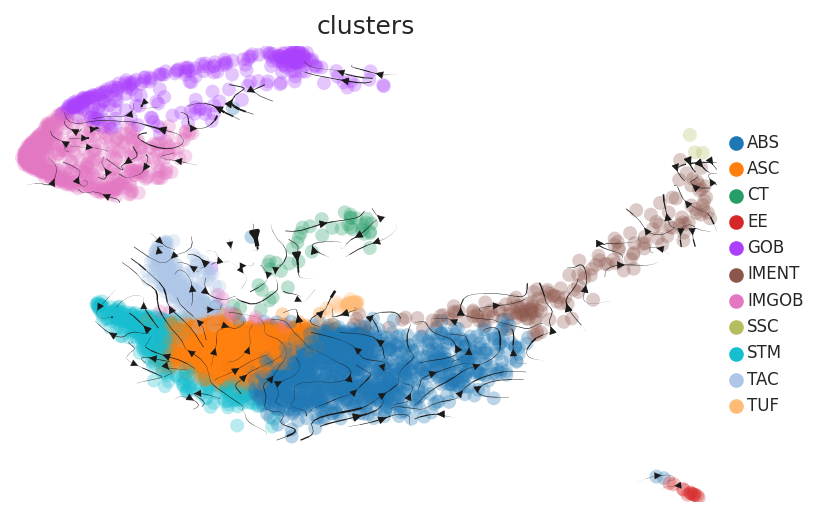 | |||
| CRC | 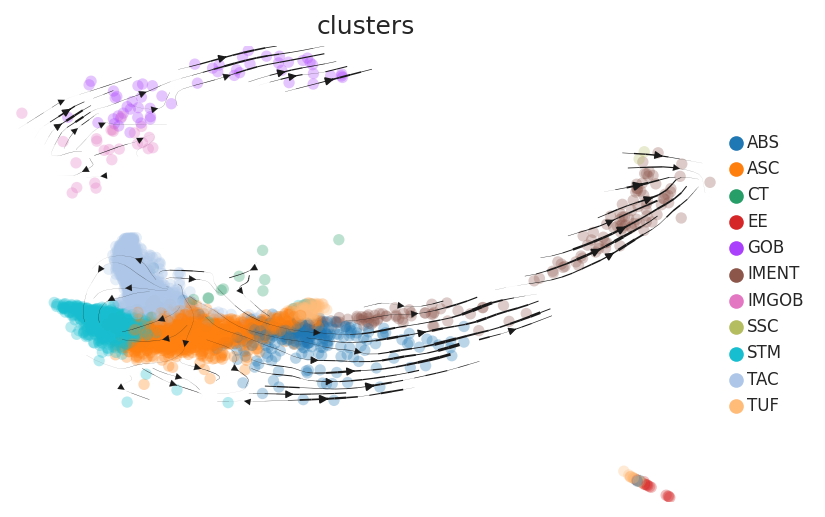 | 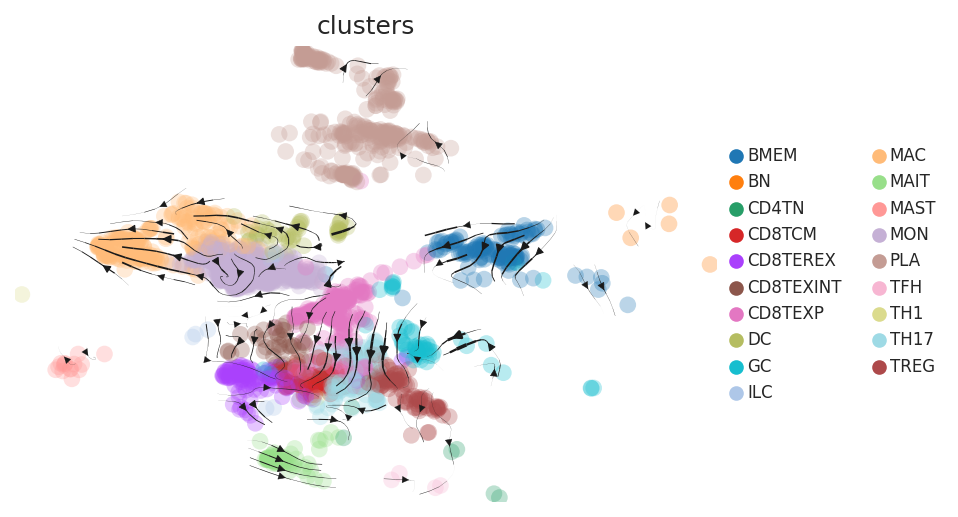 | 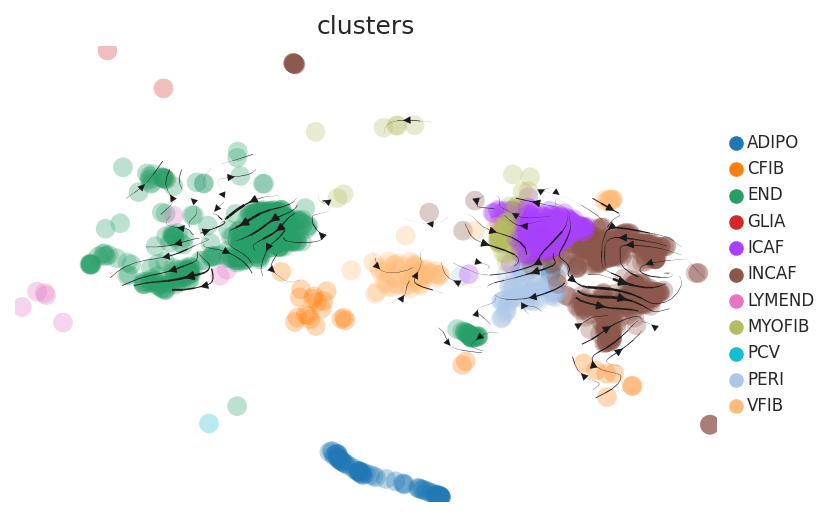 | |
| ∗RNA velocity maps for epithelial, immune and stromal compartments of Colorectum tissue with different disease states. |
Top |
TF regulatory network analysis |
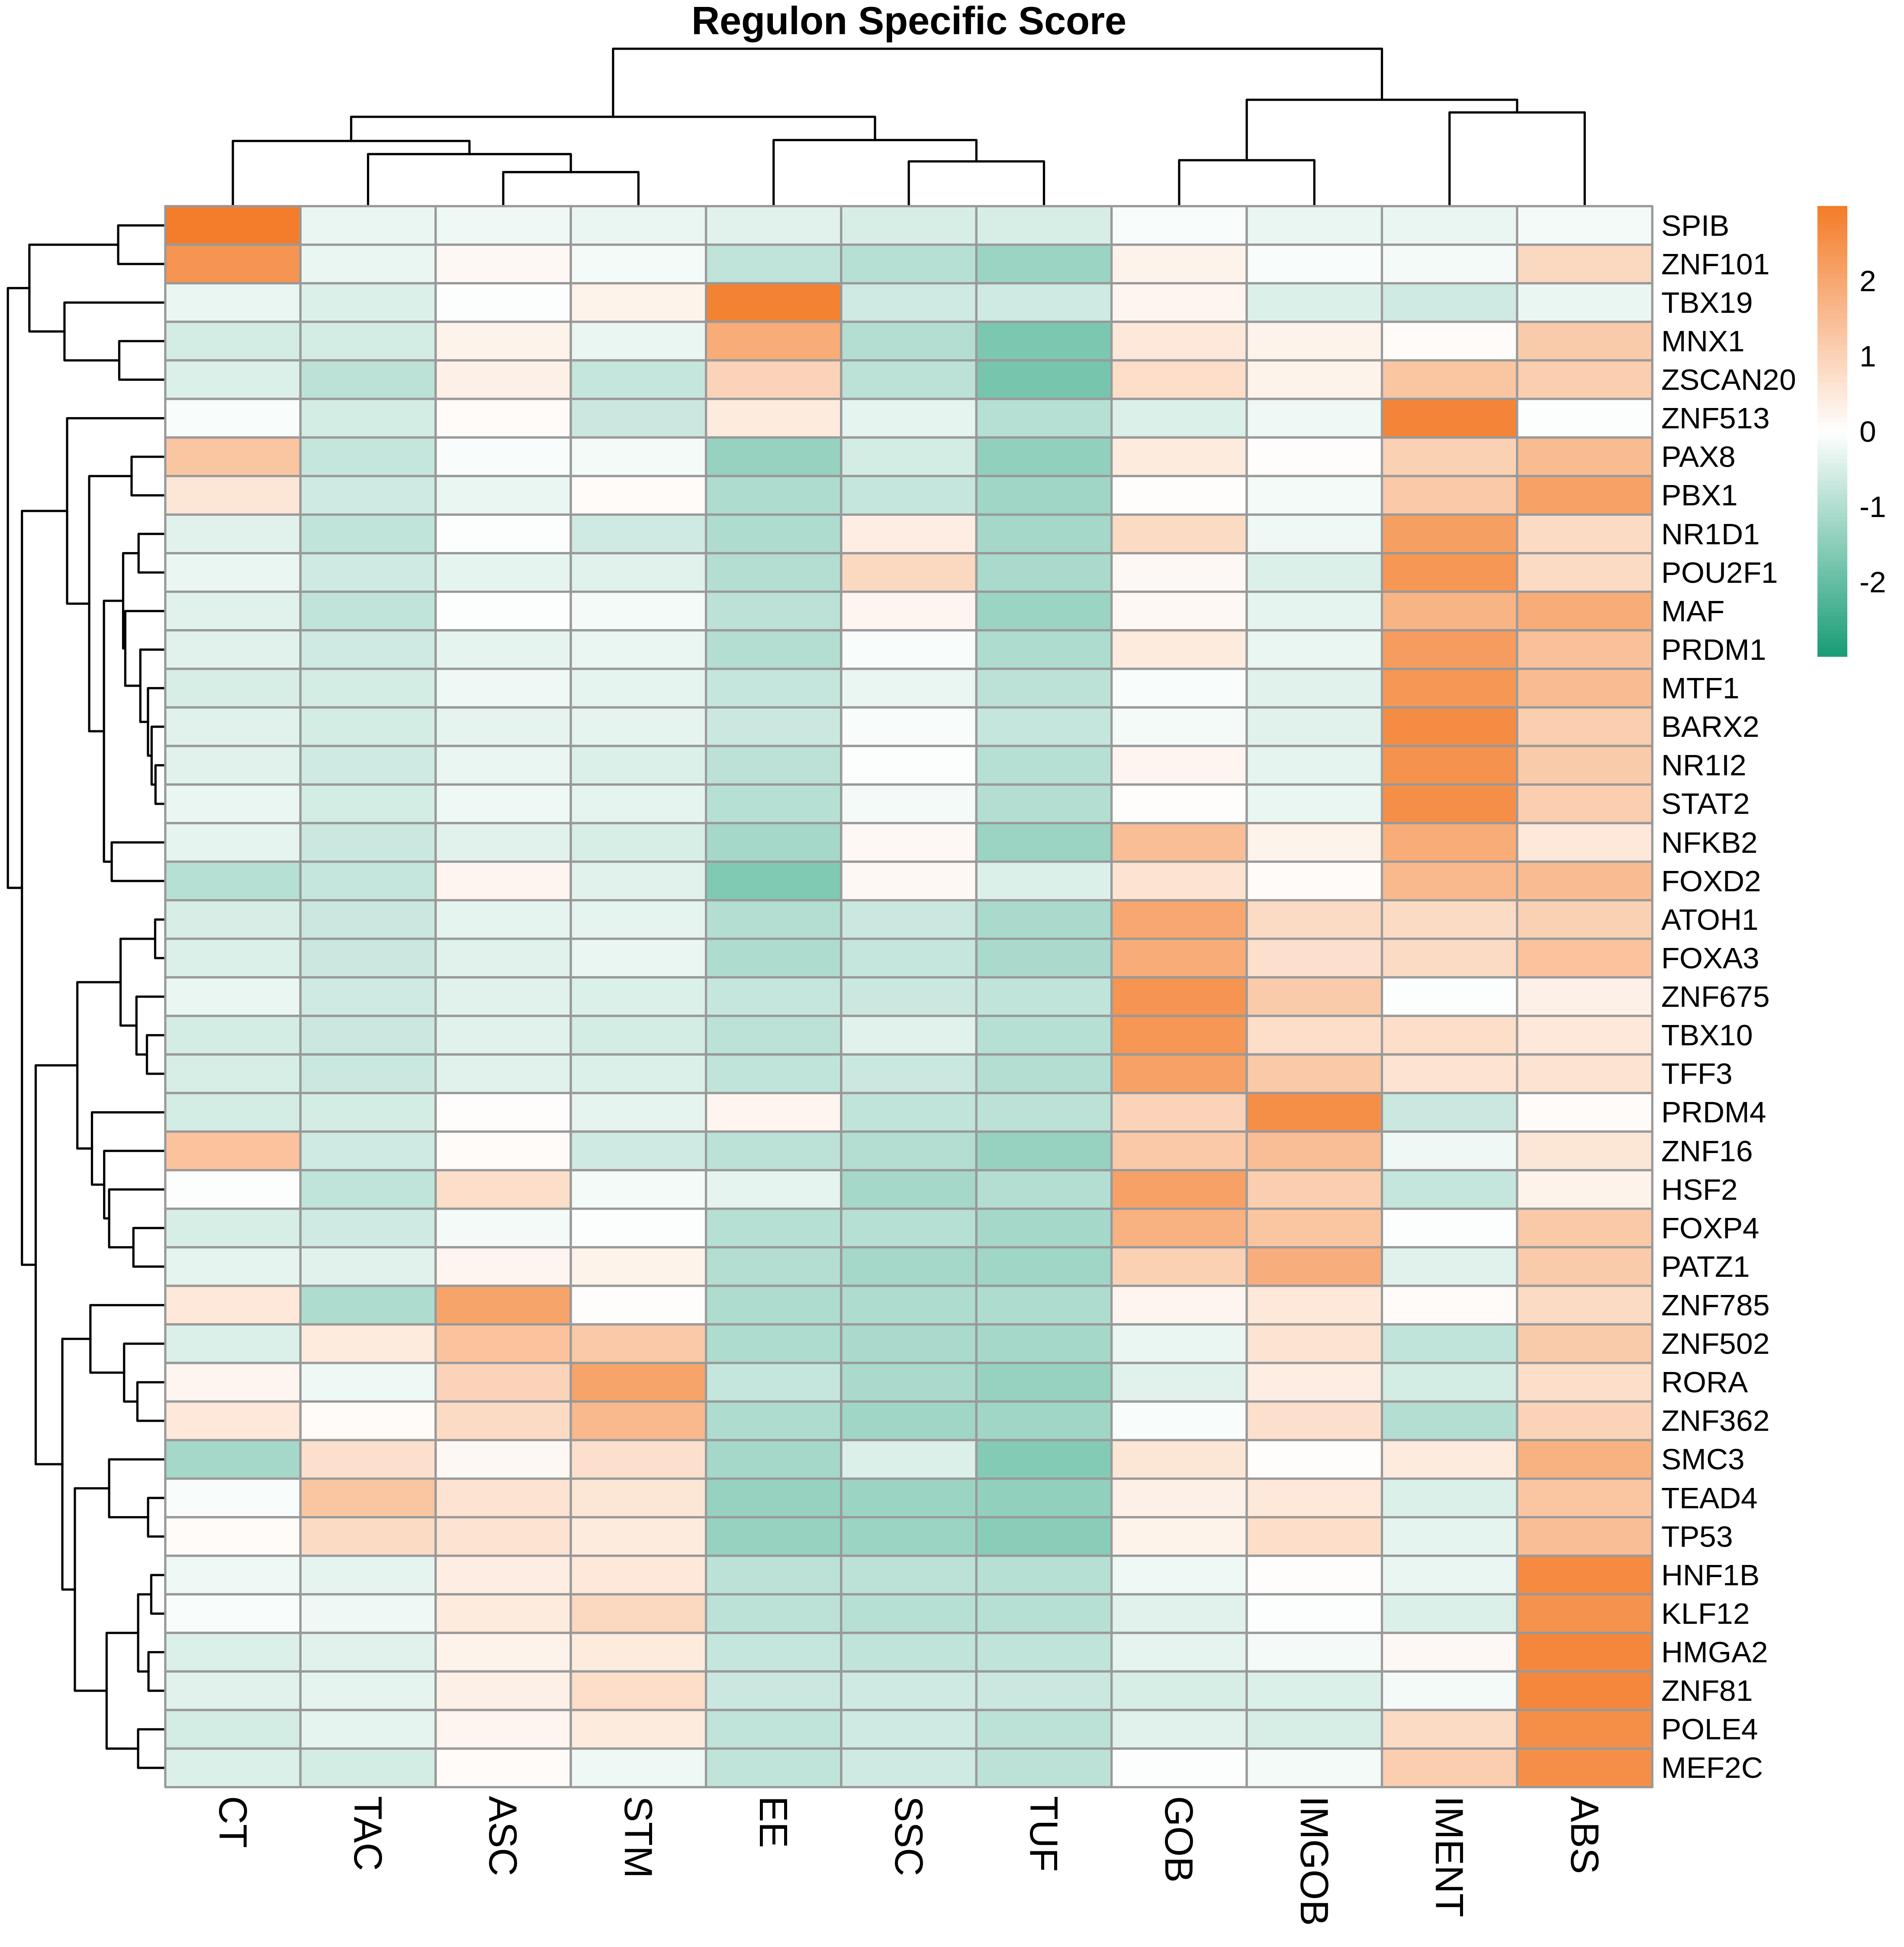
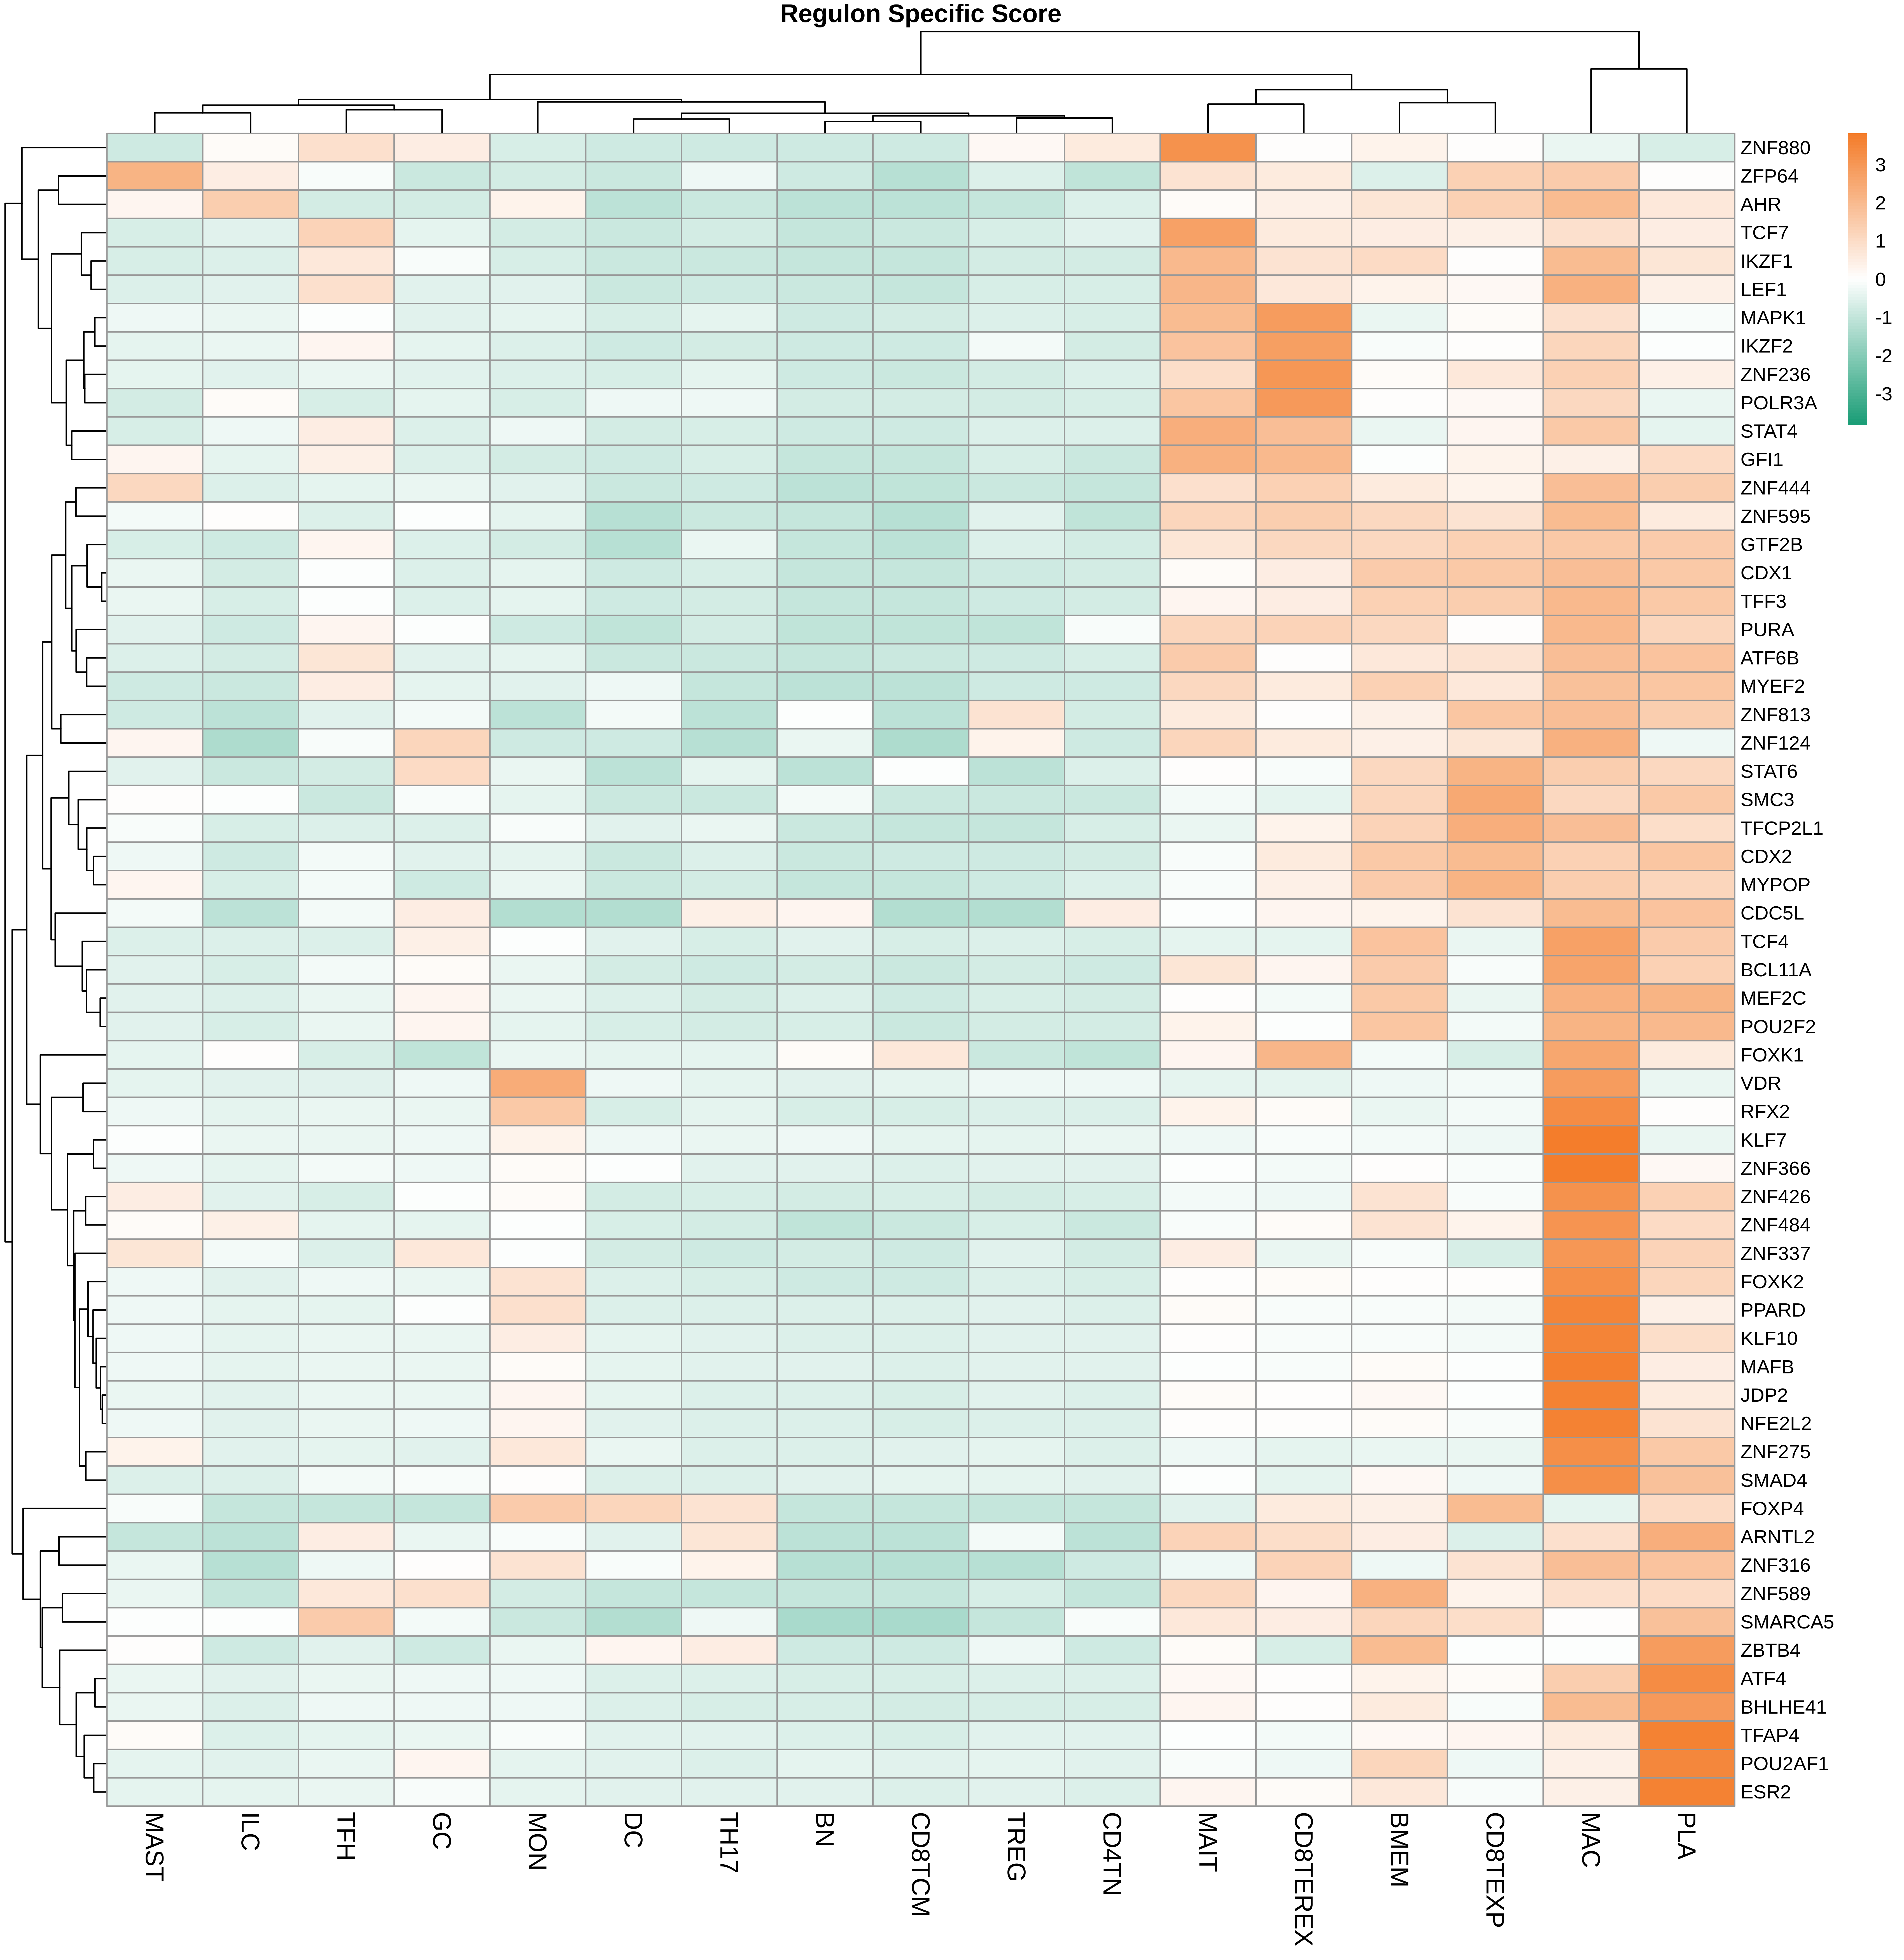
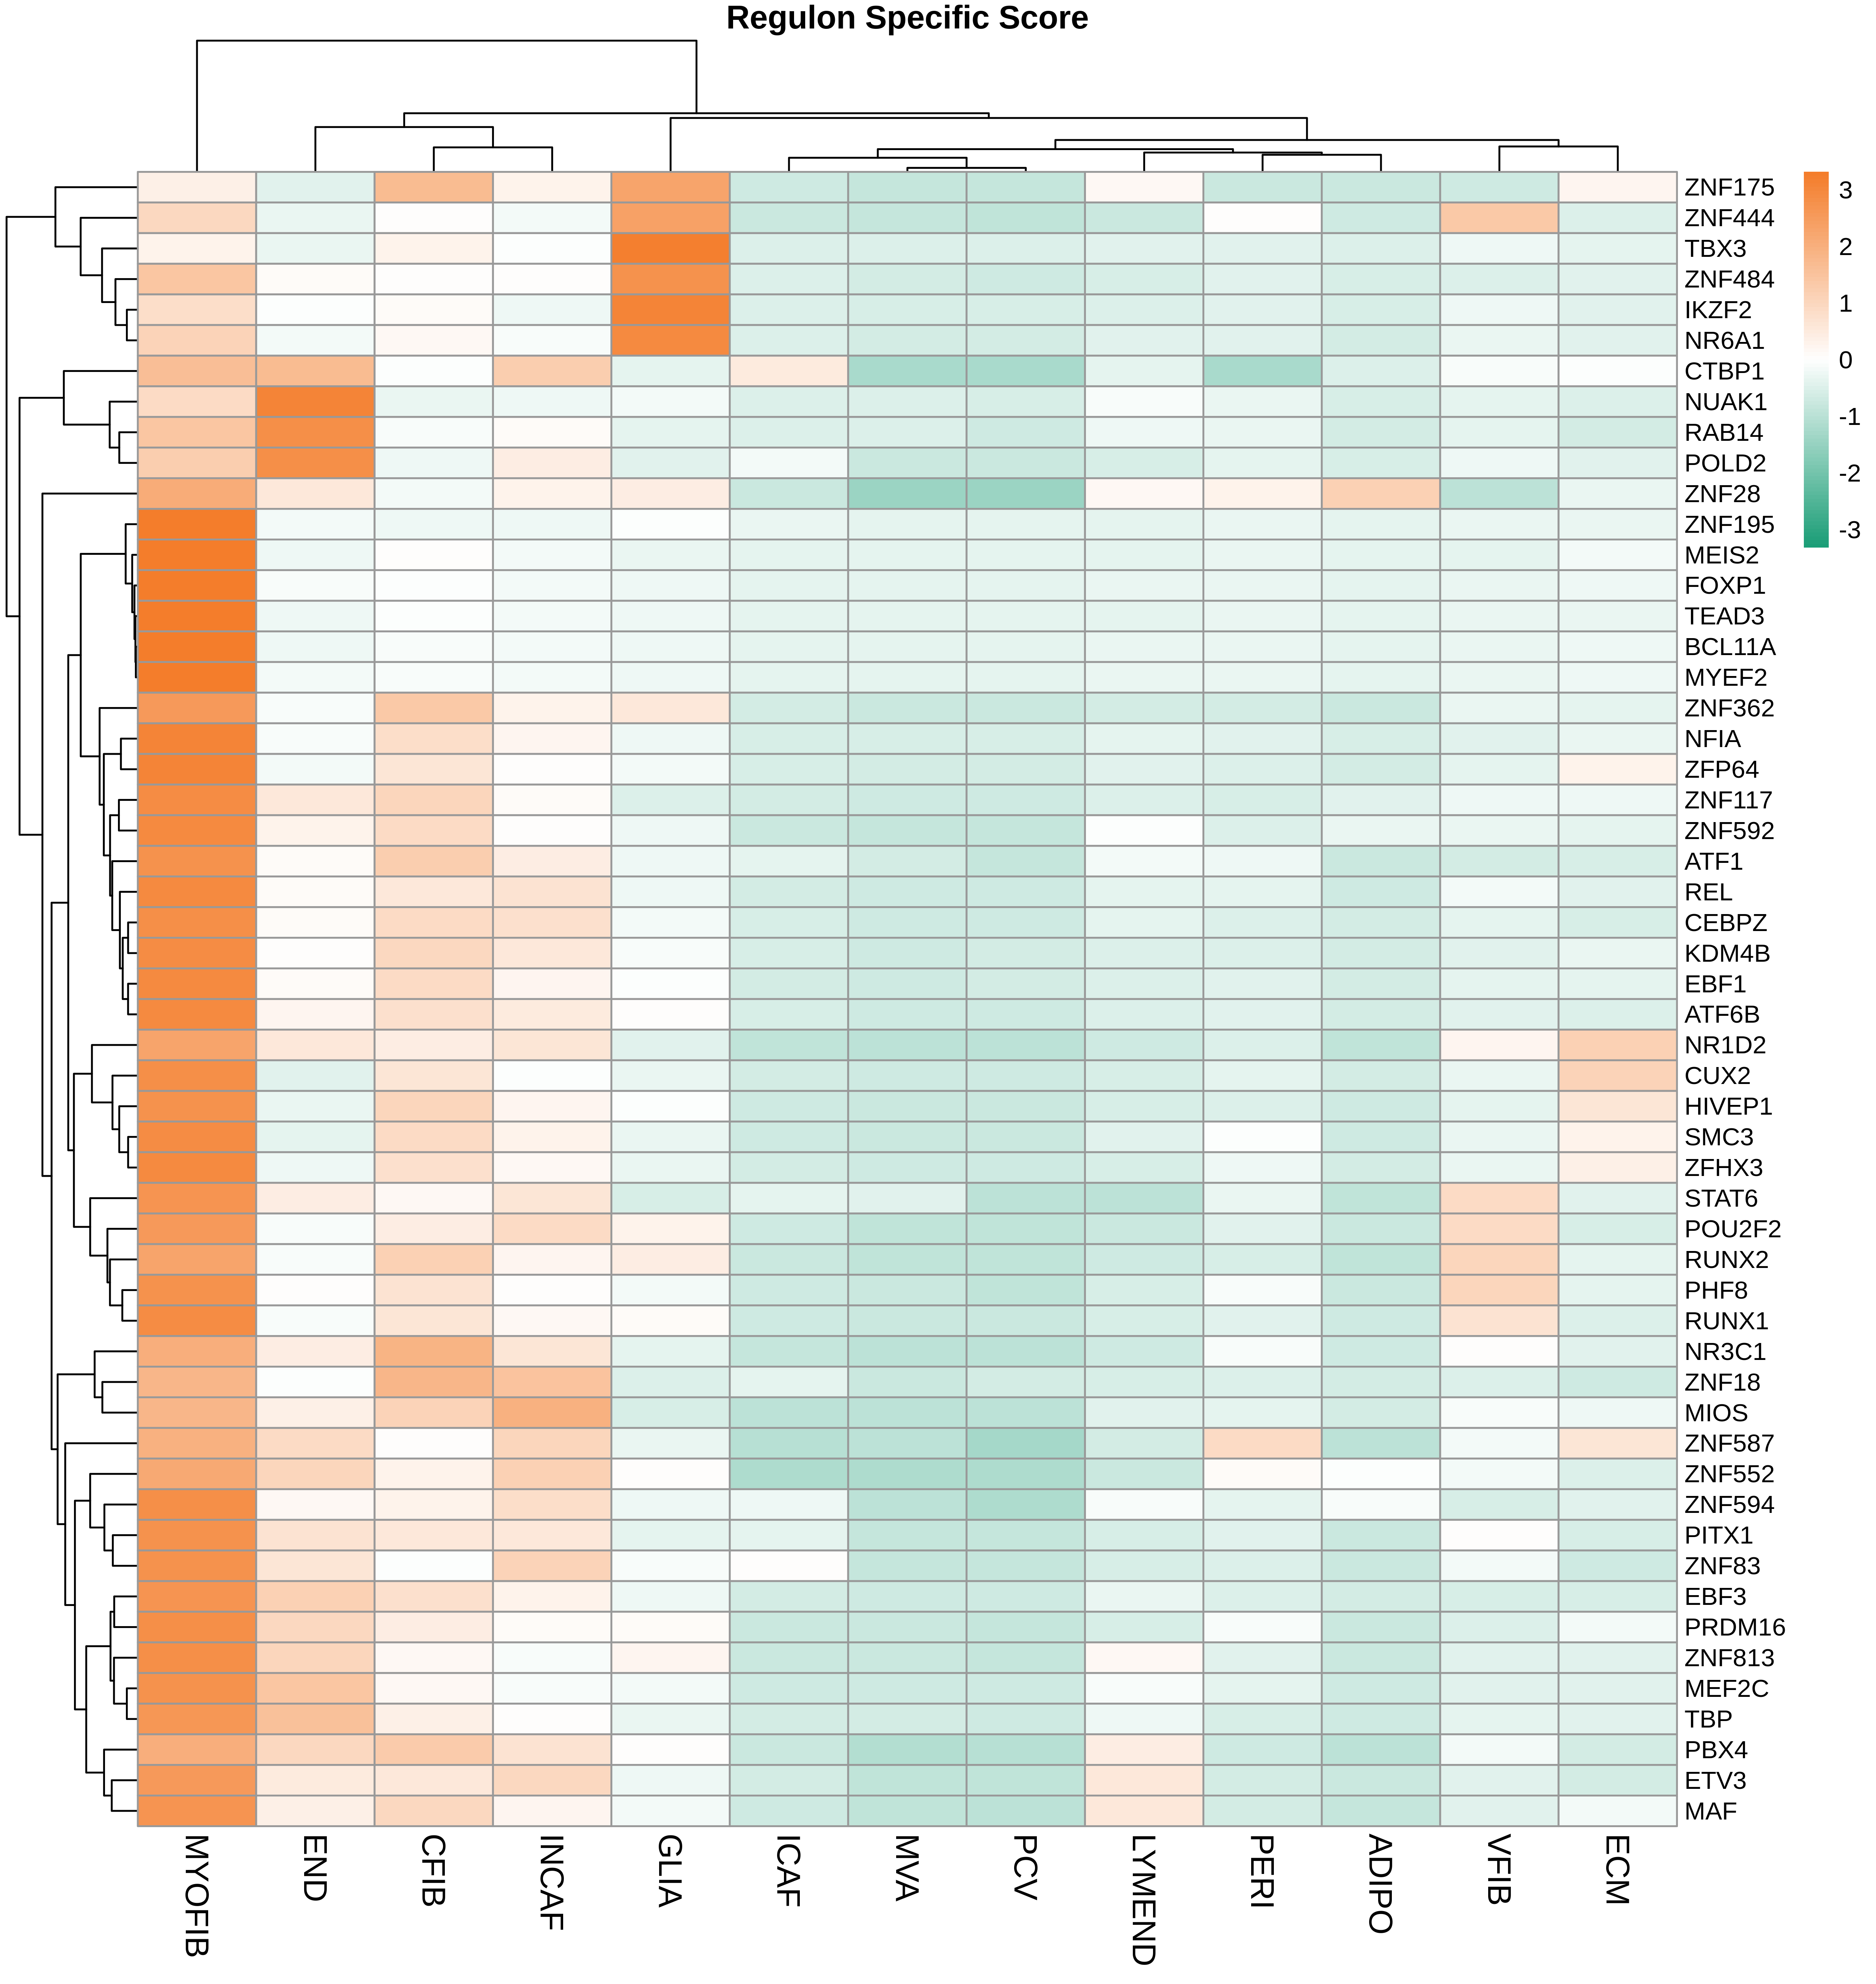
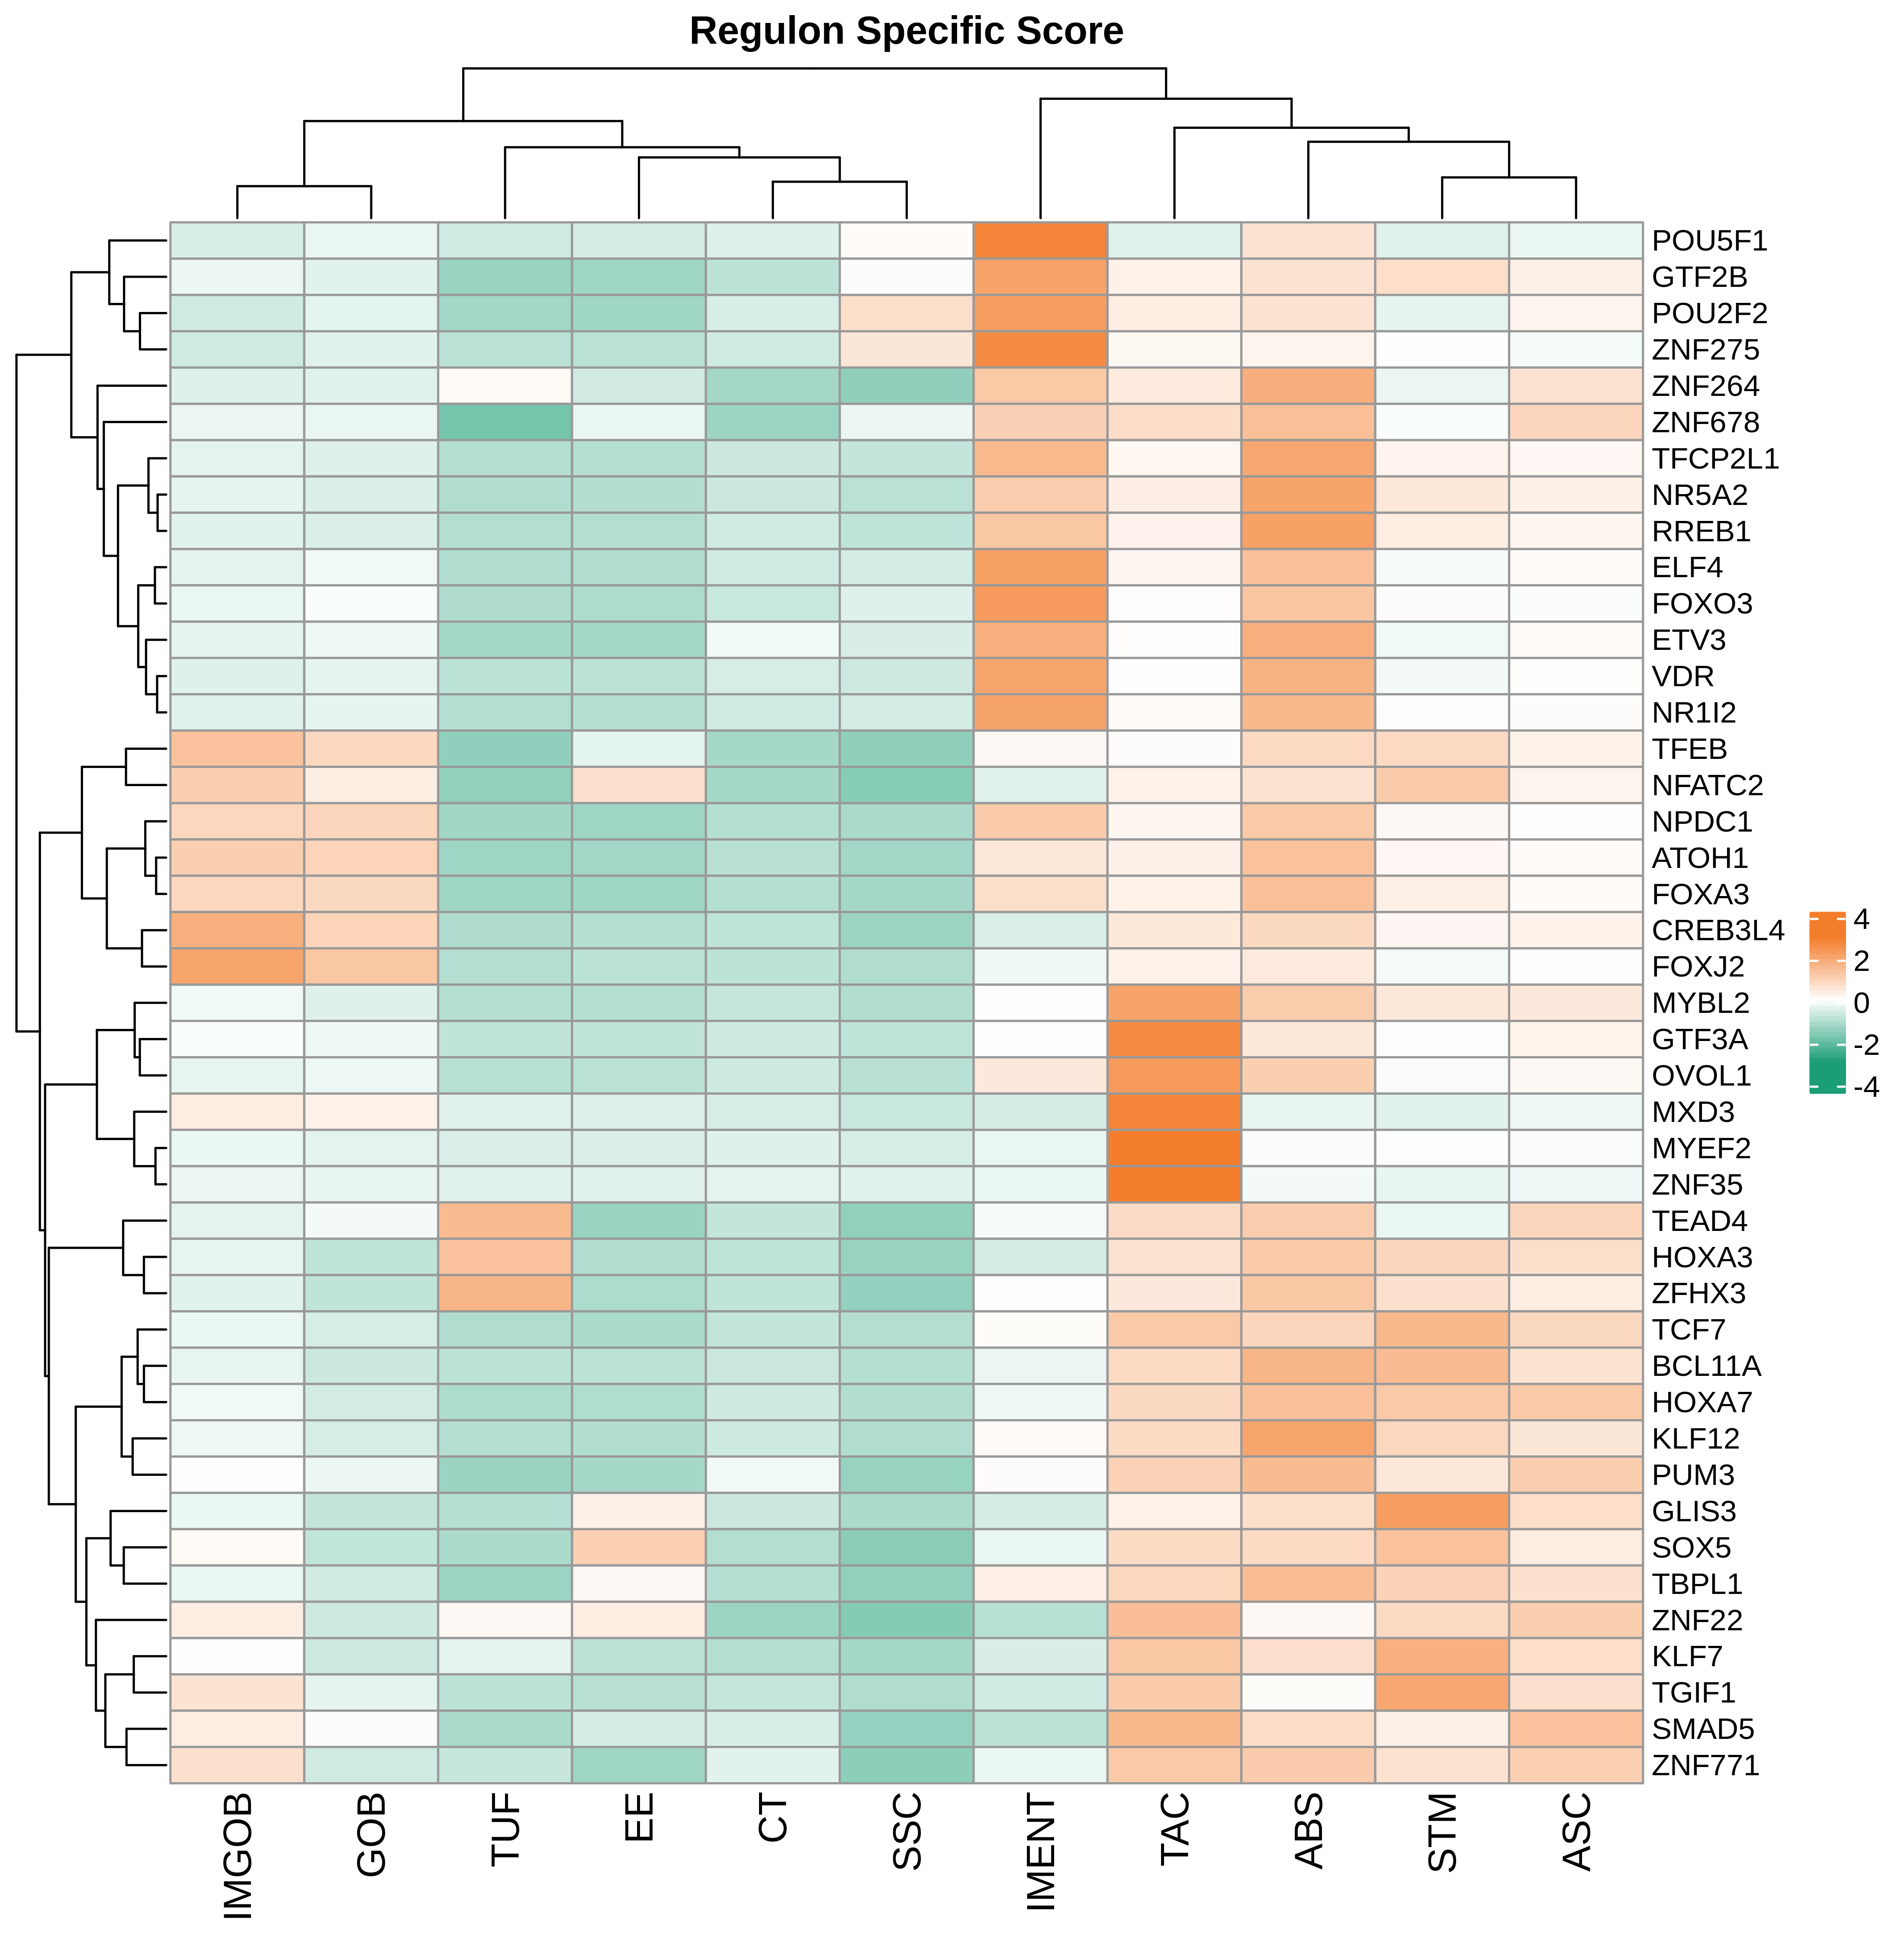
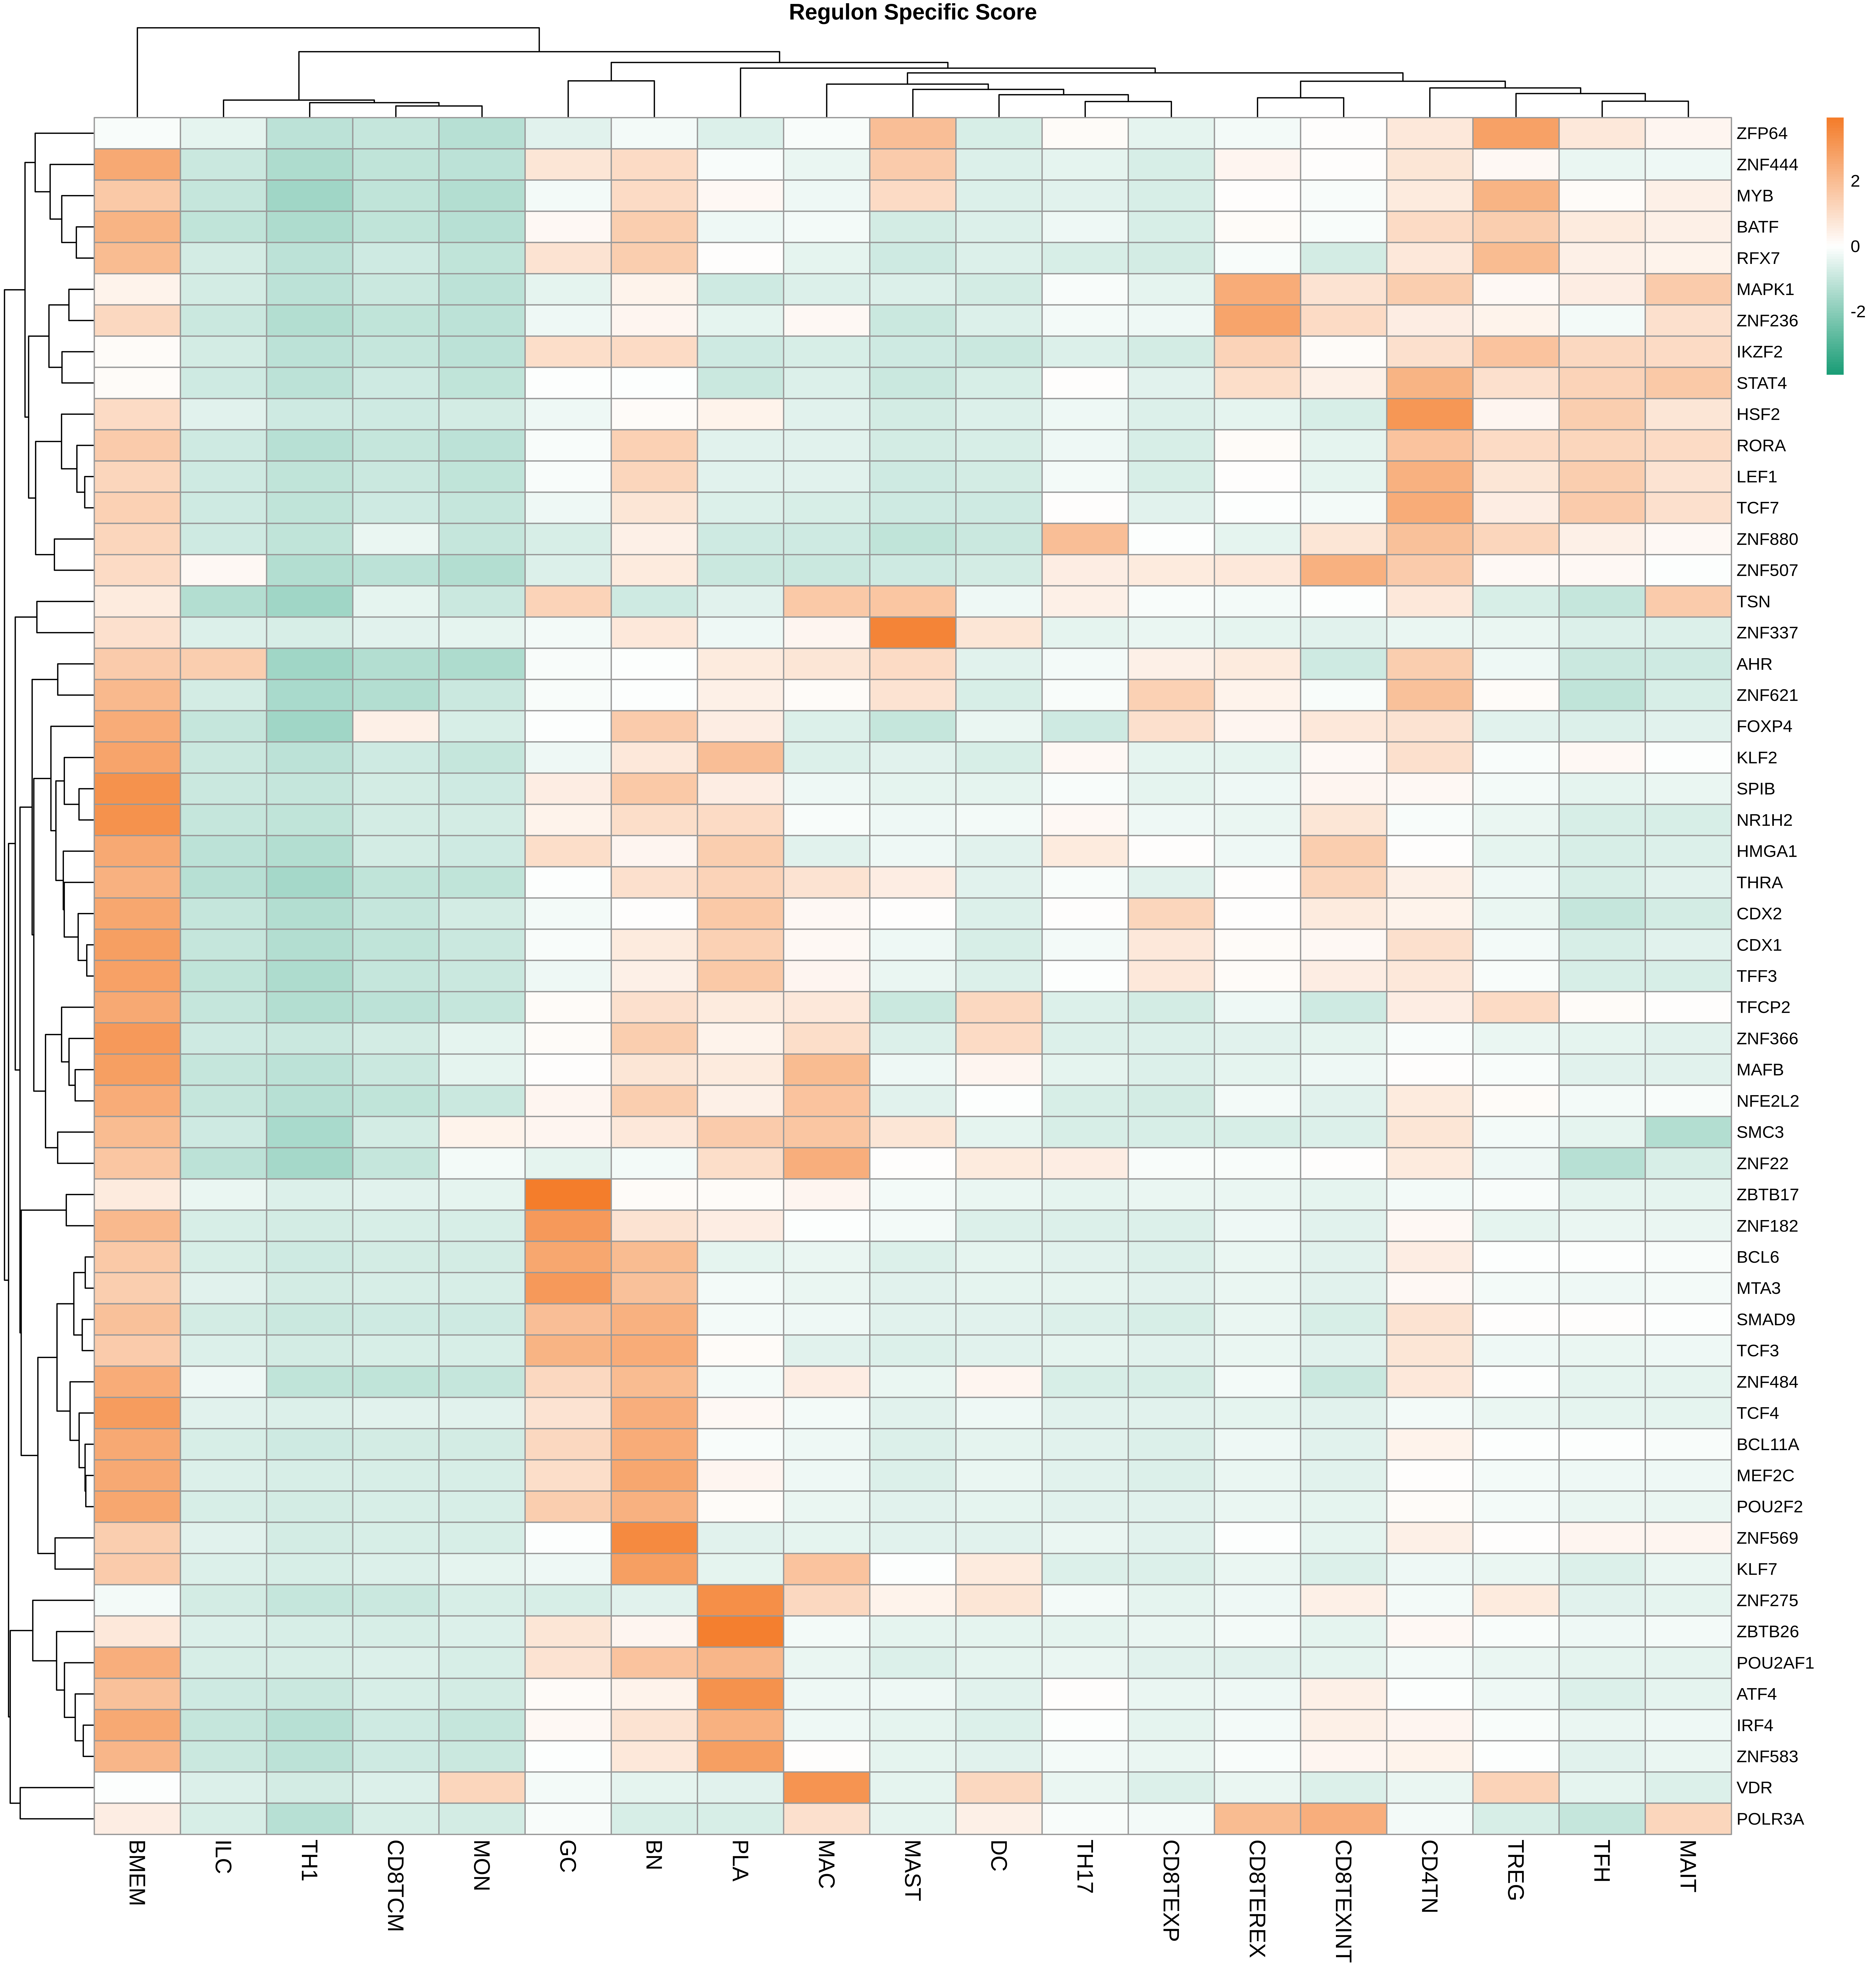
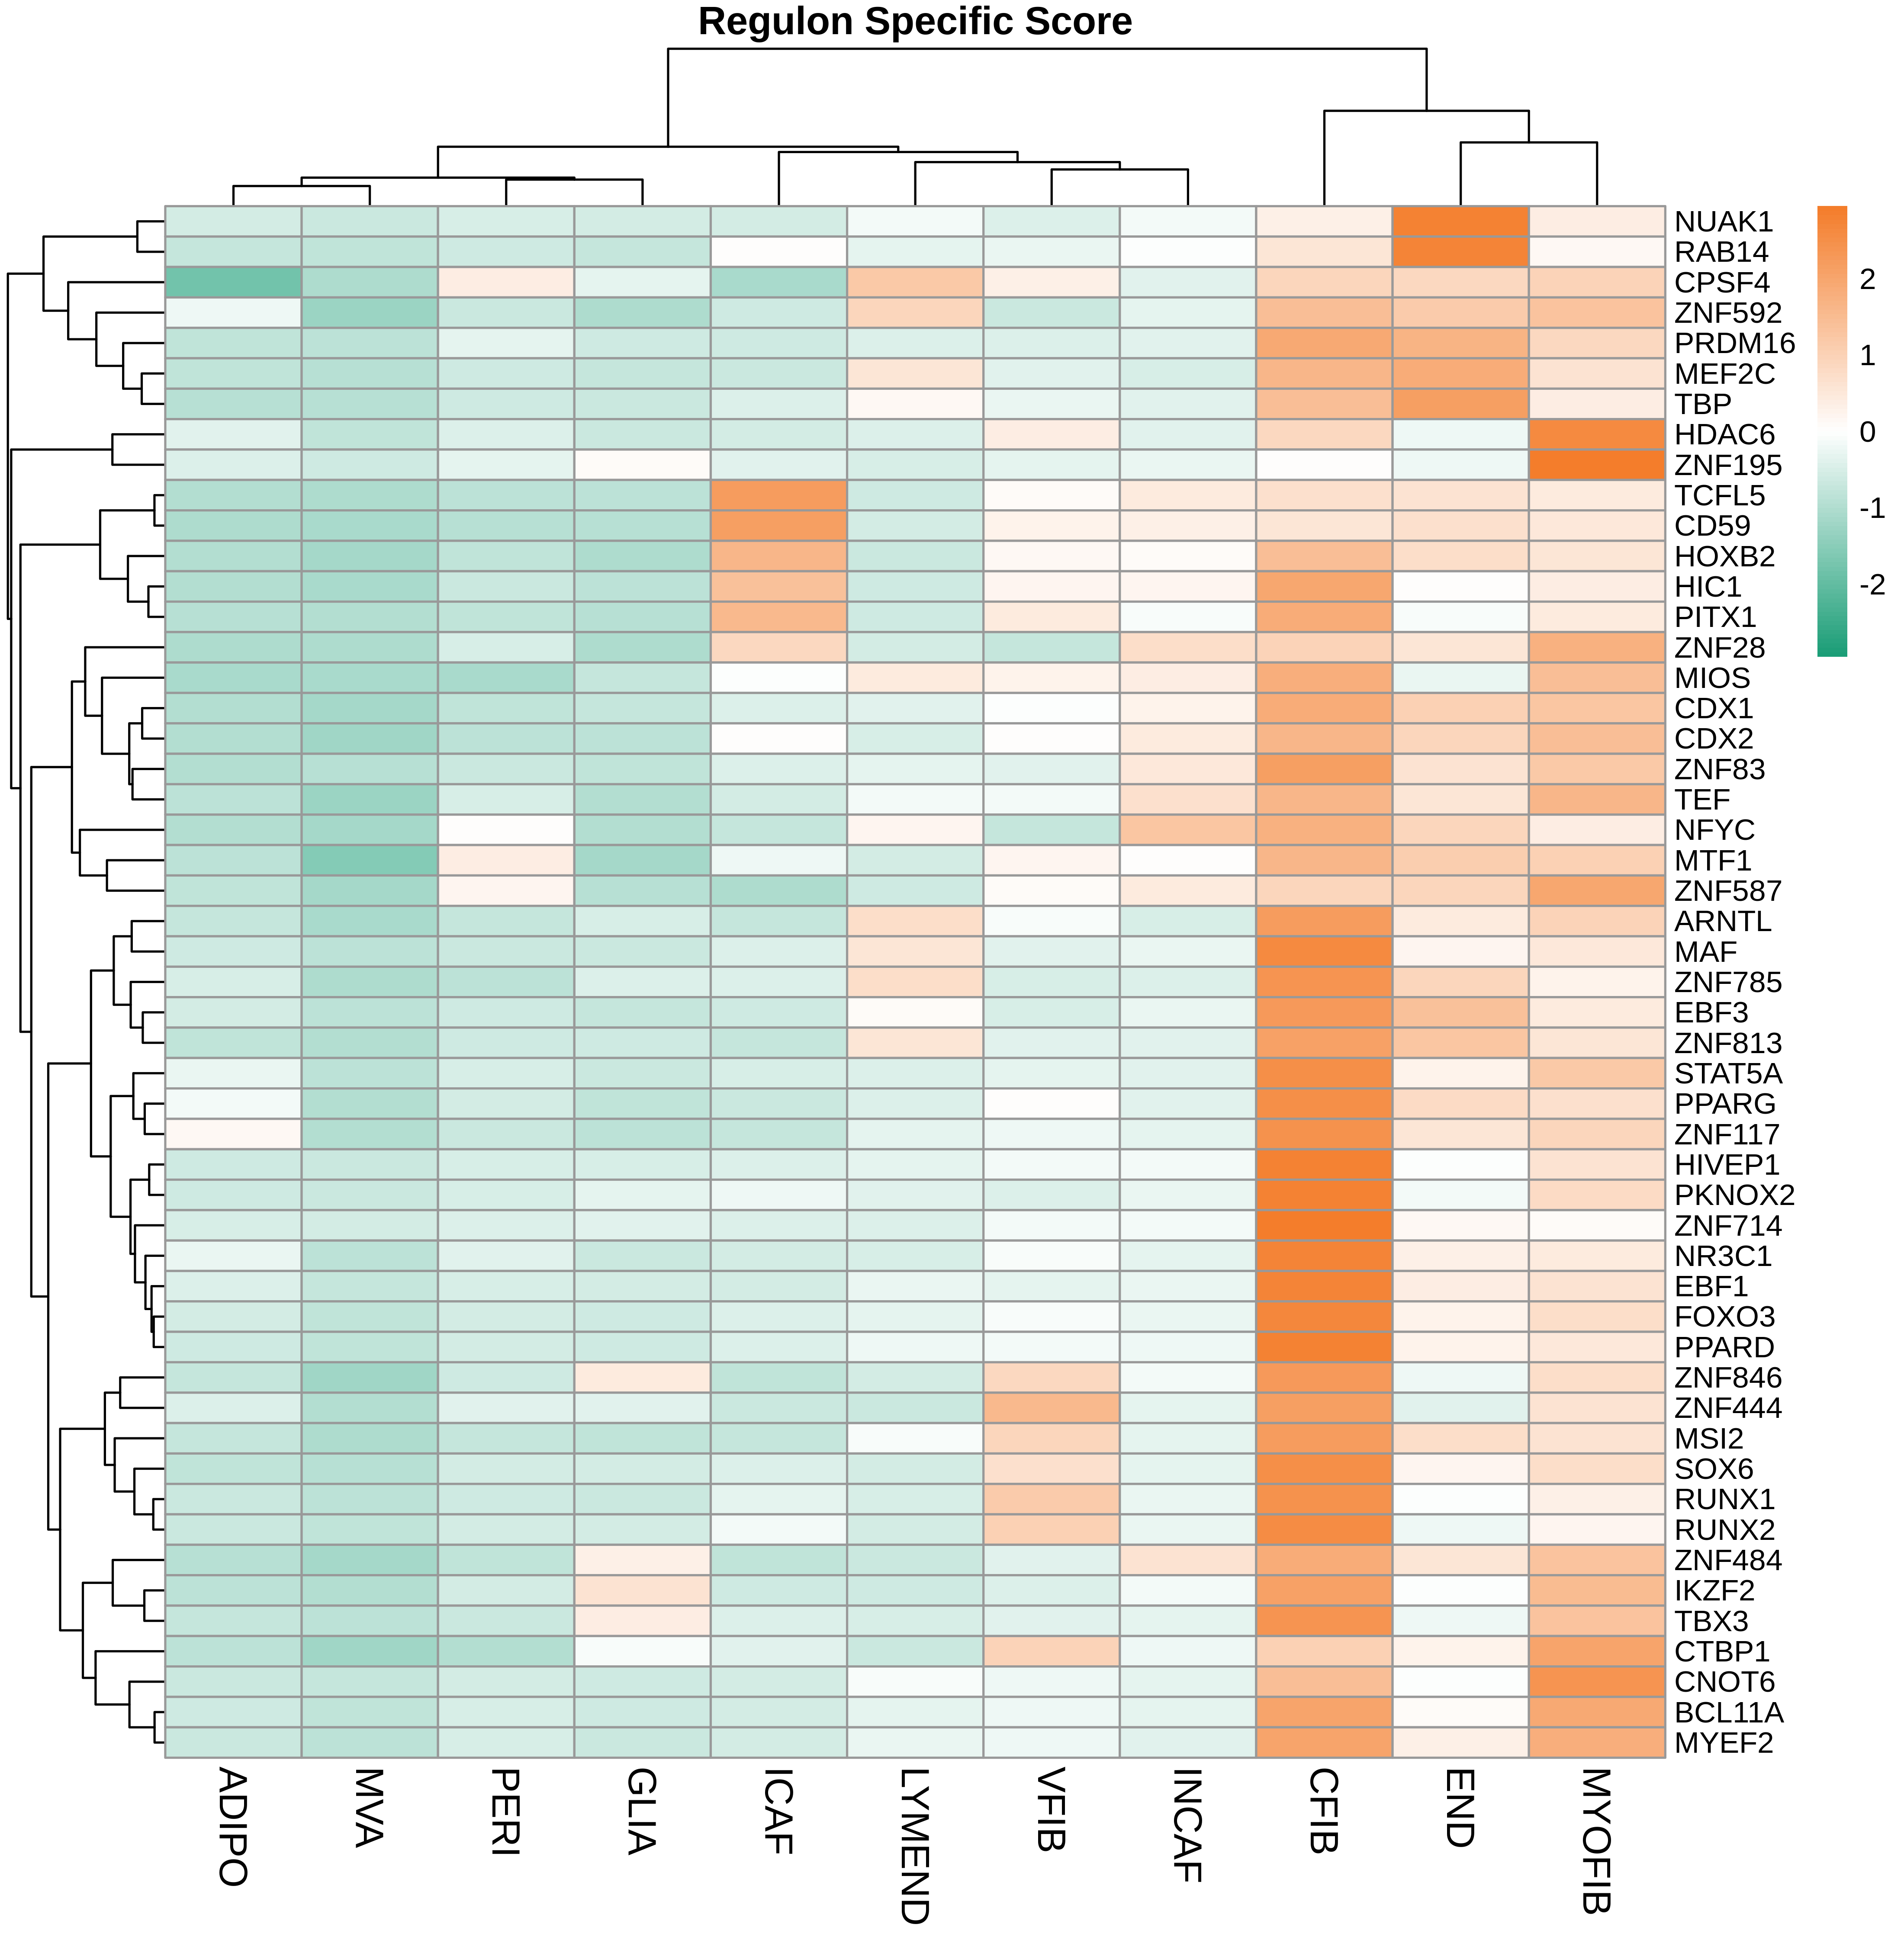
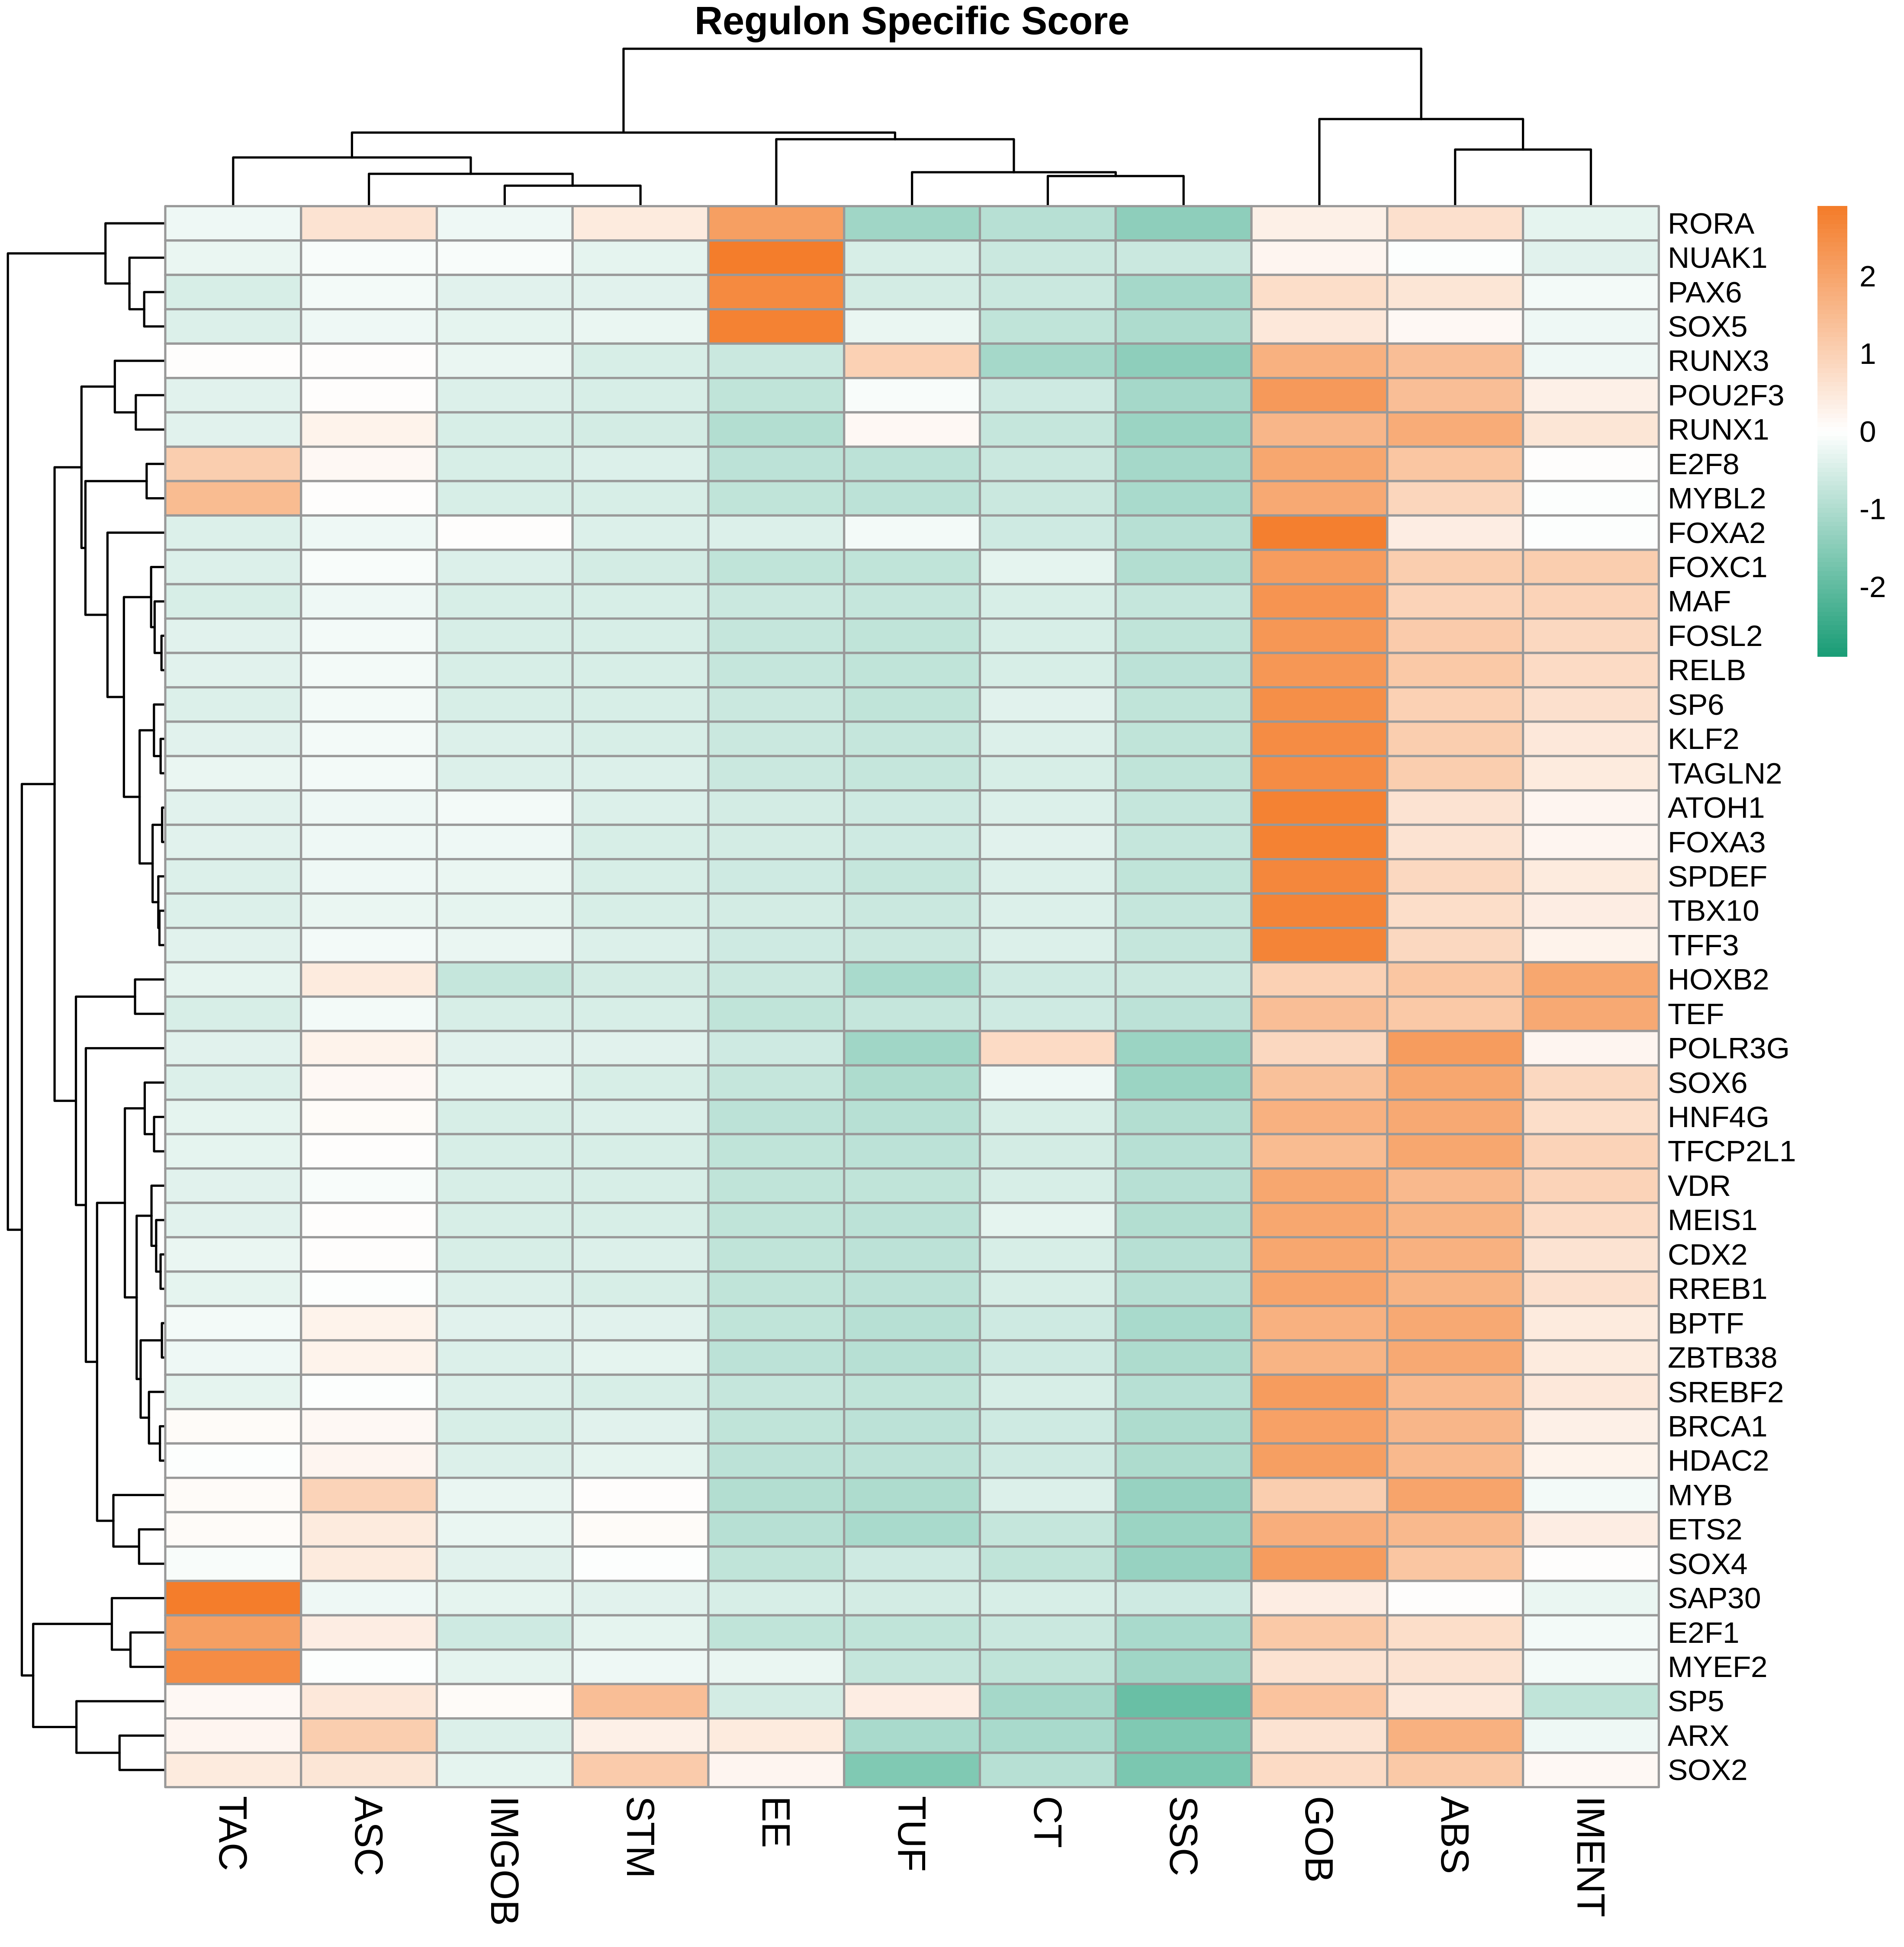
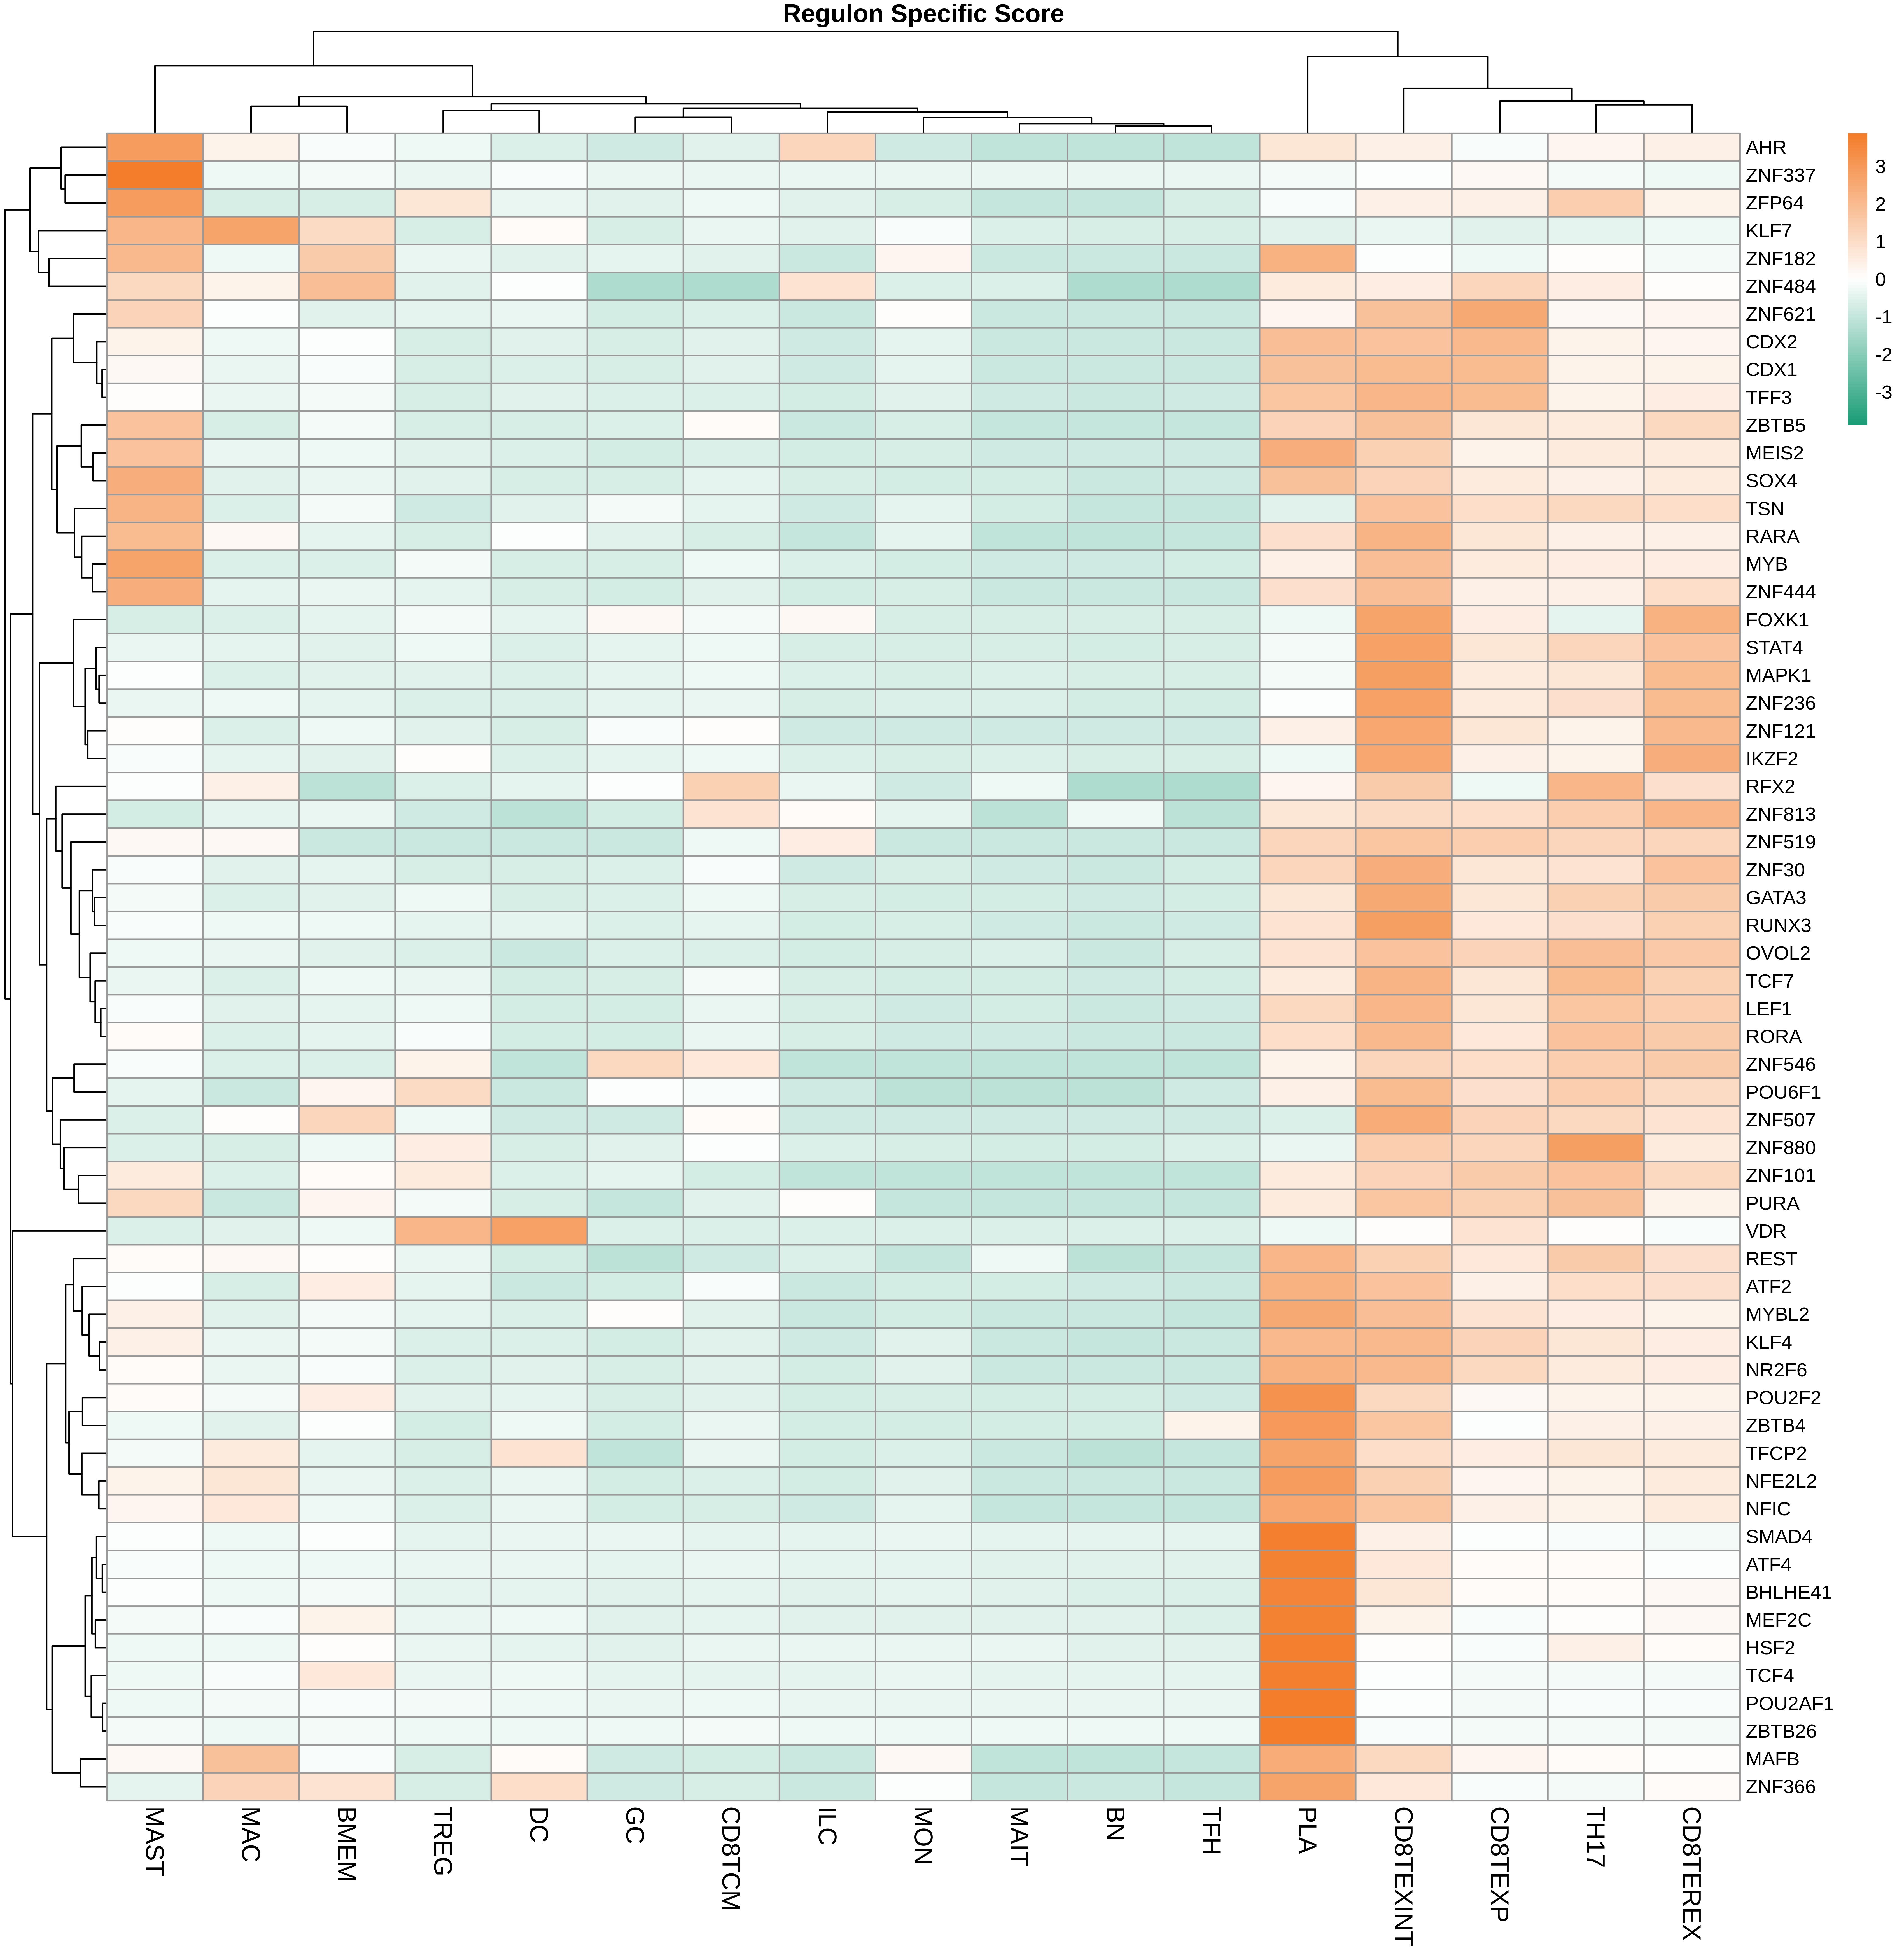
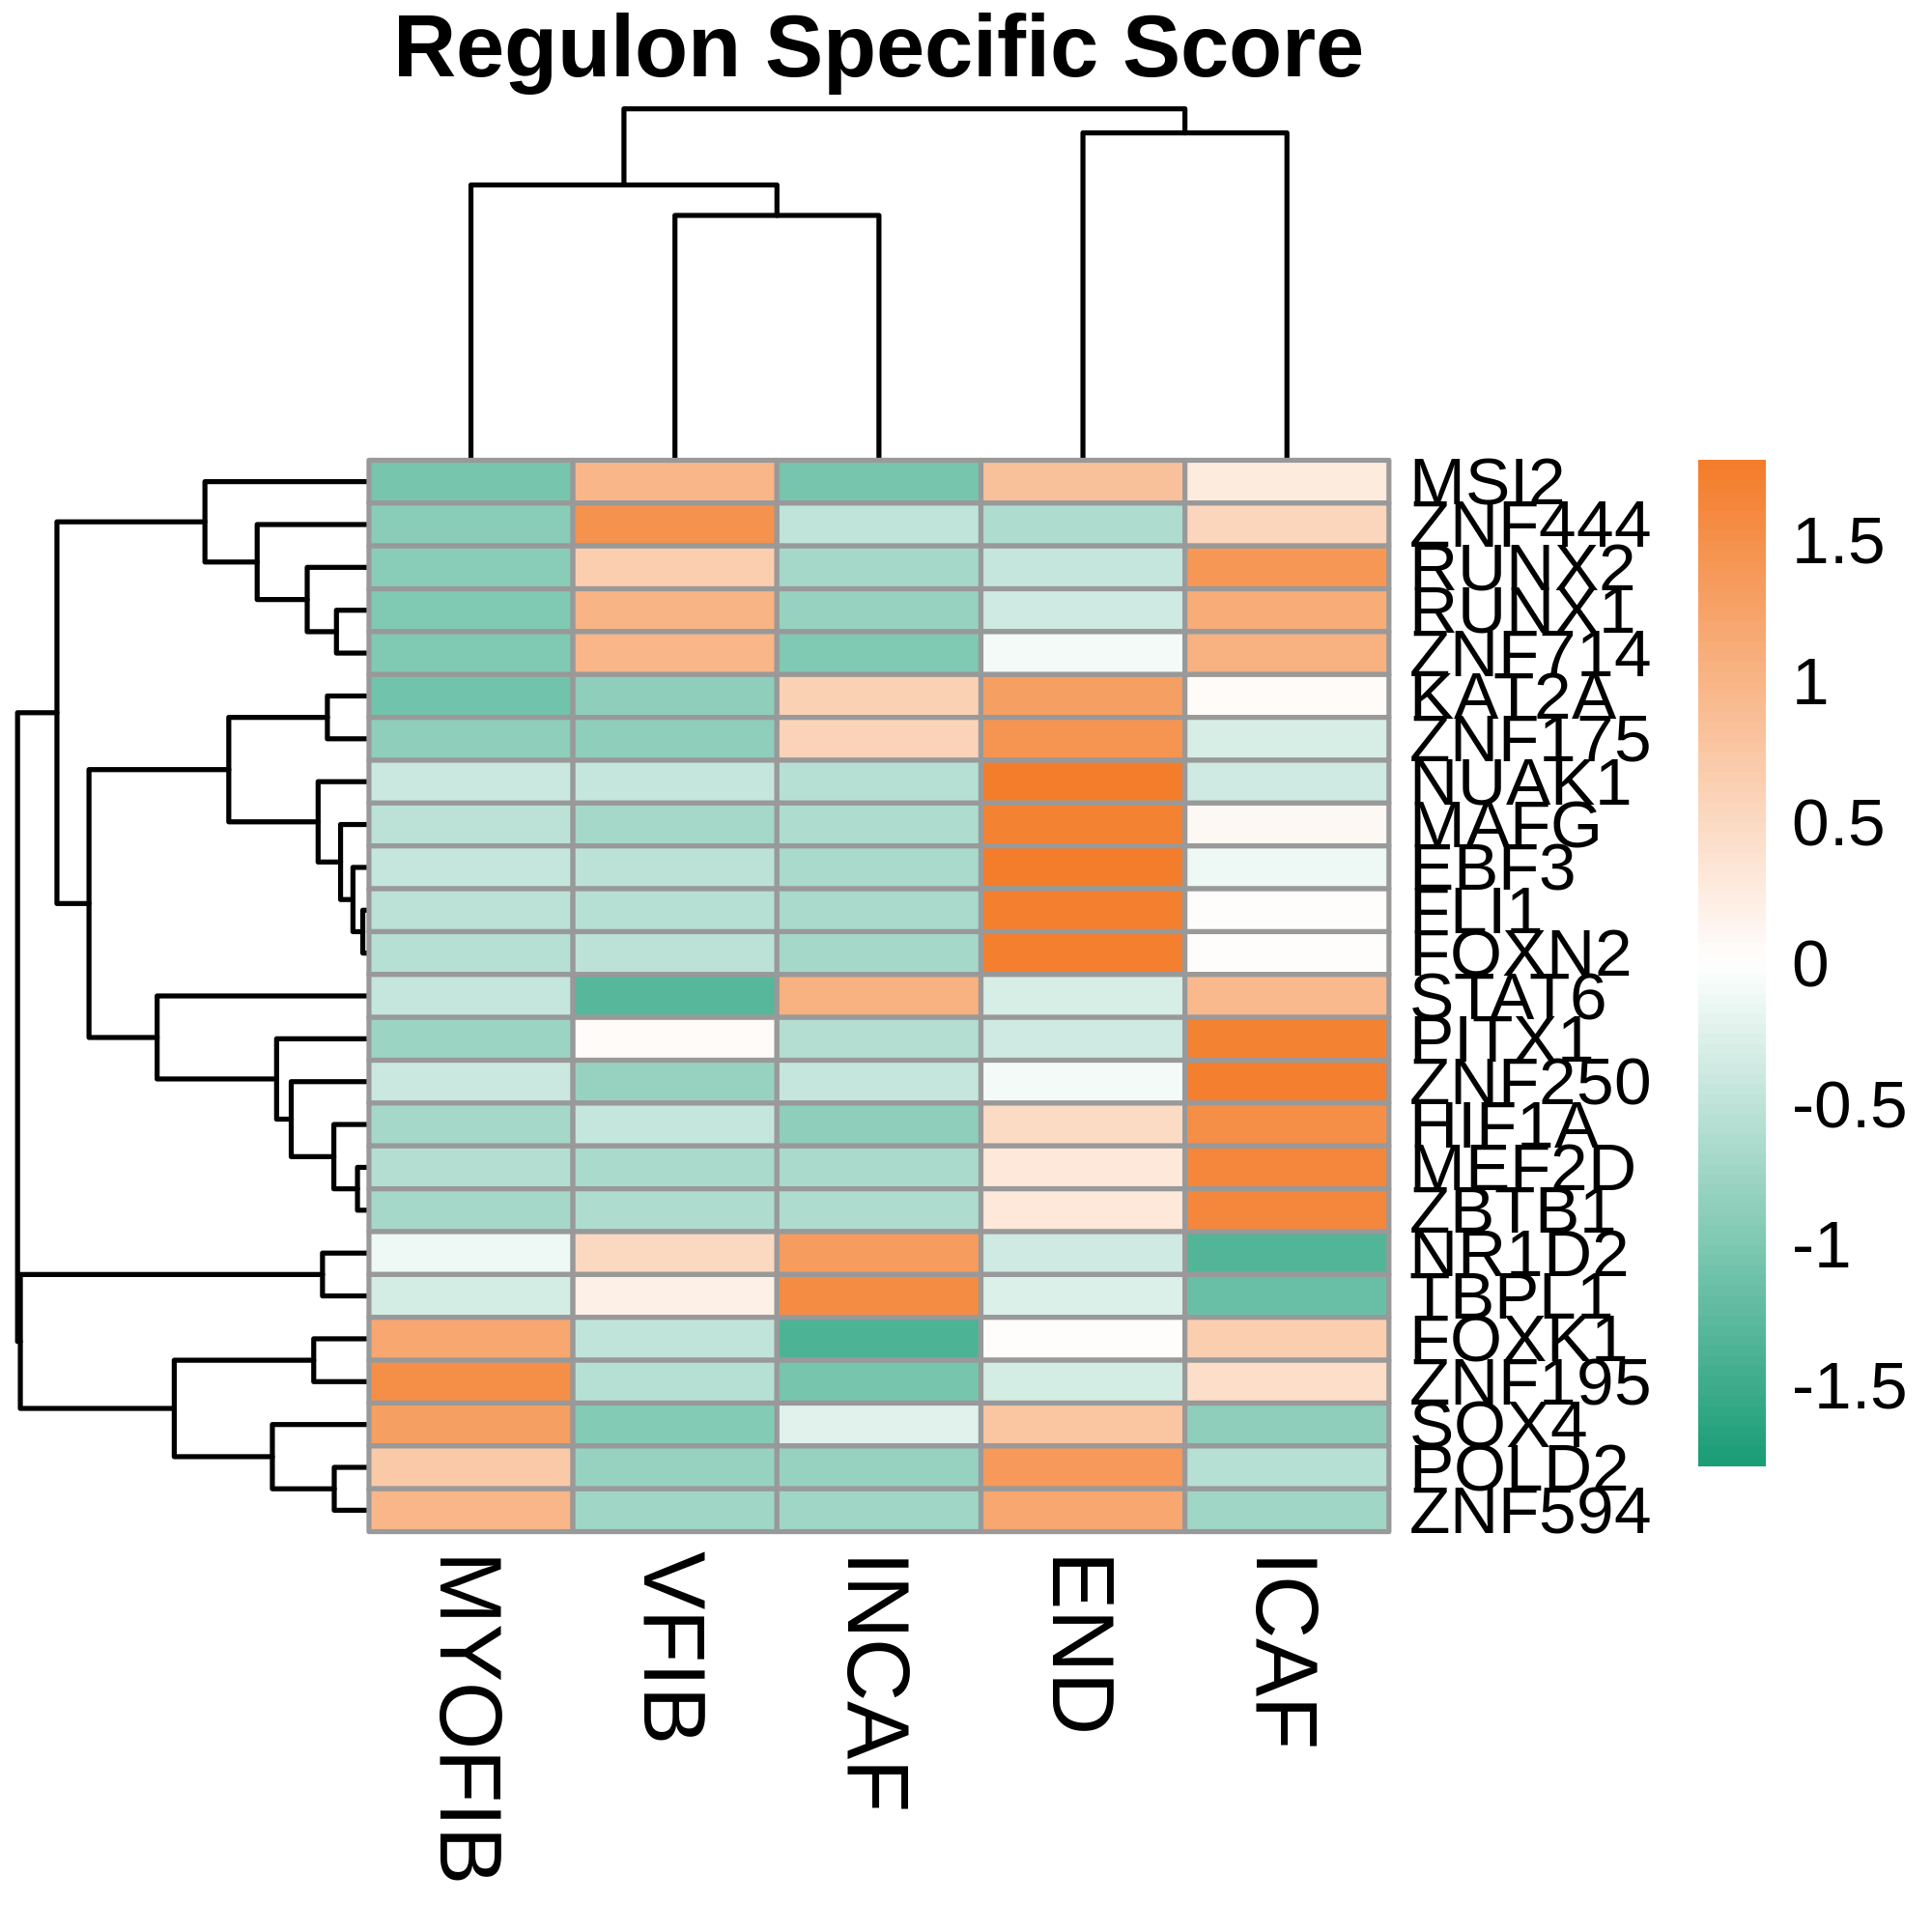
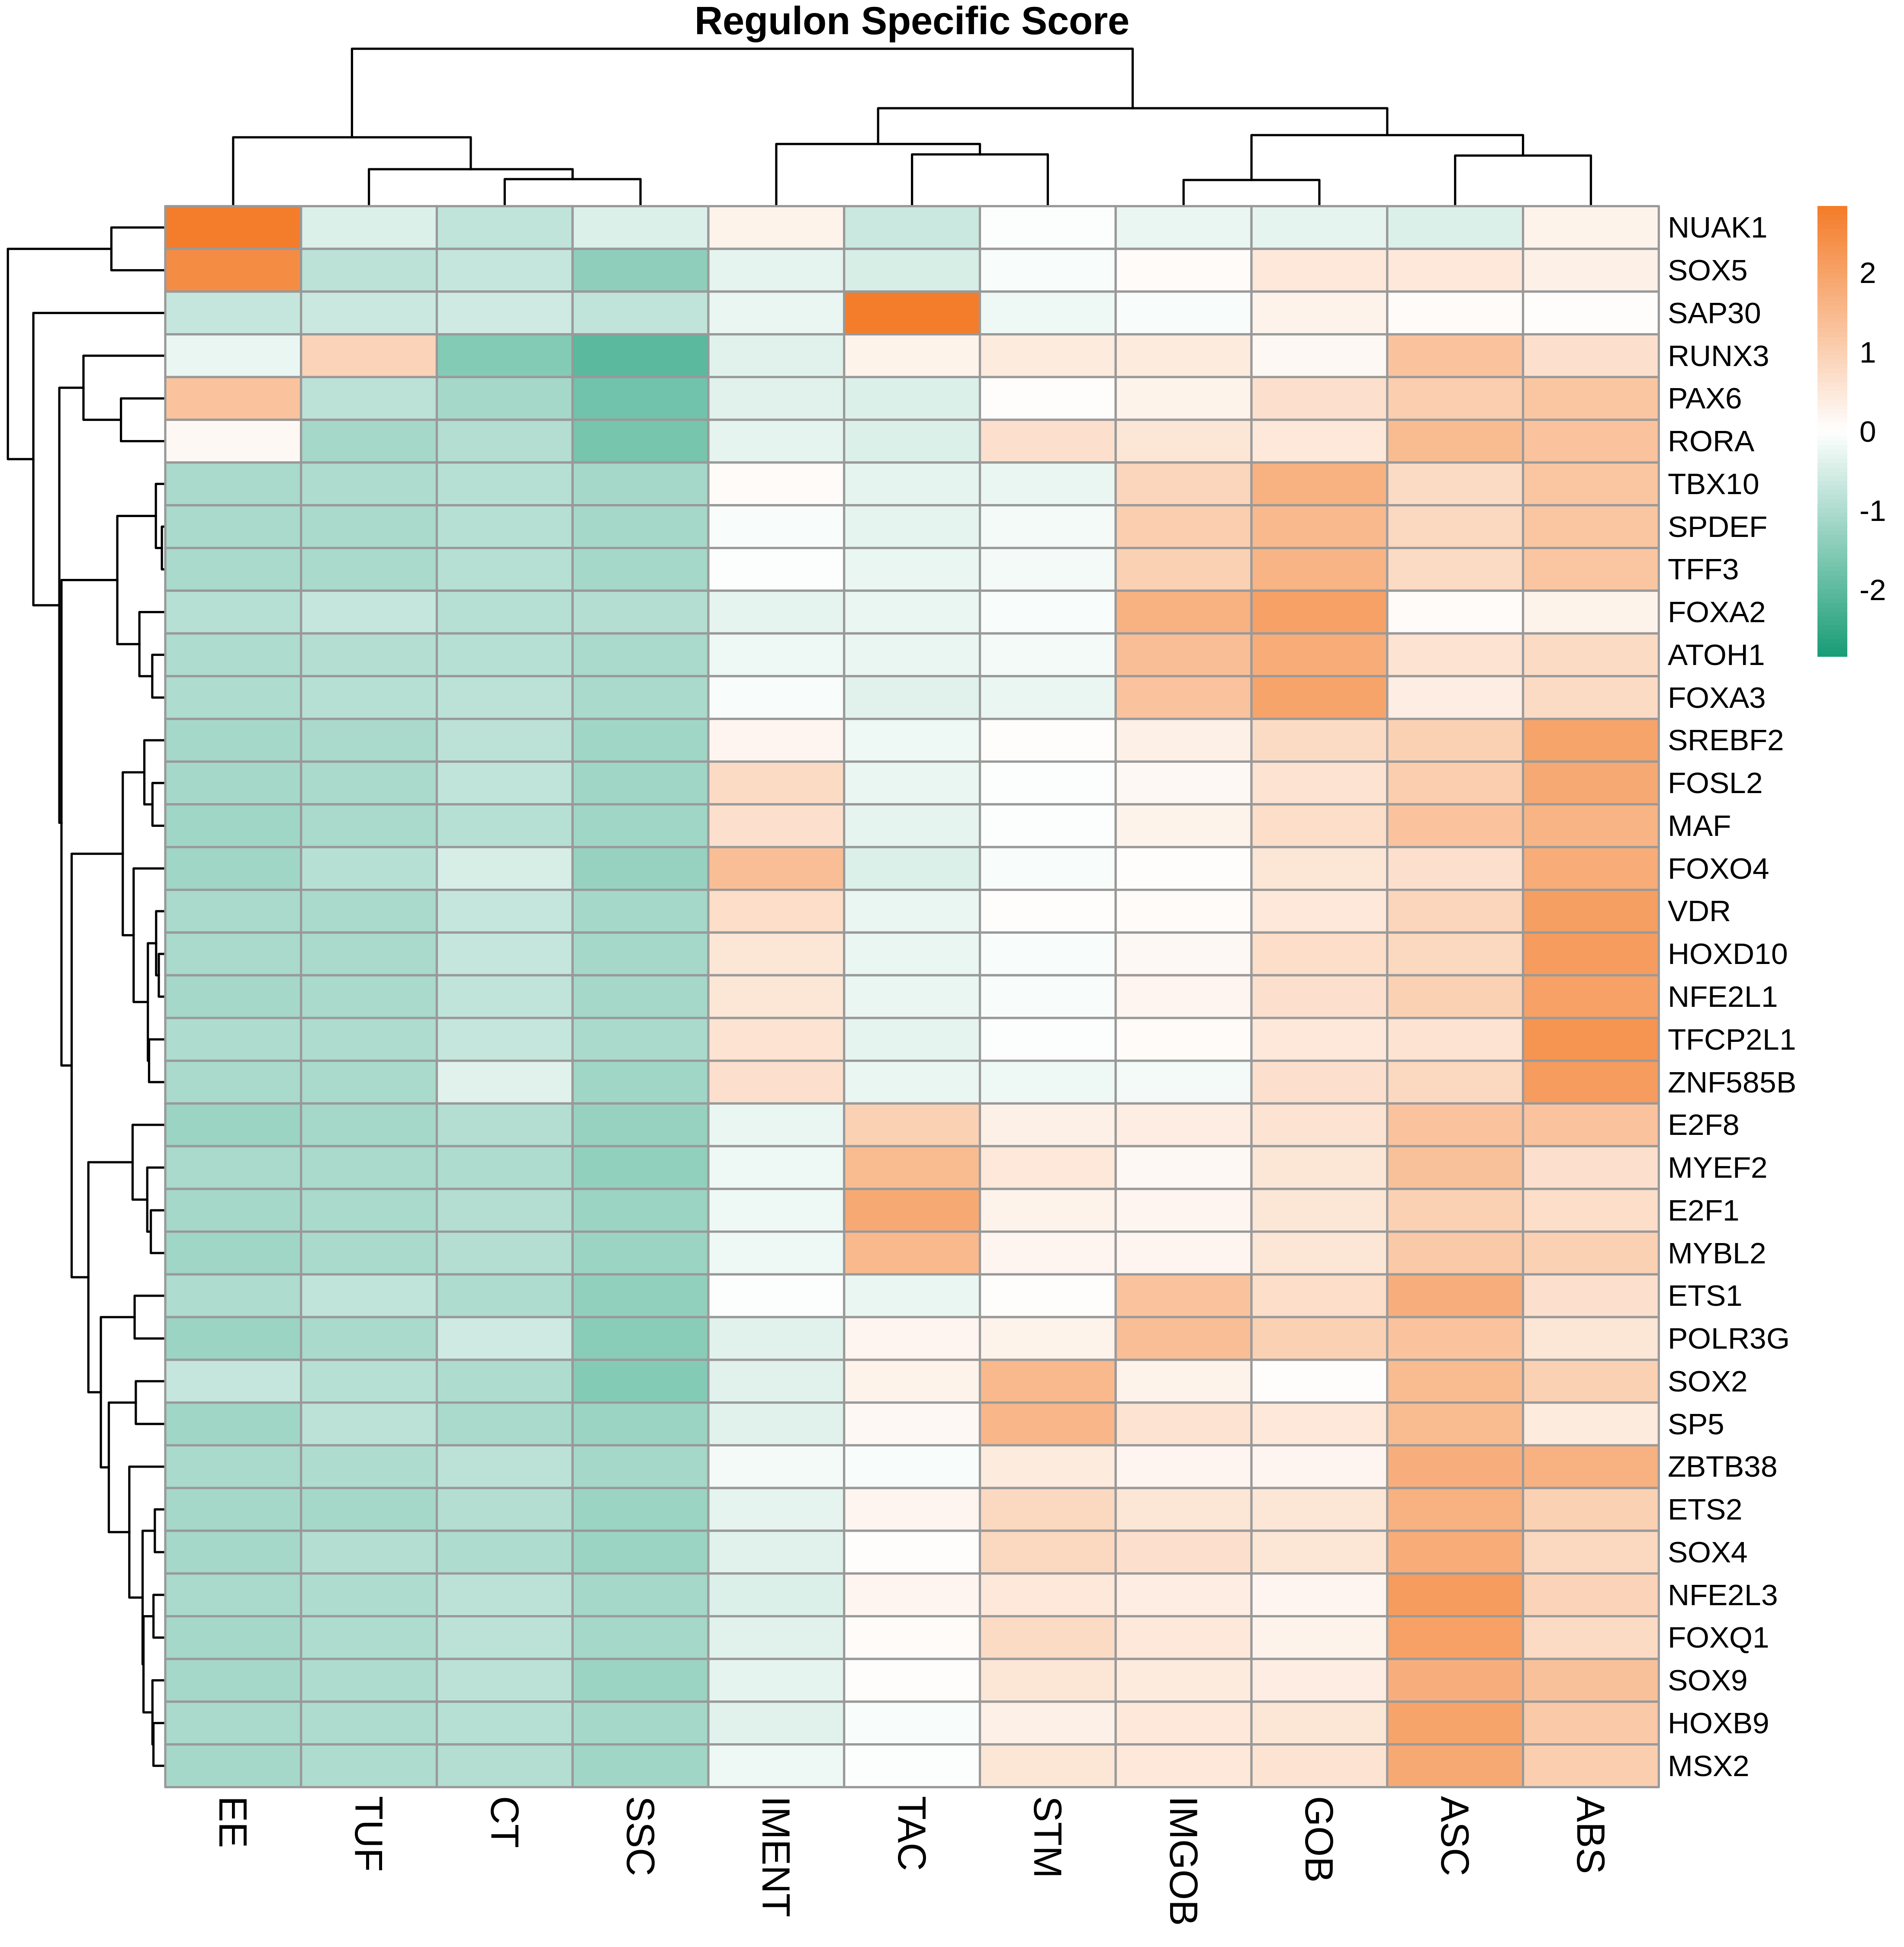
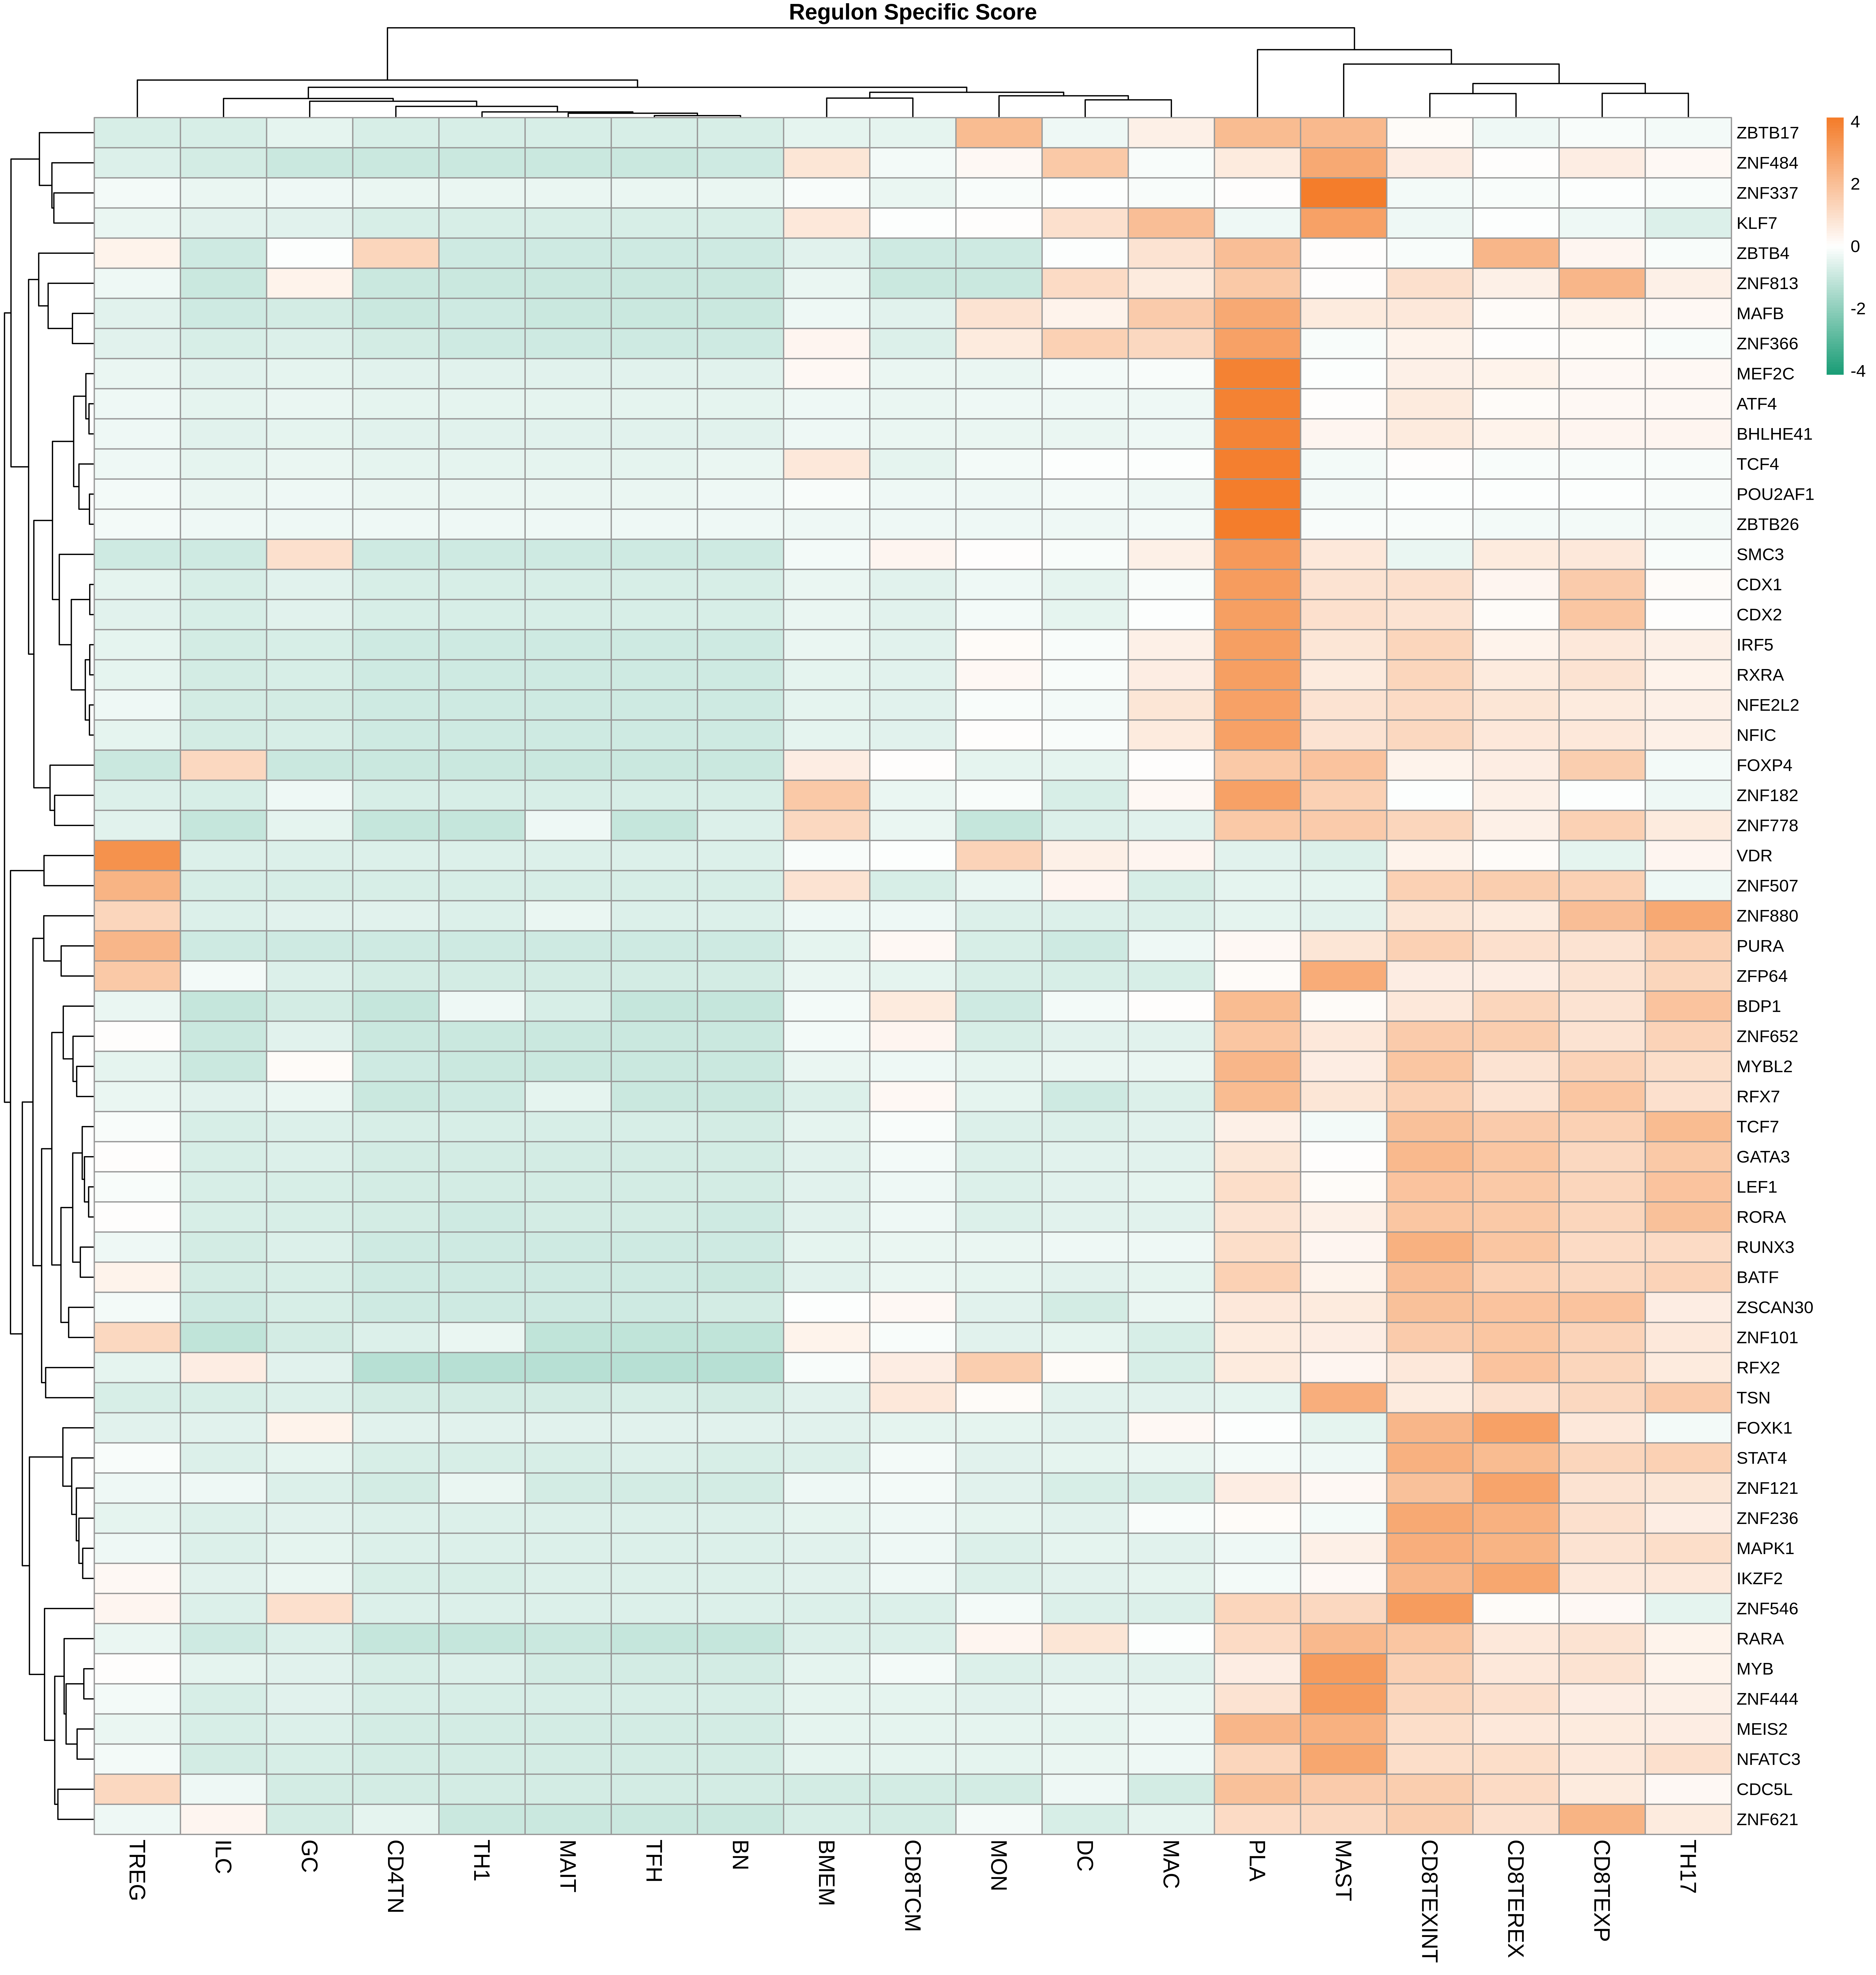
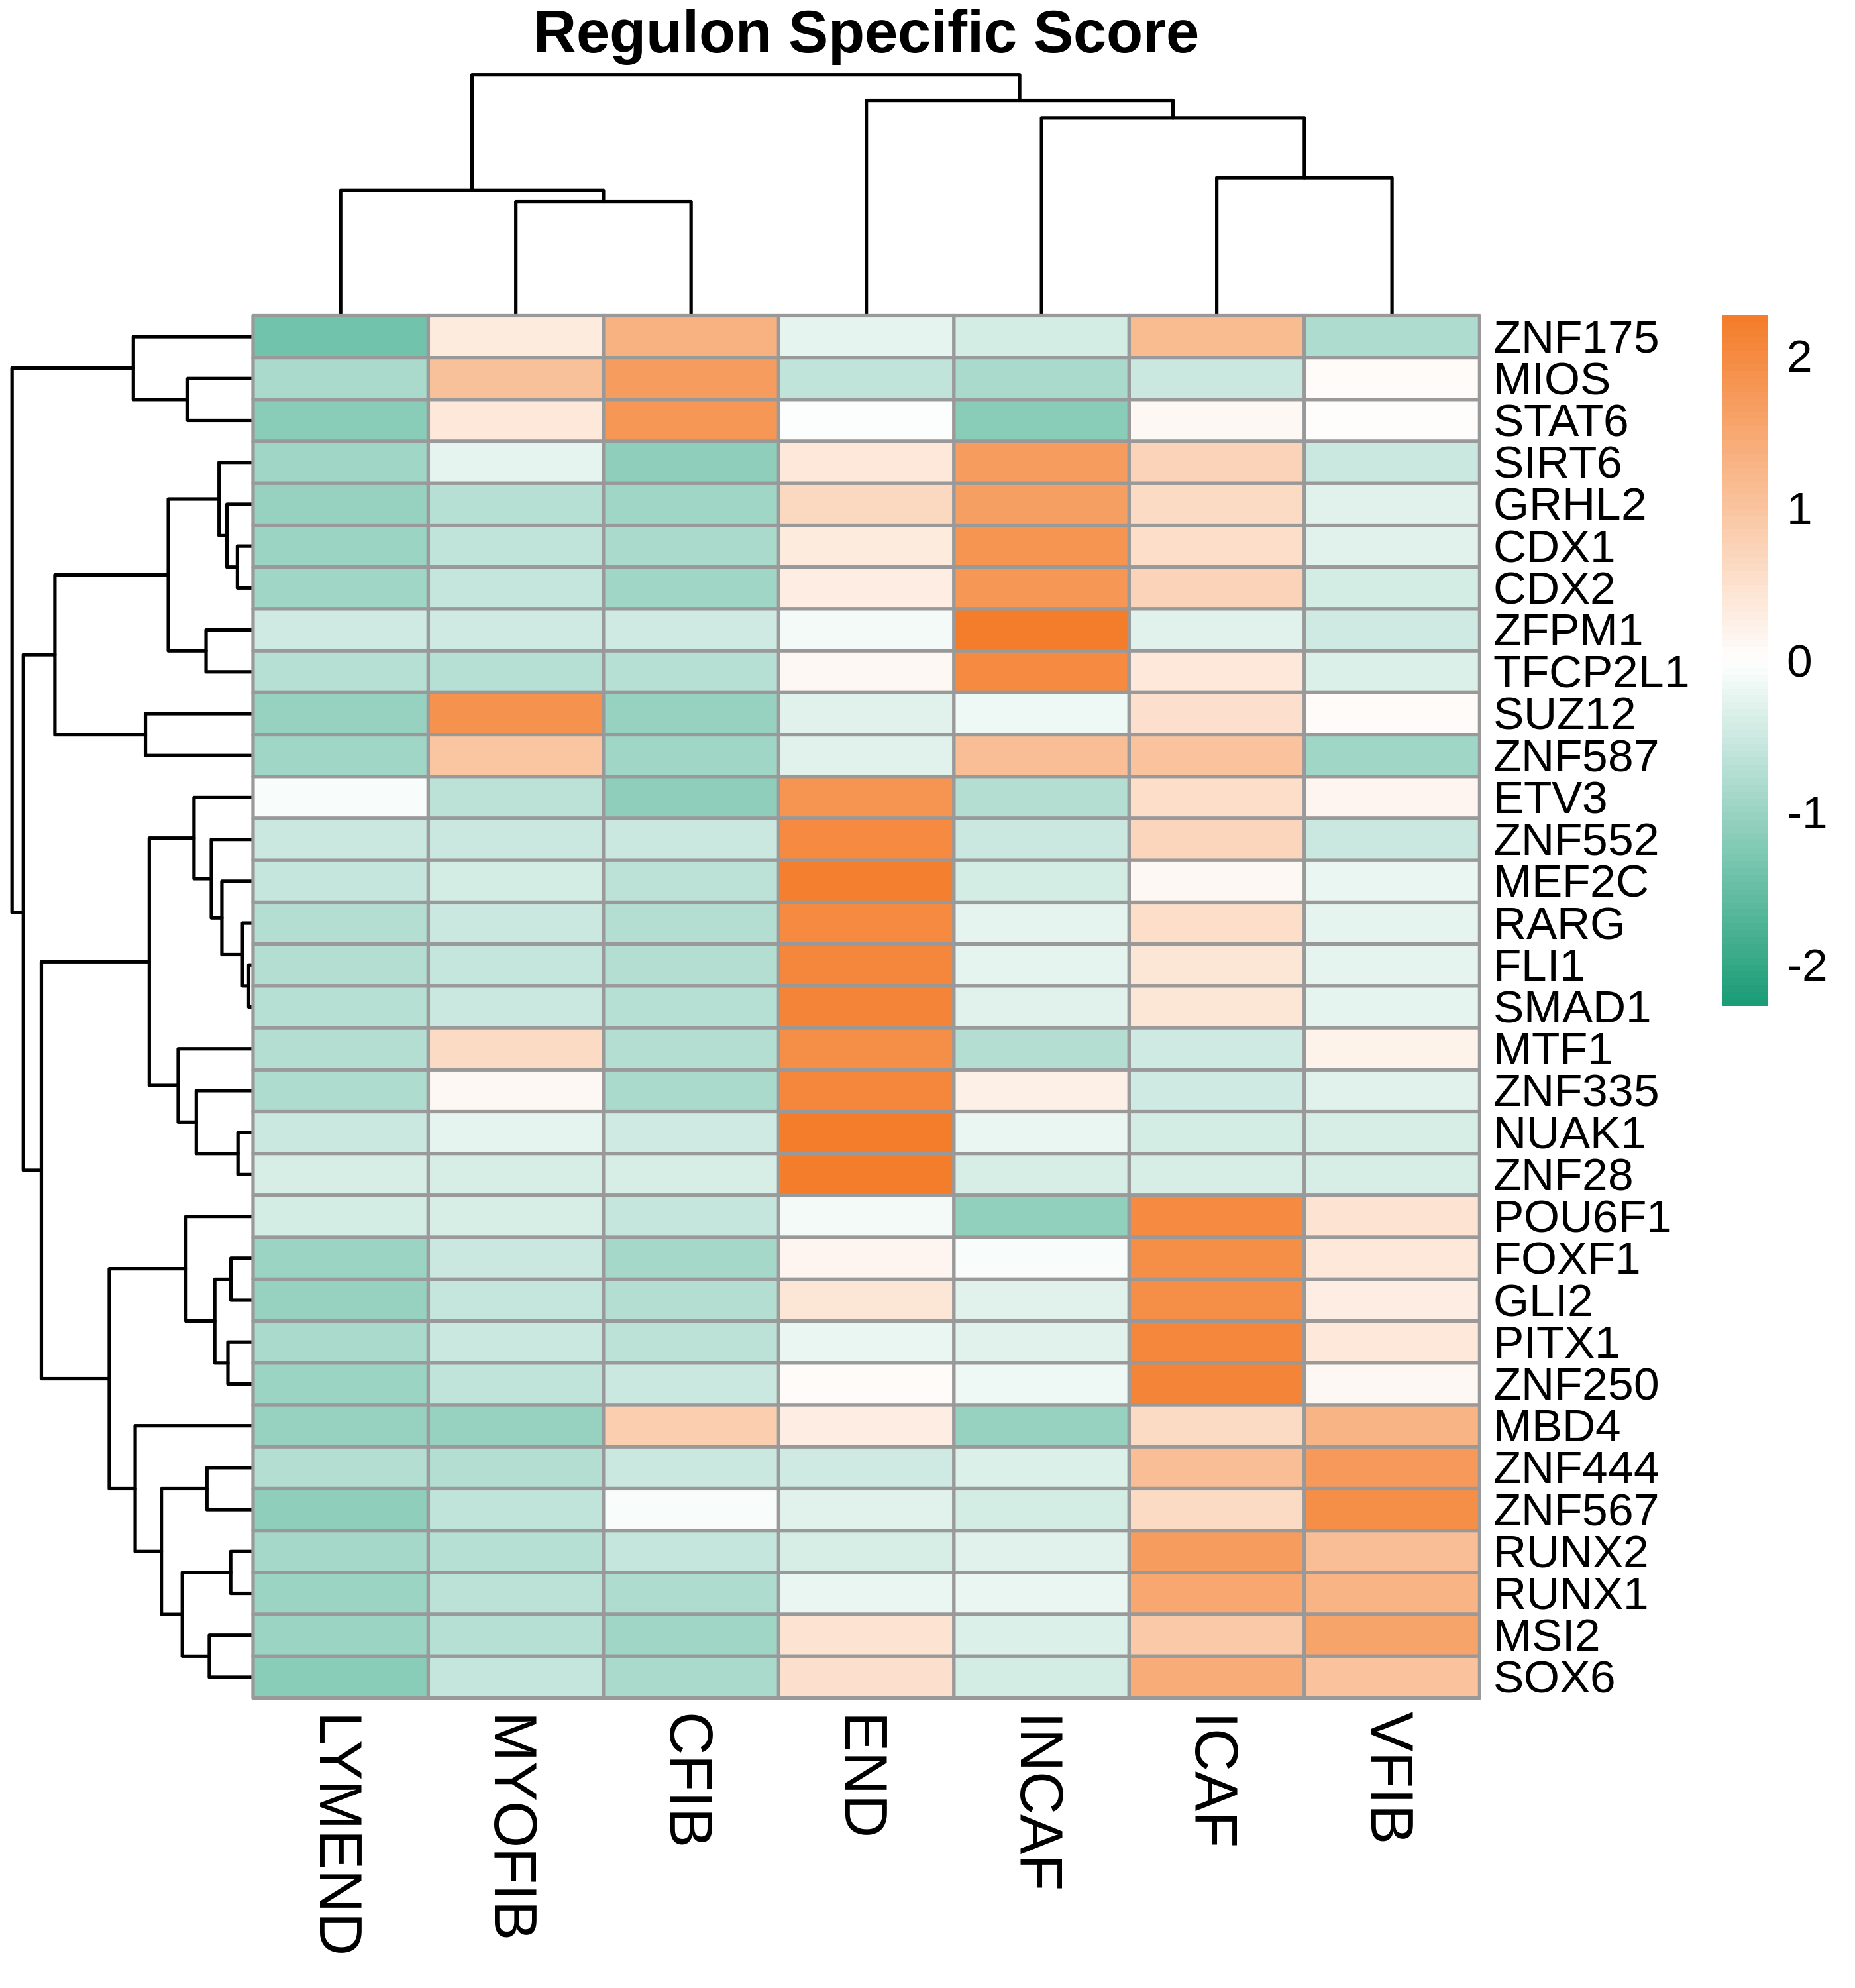
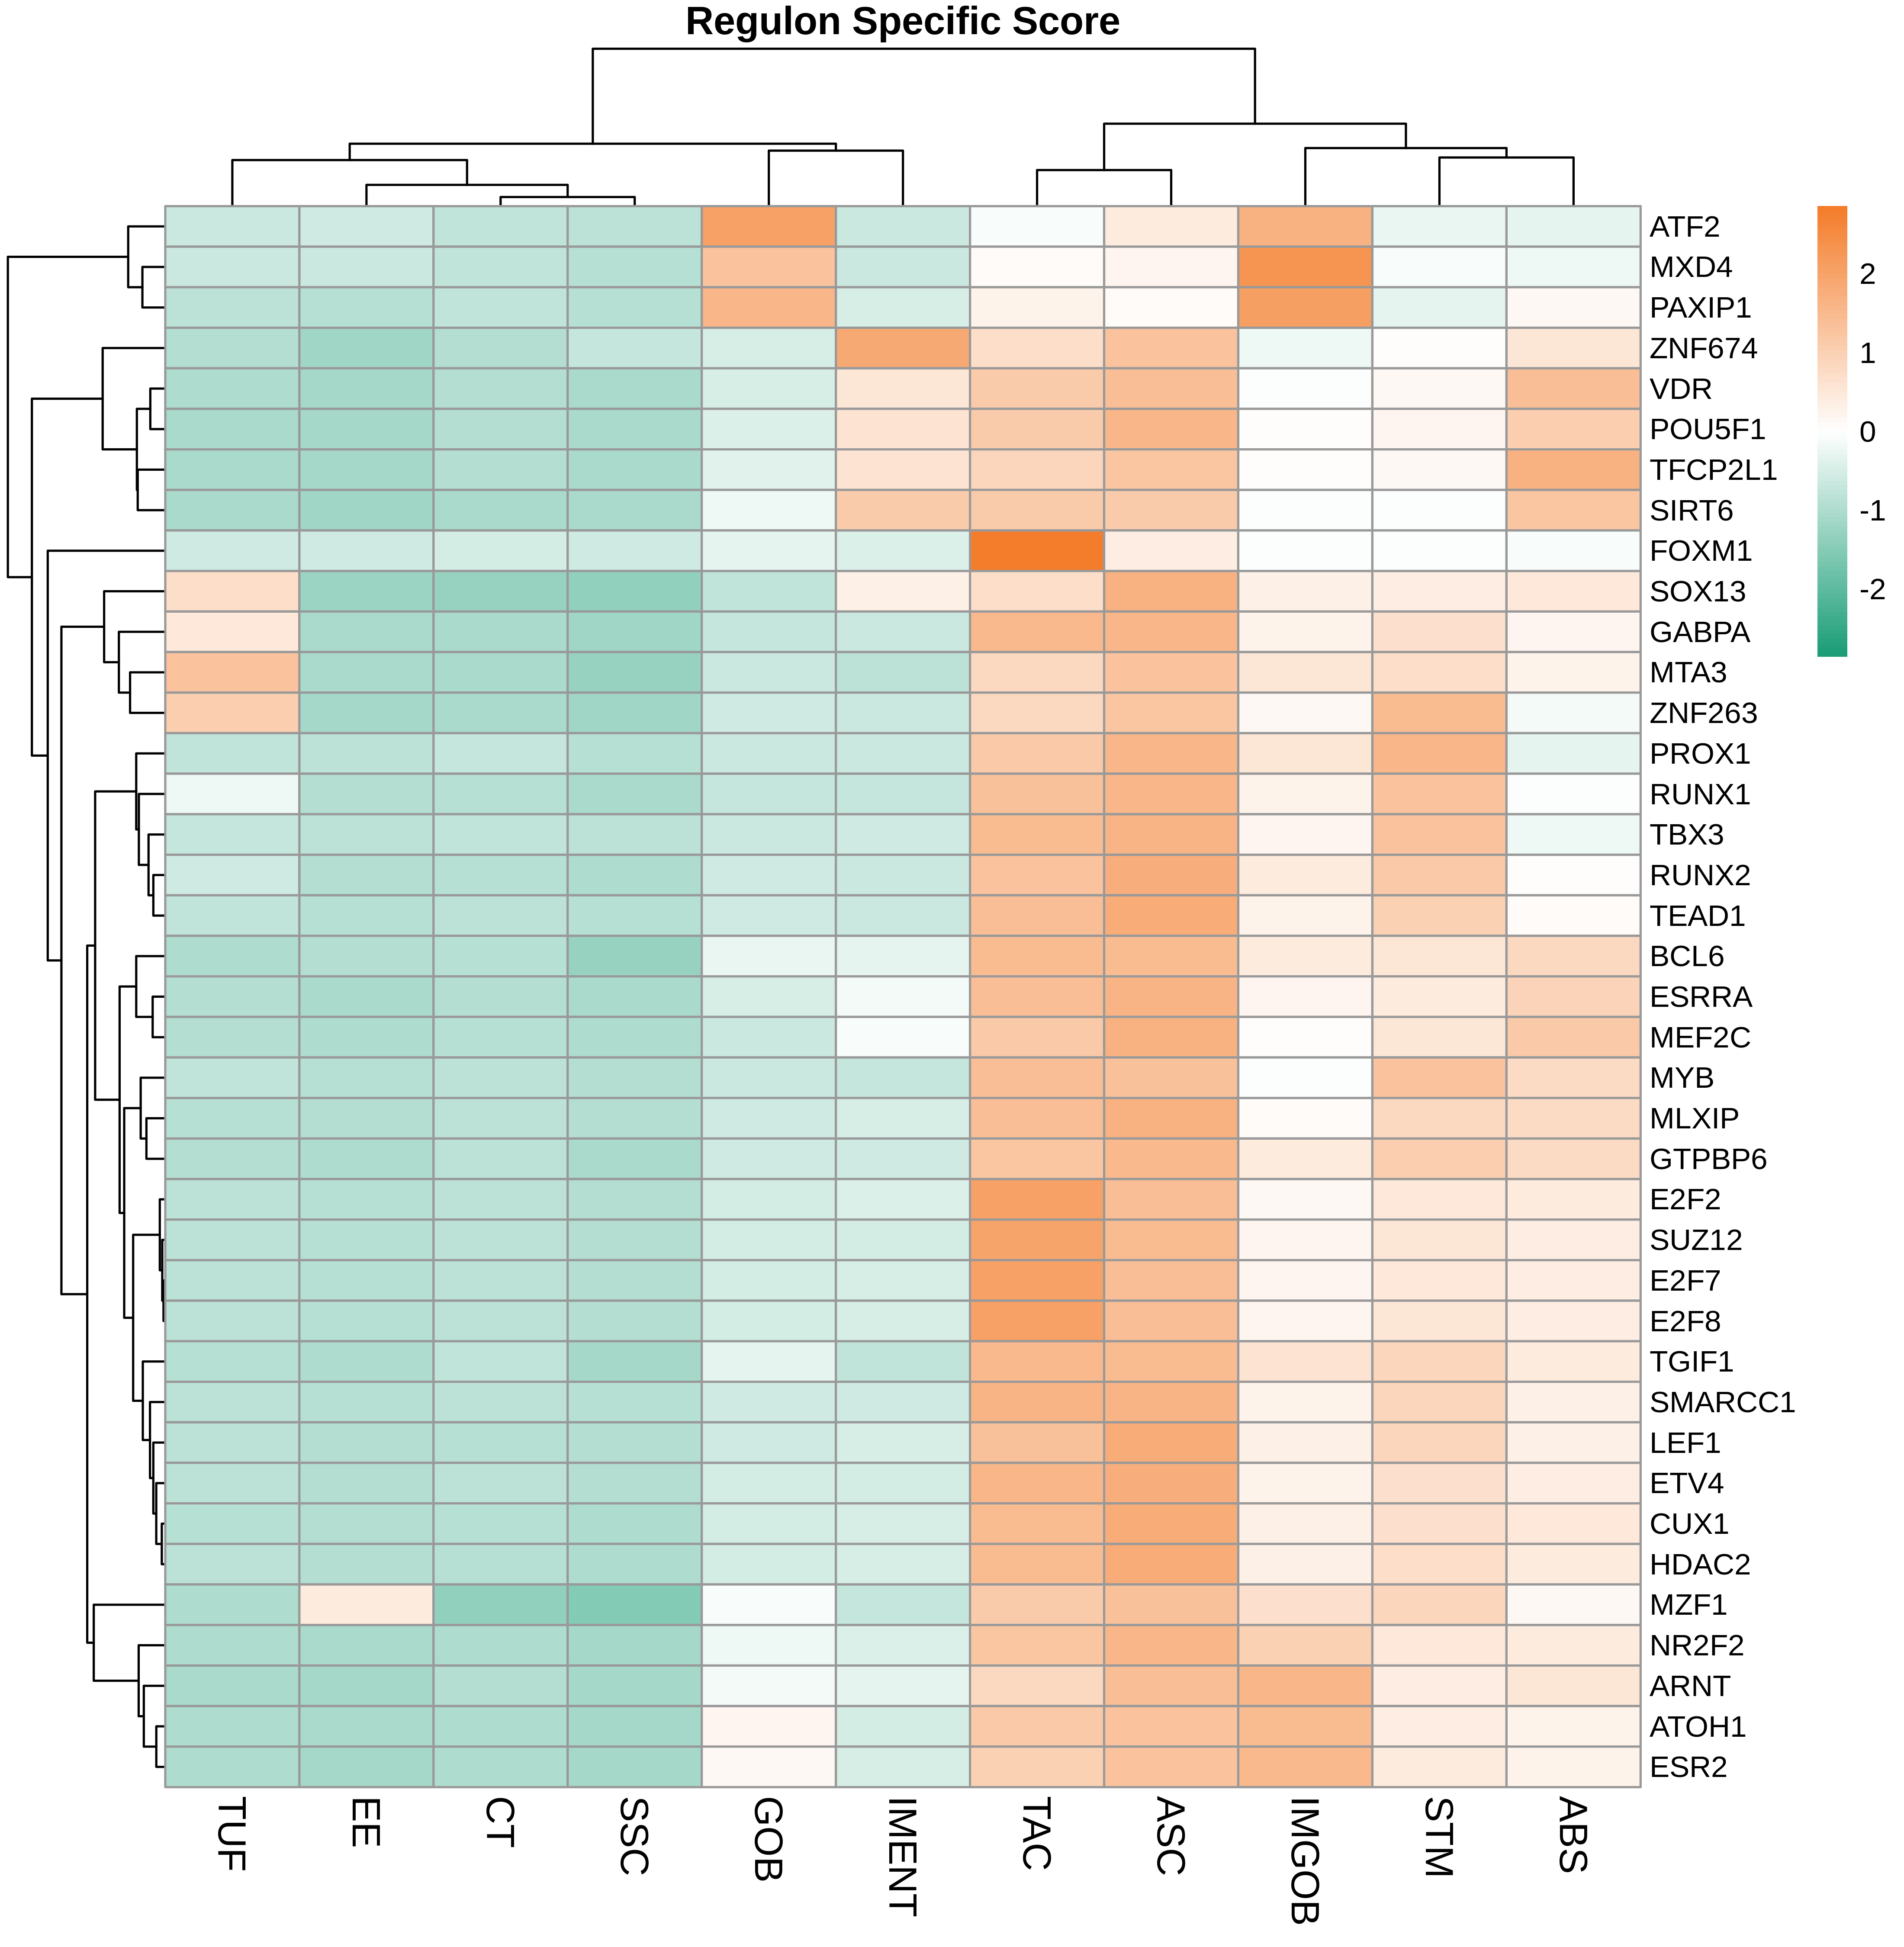
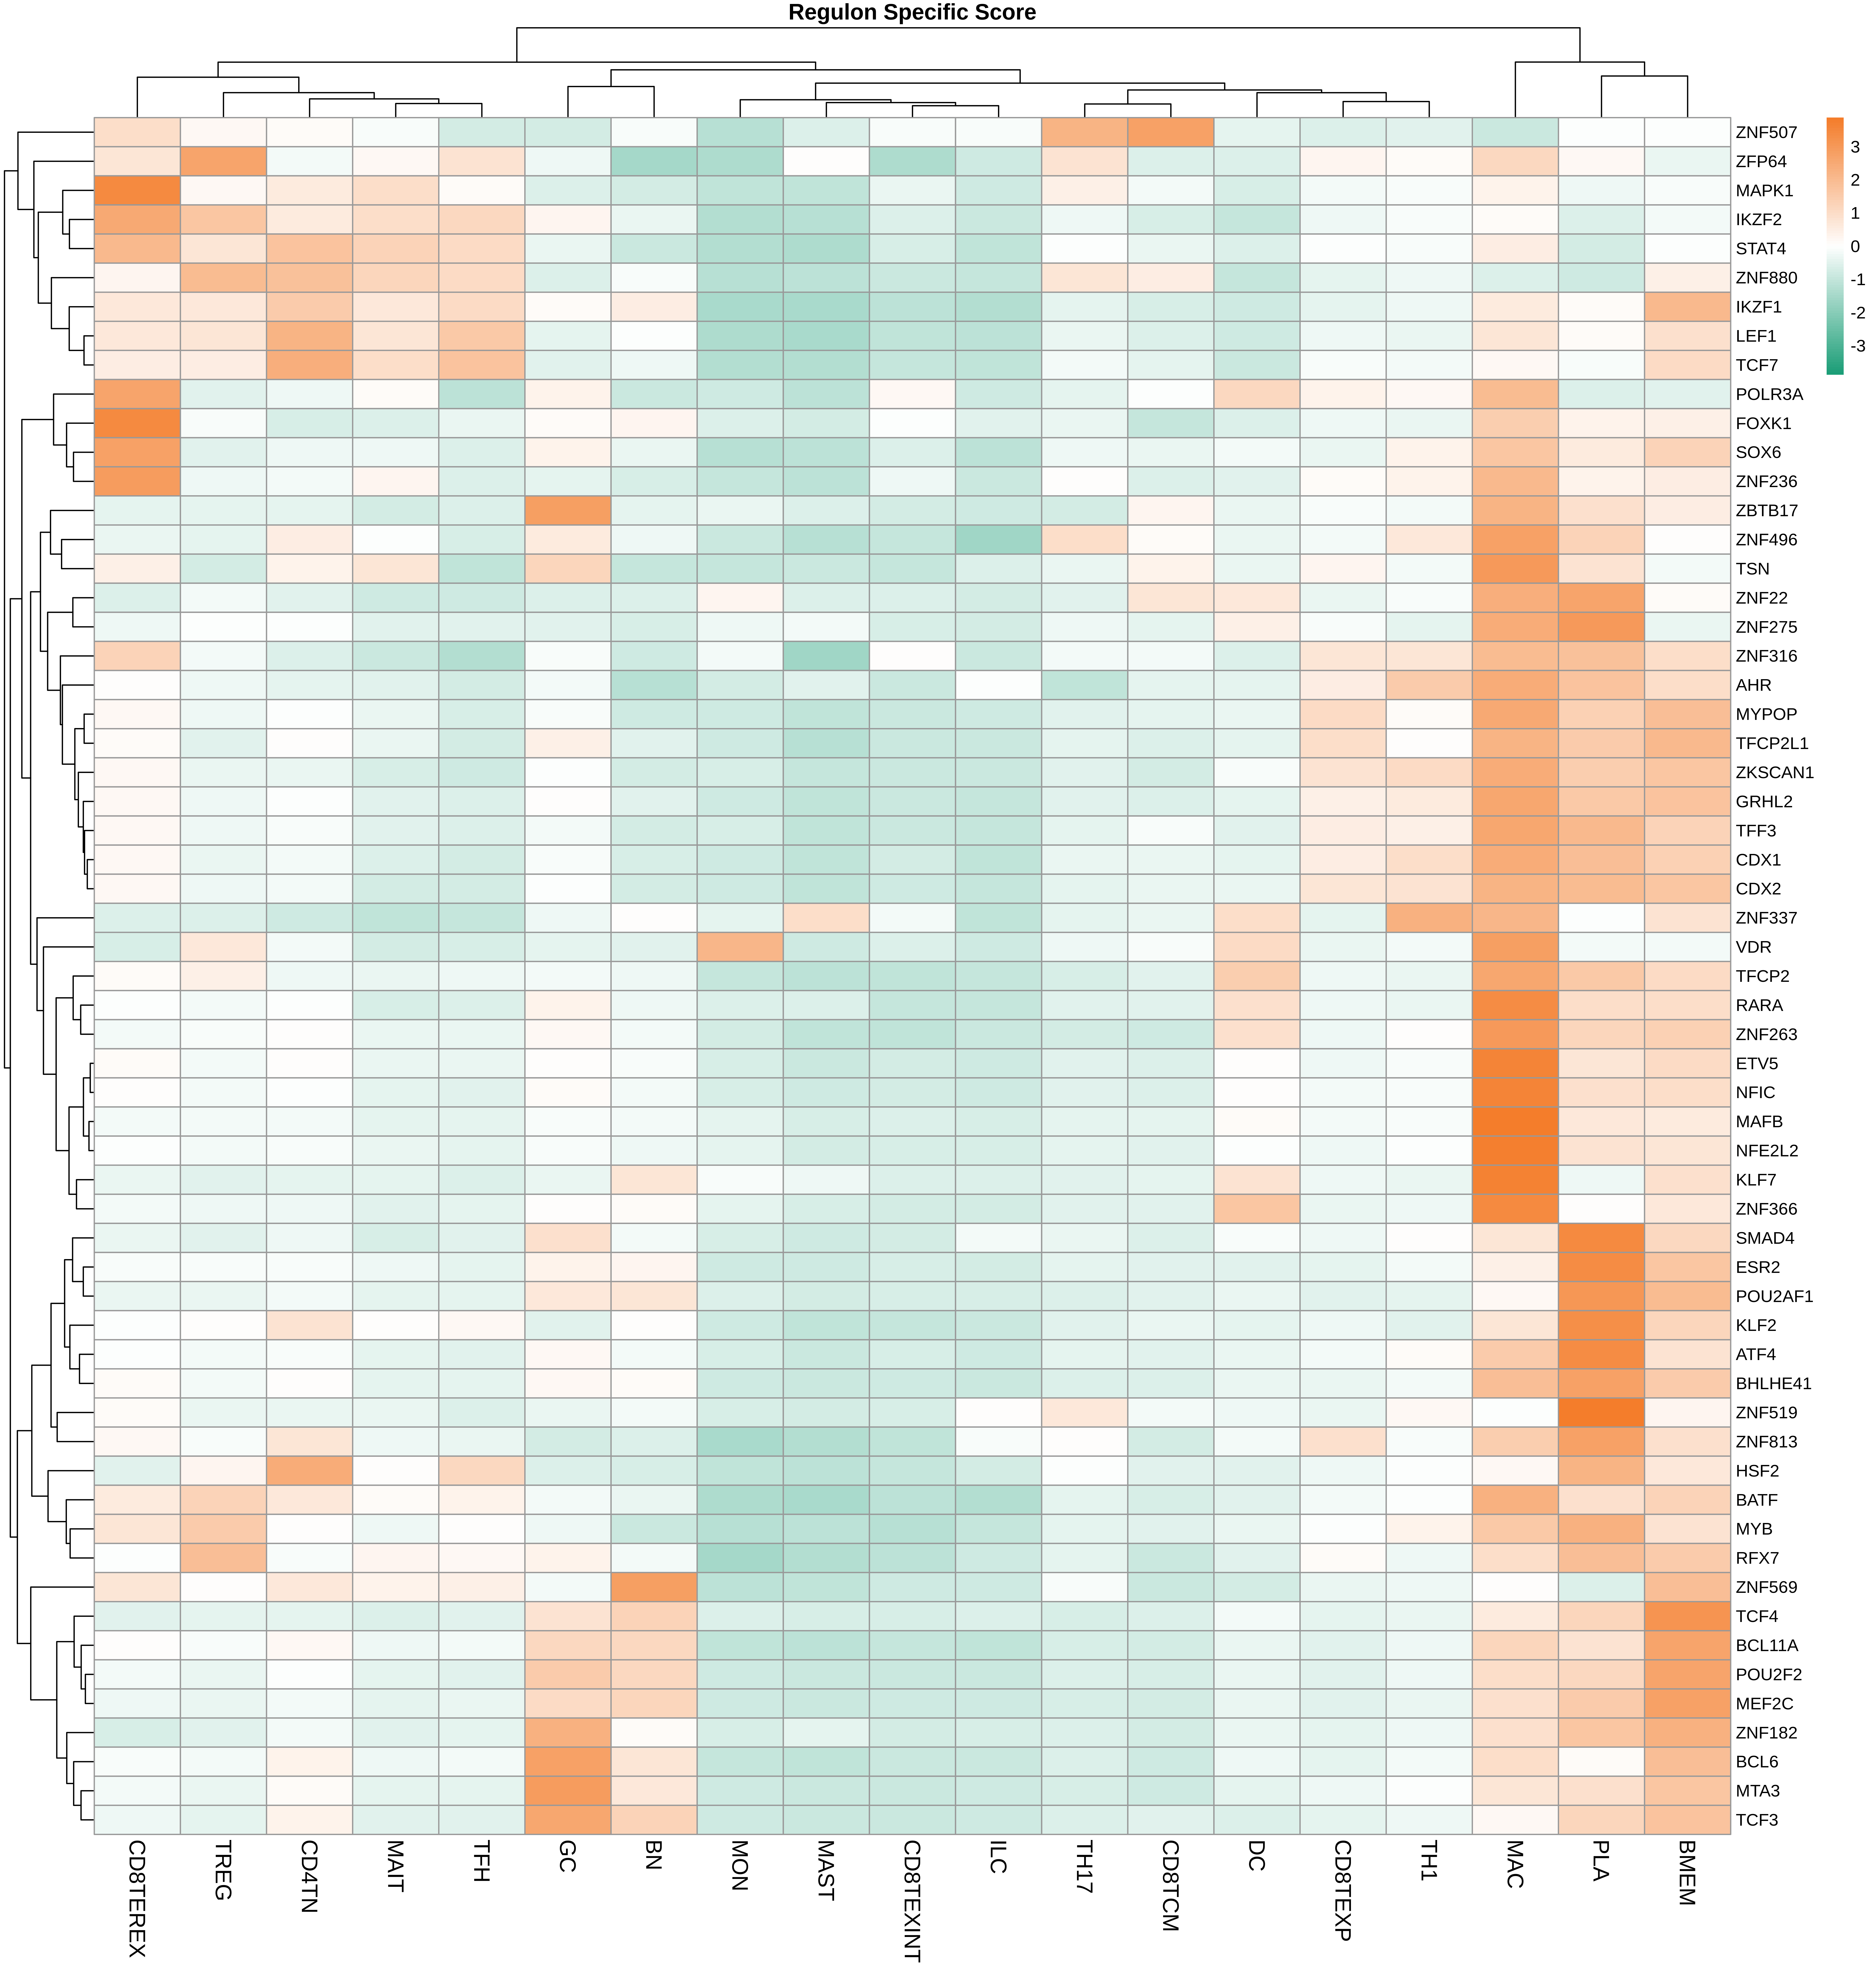
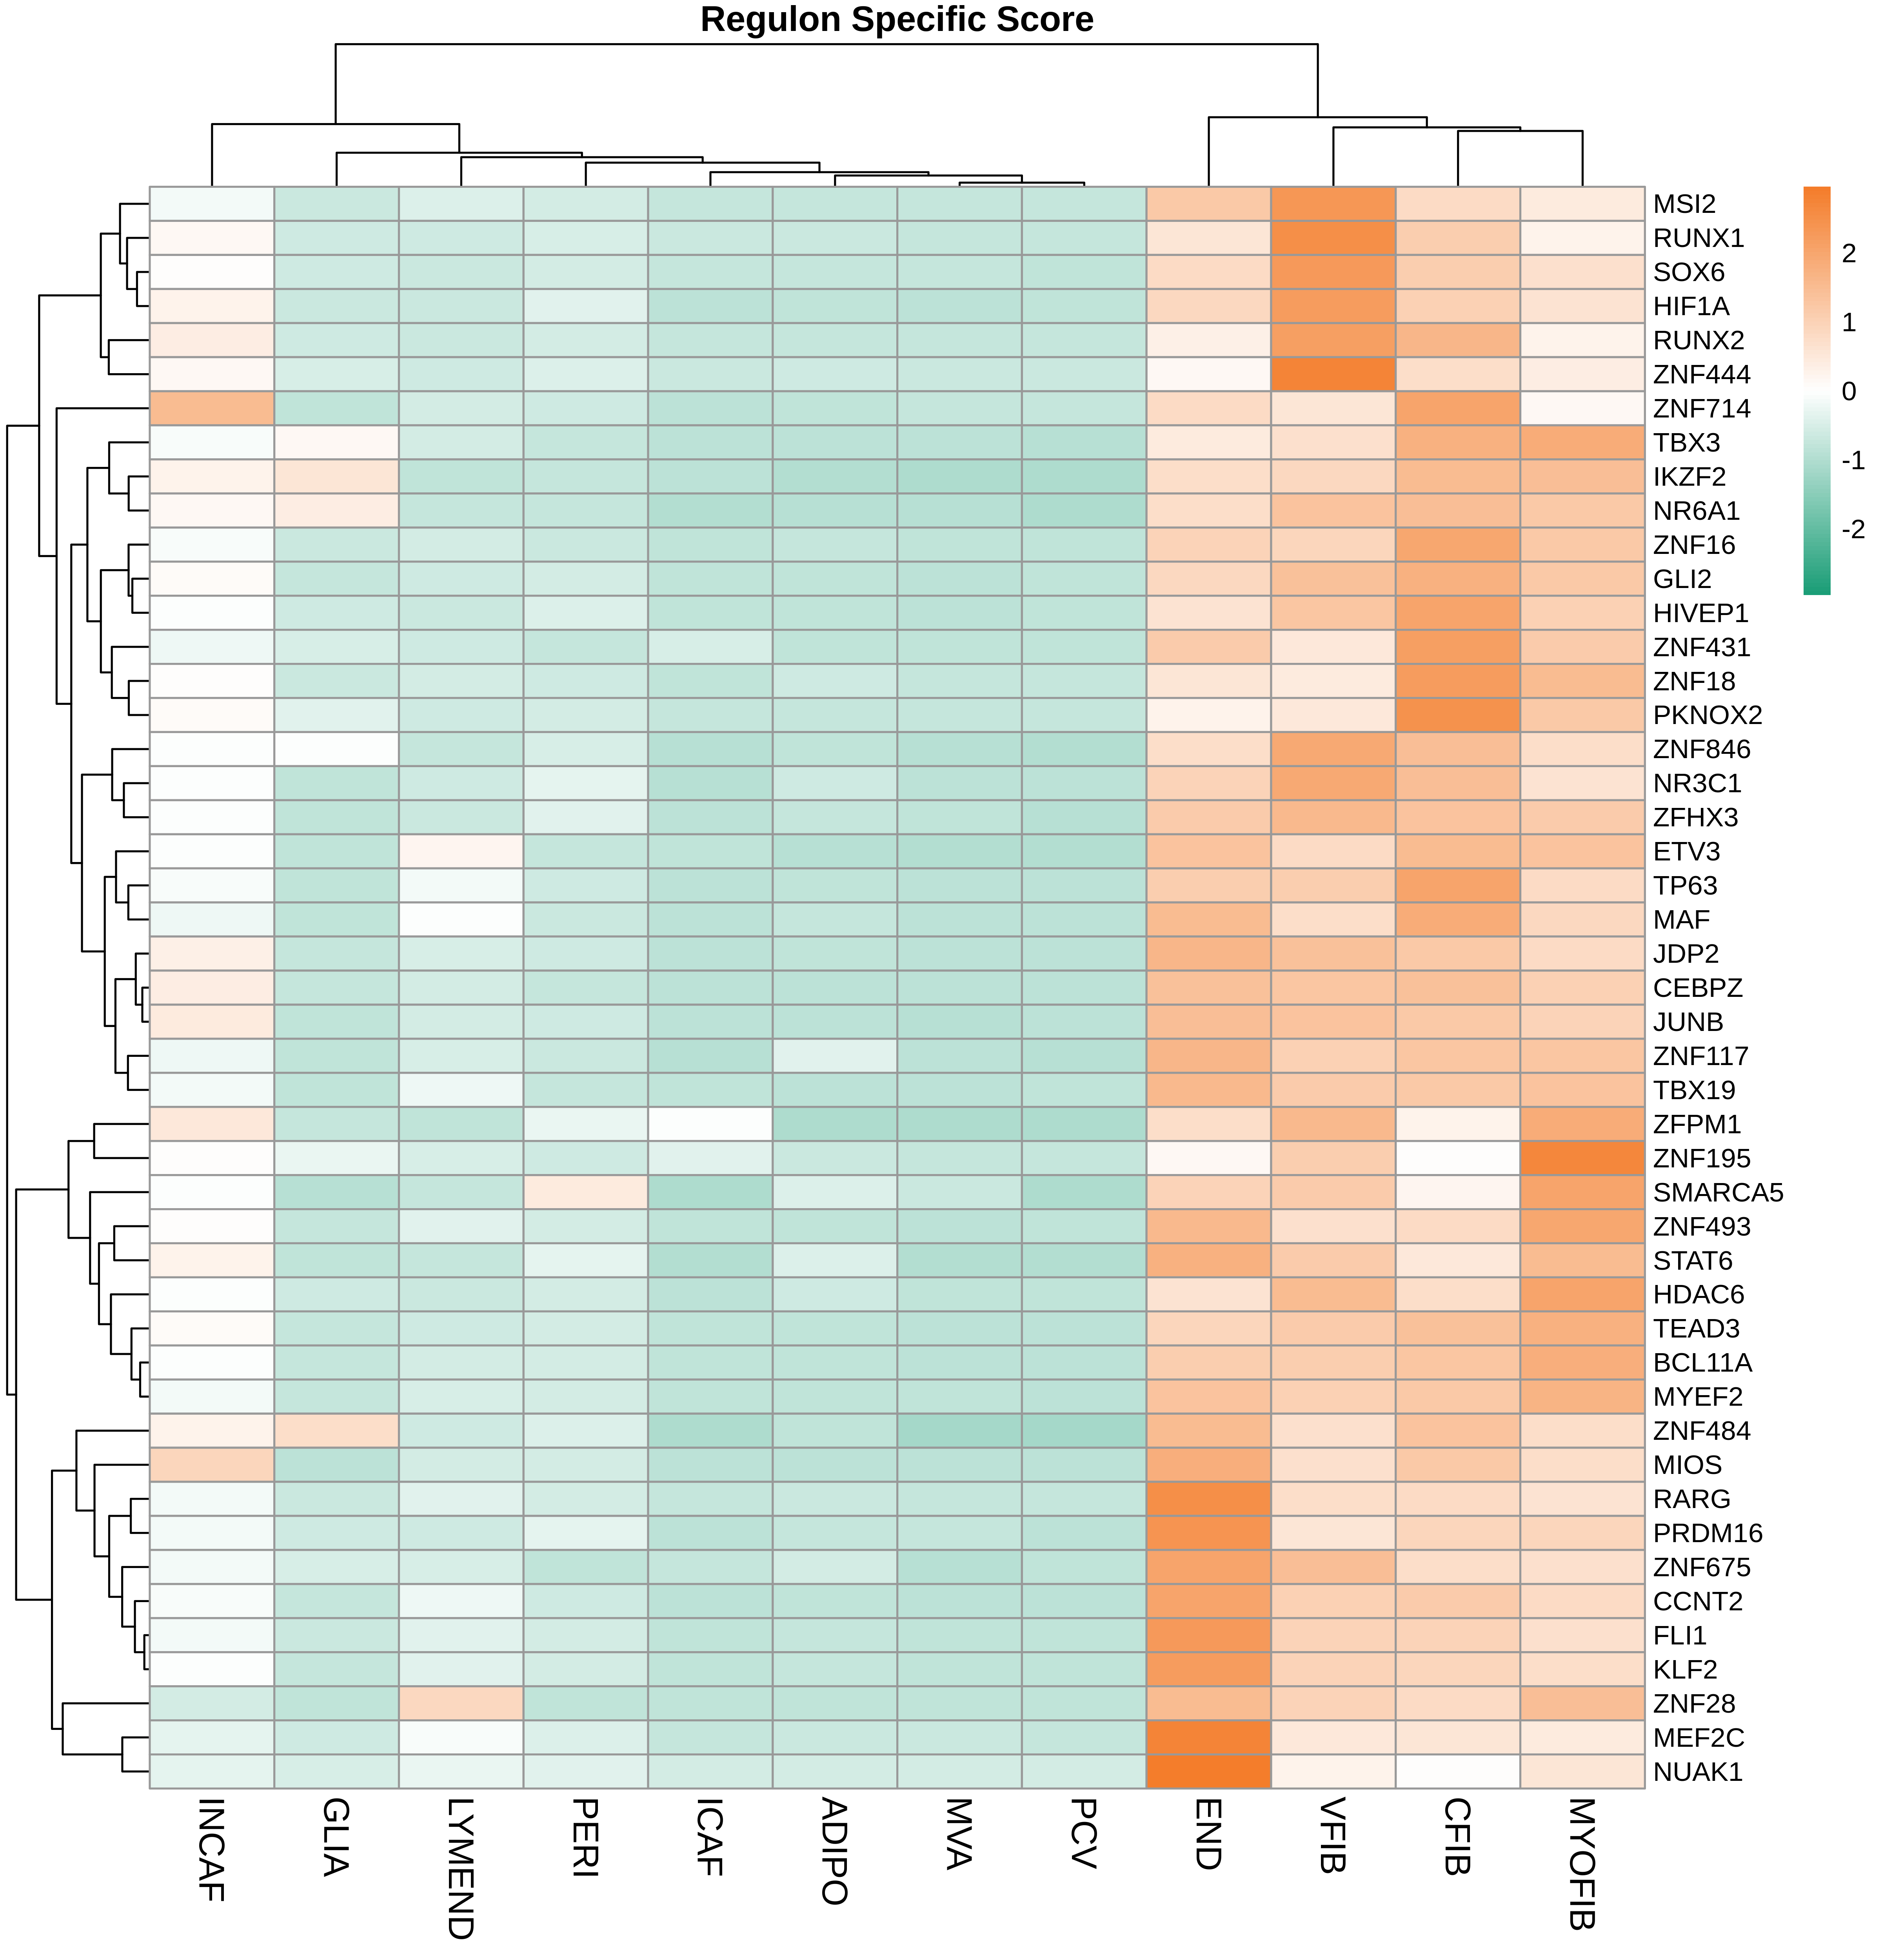
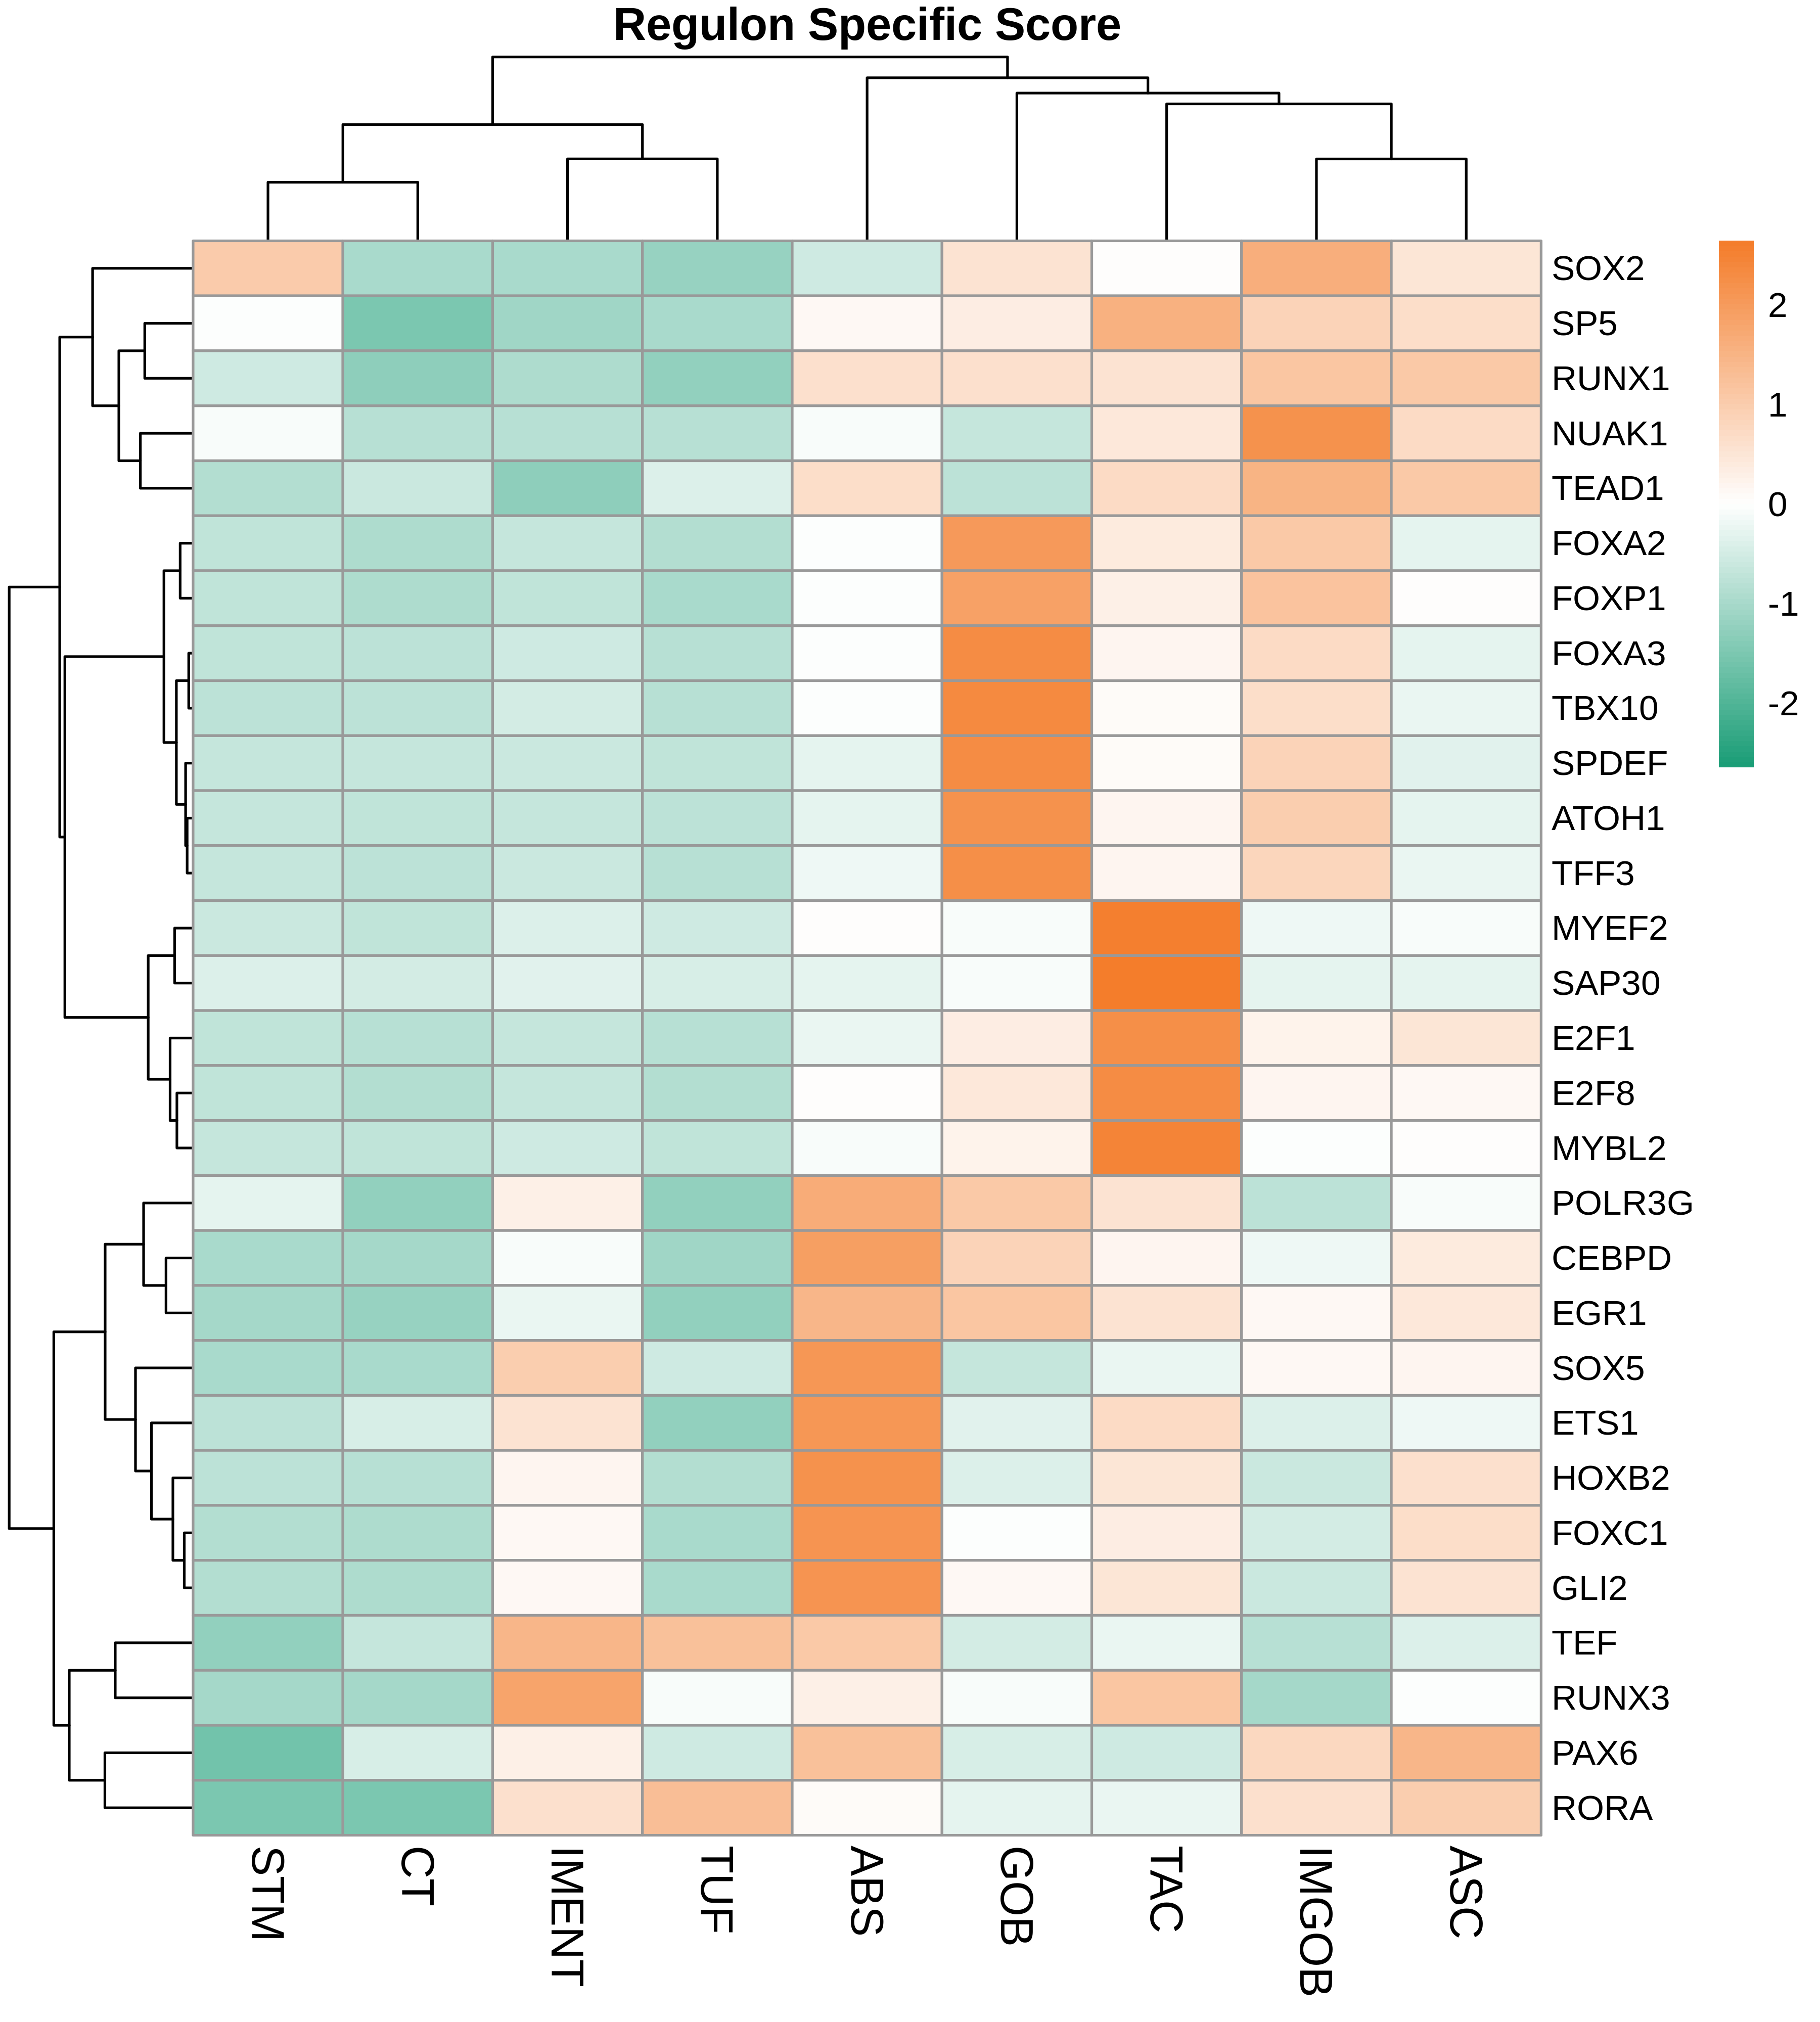
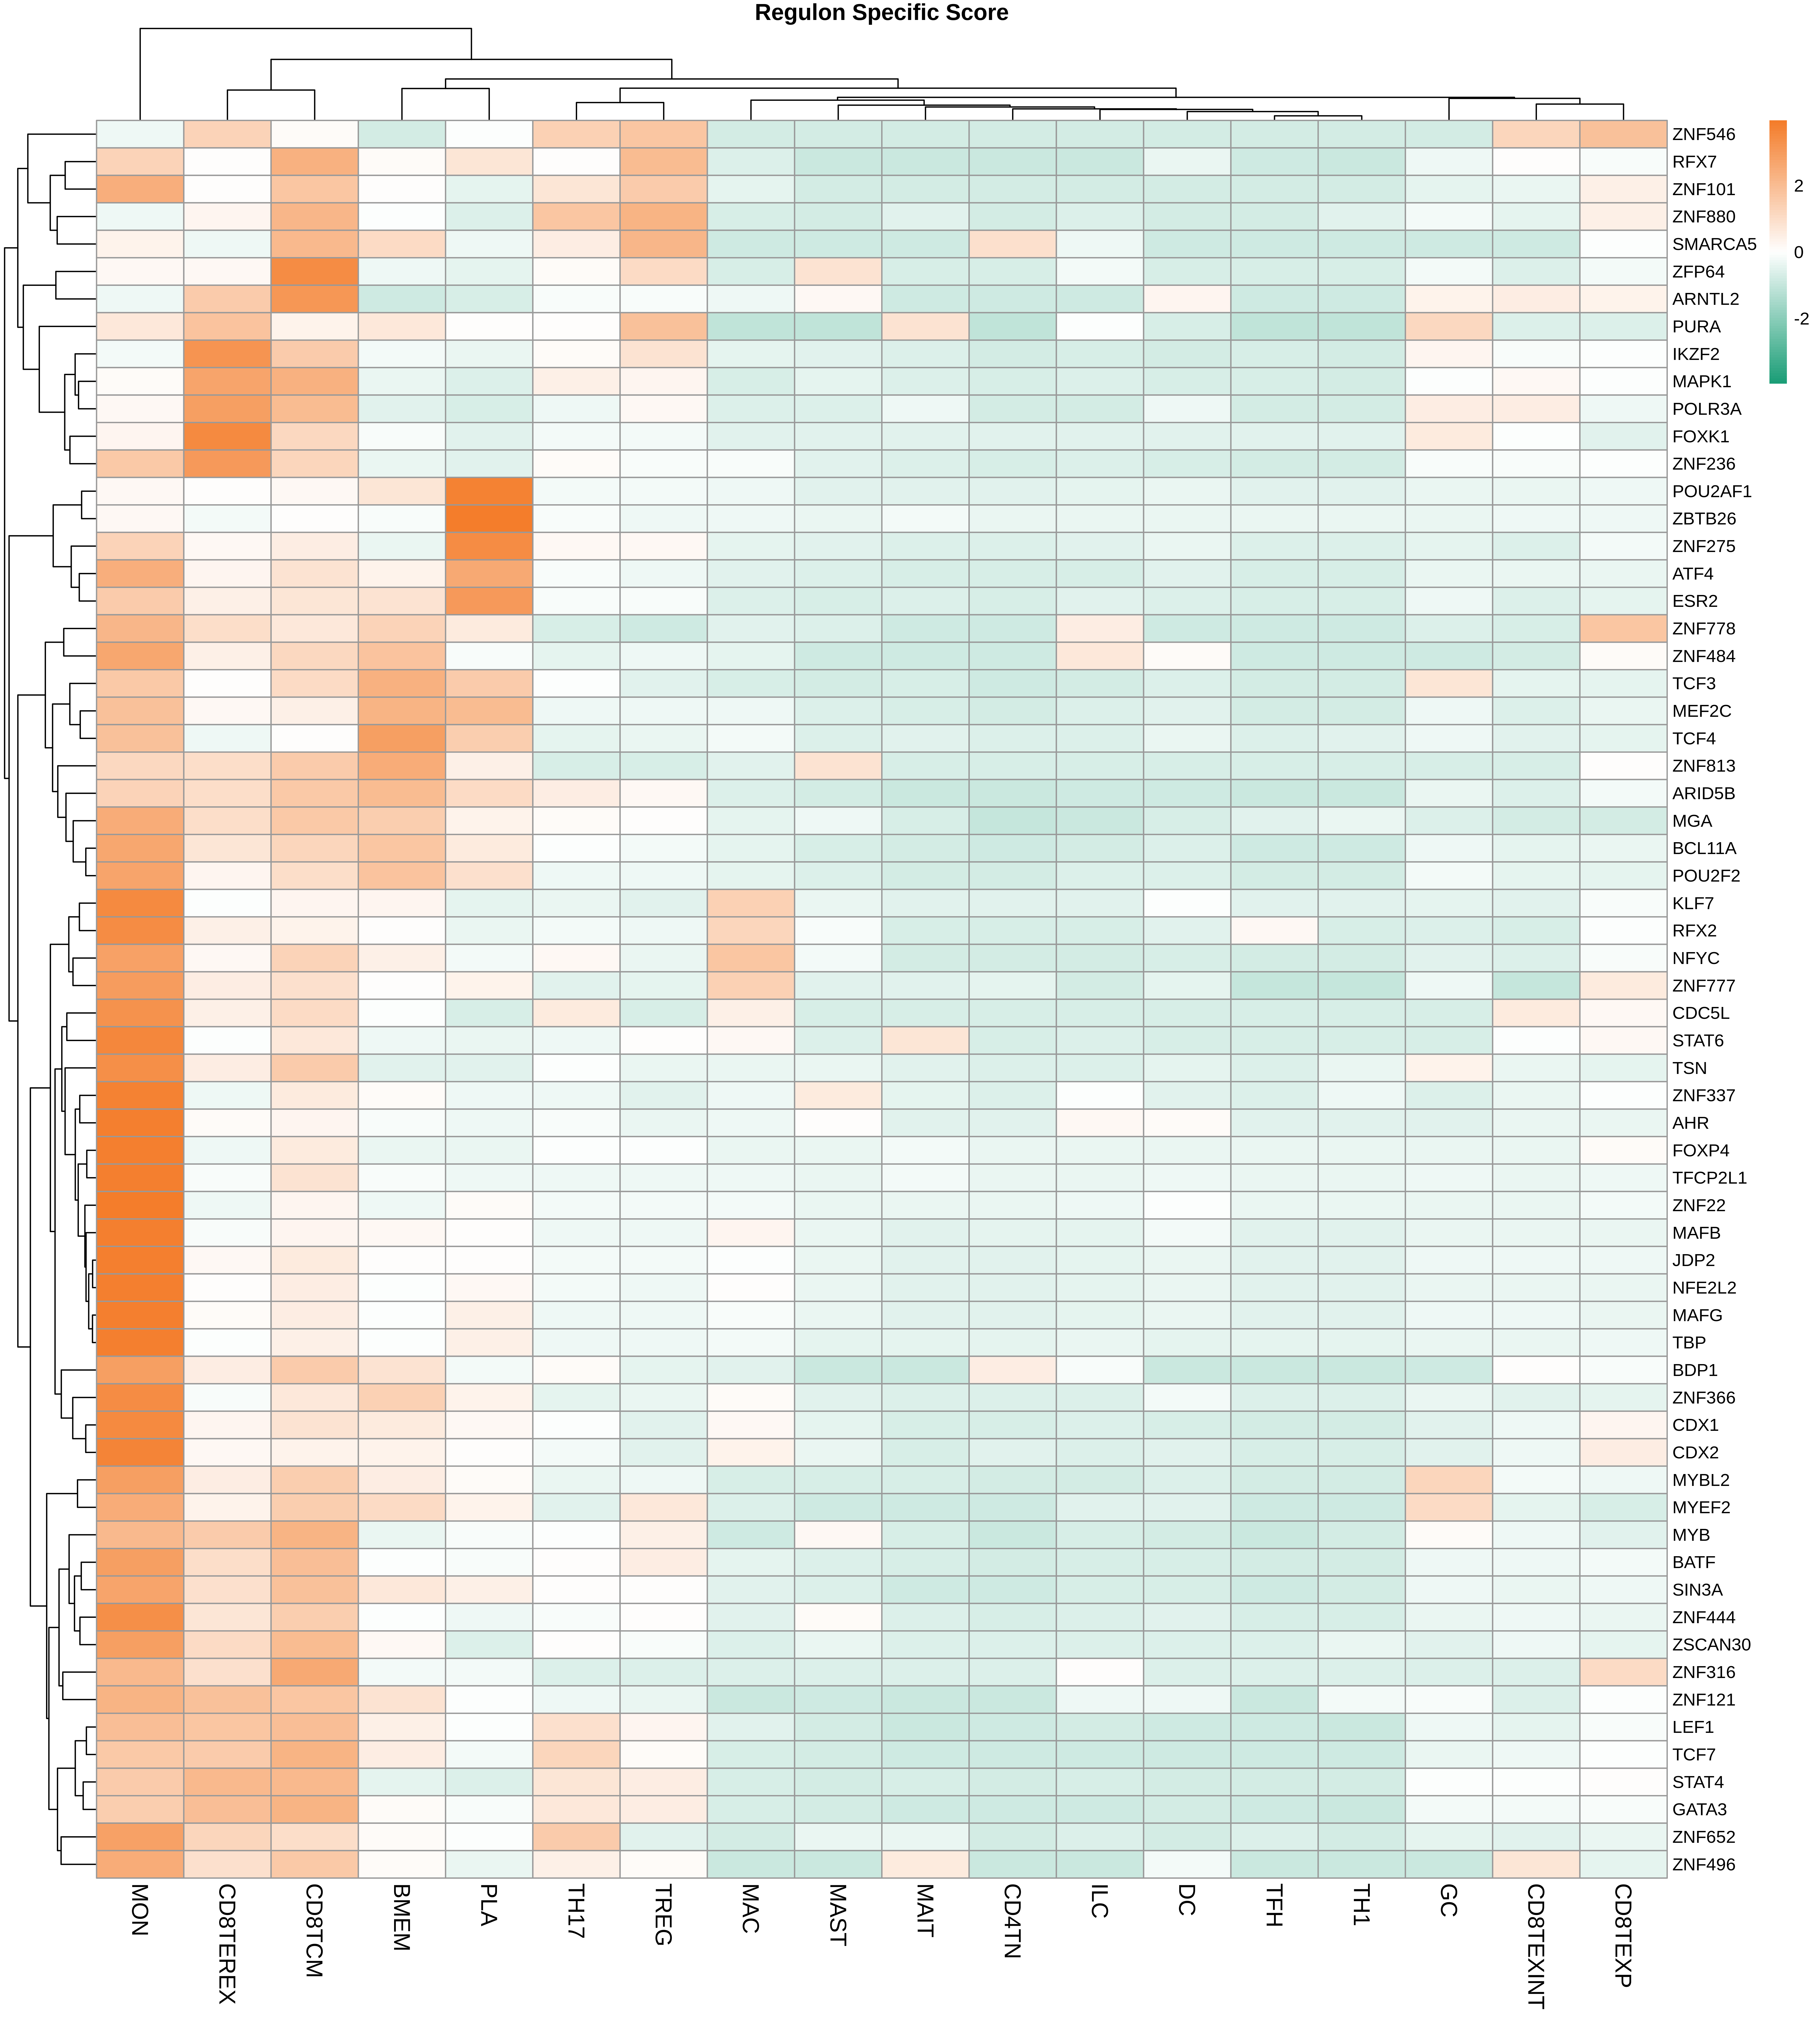
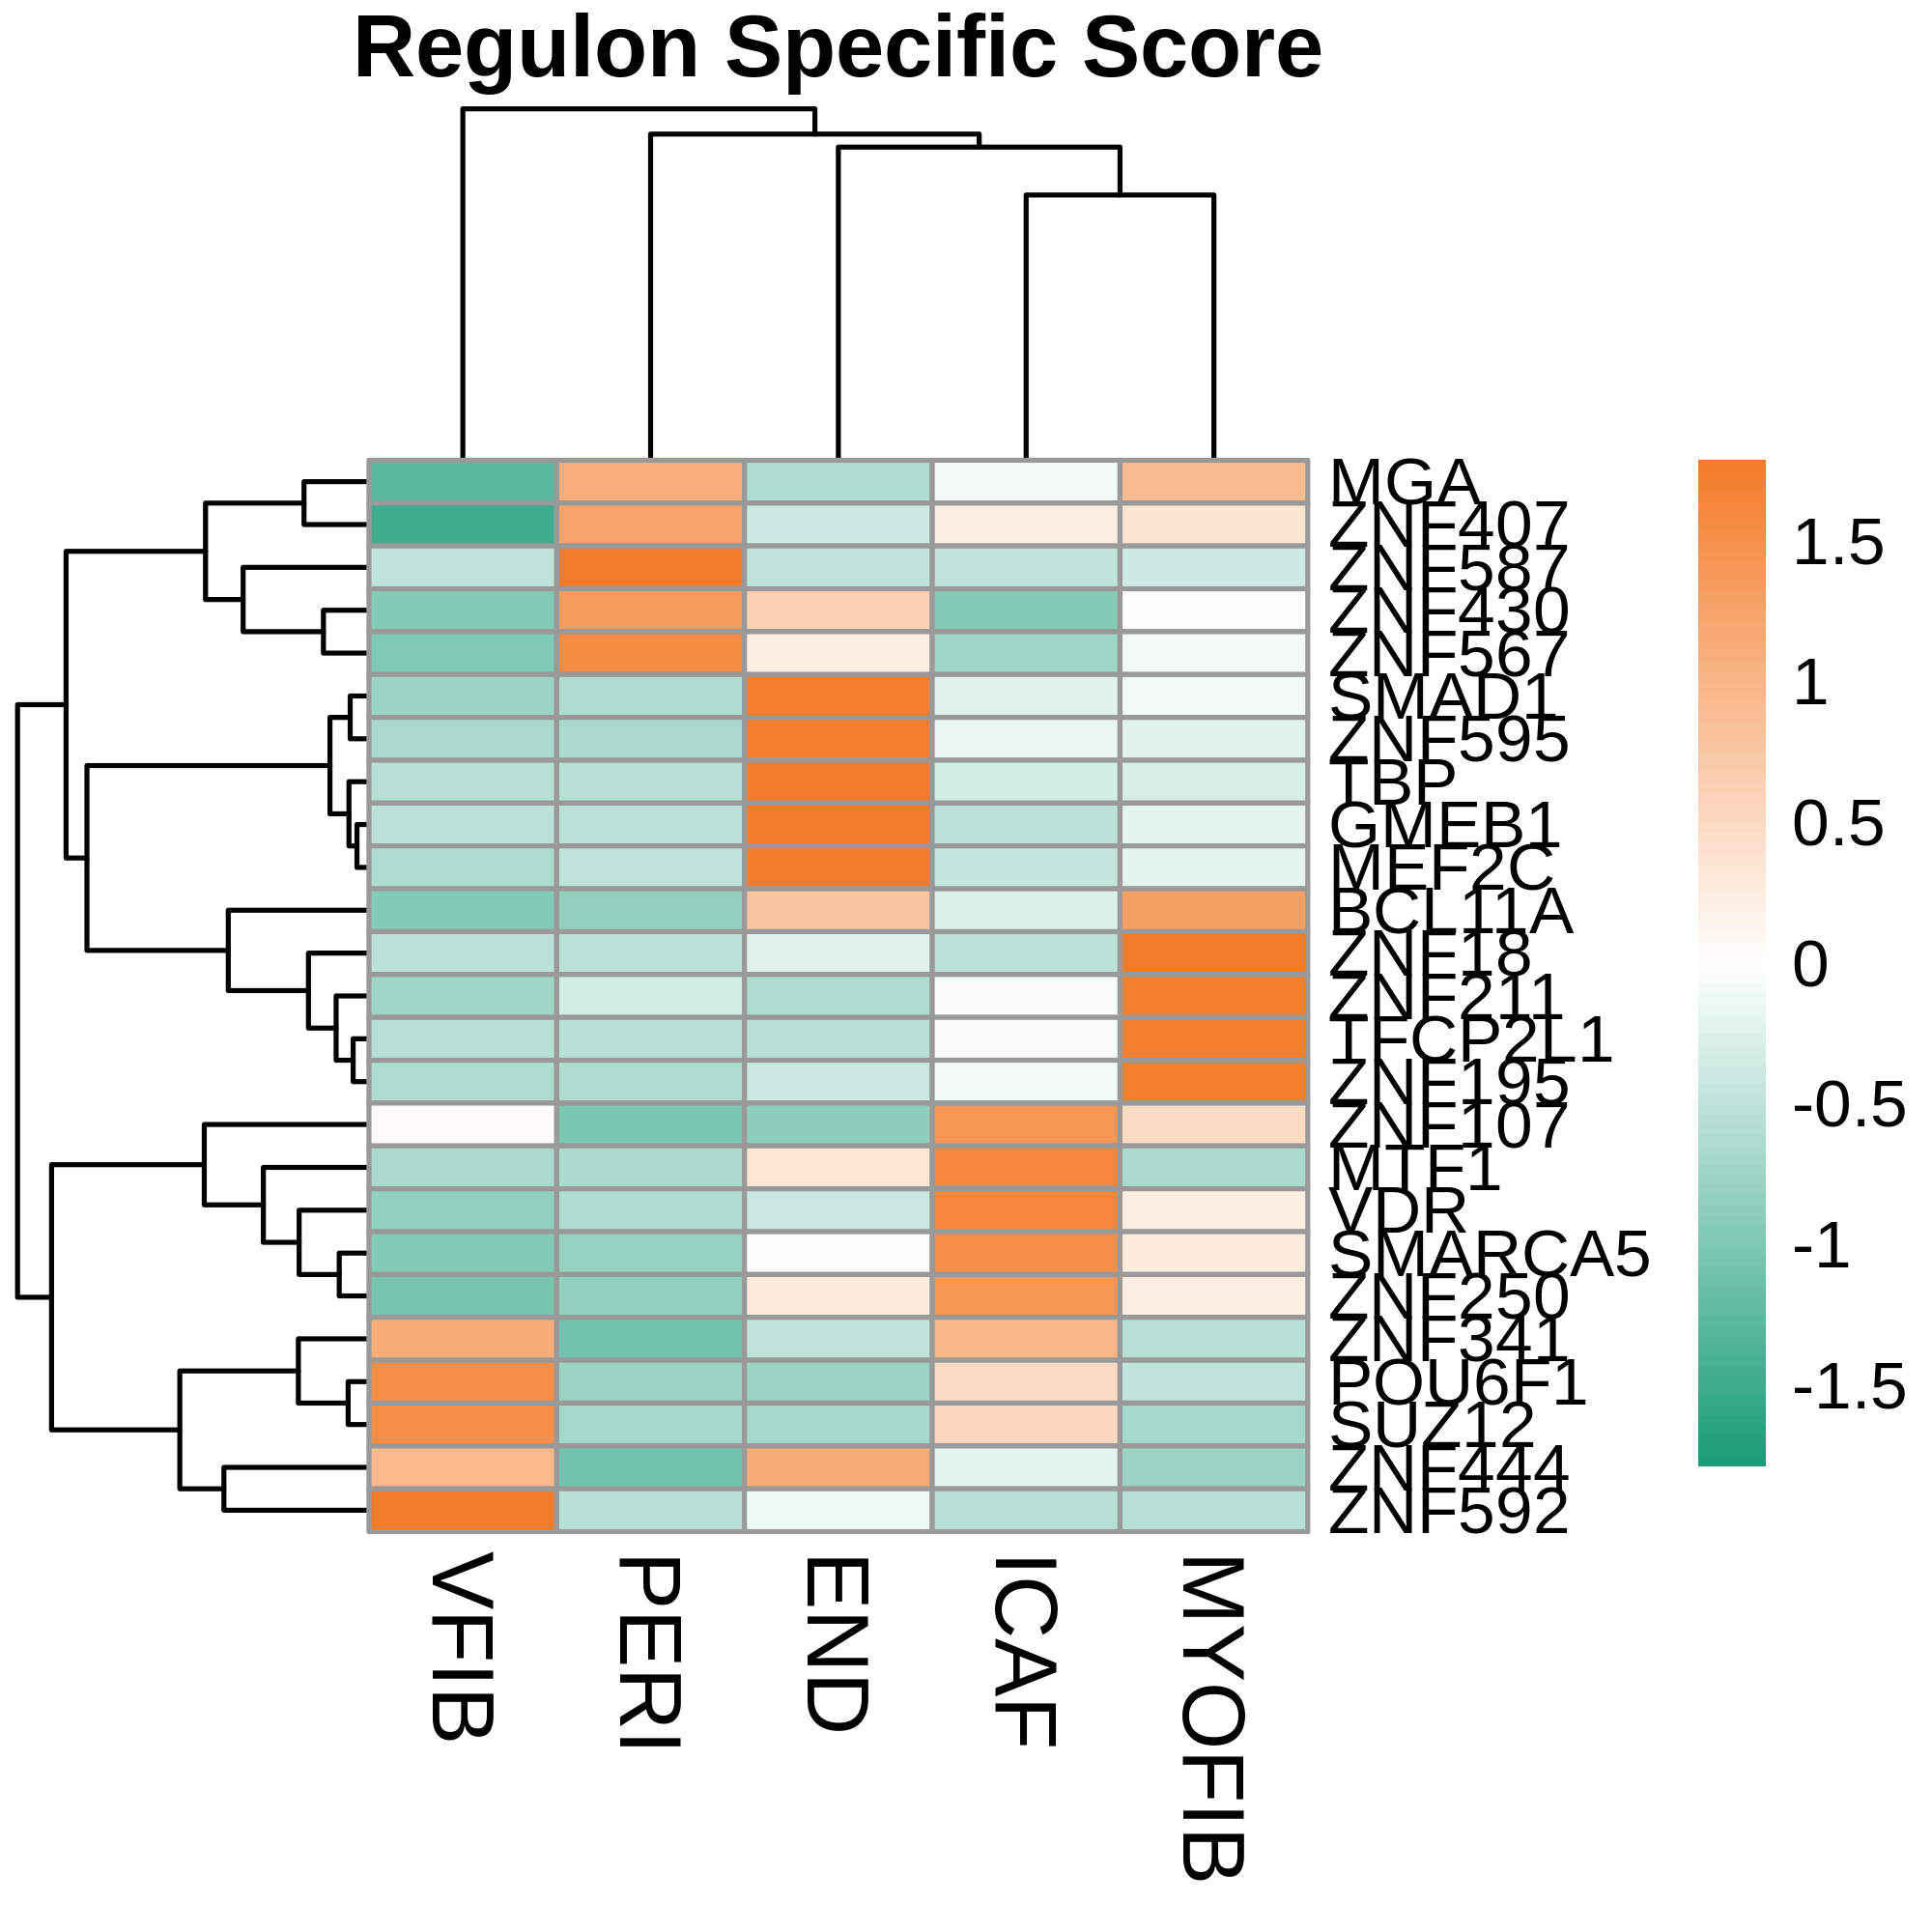
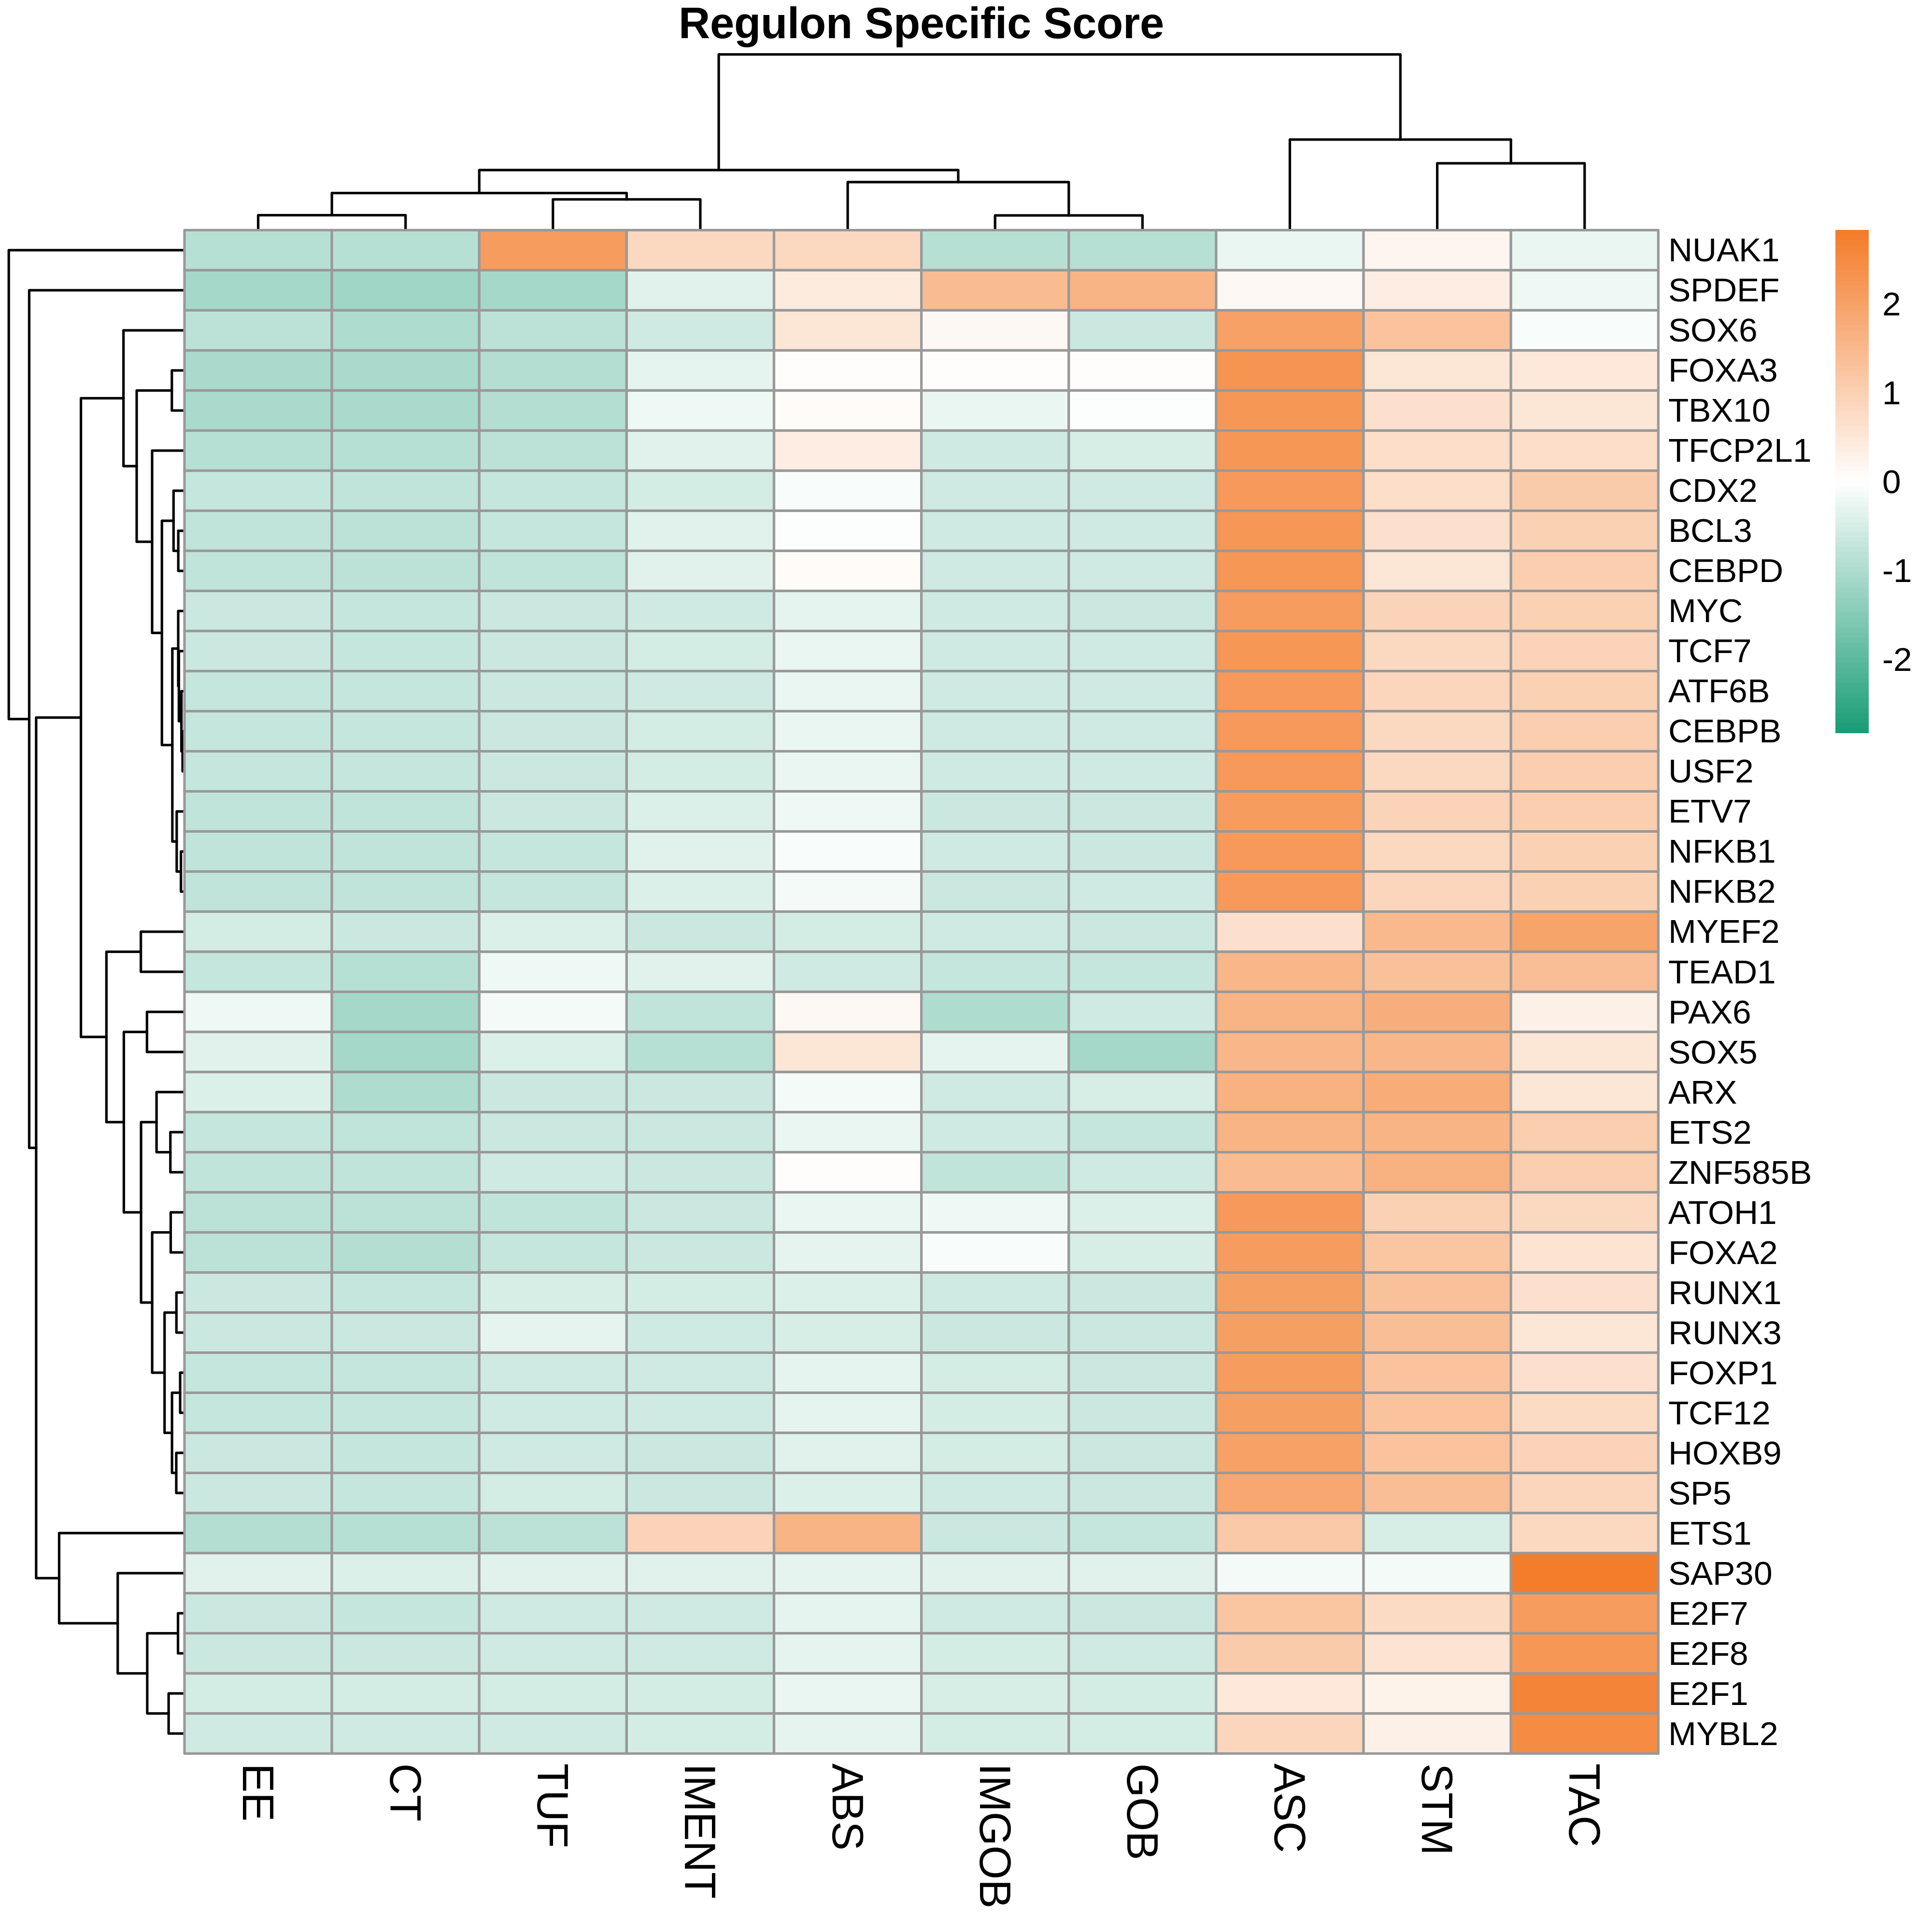
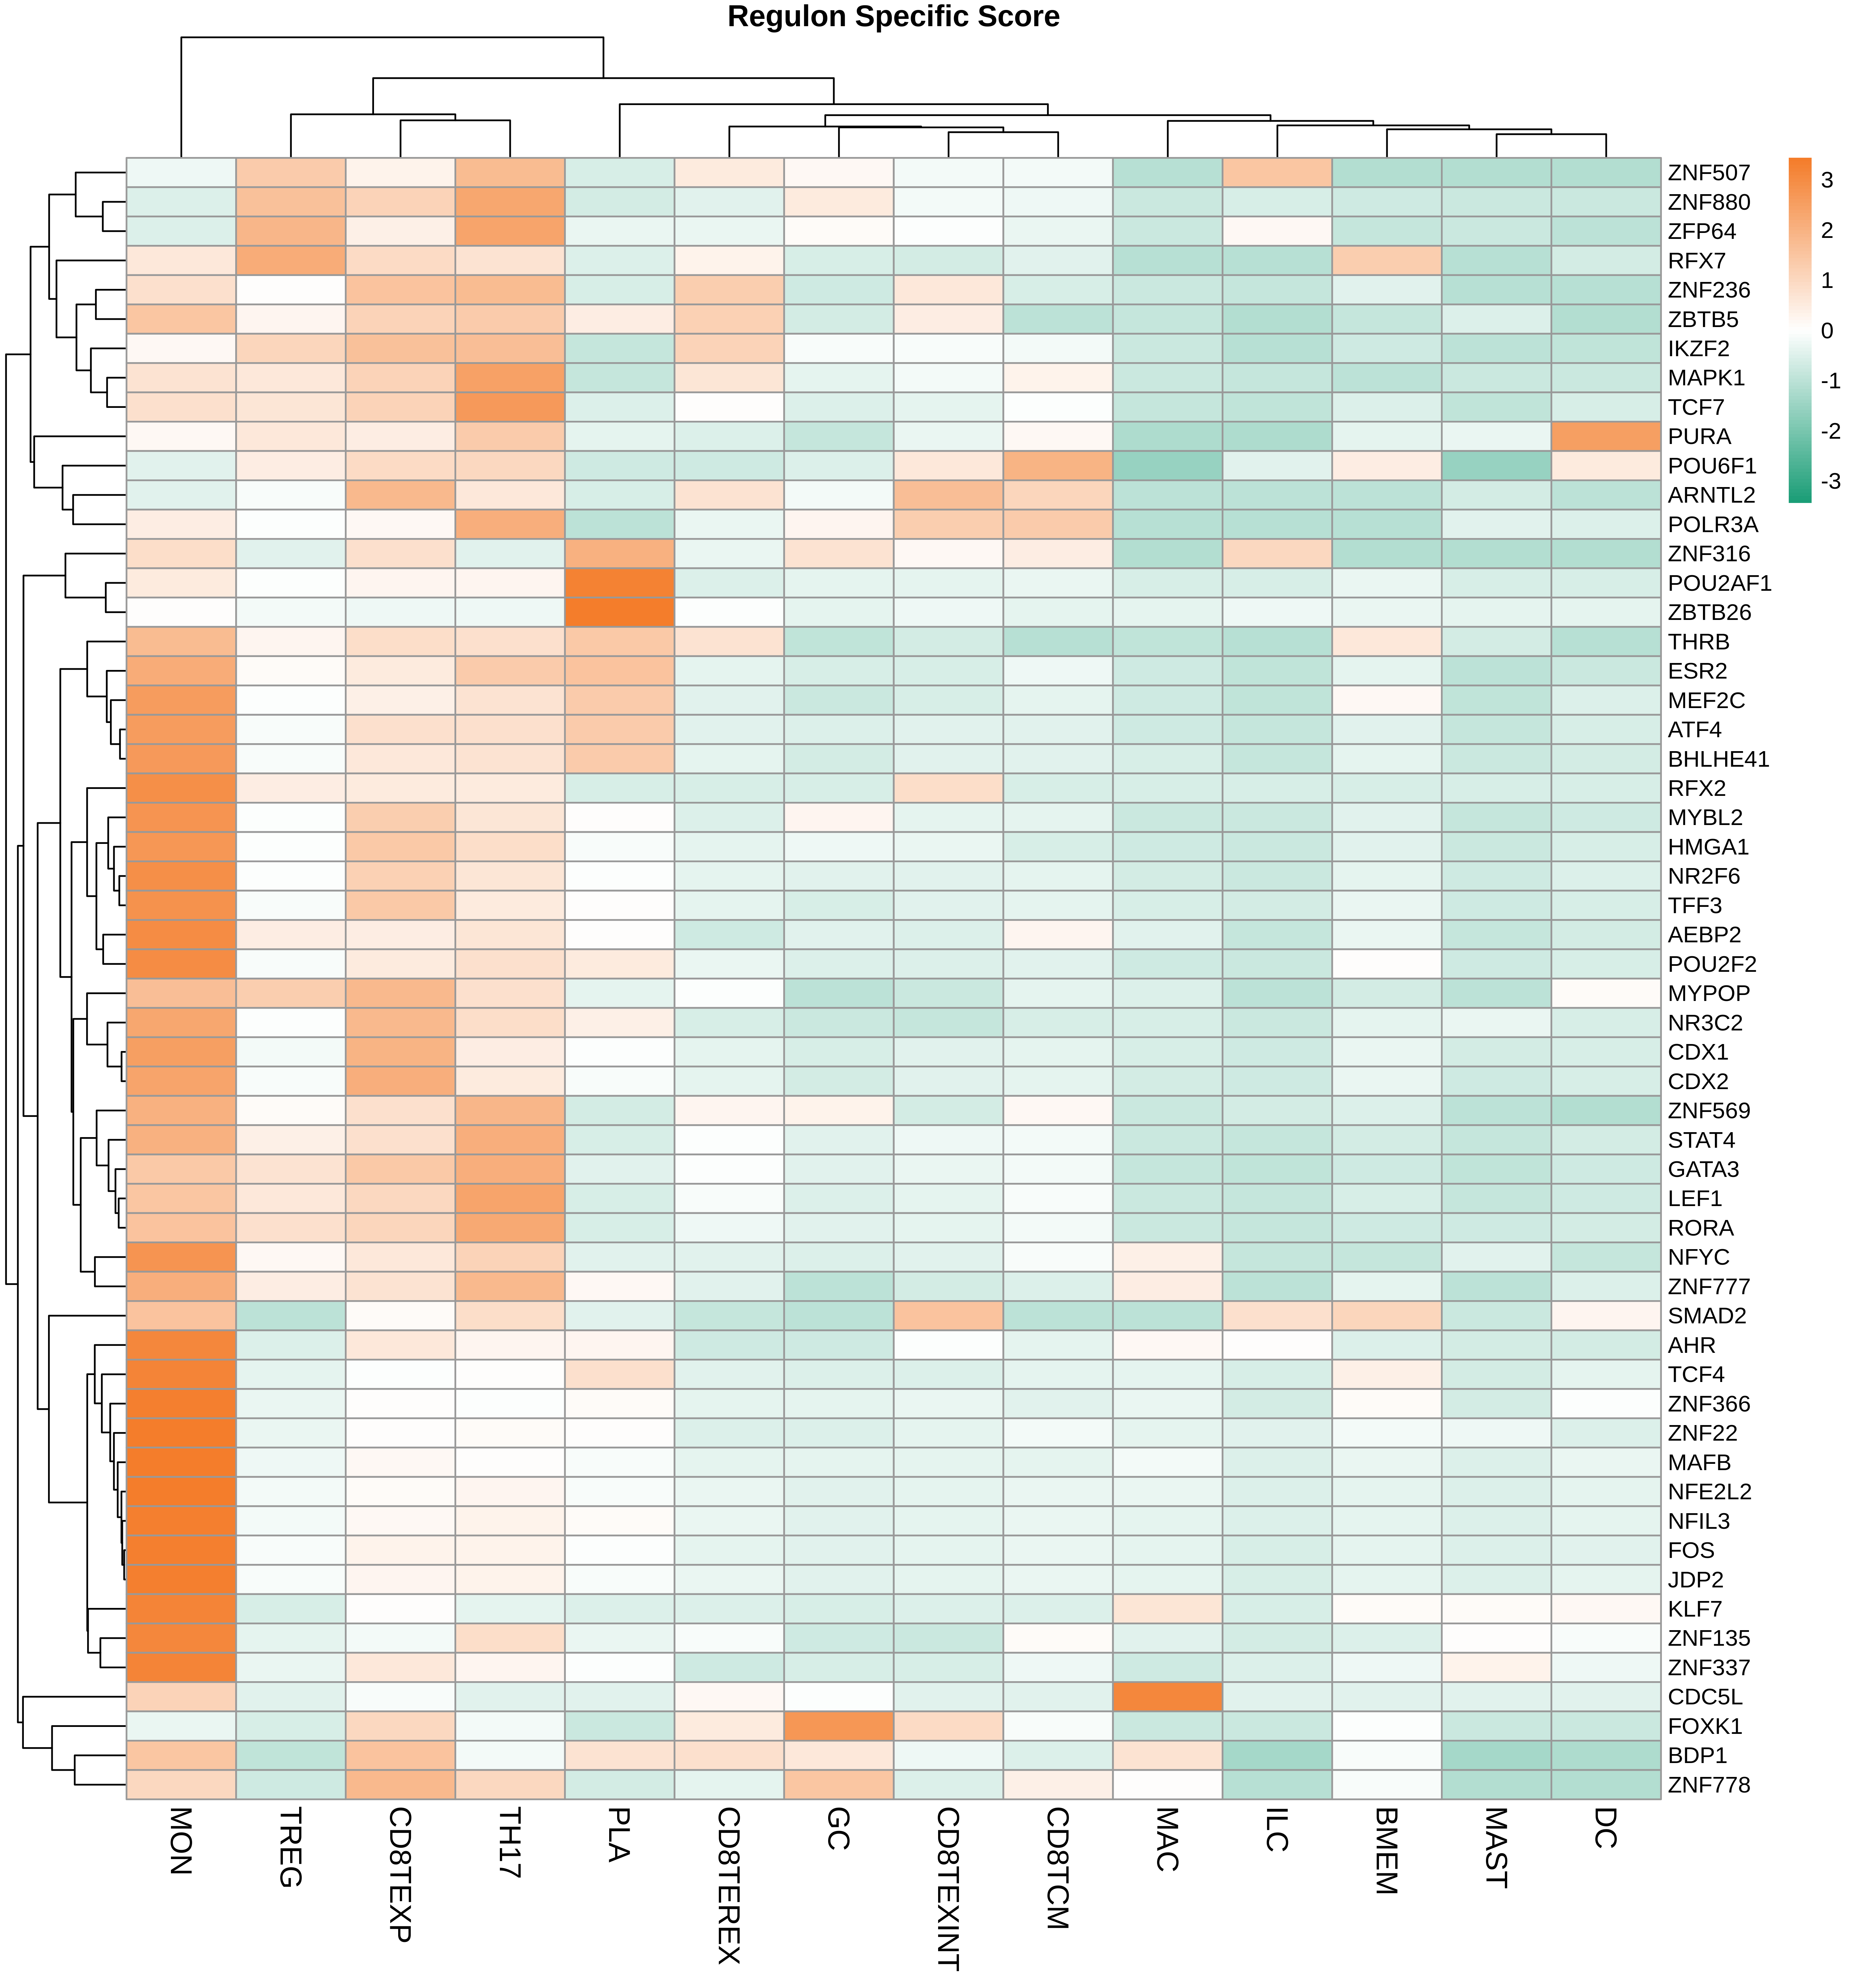
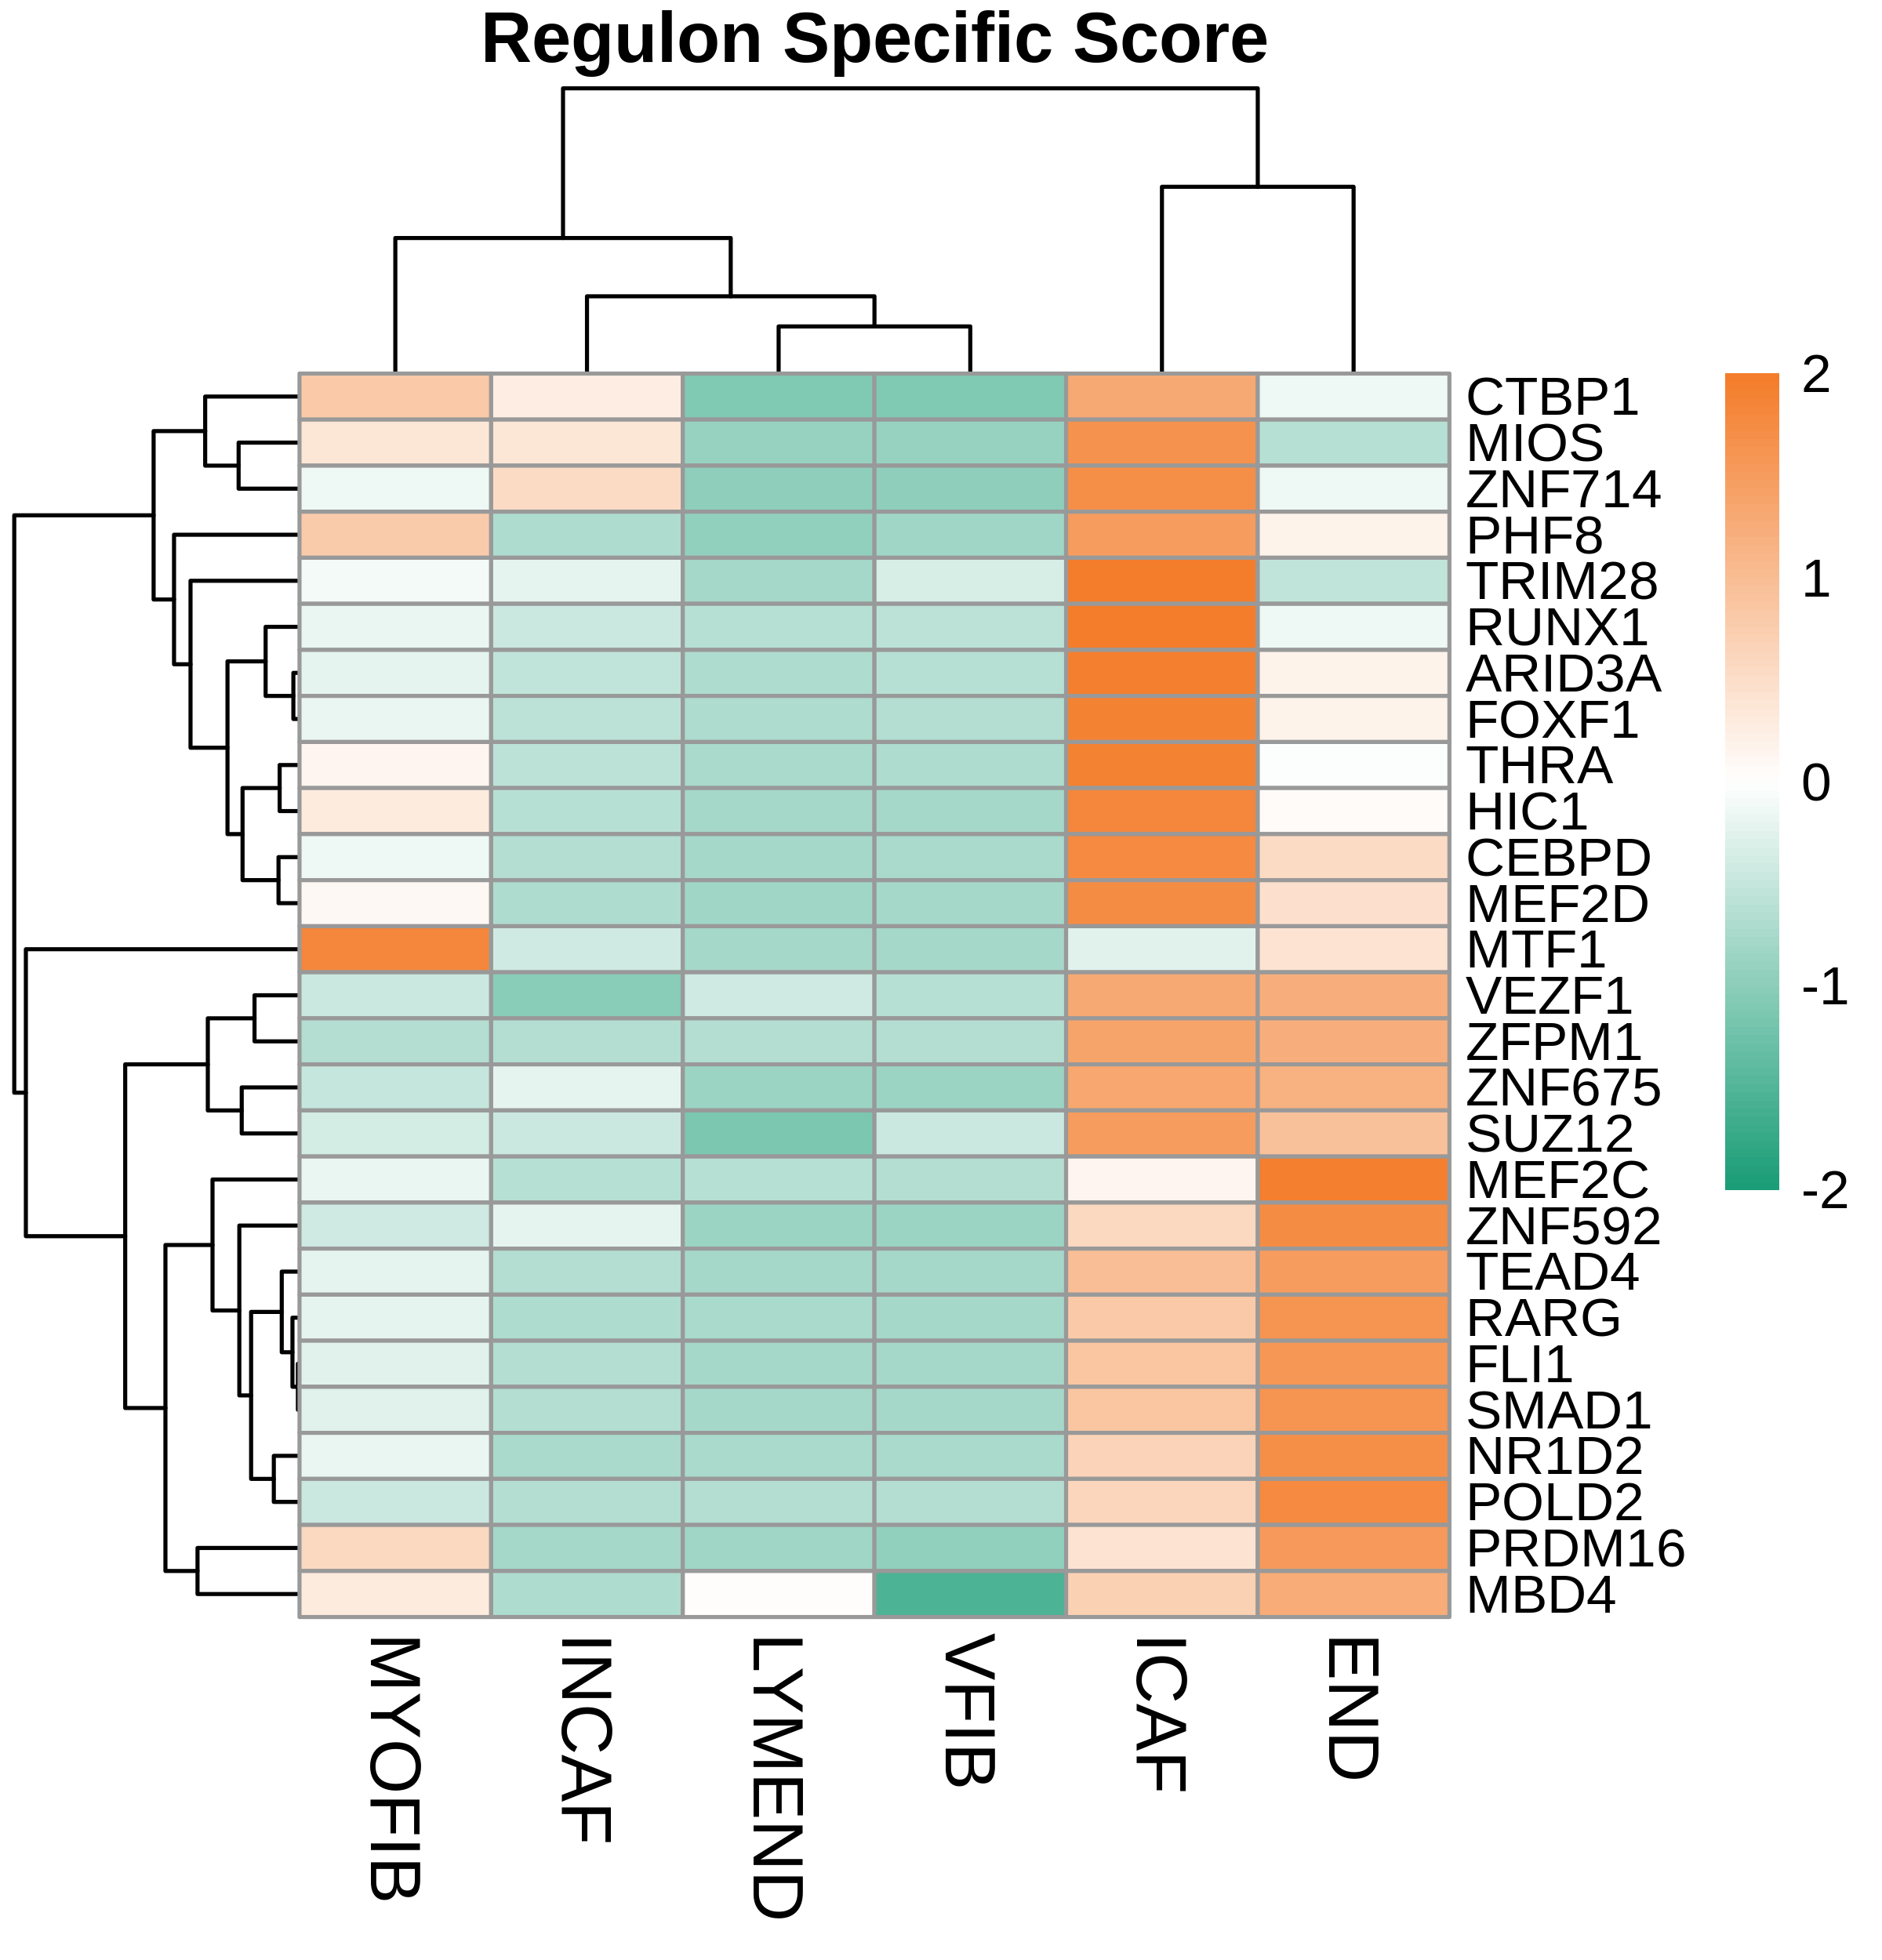
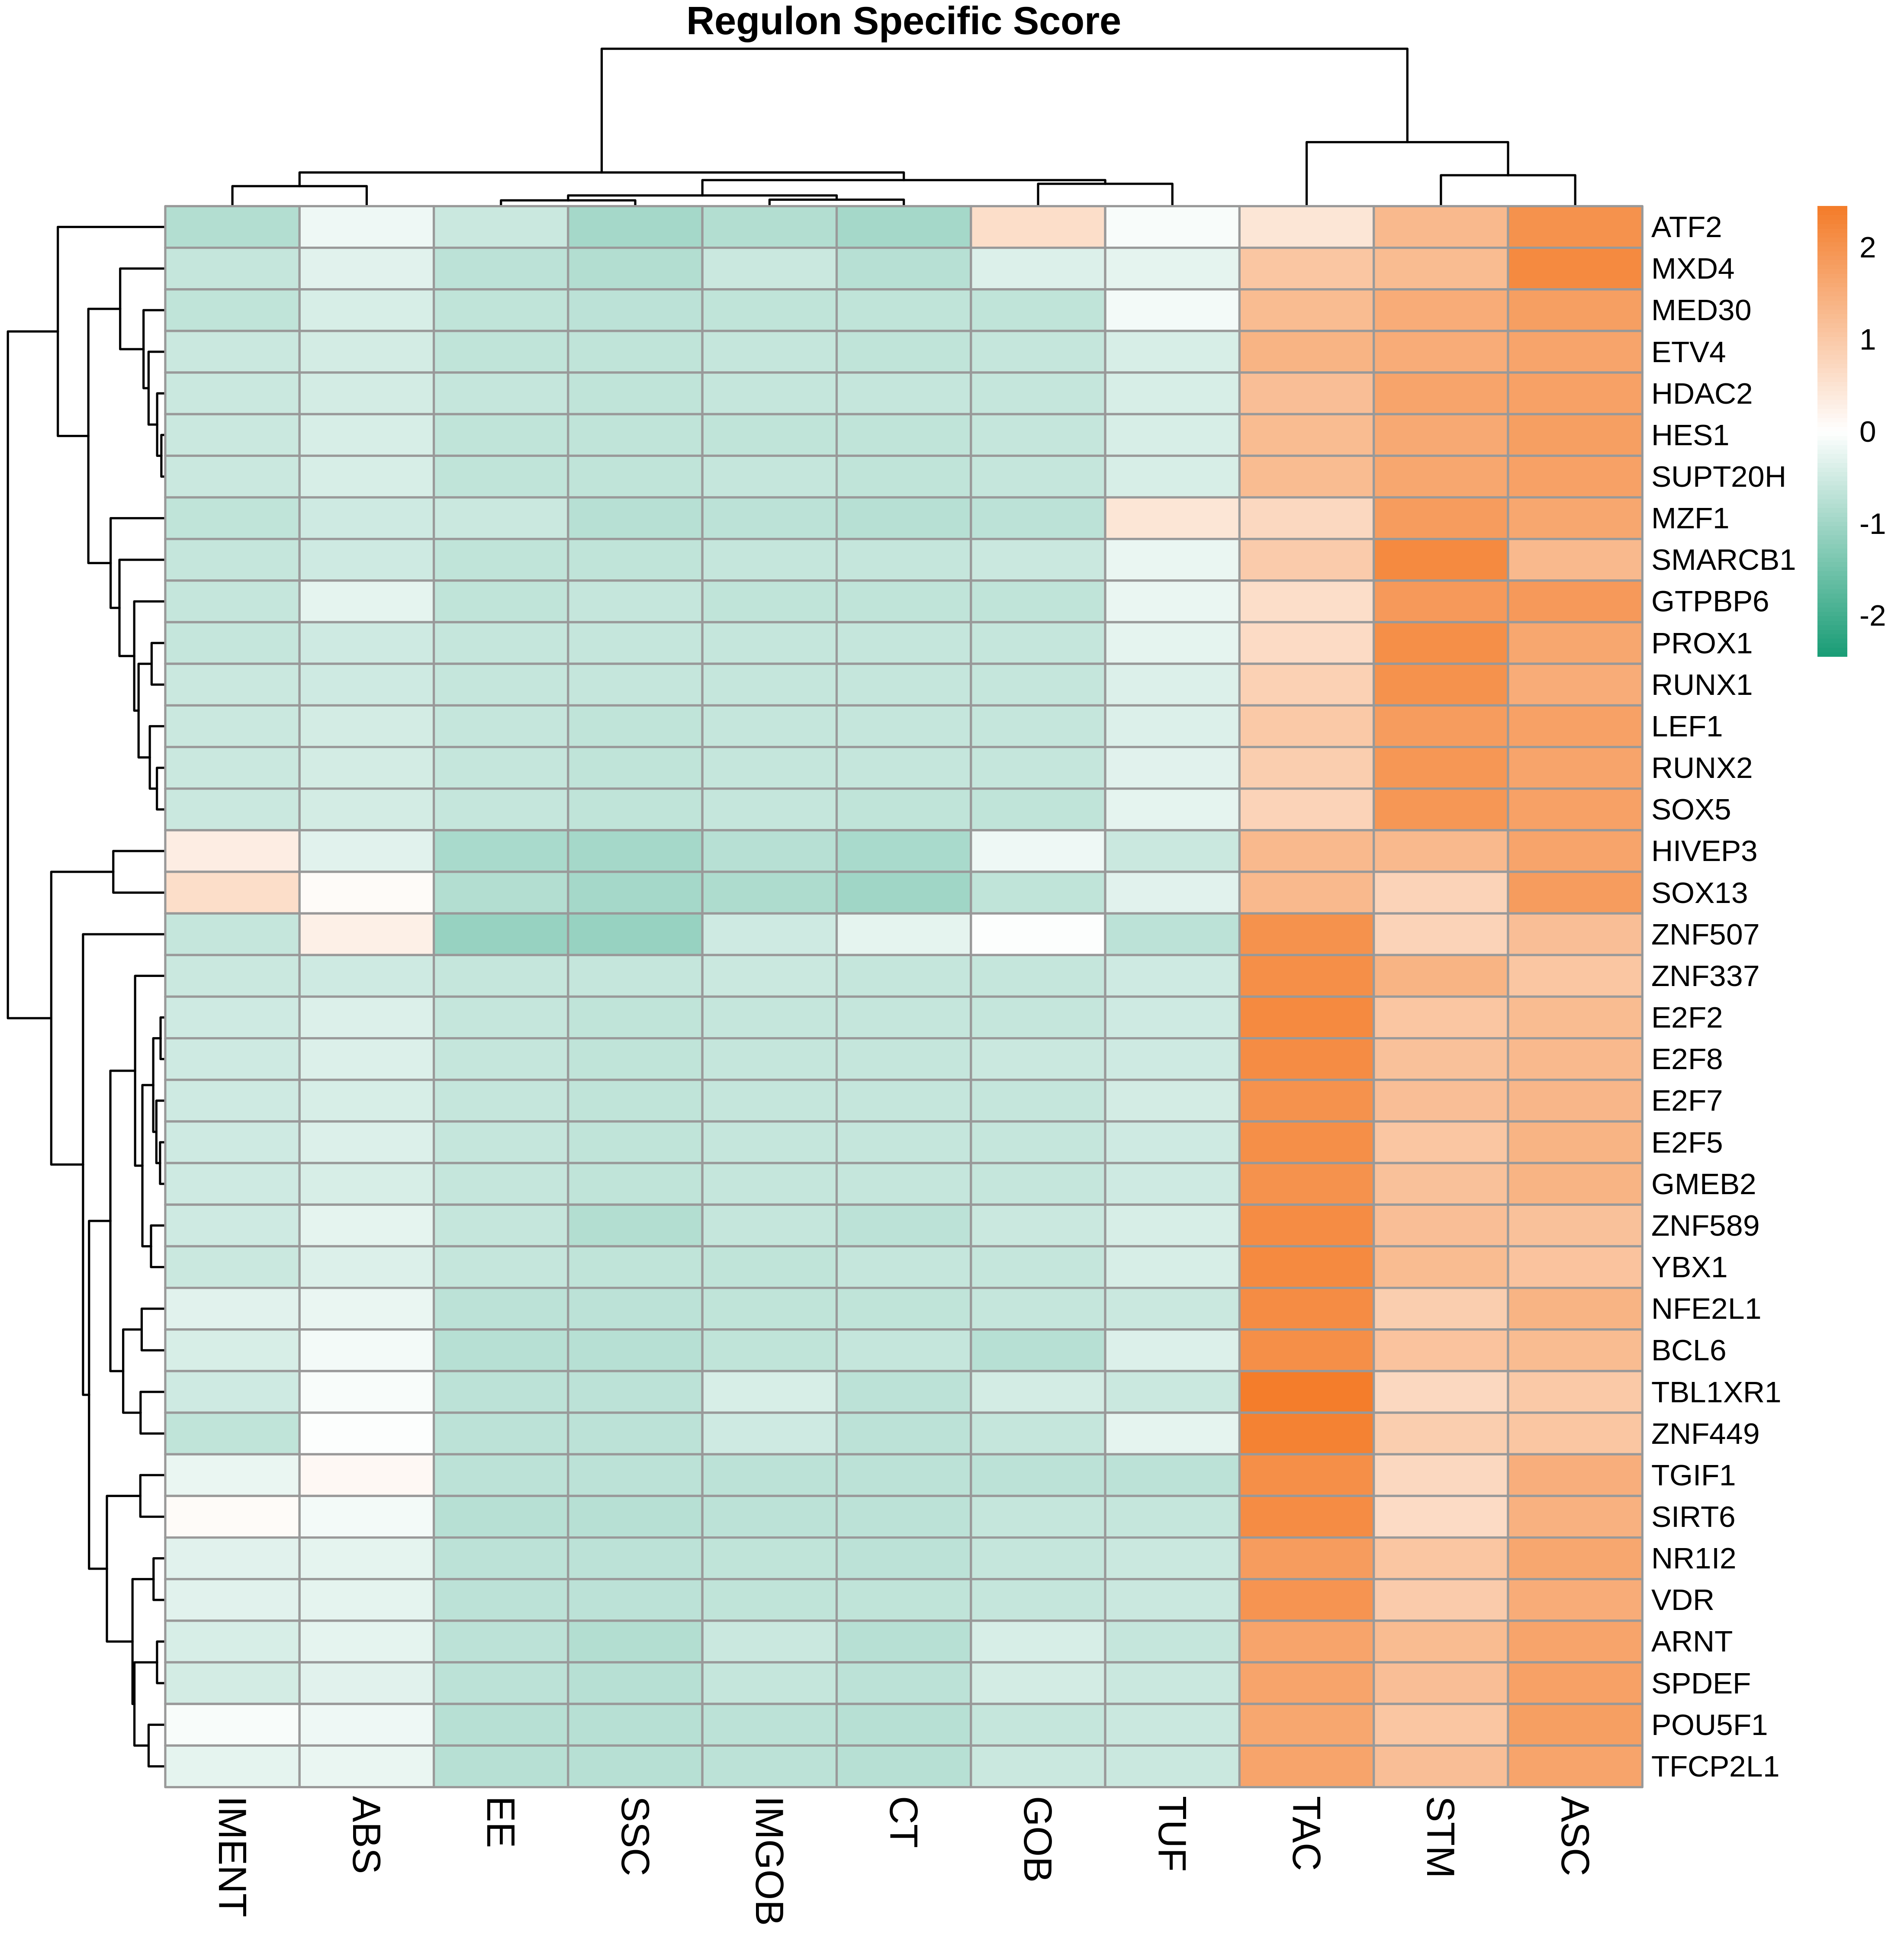
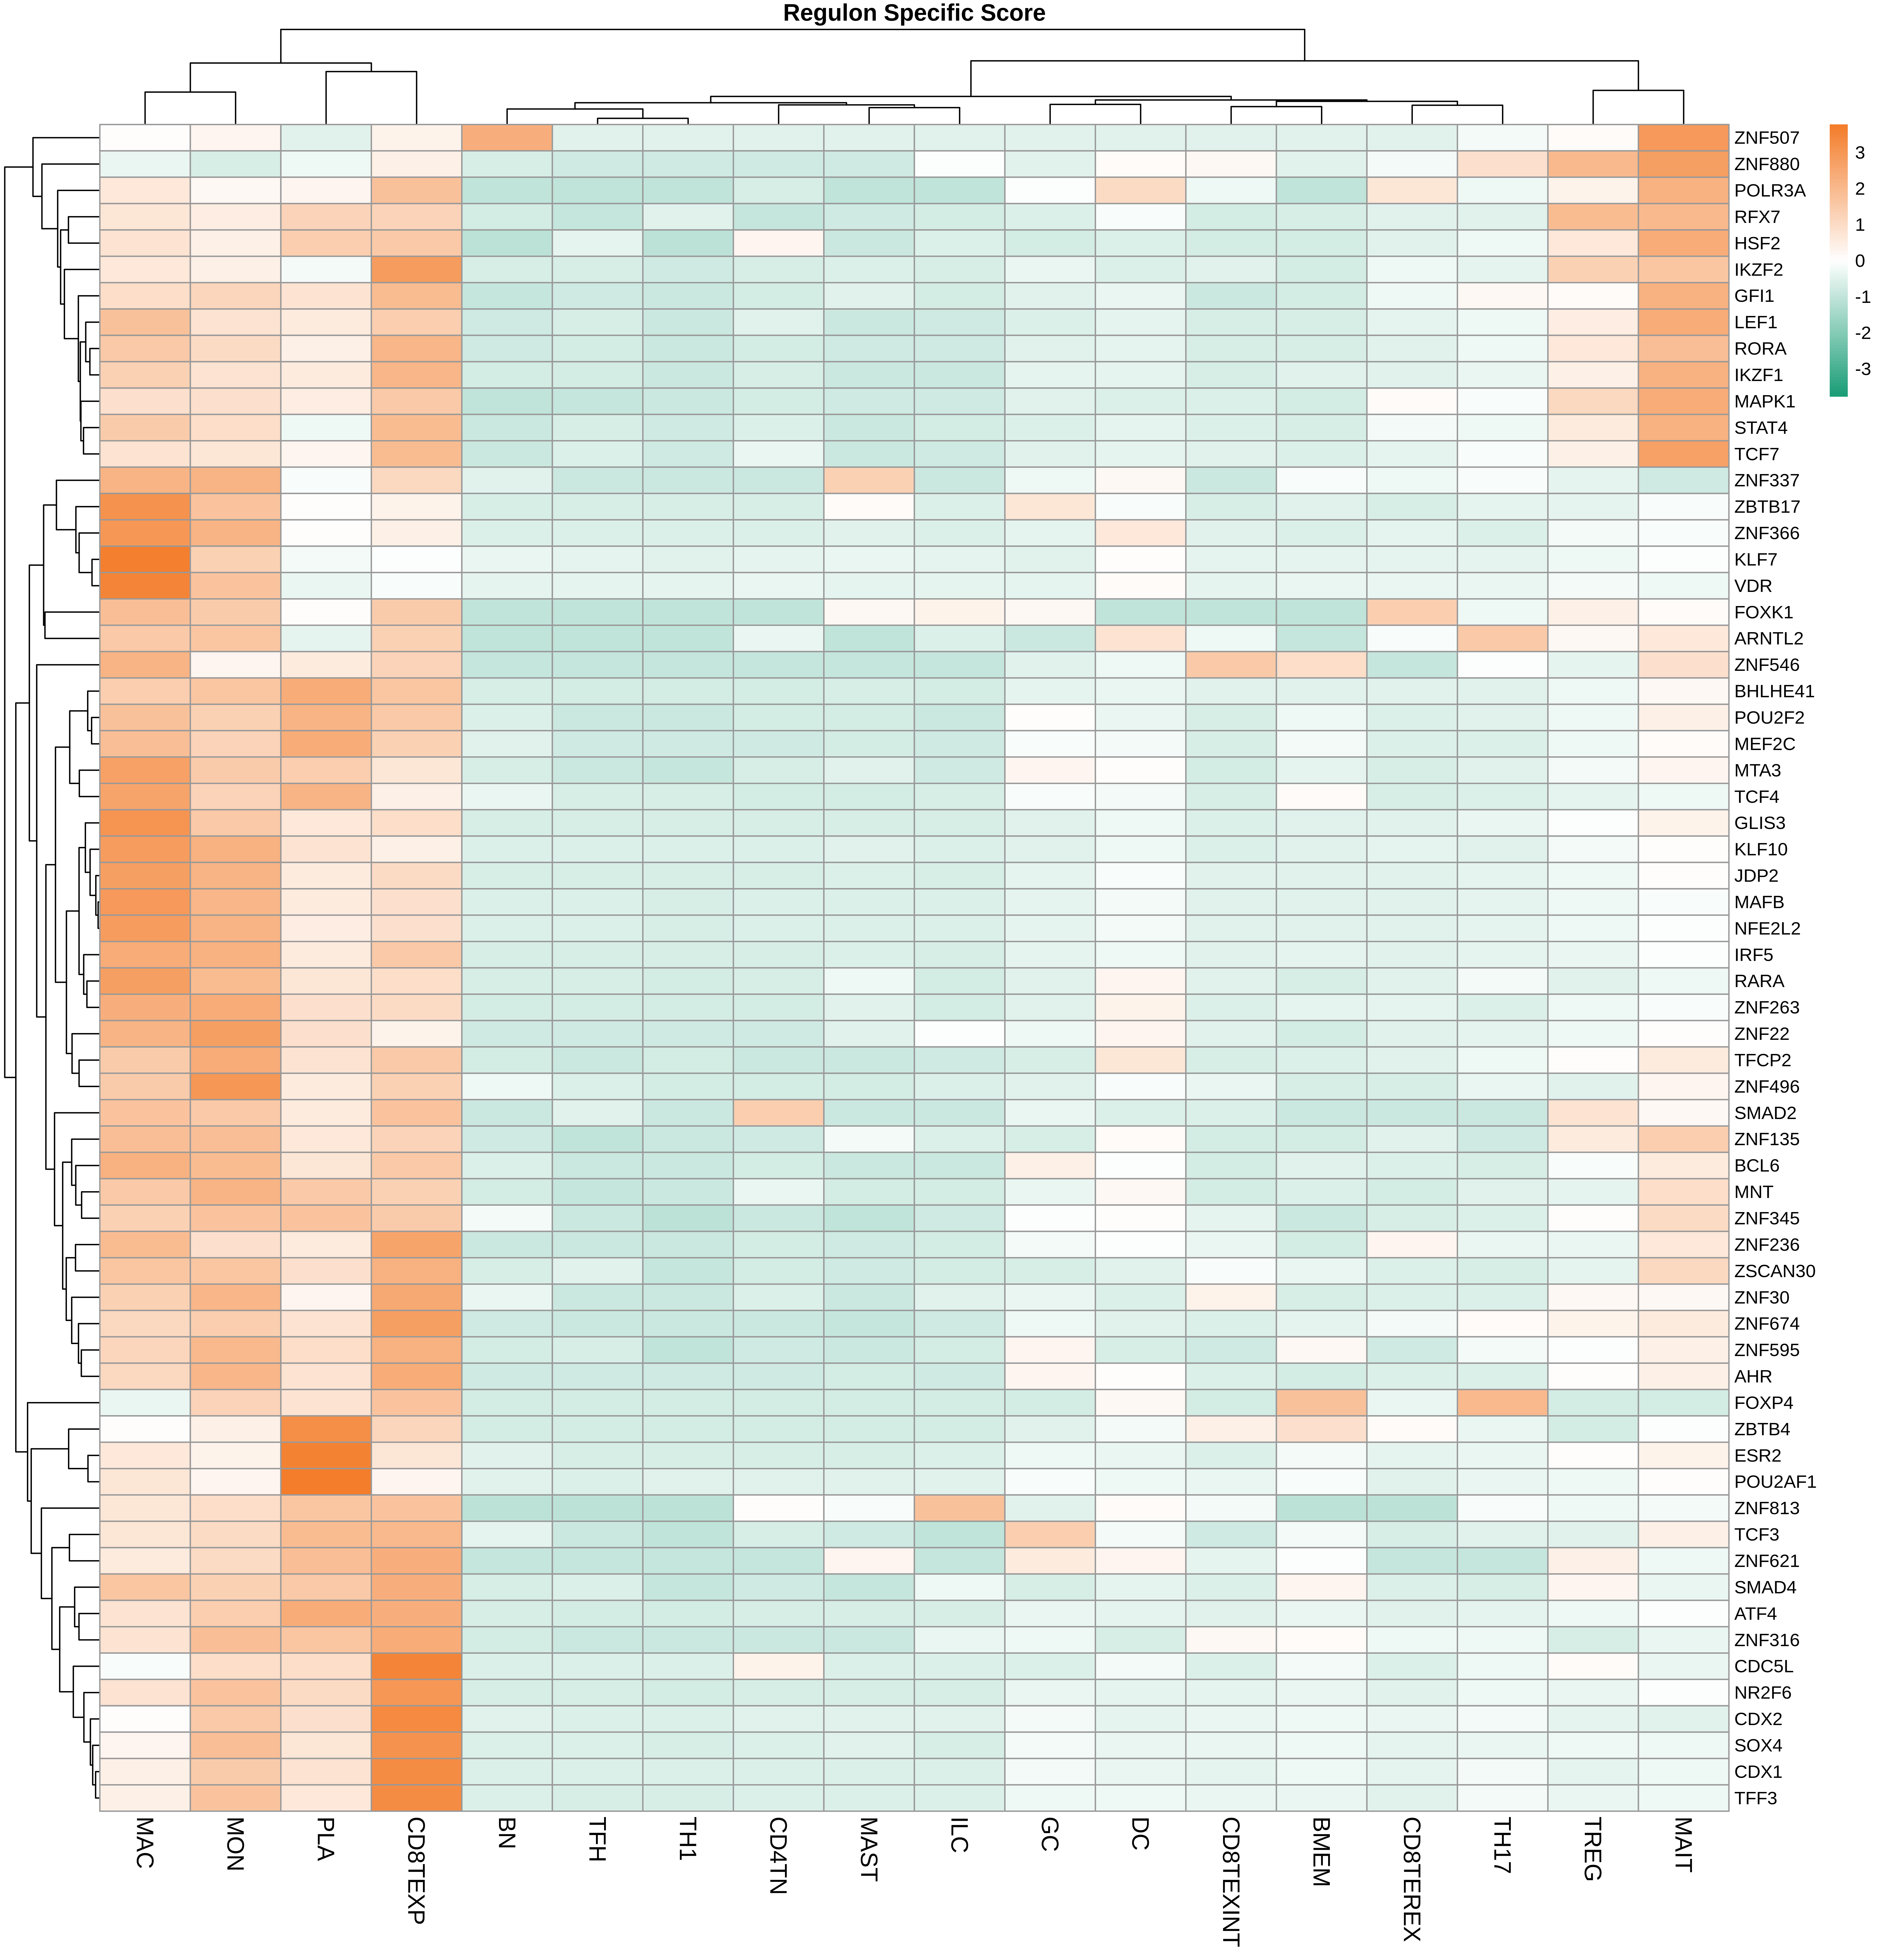
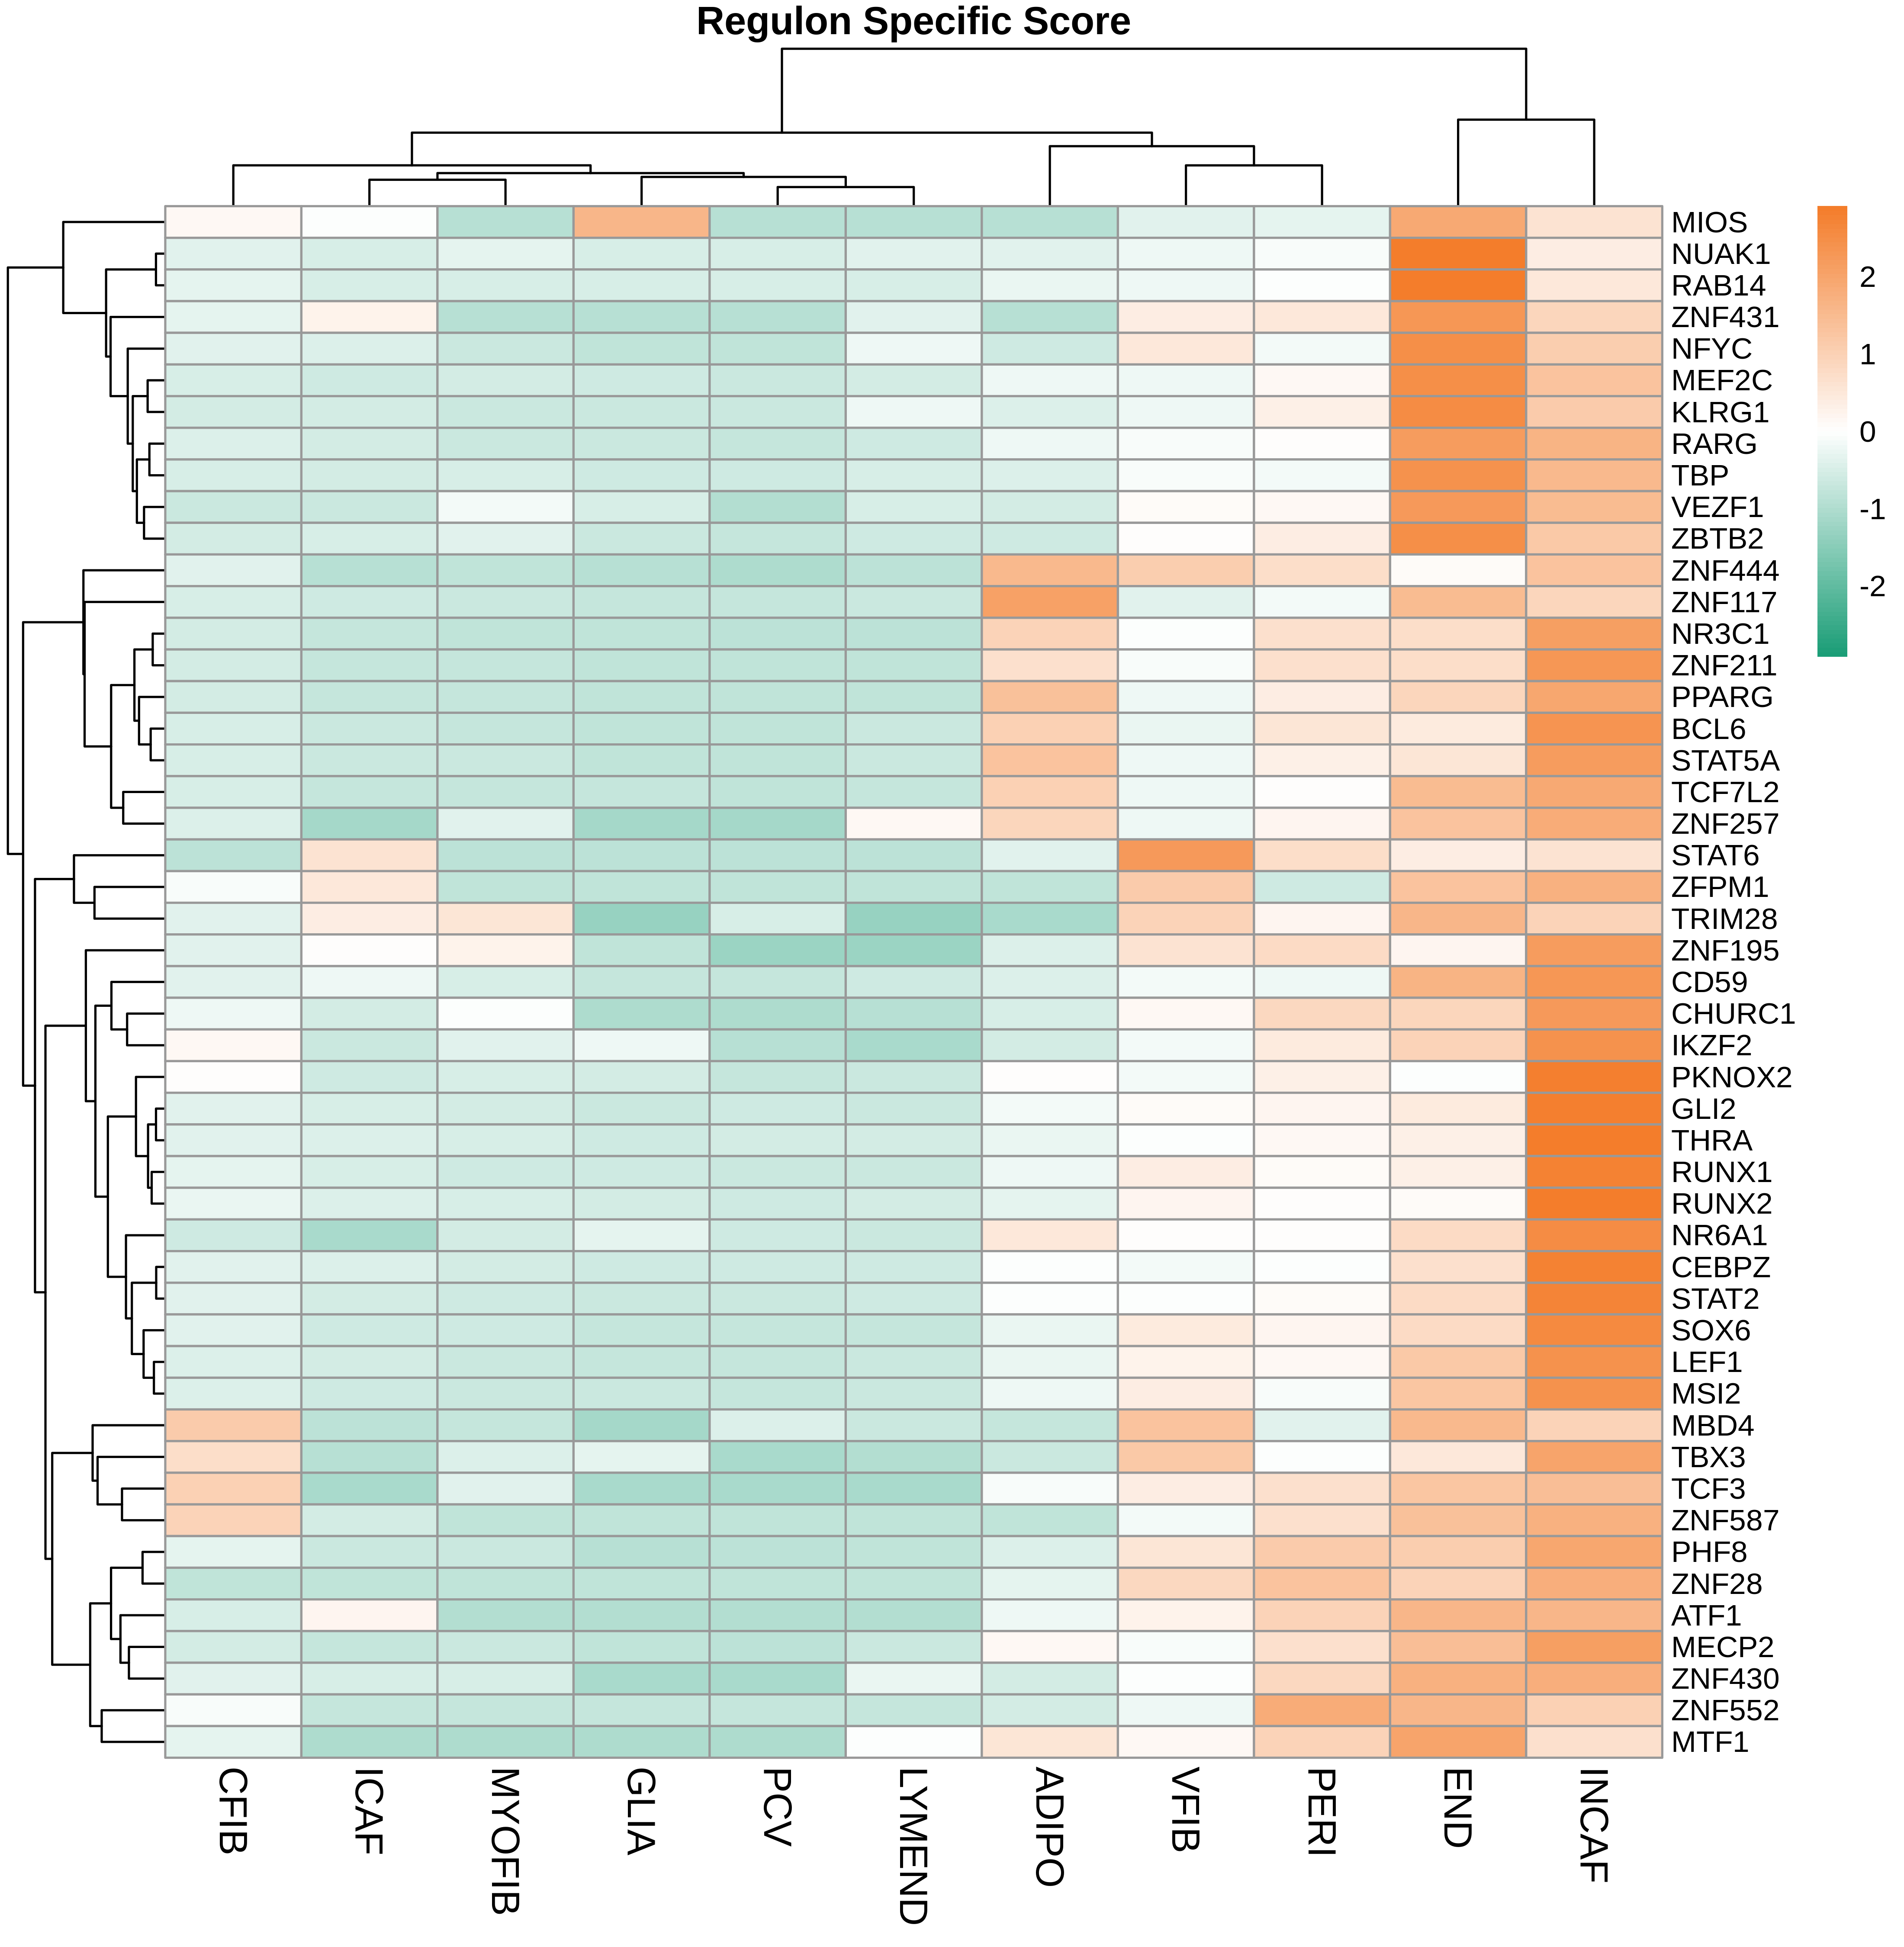
| ∗Heatmap: Heatmap representation of significantly different TFs among all cell types of epithelial compartment in Healthy-derived samples of Colorectum tissue by comparing their average AUC by using pySCENIC in Python. Regulon specific score for each cell type is colored. |
| ∗Network: TF target network created from Healthy-derived samples of Colorectum tissue using Top 50 predicted target genes of each regulon. Edge lengths are the inferred TF-target weightings. |
Top |
Cell-cell interaction analysis |
| Disease State | Cell Type | Circle | Source | Target |
| Healthy | ABS | 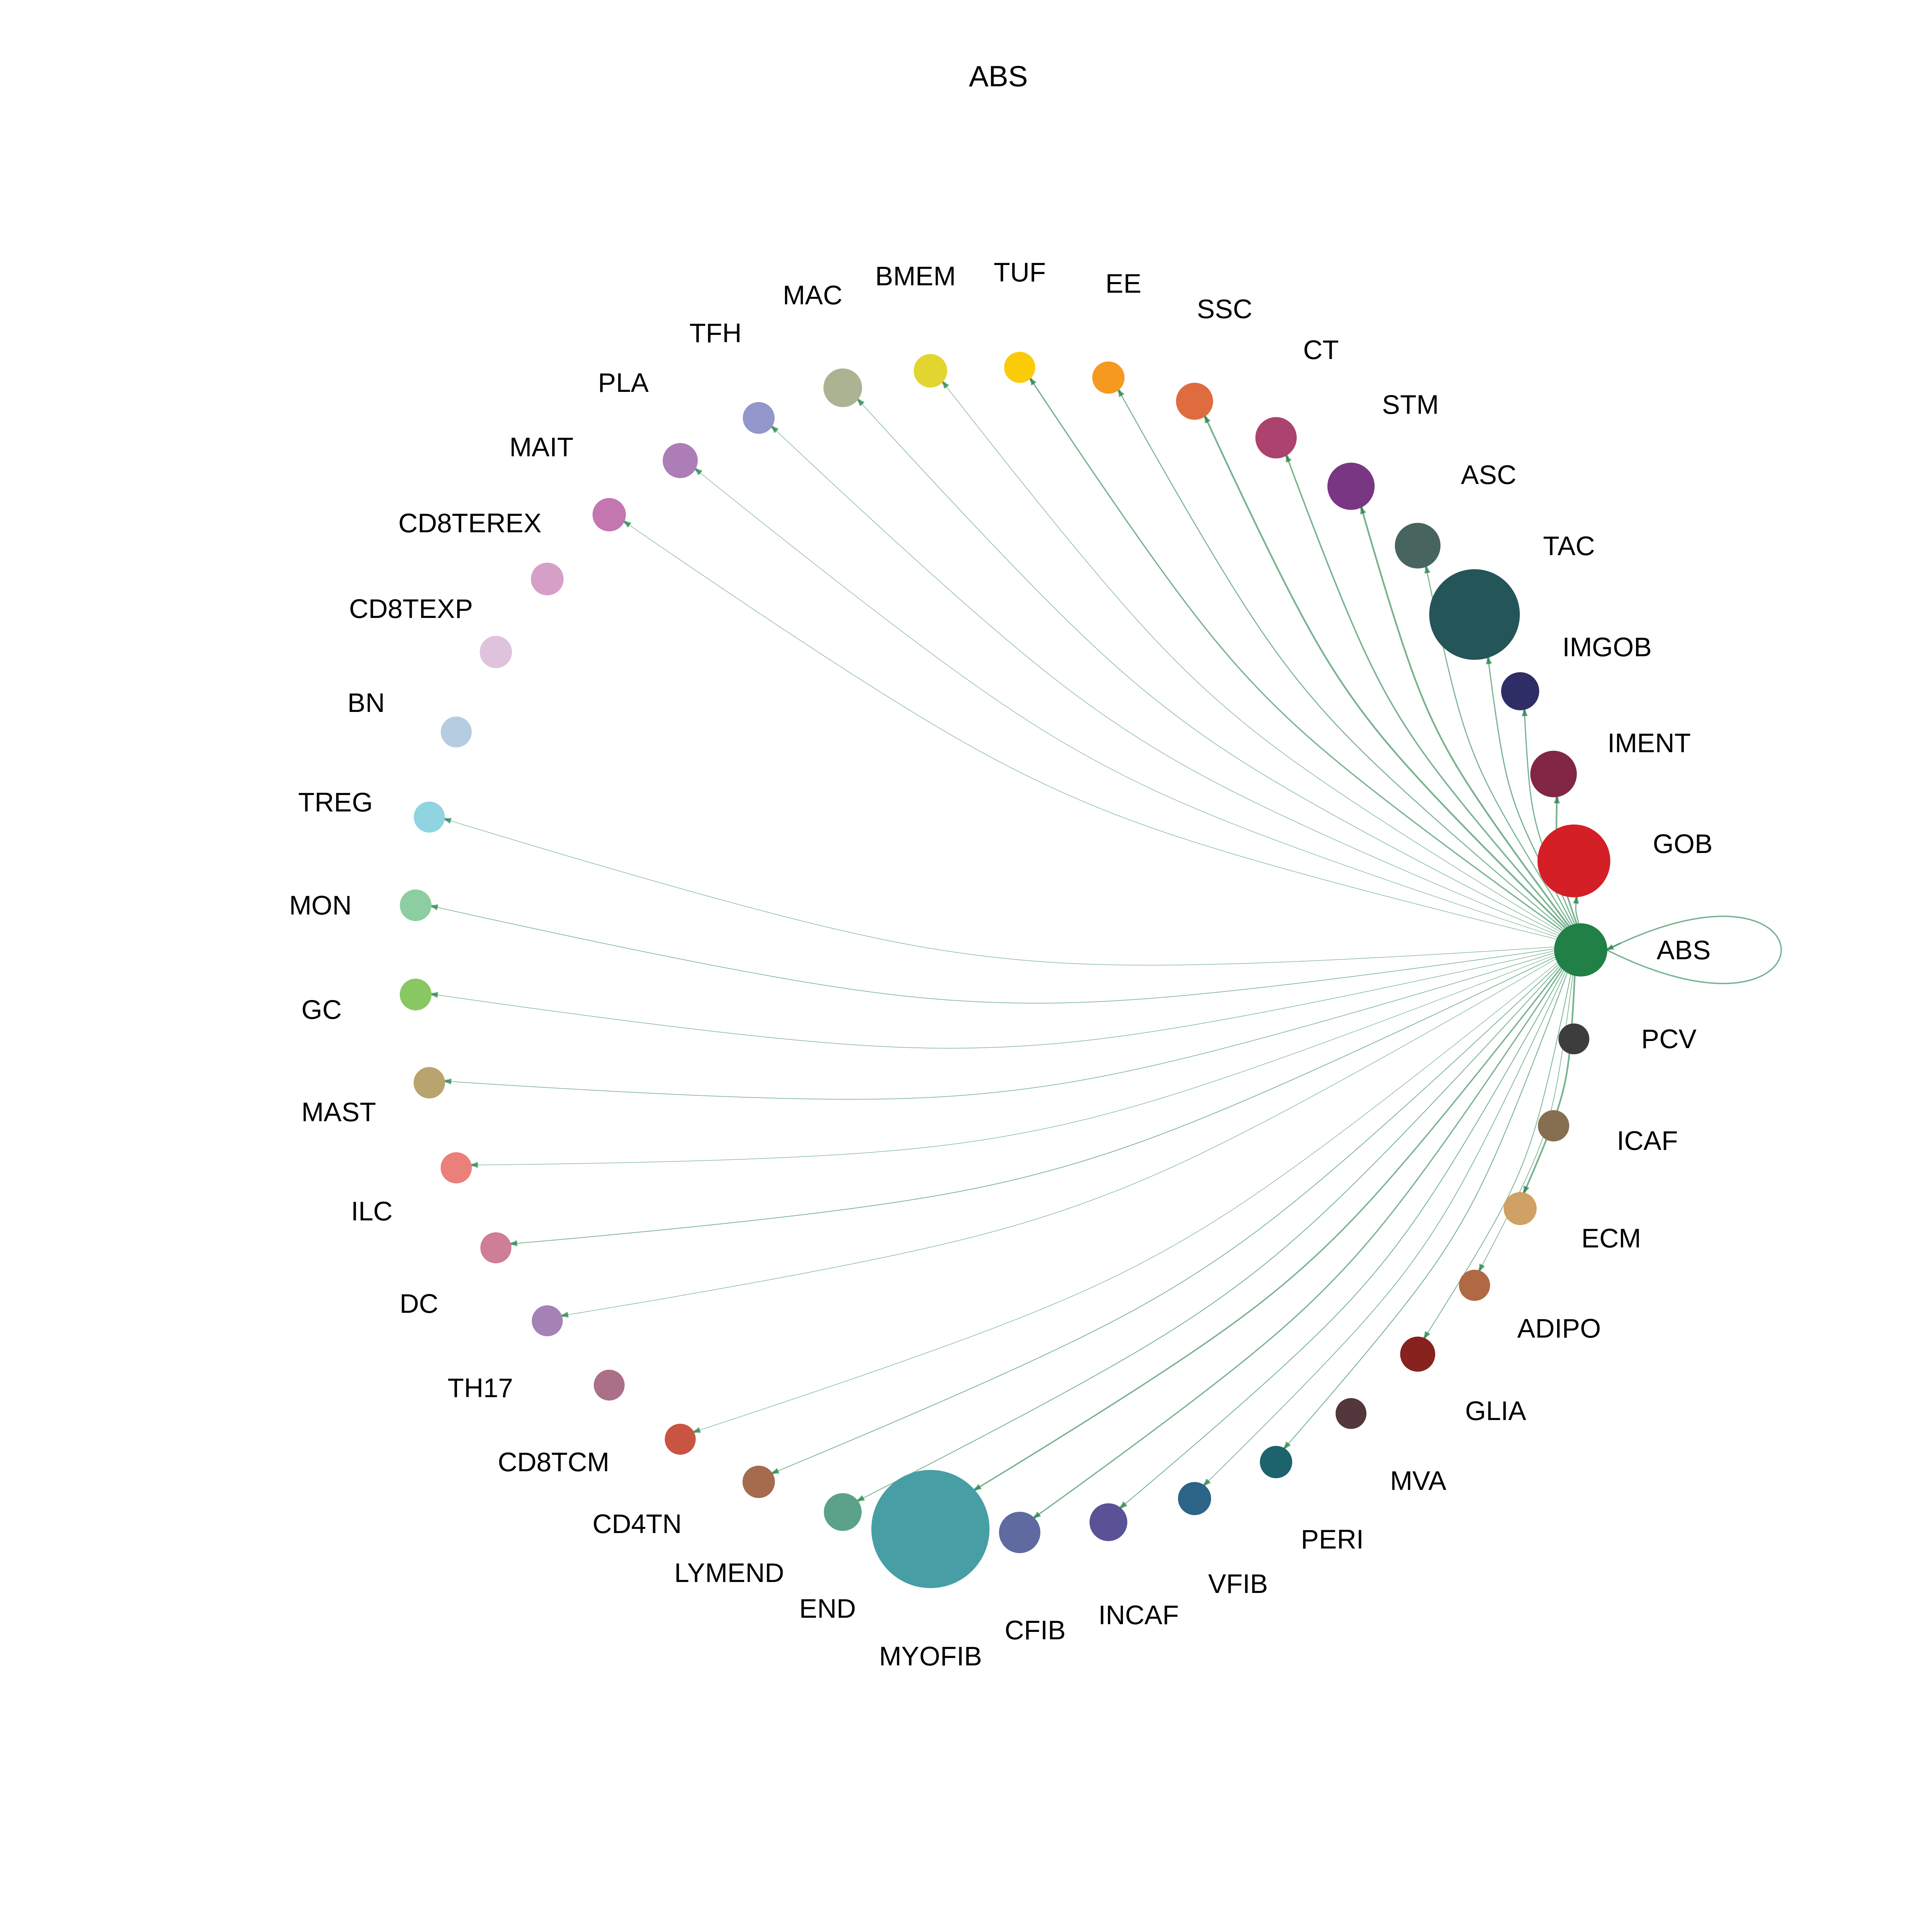 | 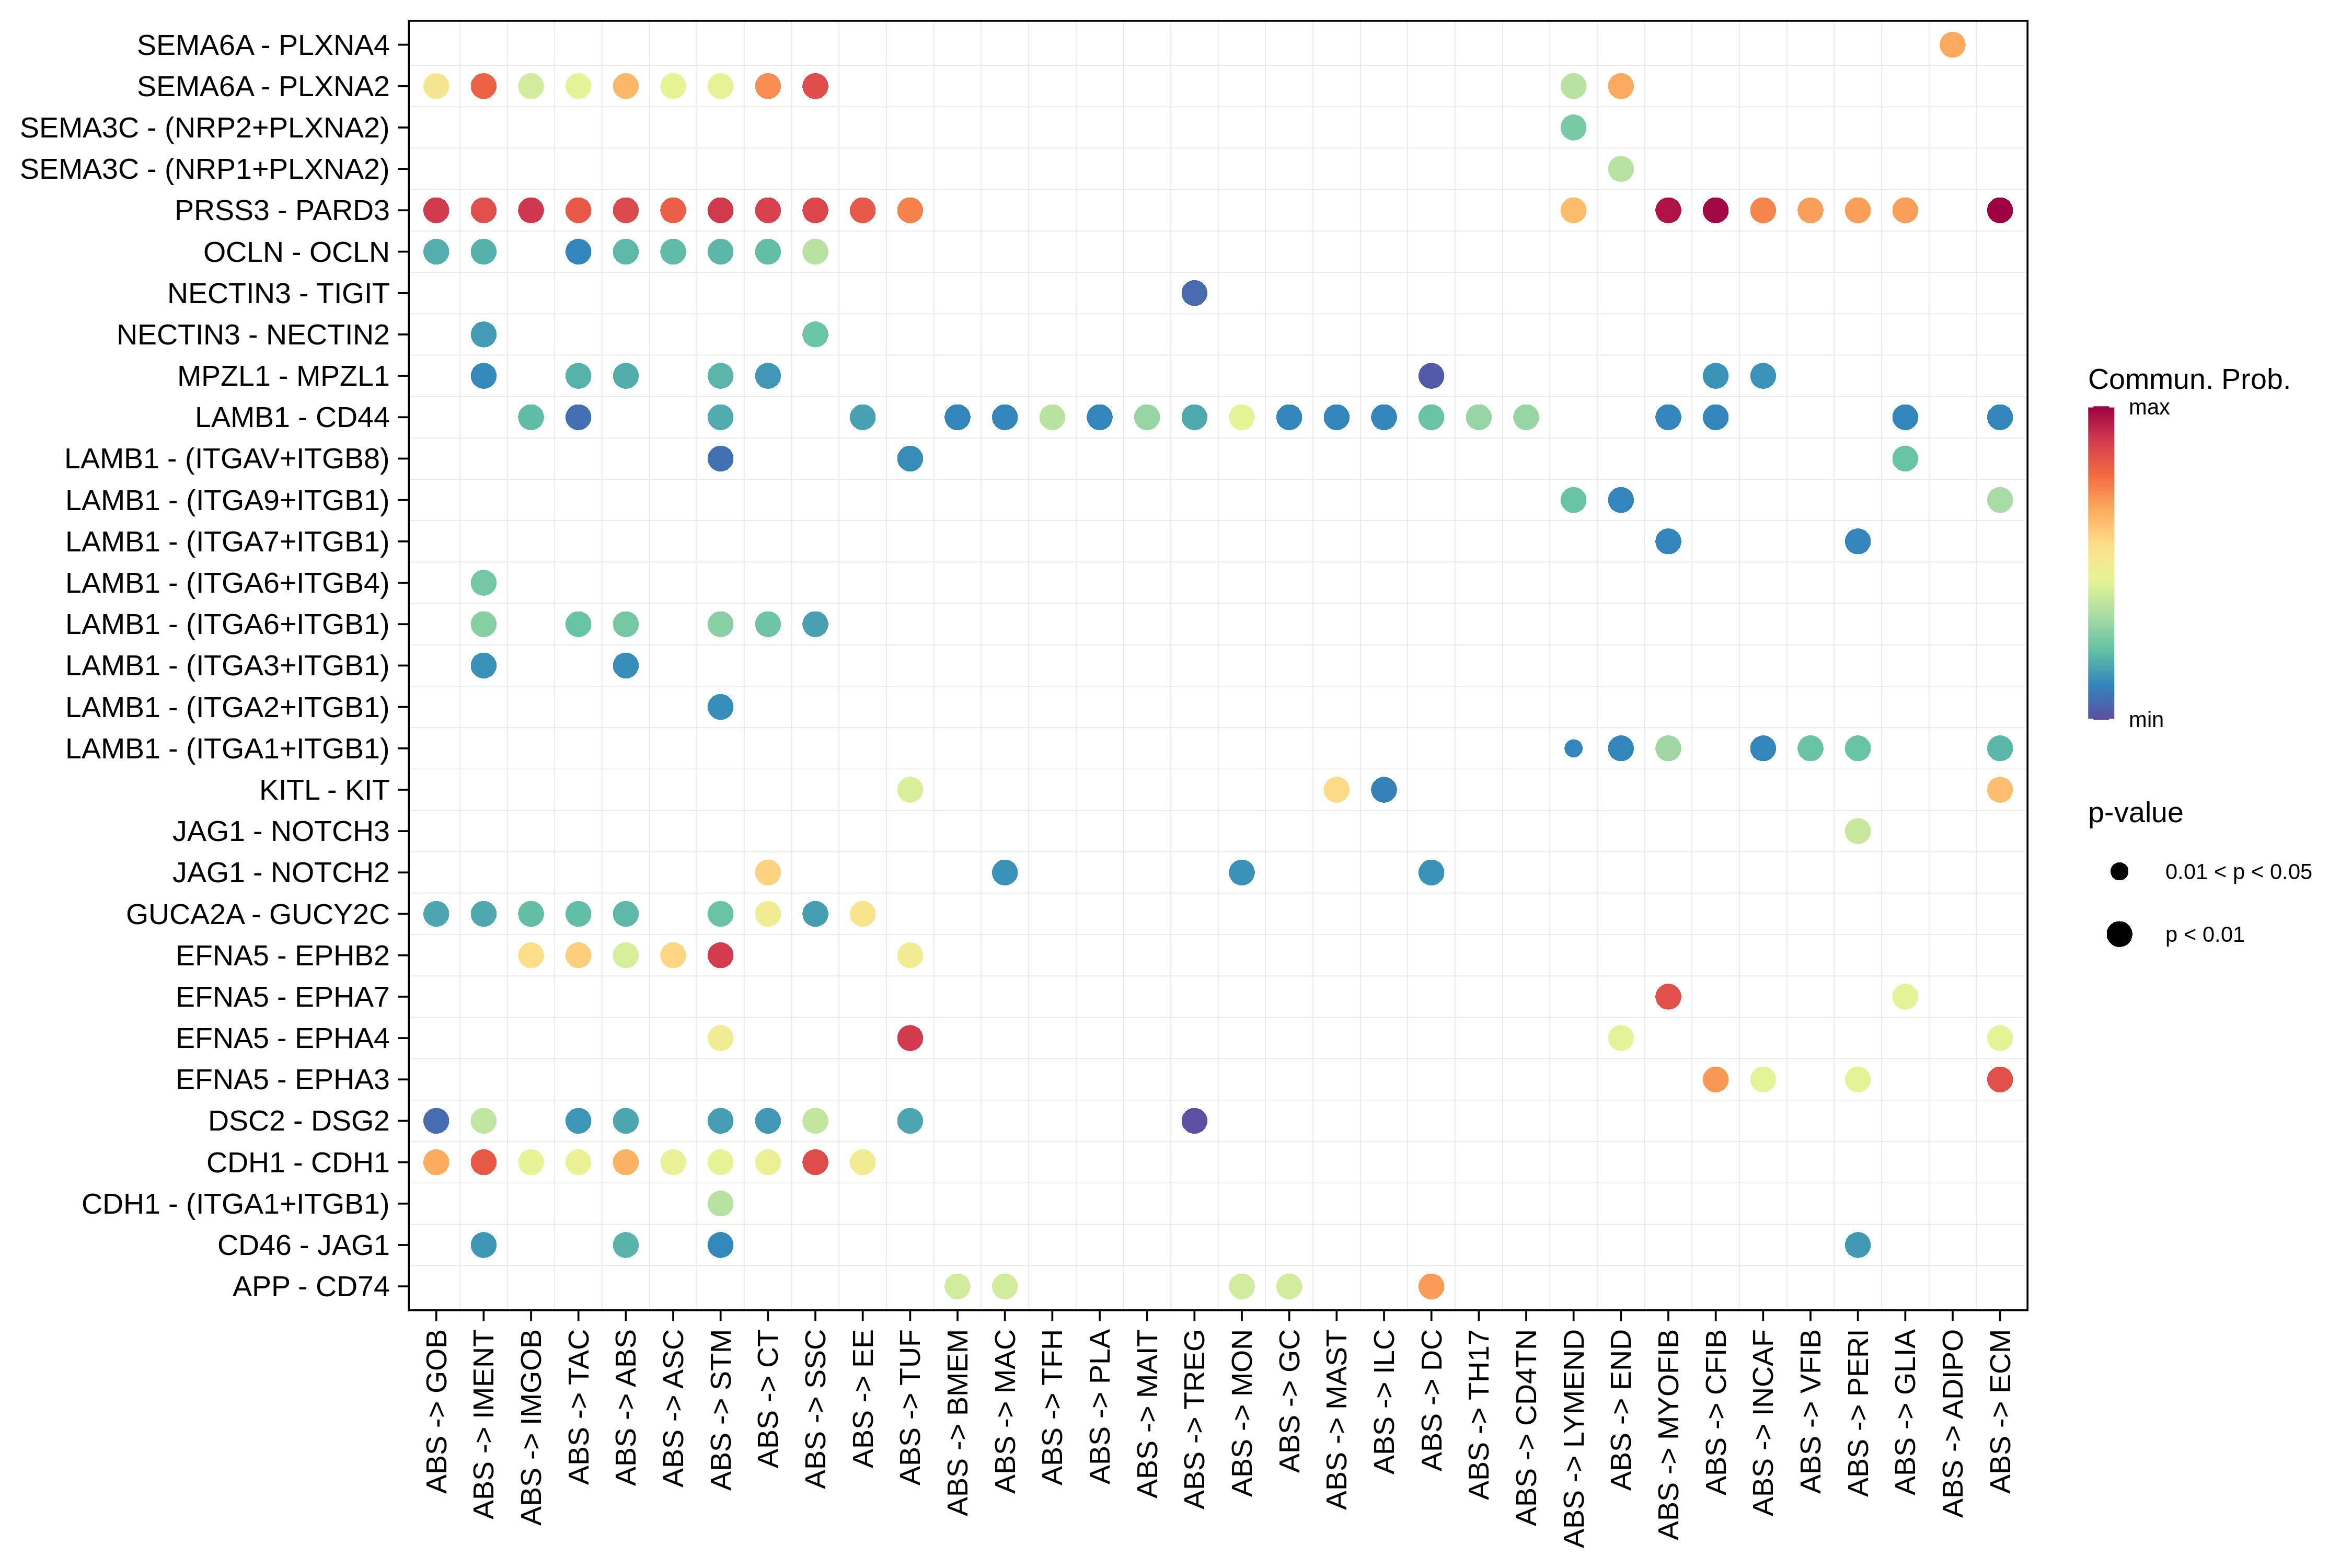 | 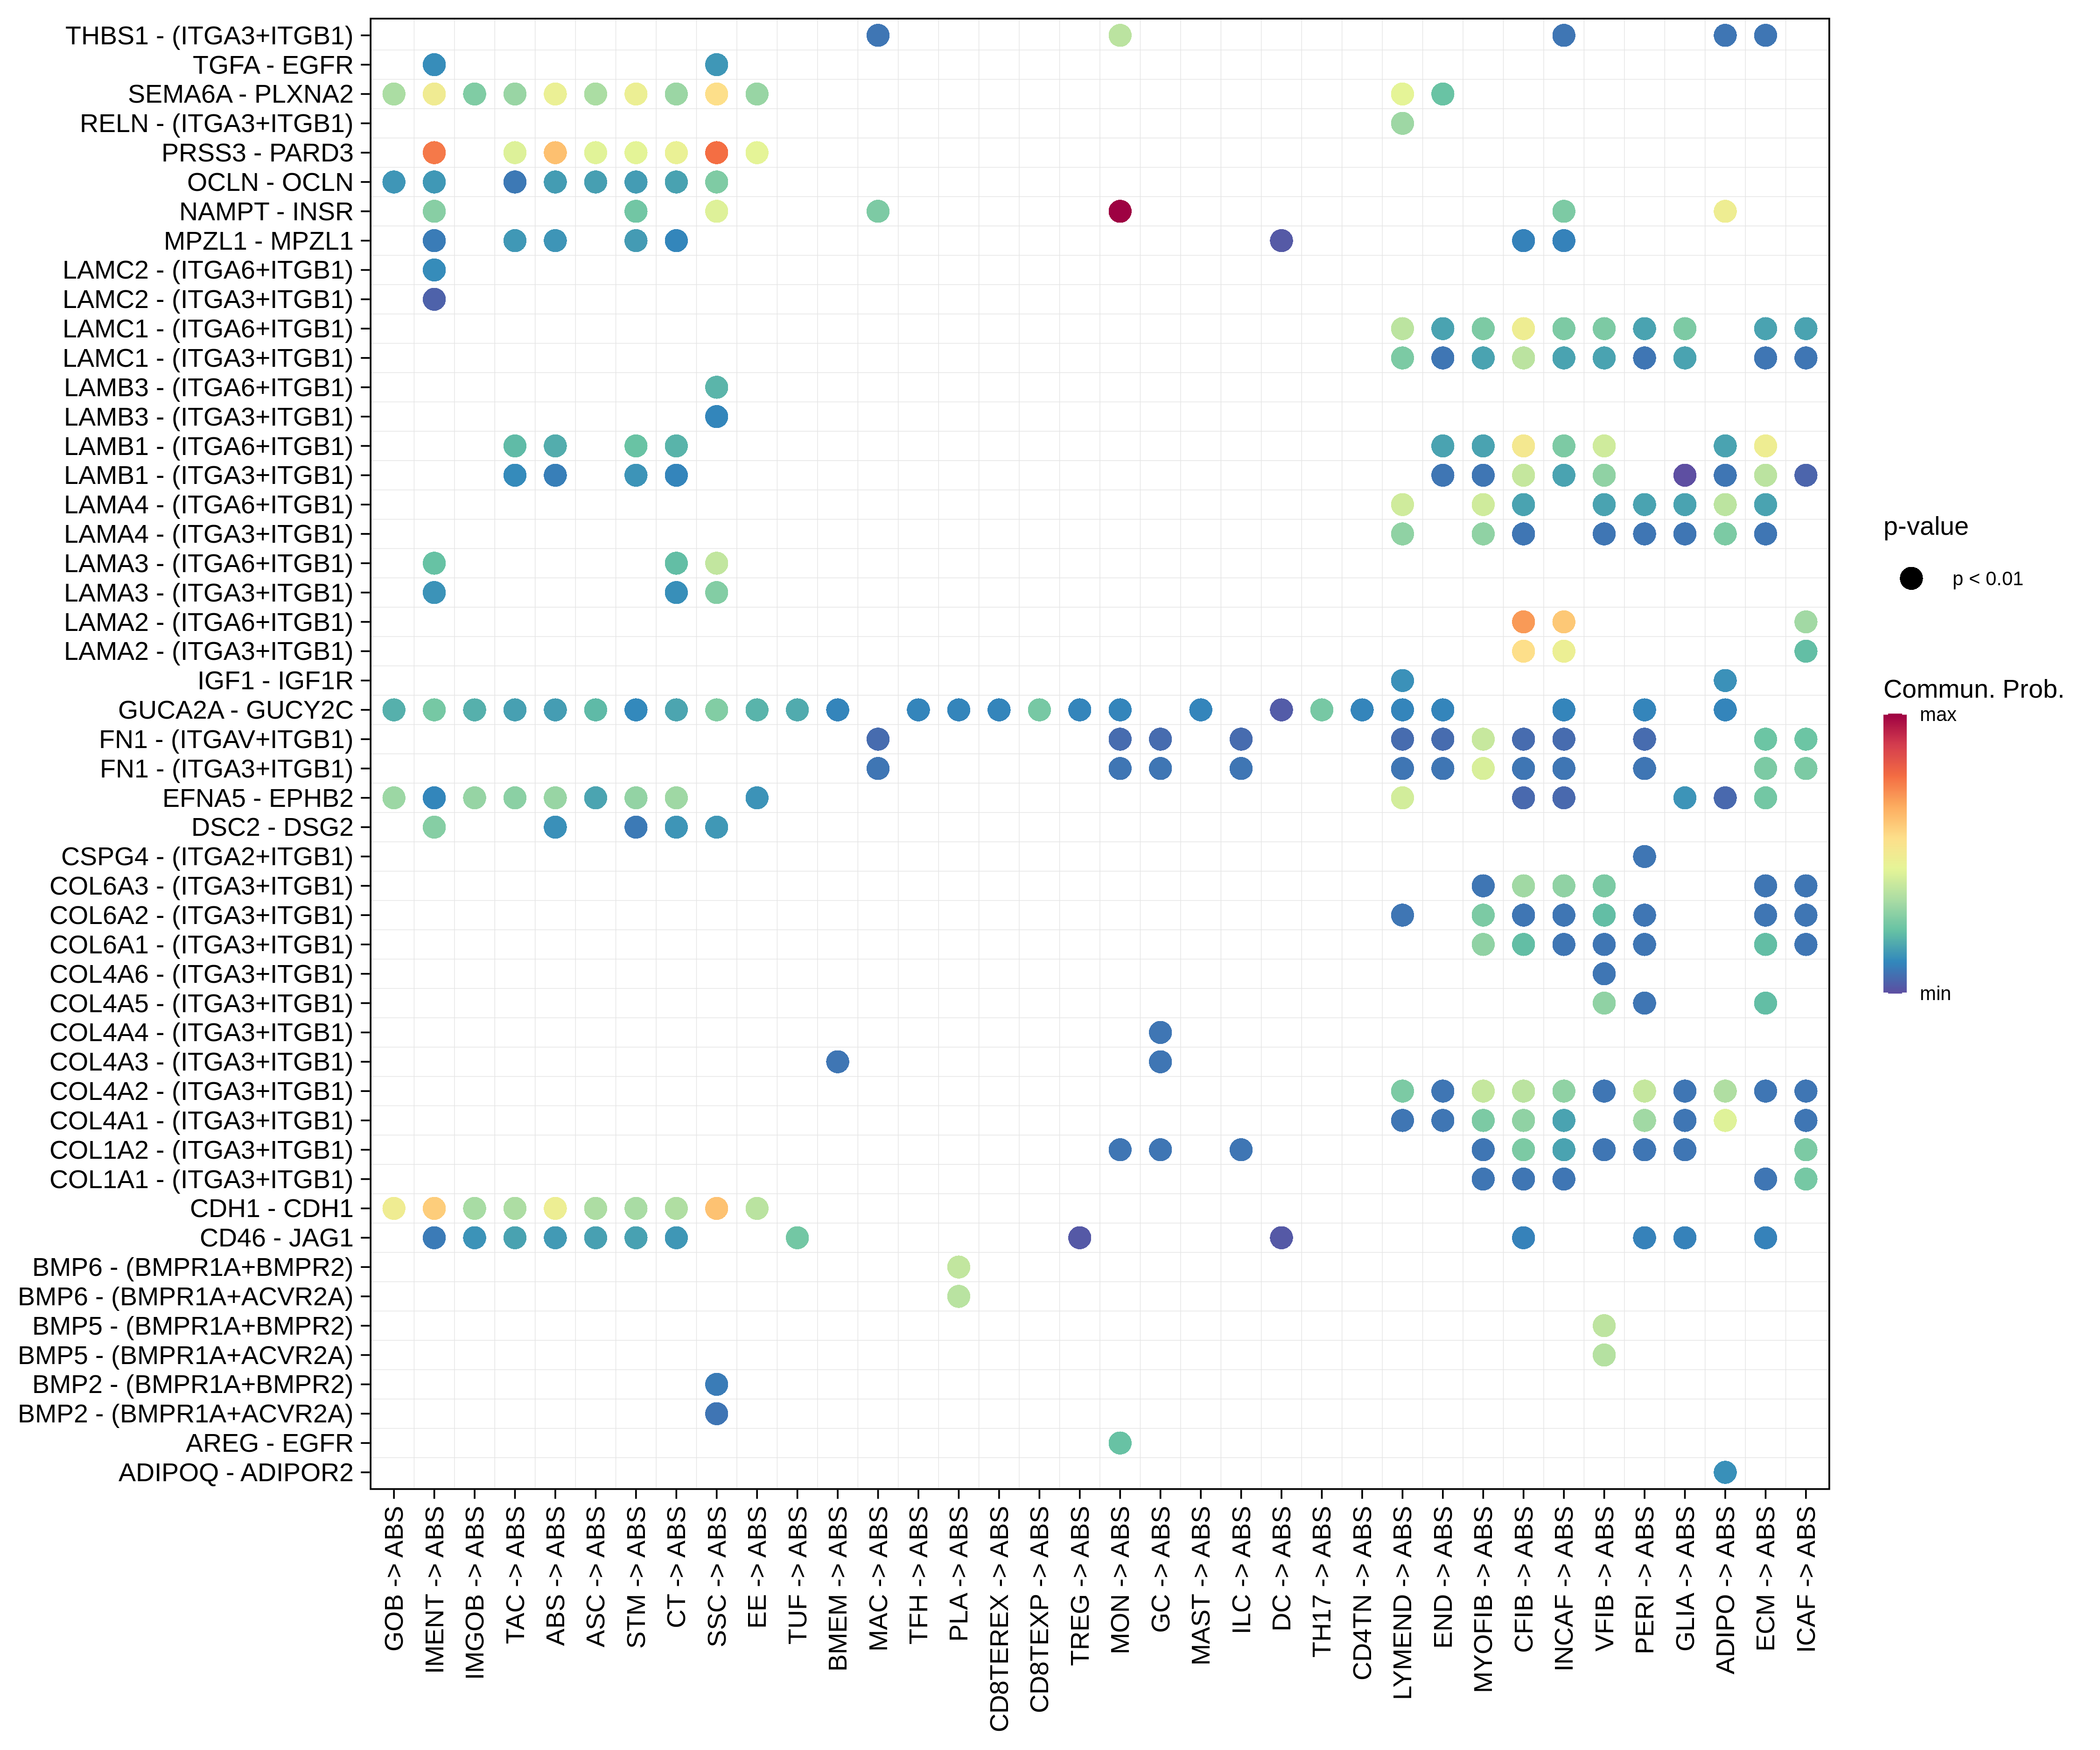 |
| ADIPO | 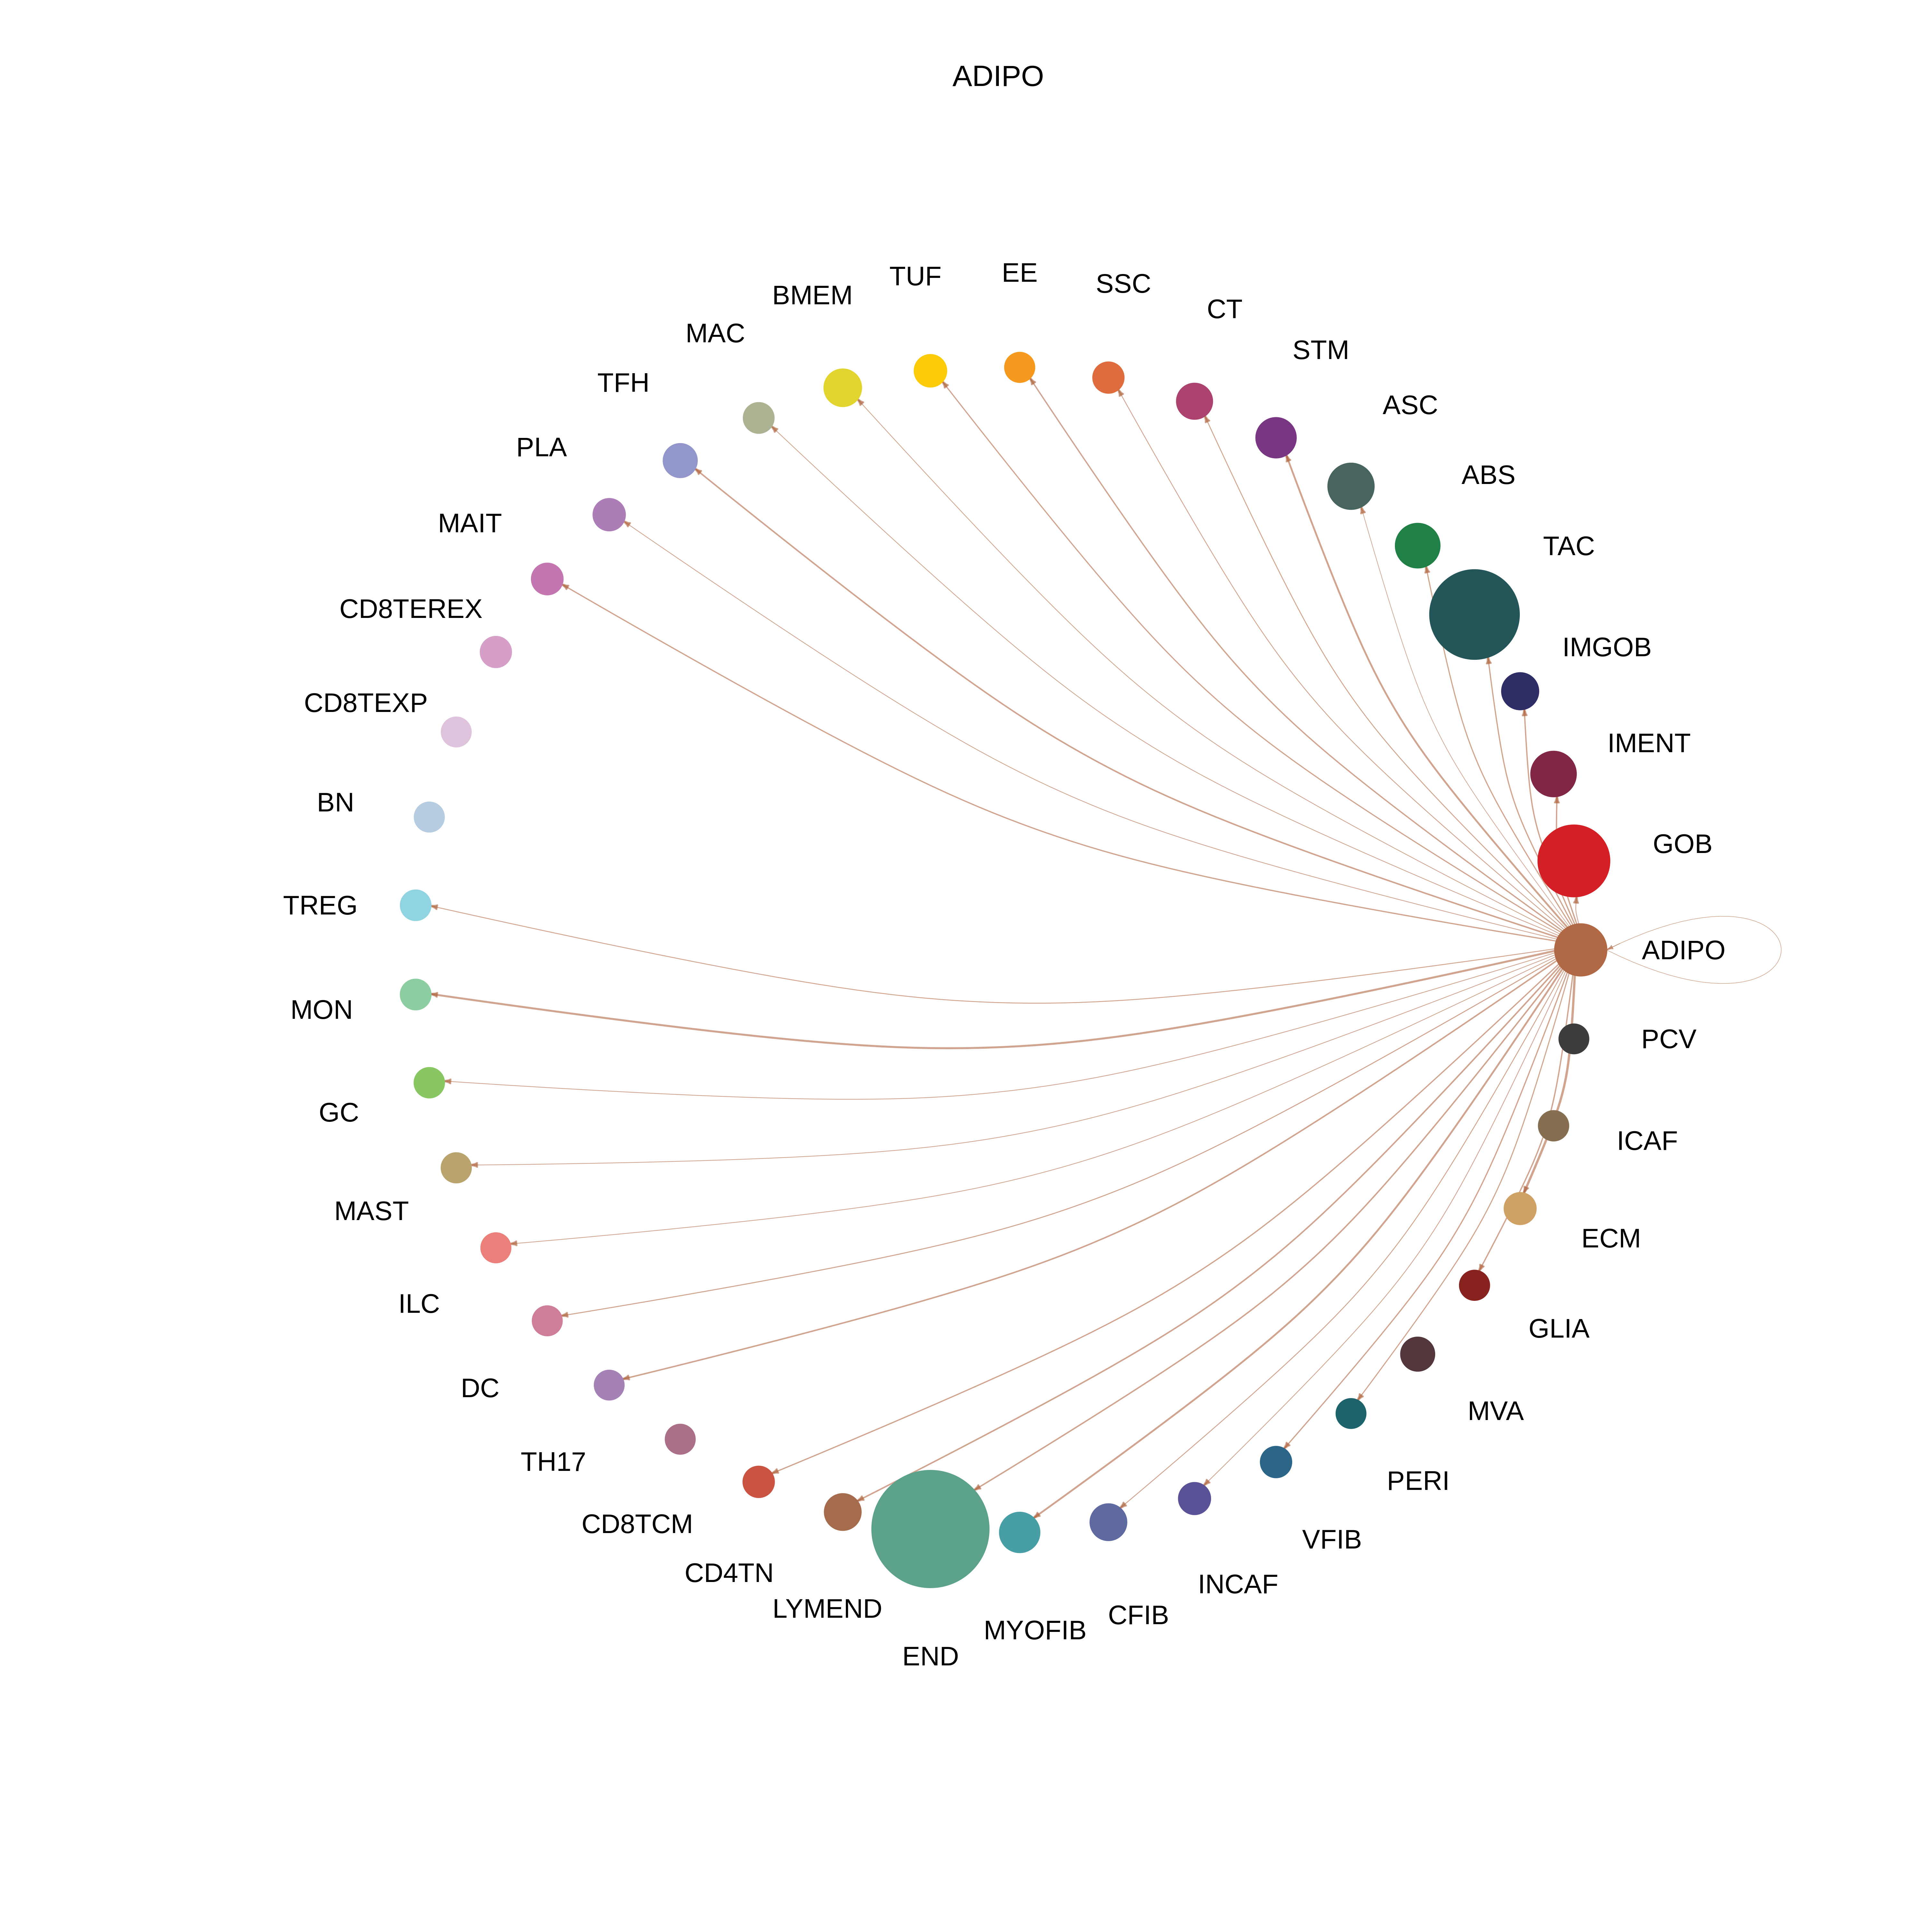 | 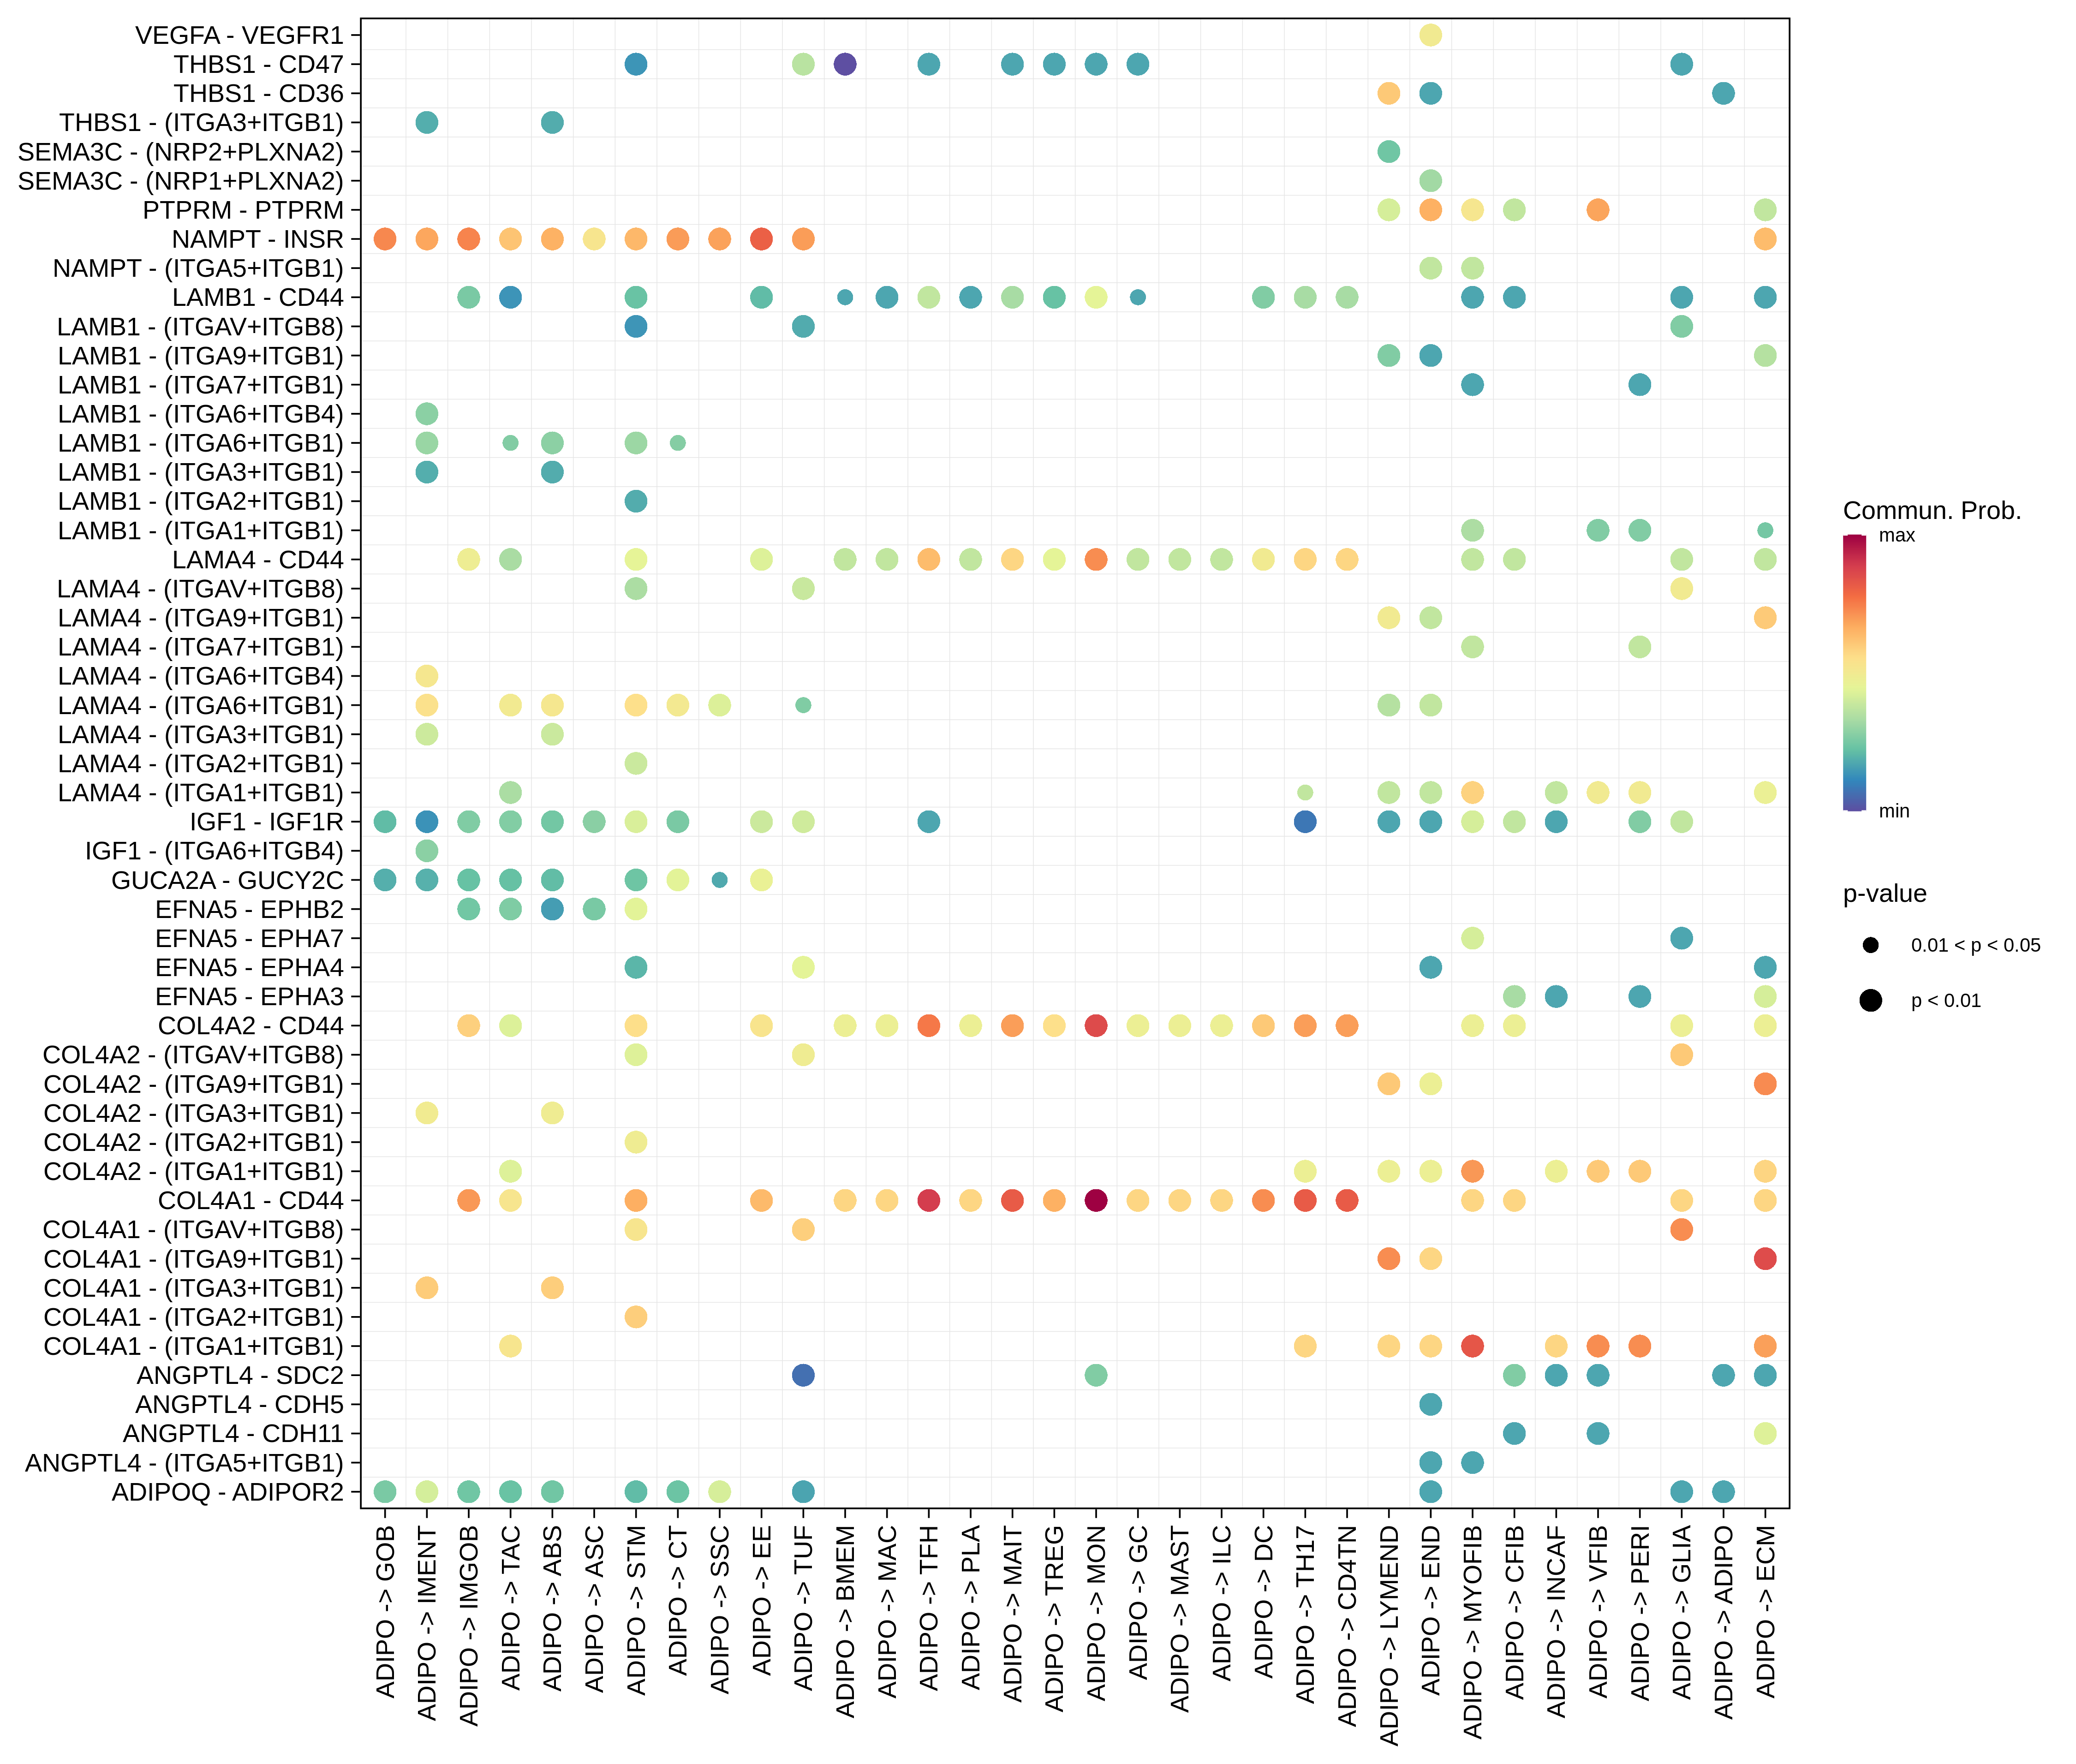 | 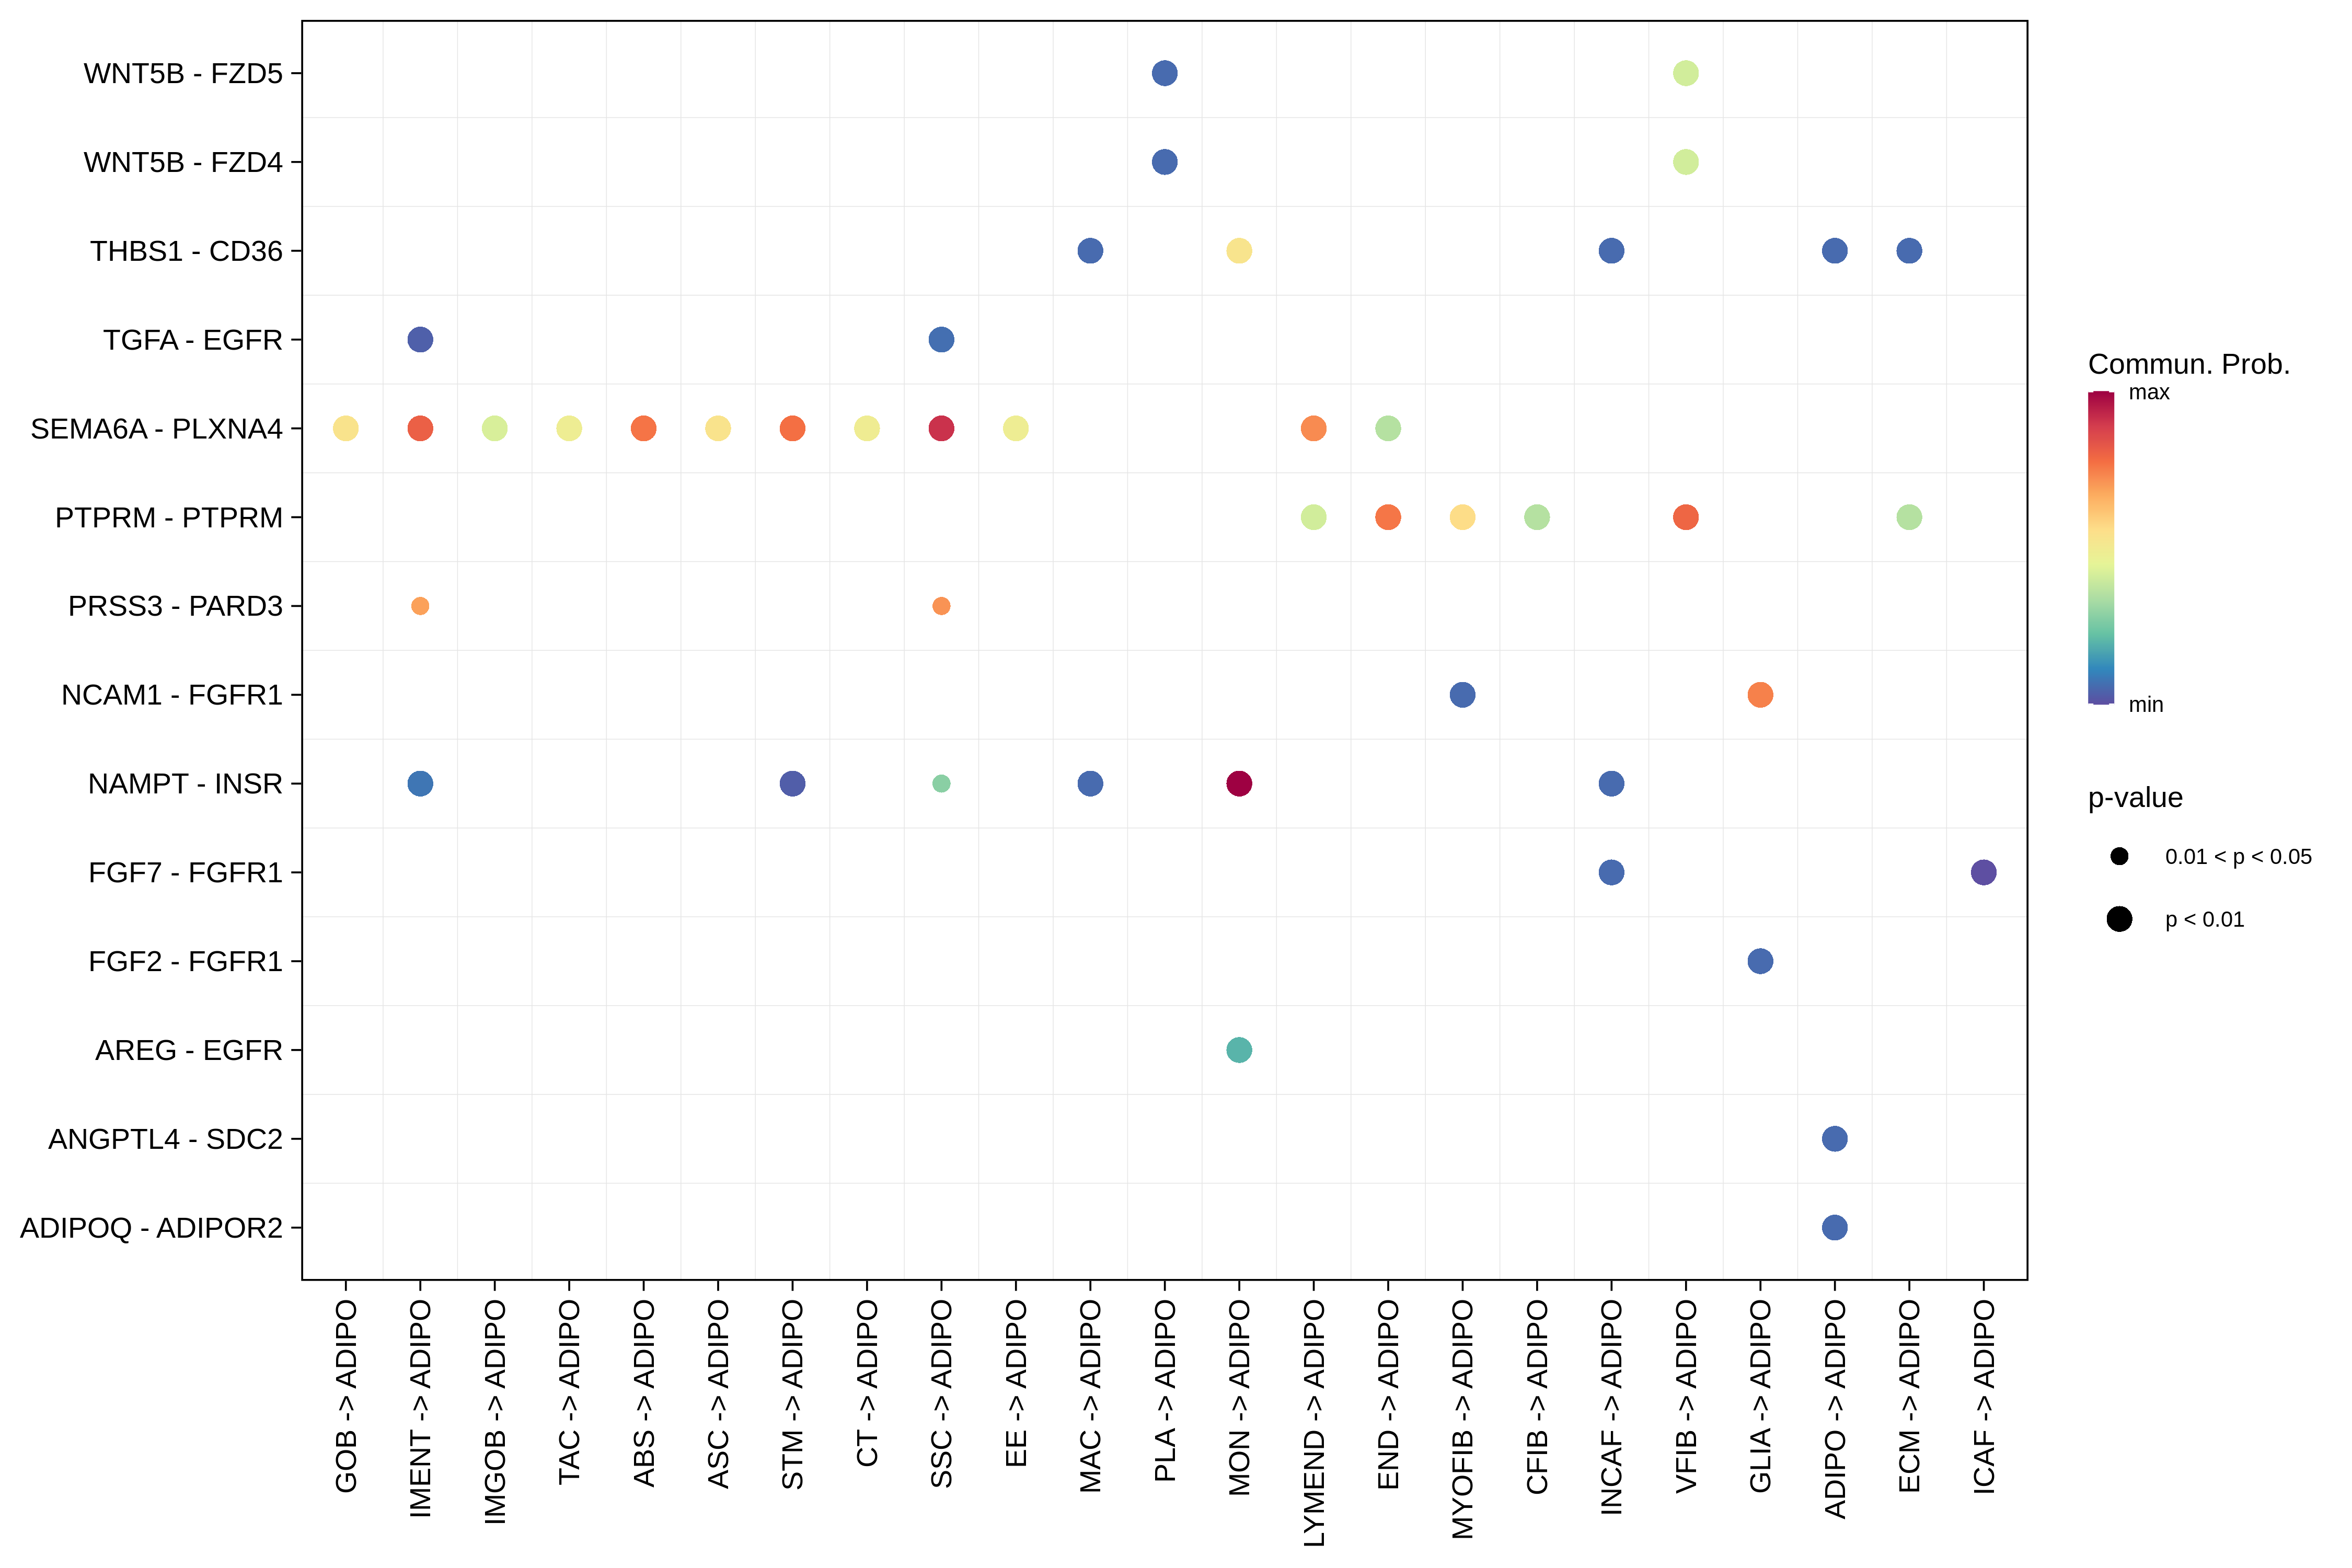 |
| Page: 1 2 3 4 5 6 7 8 9 10 11 12 13 14 15 16 17 18 19 |
| Disease State | Cell Type | Circle | Source | Target |
| ADJ | ABS | 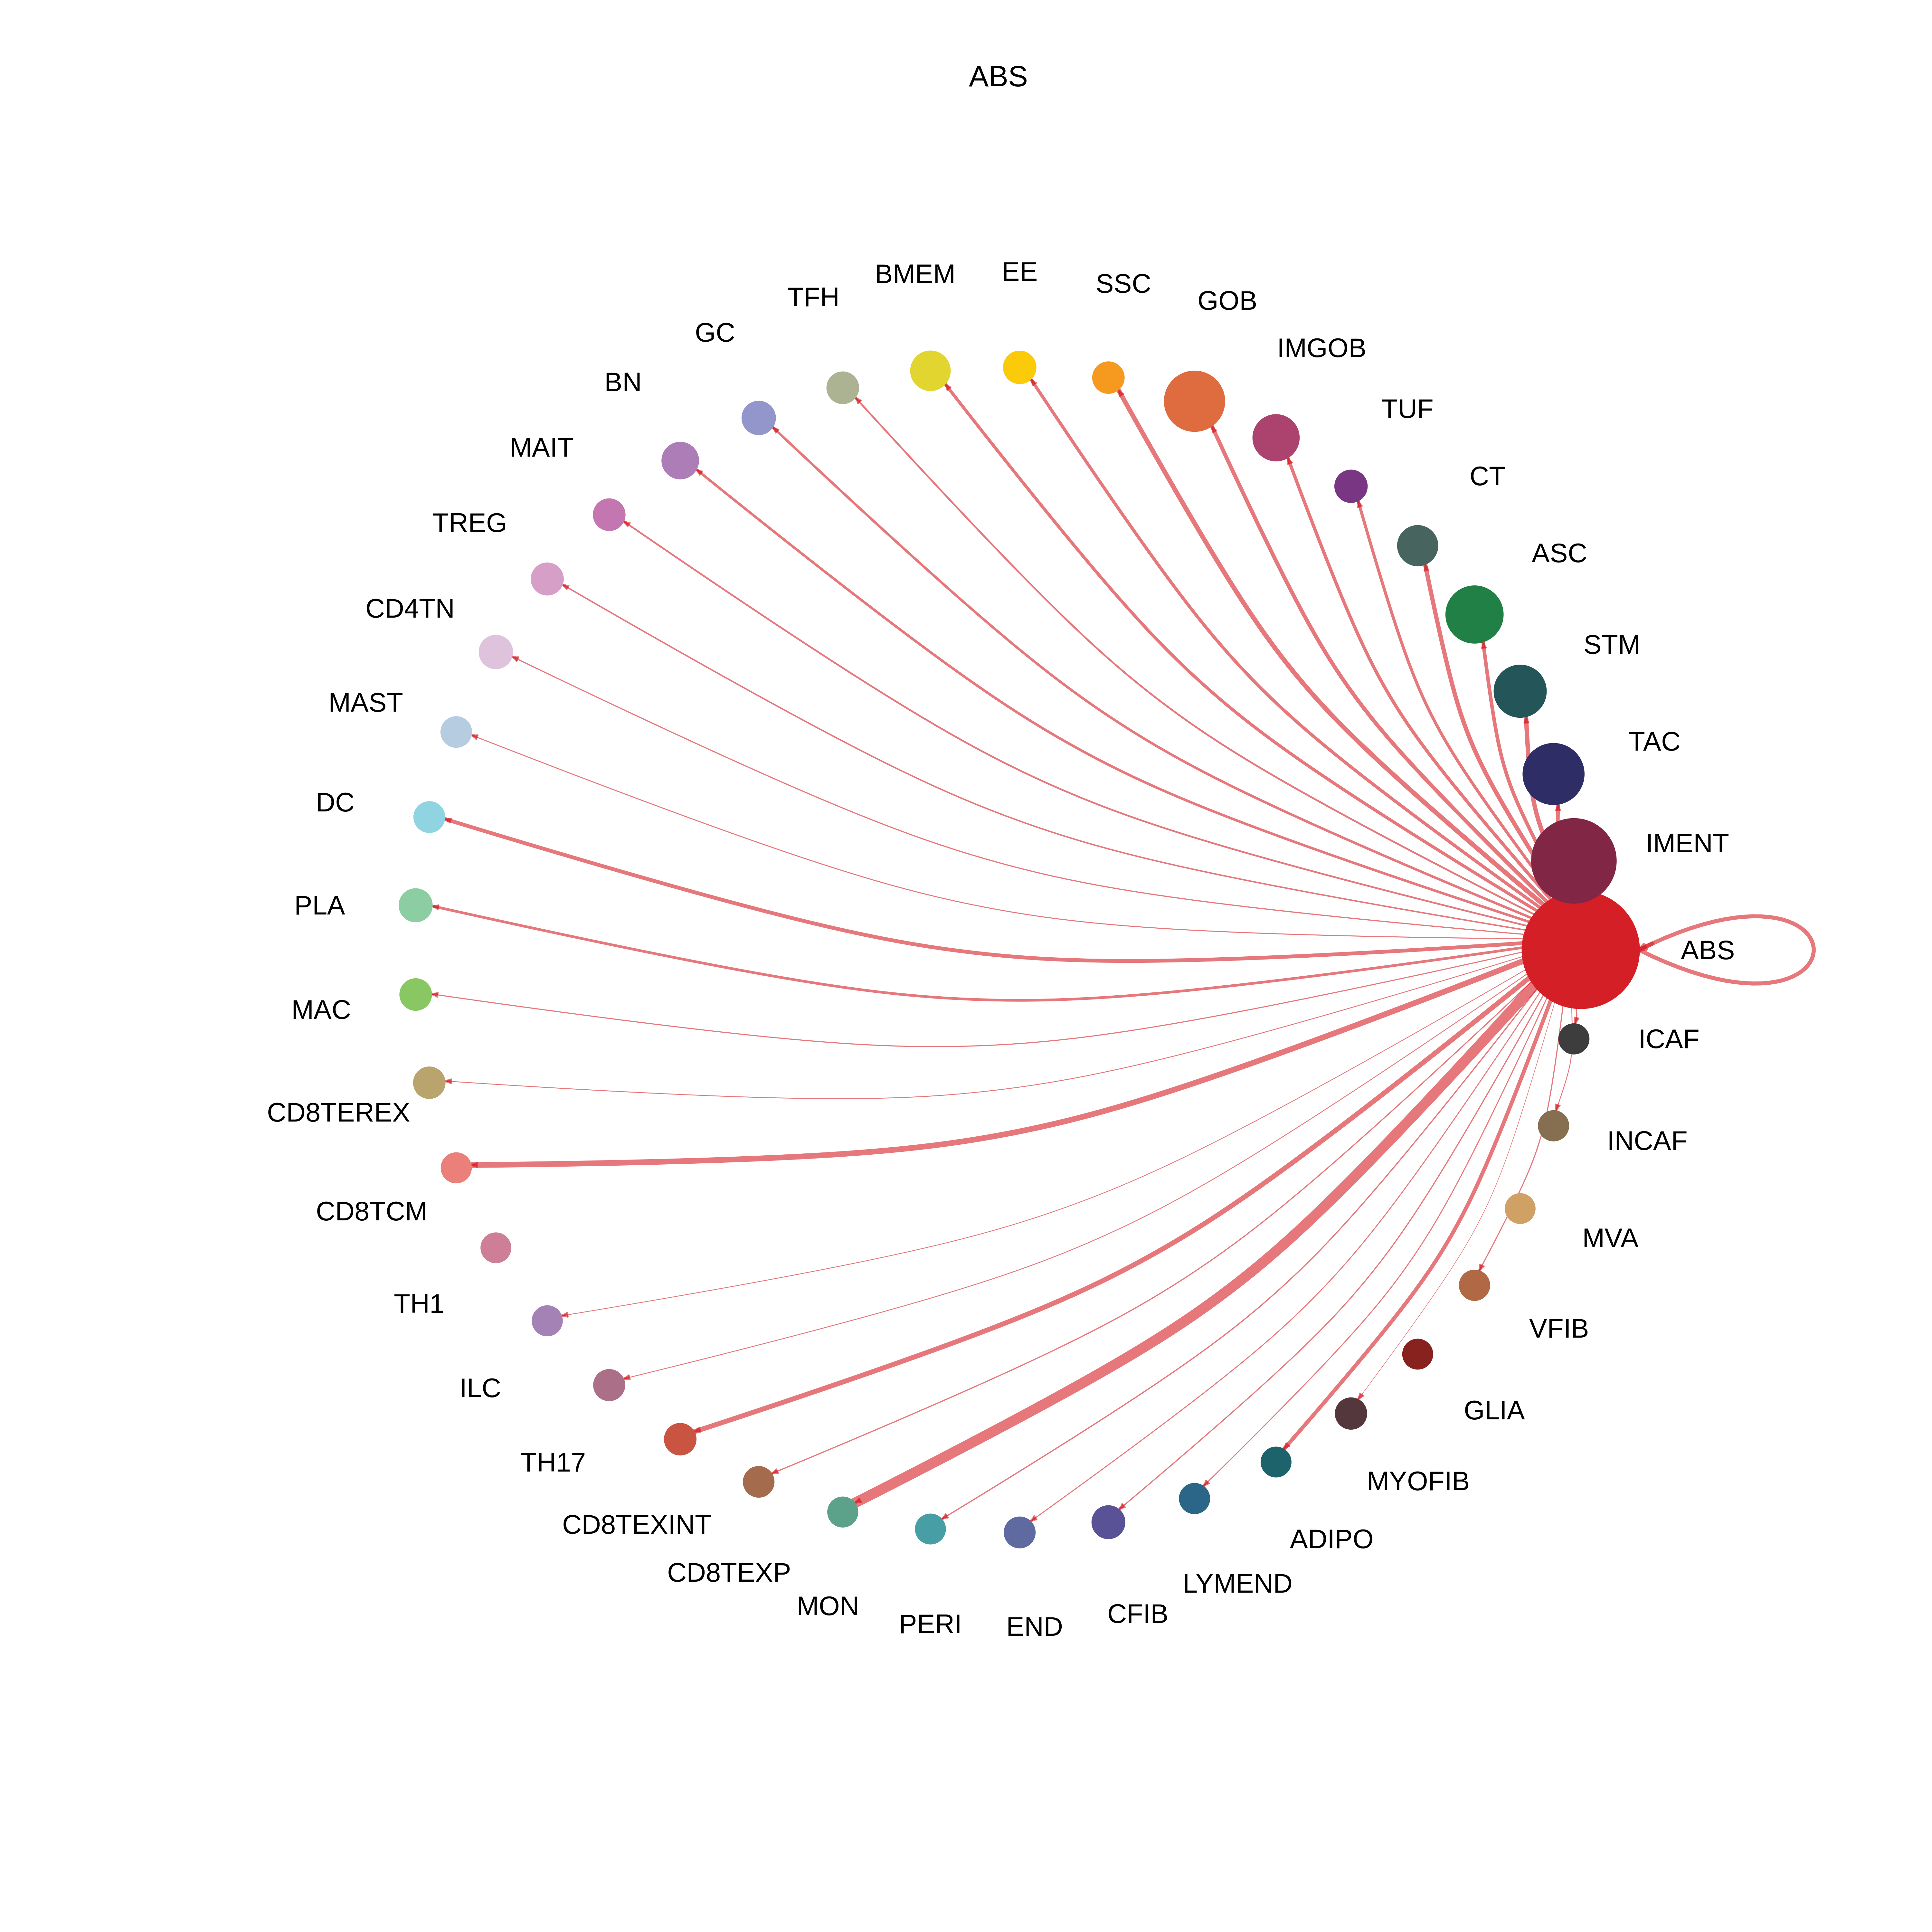 | 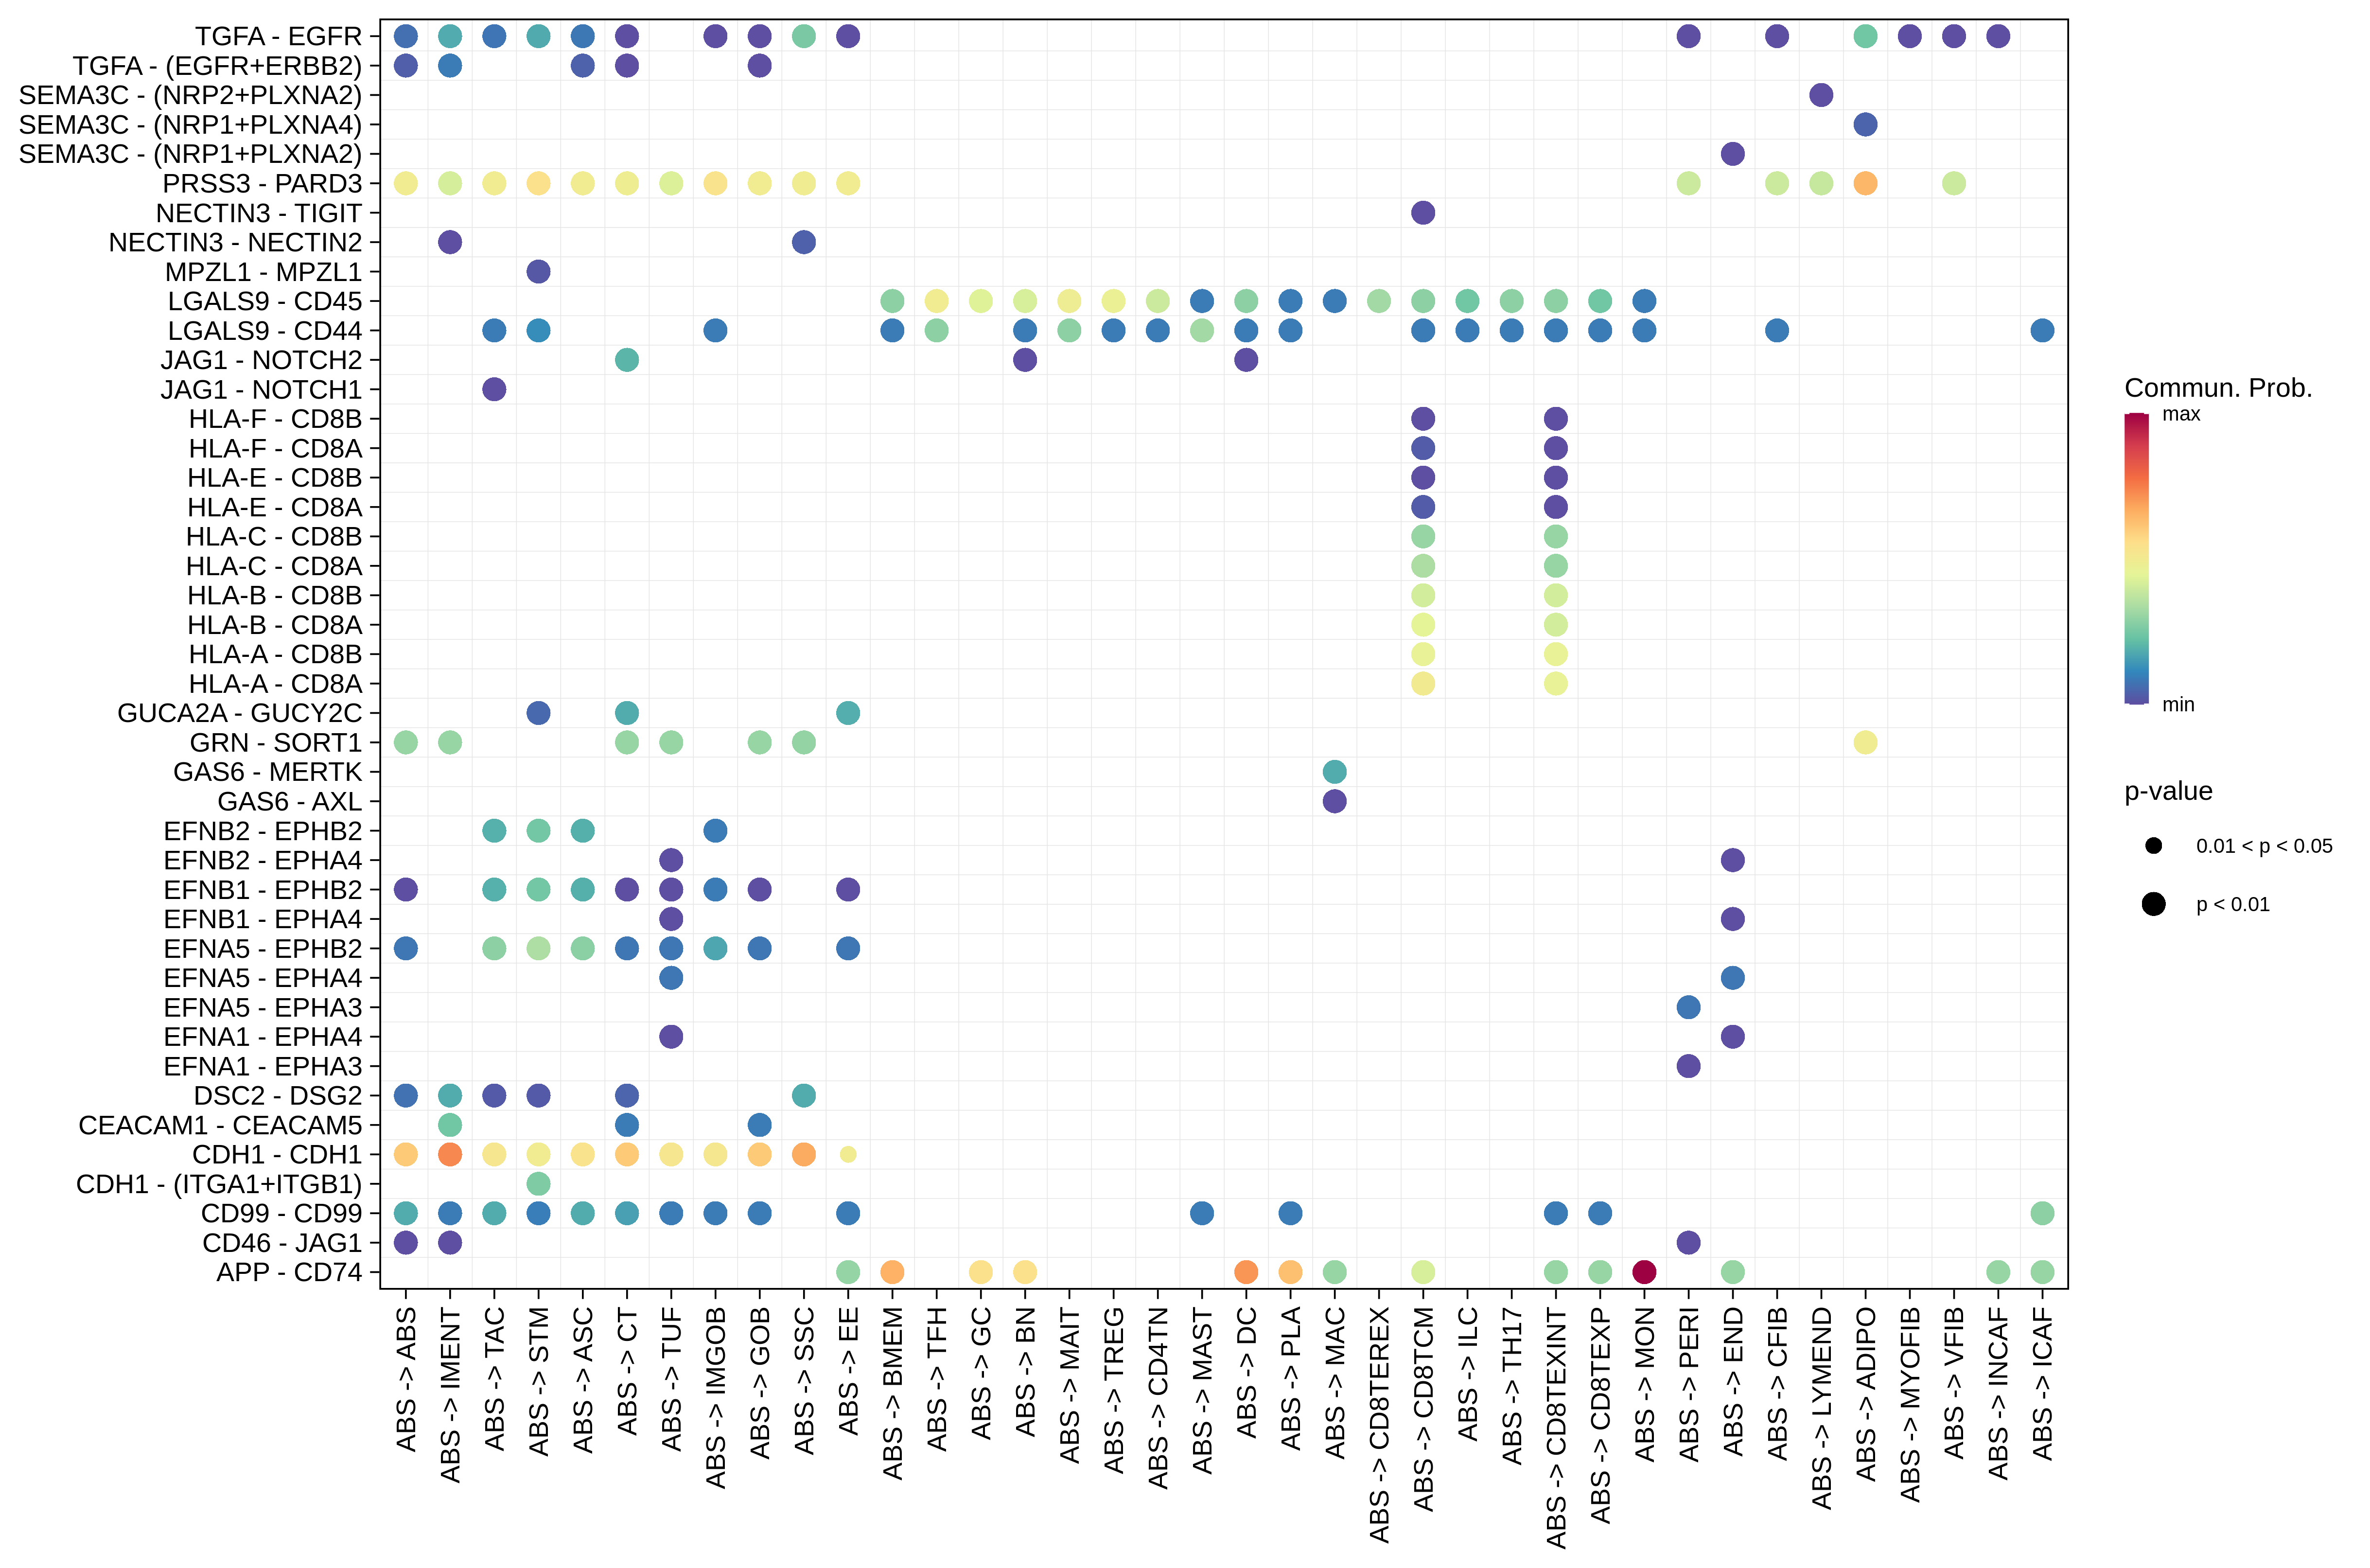 | 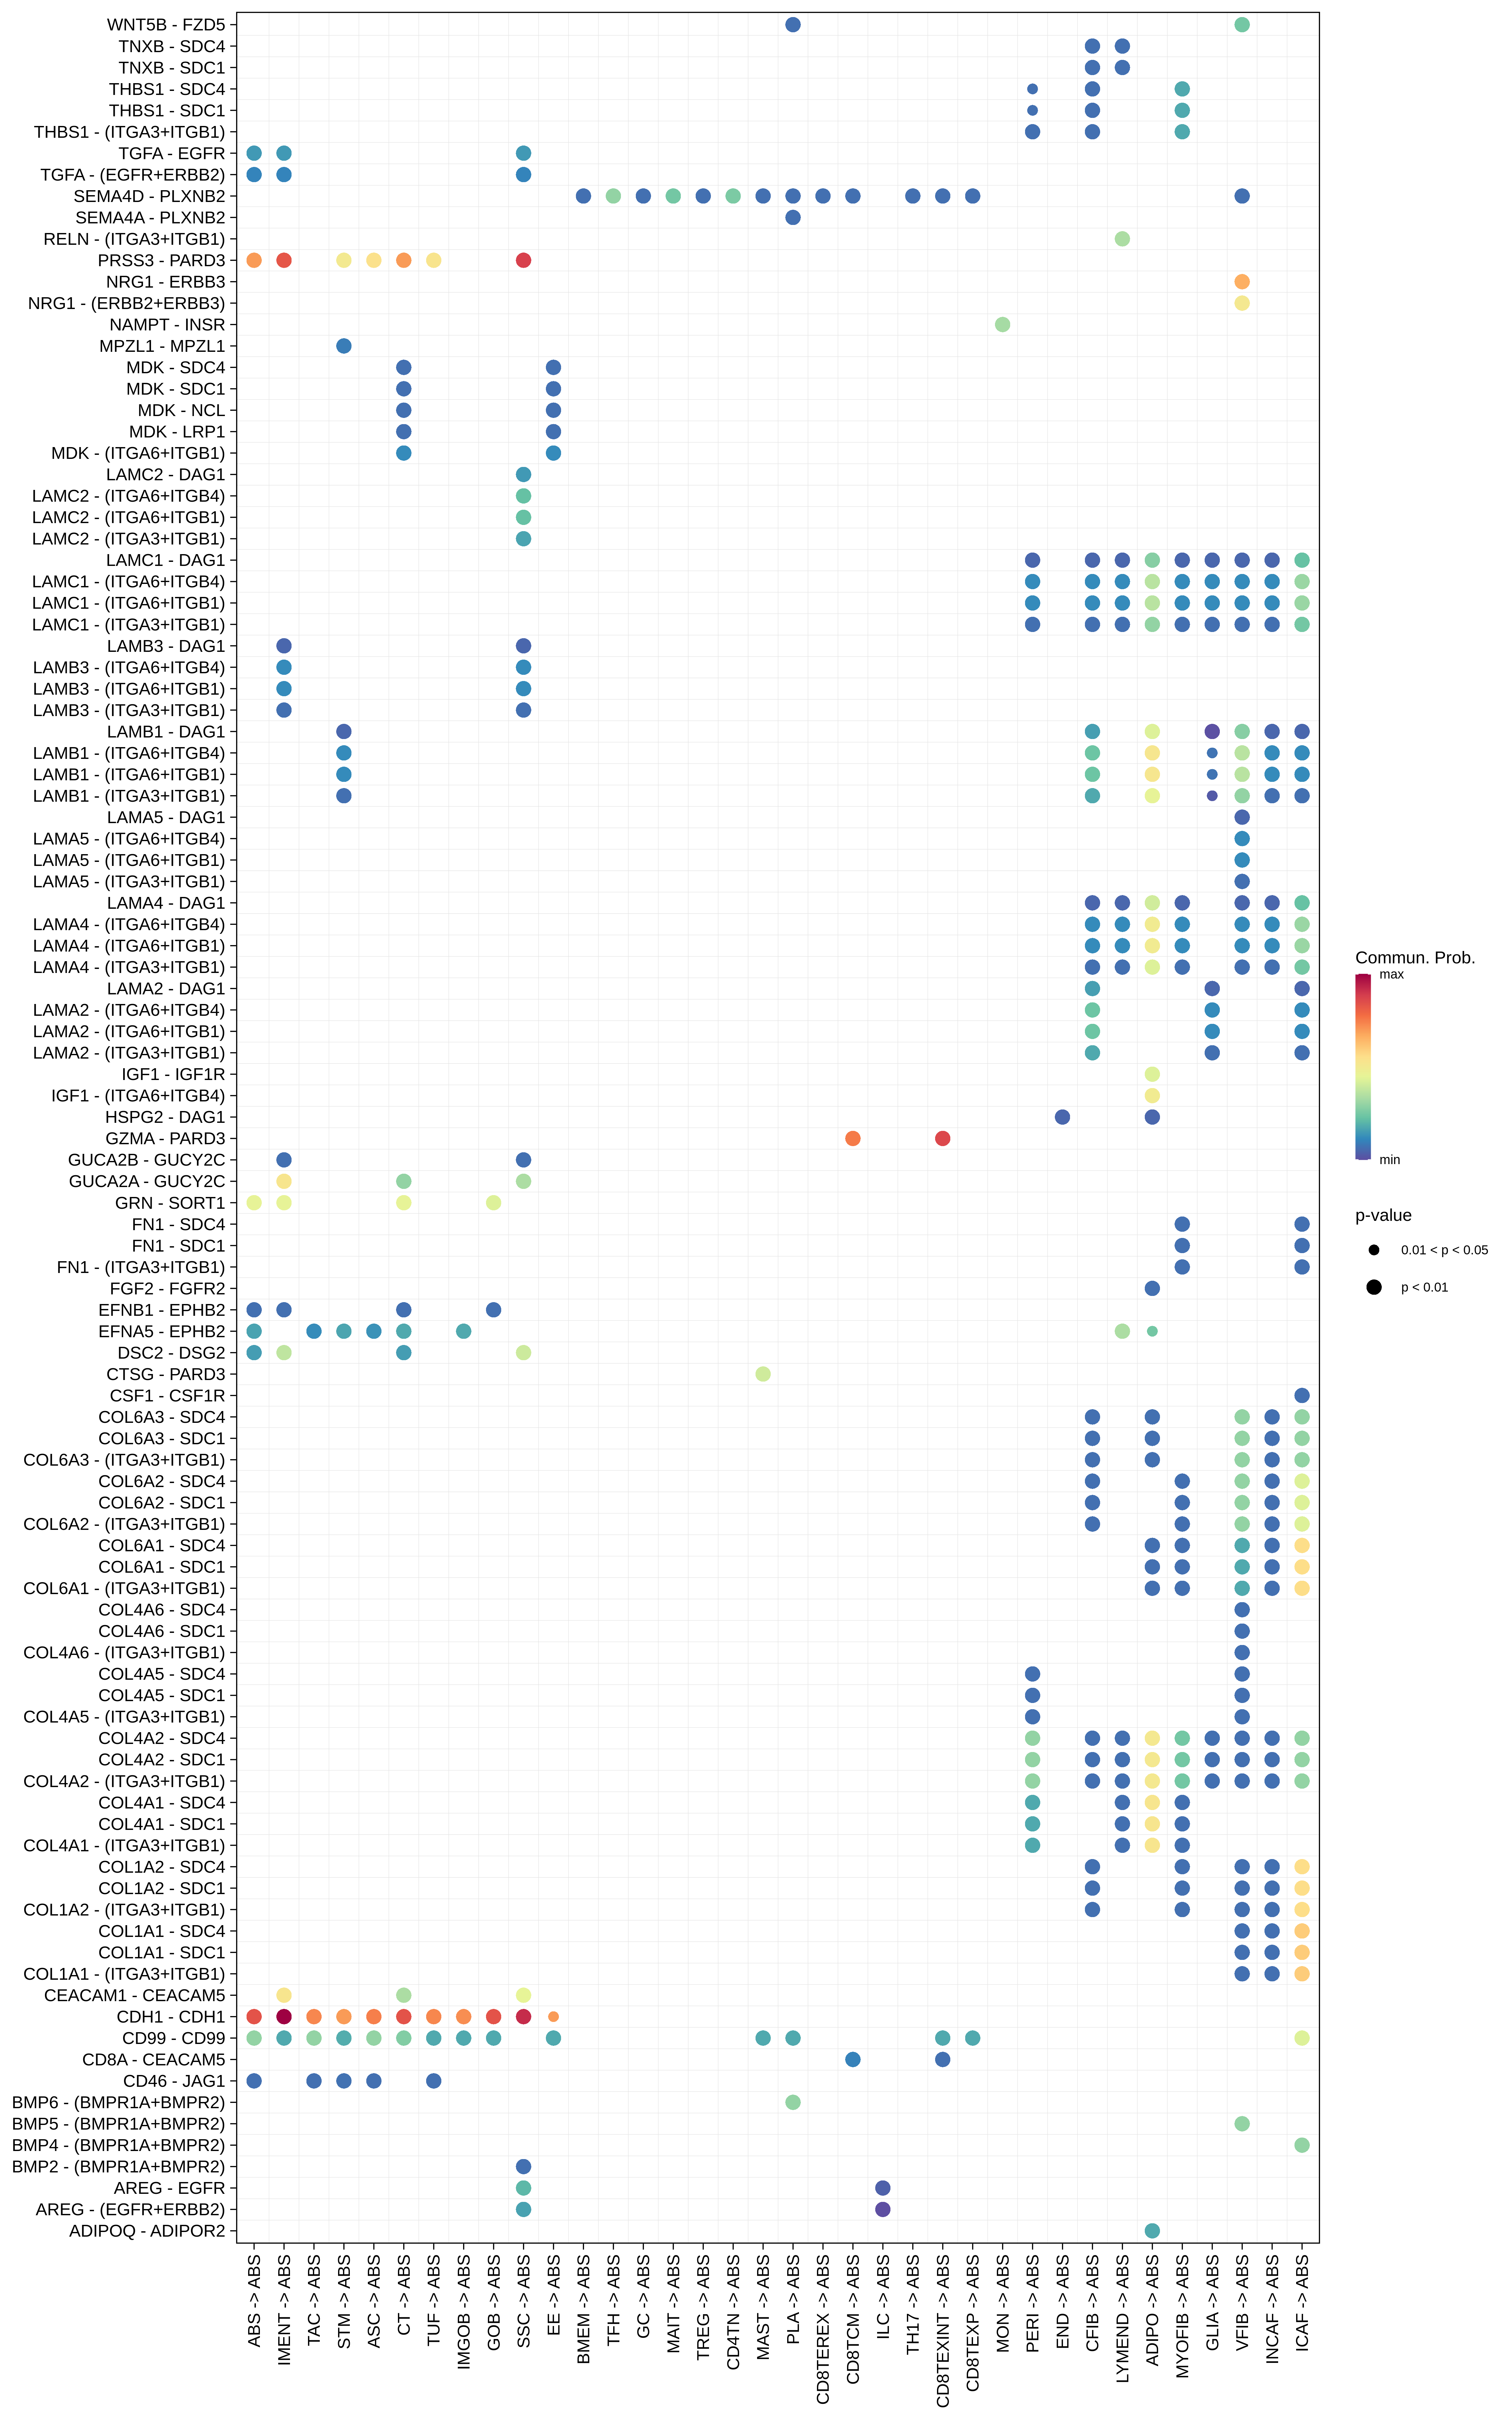 |
| ADIPO | 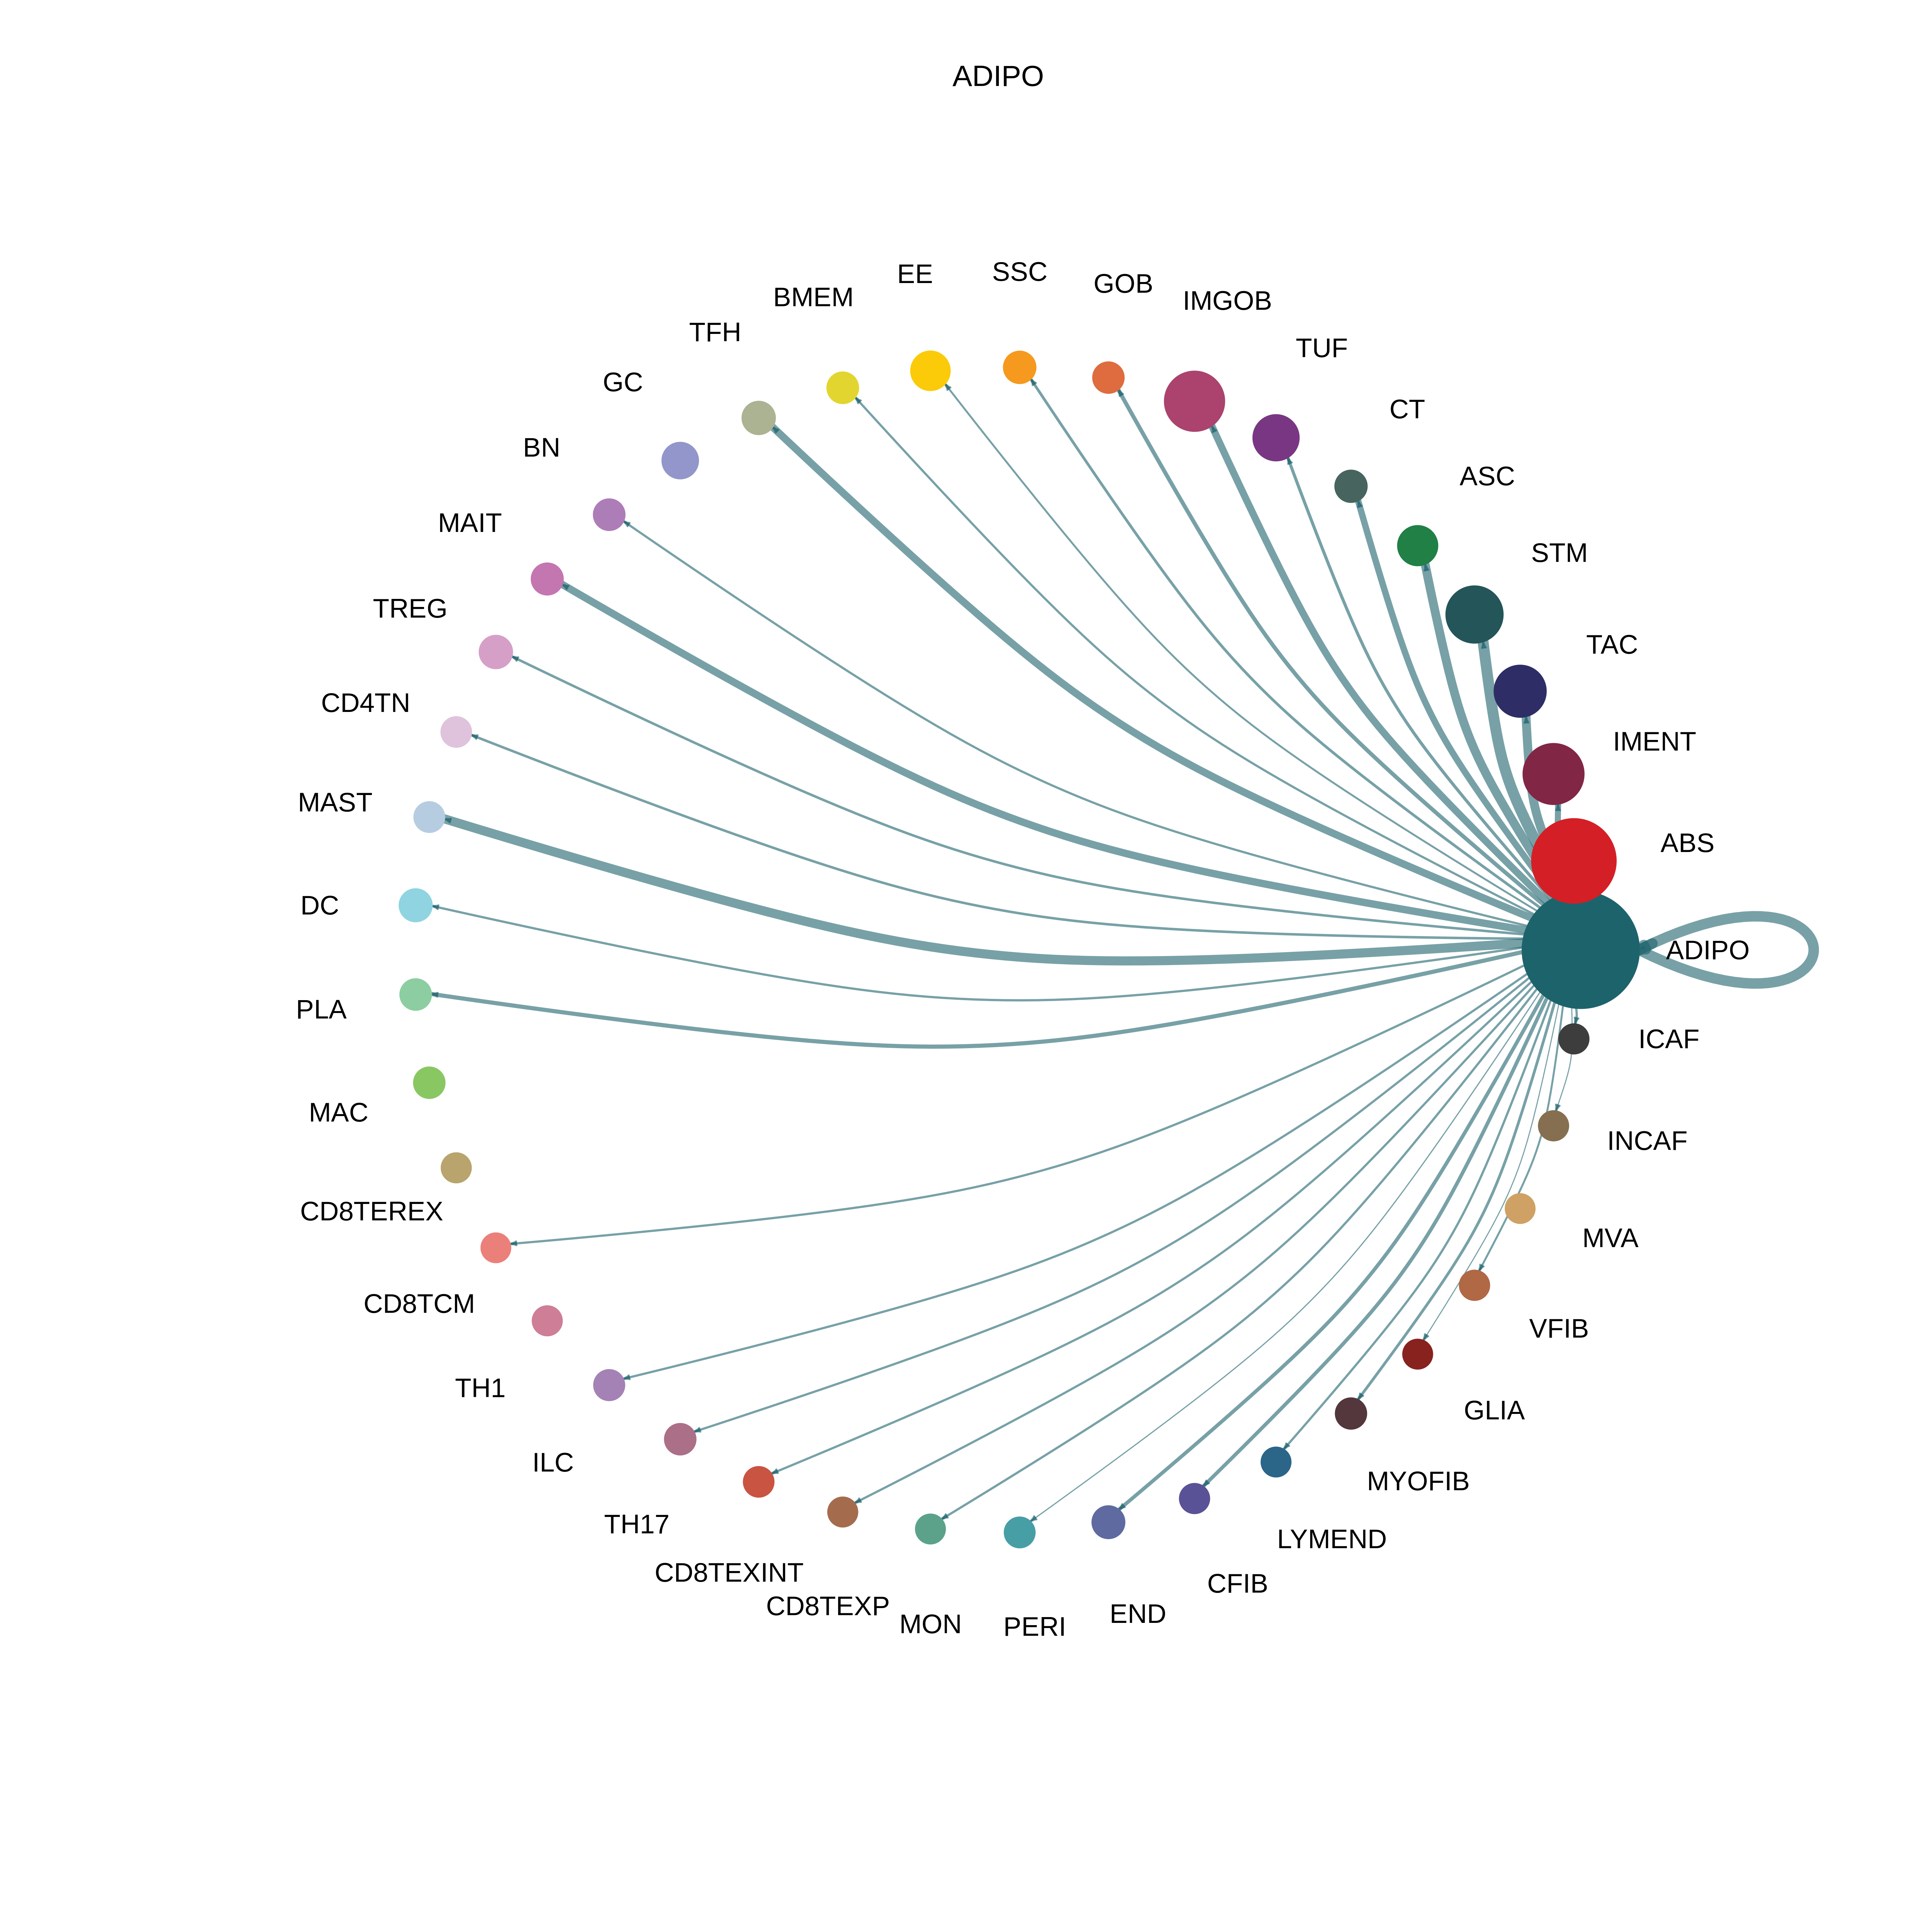 | 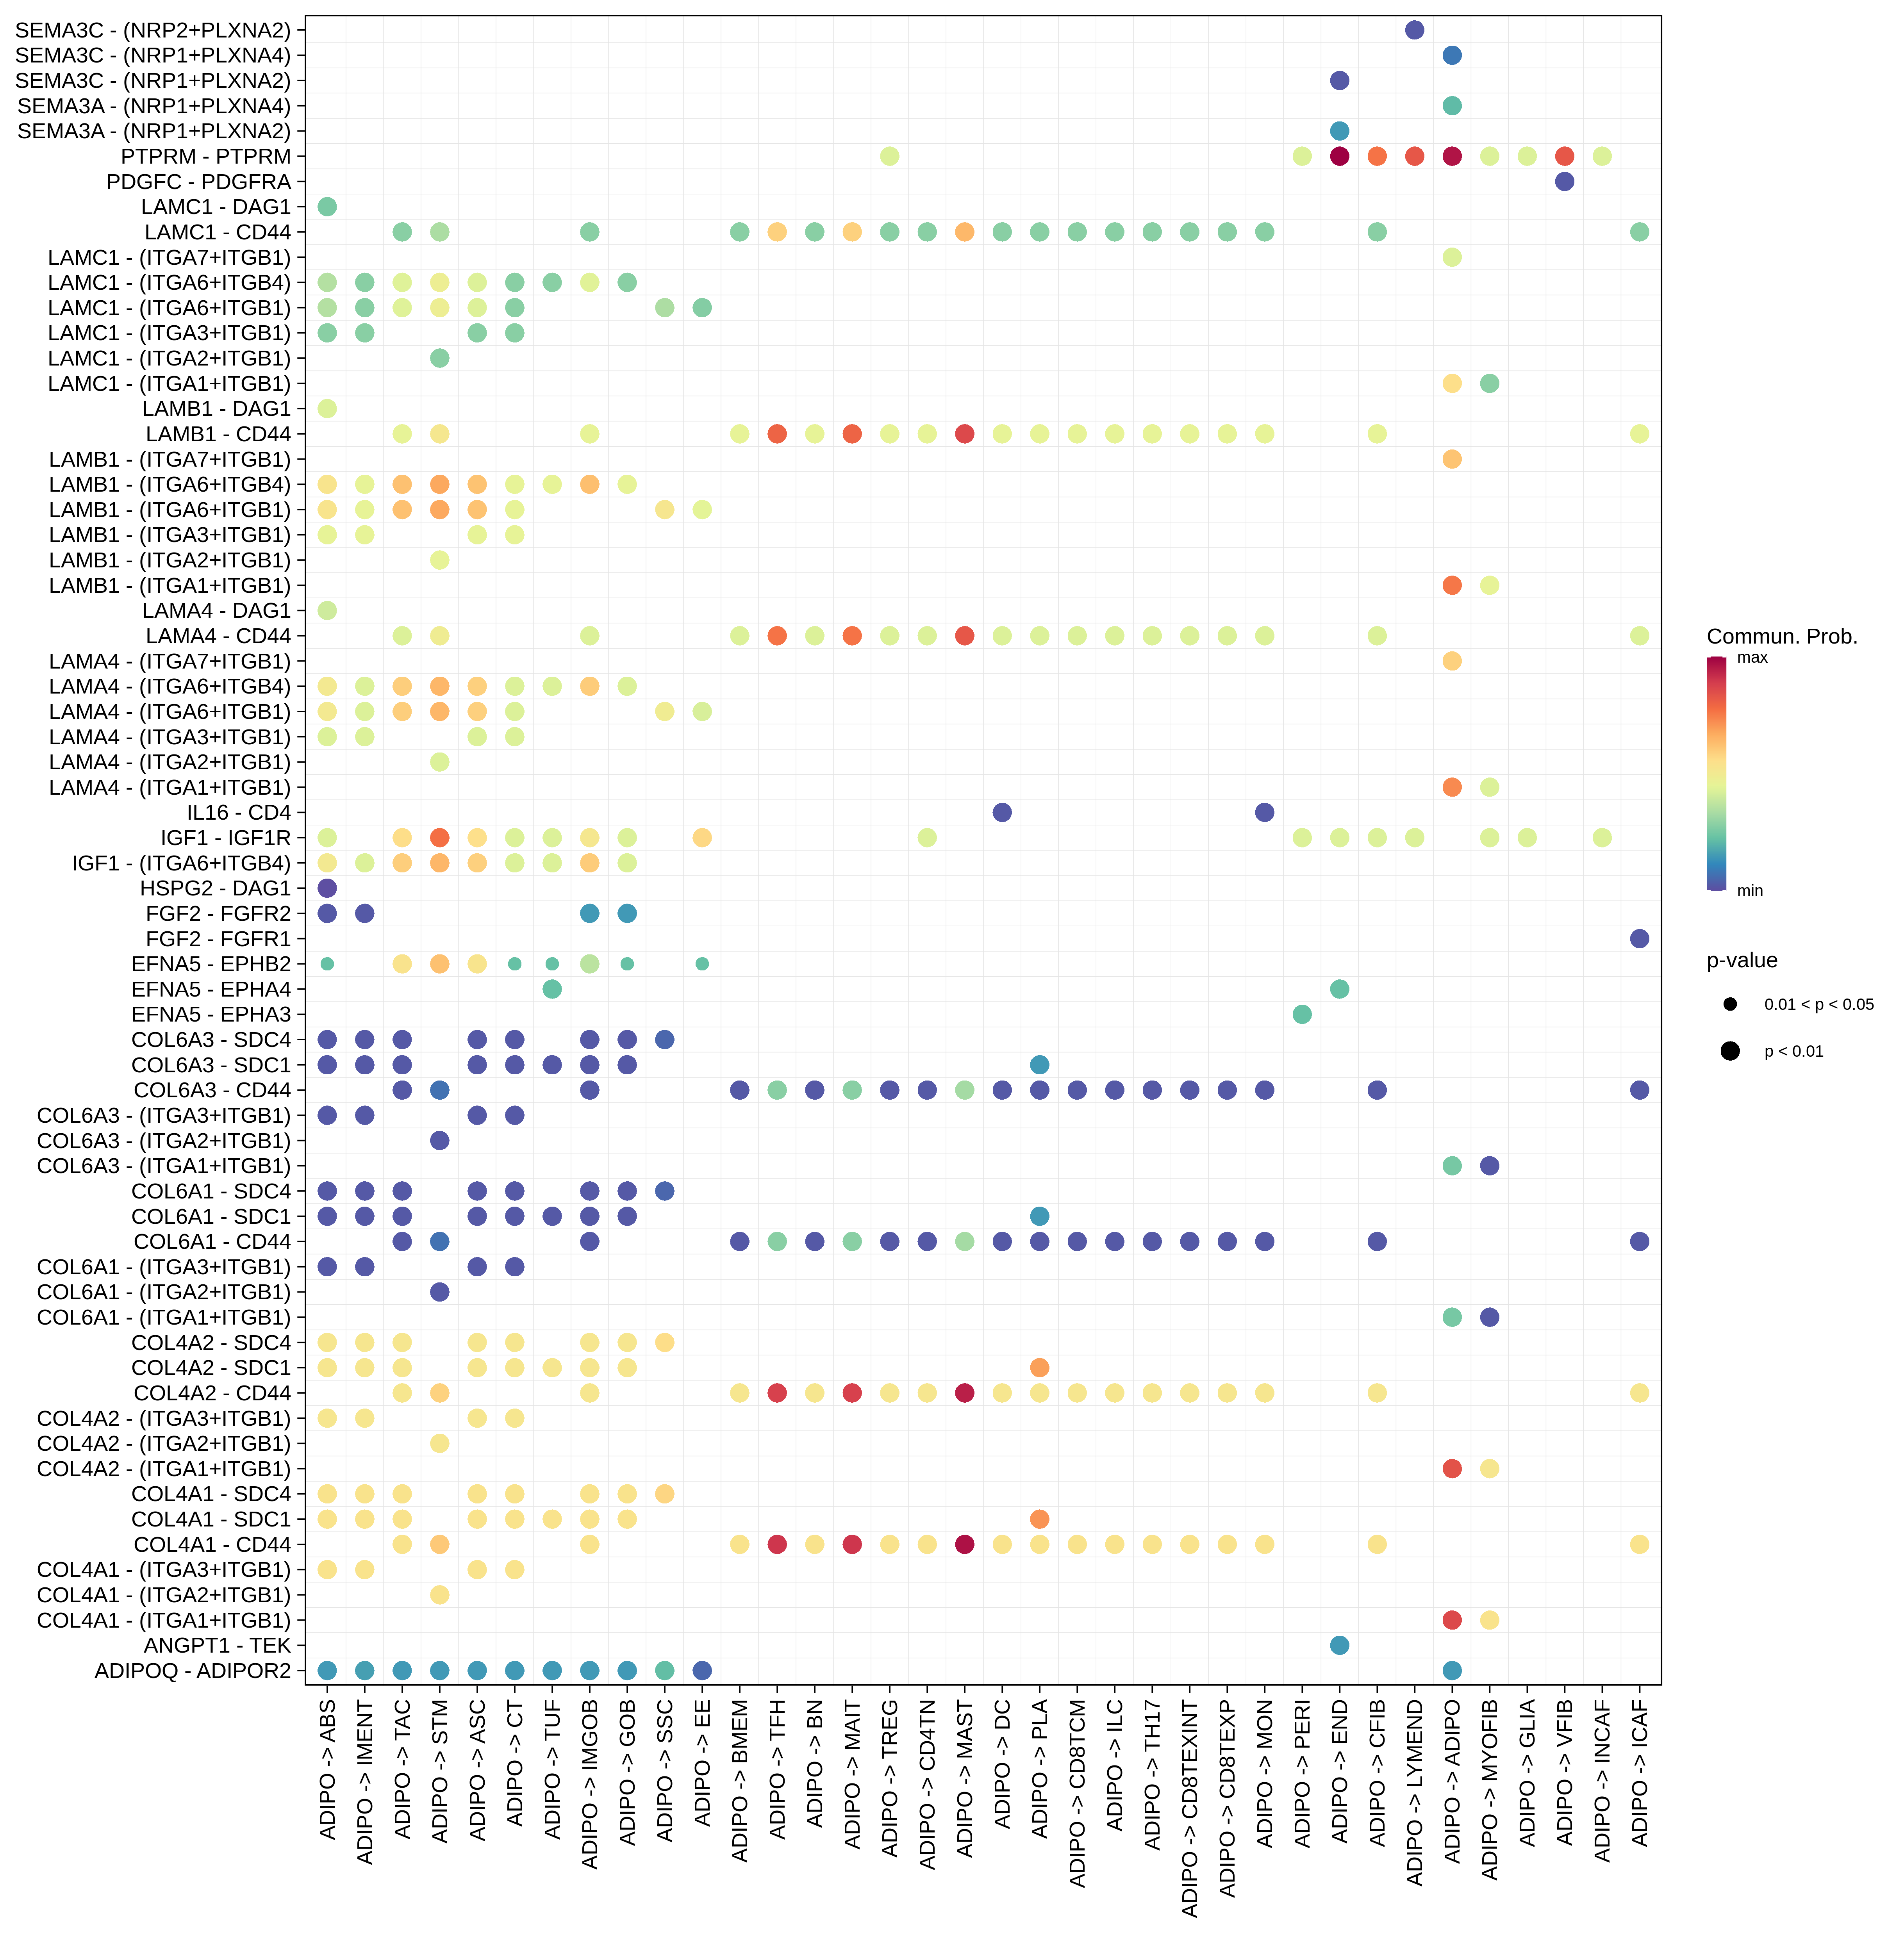 | 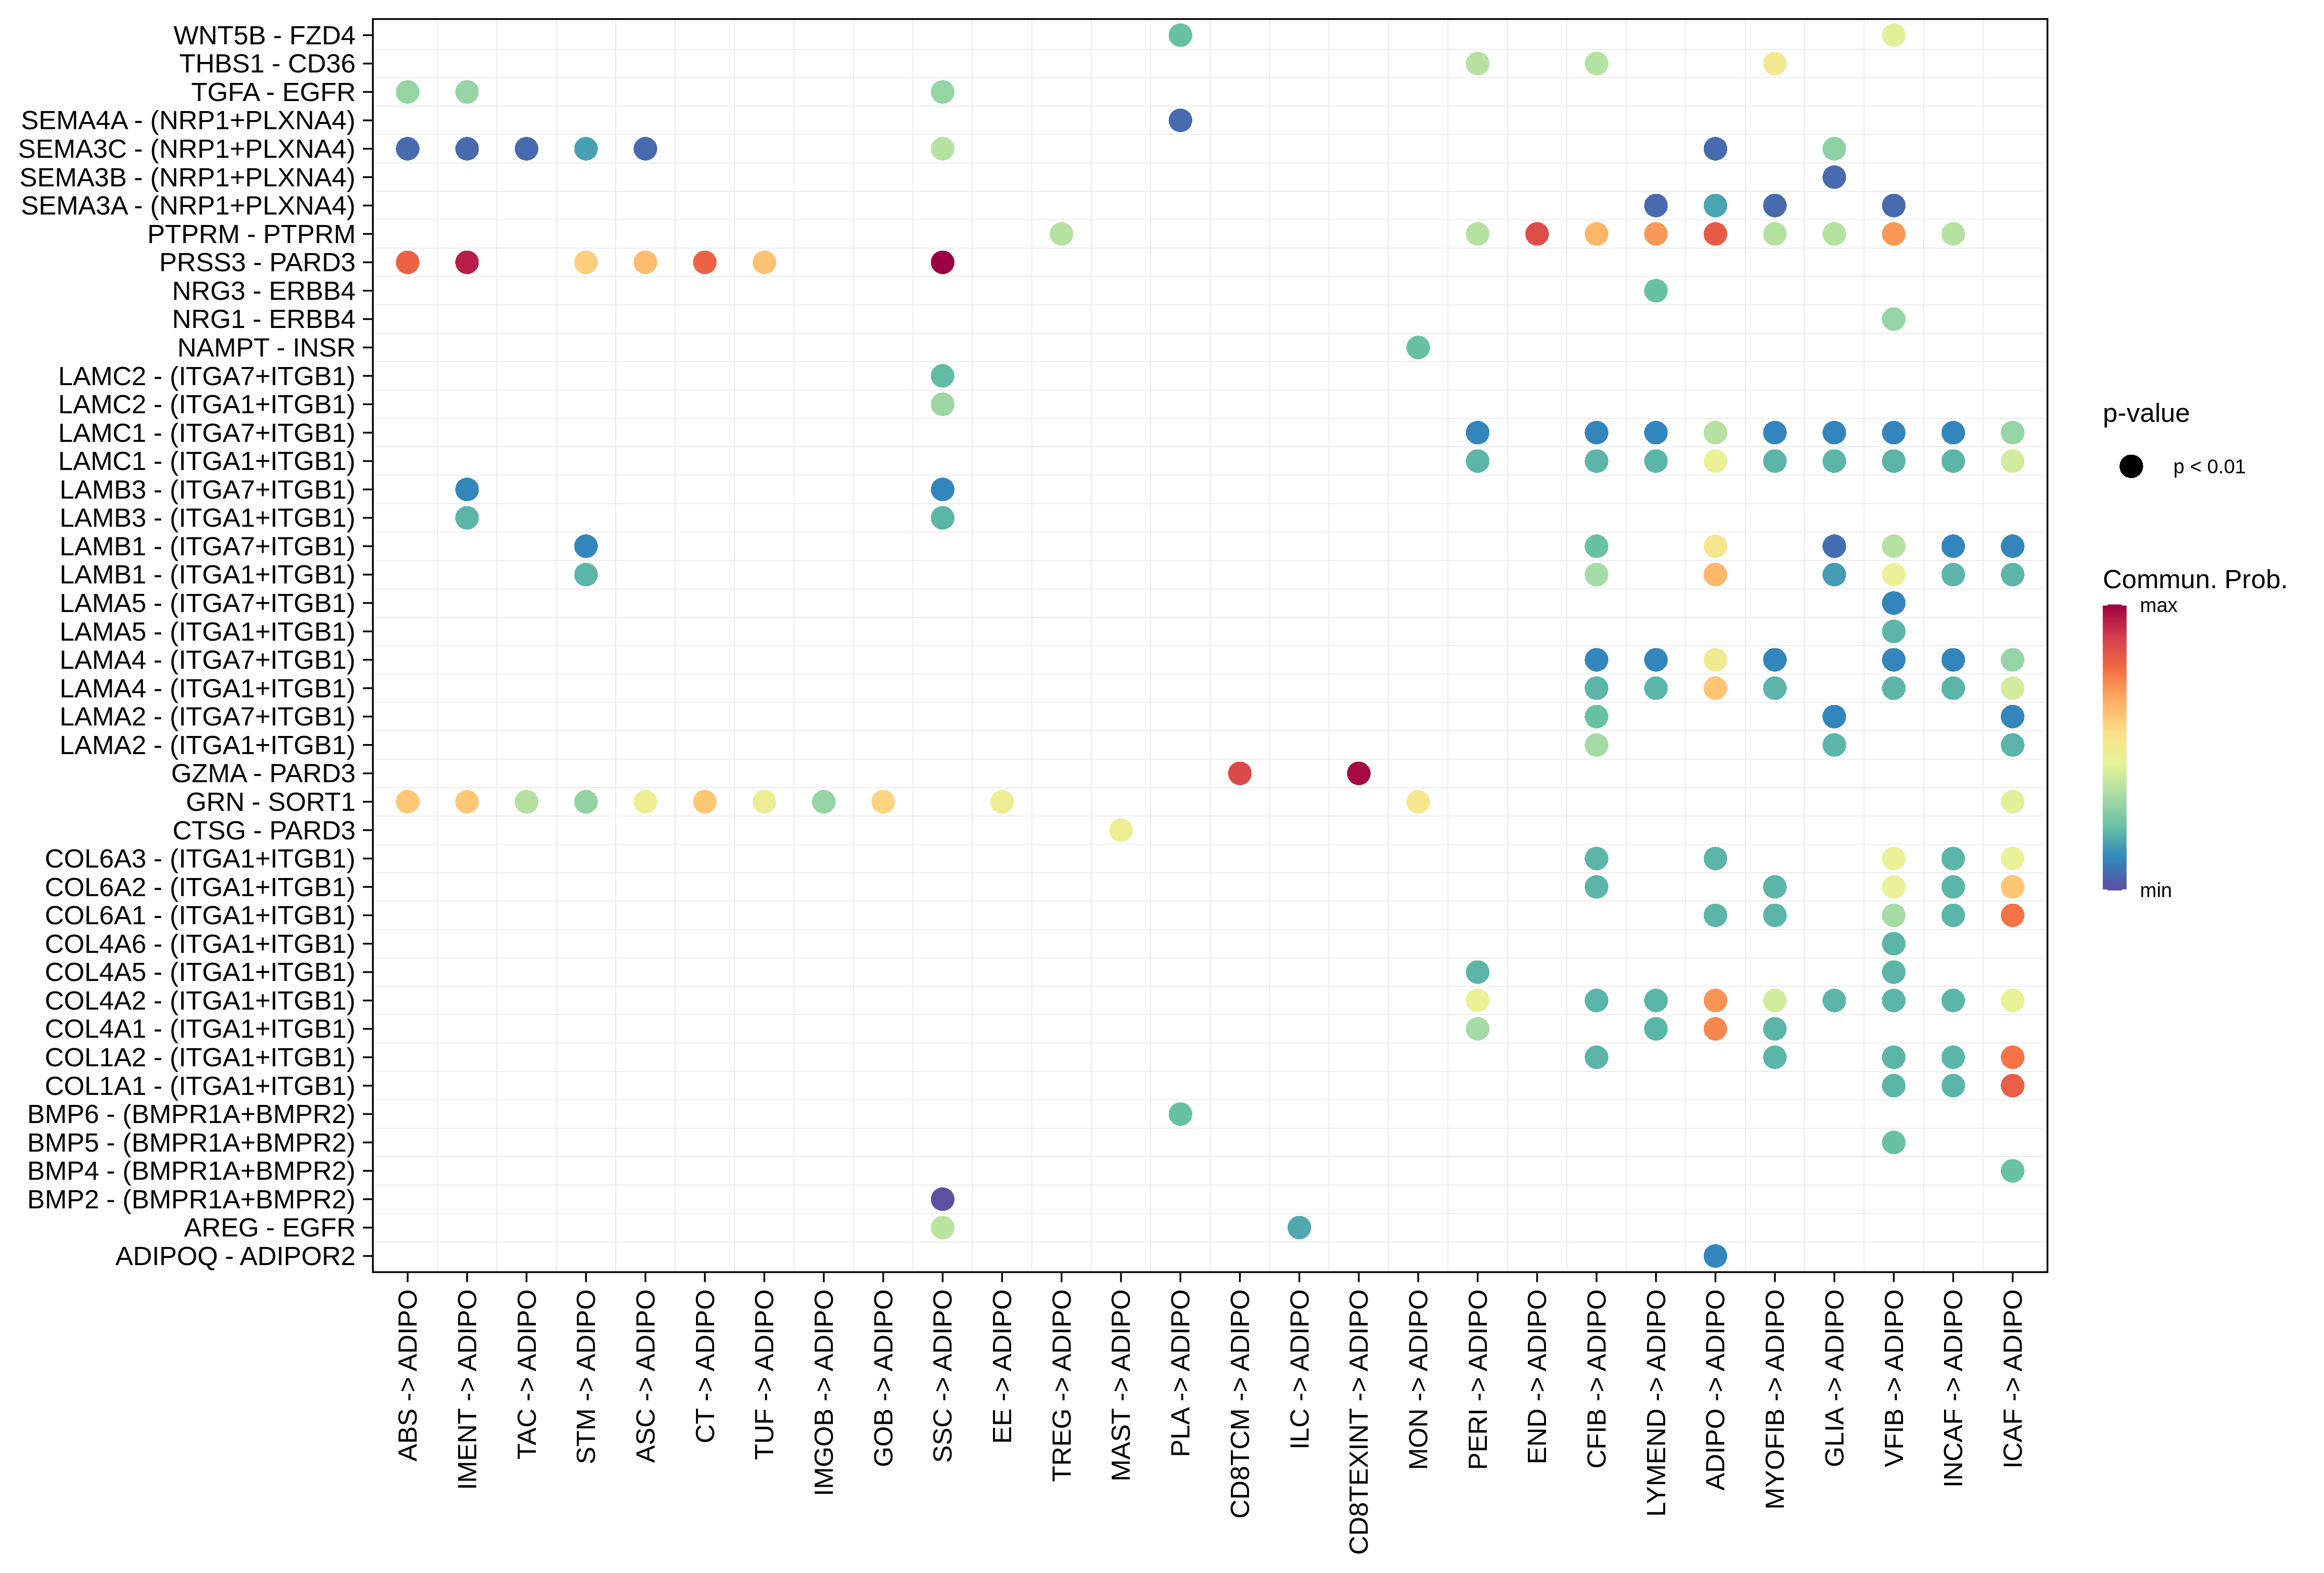 |
| Page: 1 2 3 4 5 6 7 8 9 10 11 12 13 14 15 16 17 18 19 20 |
| Disease State | Cell Type | Circle | Source | Target |
| SER | ABS | 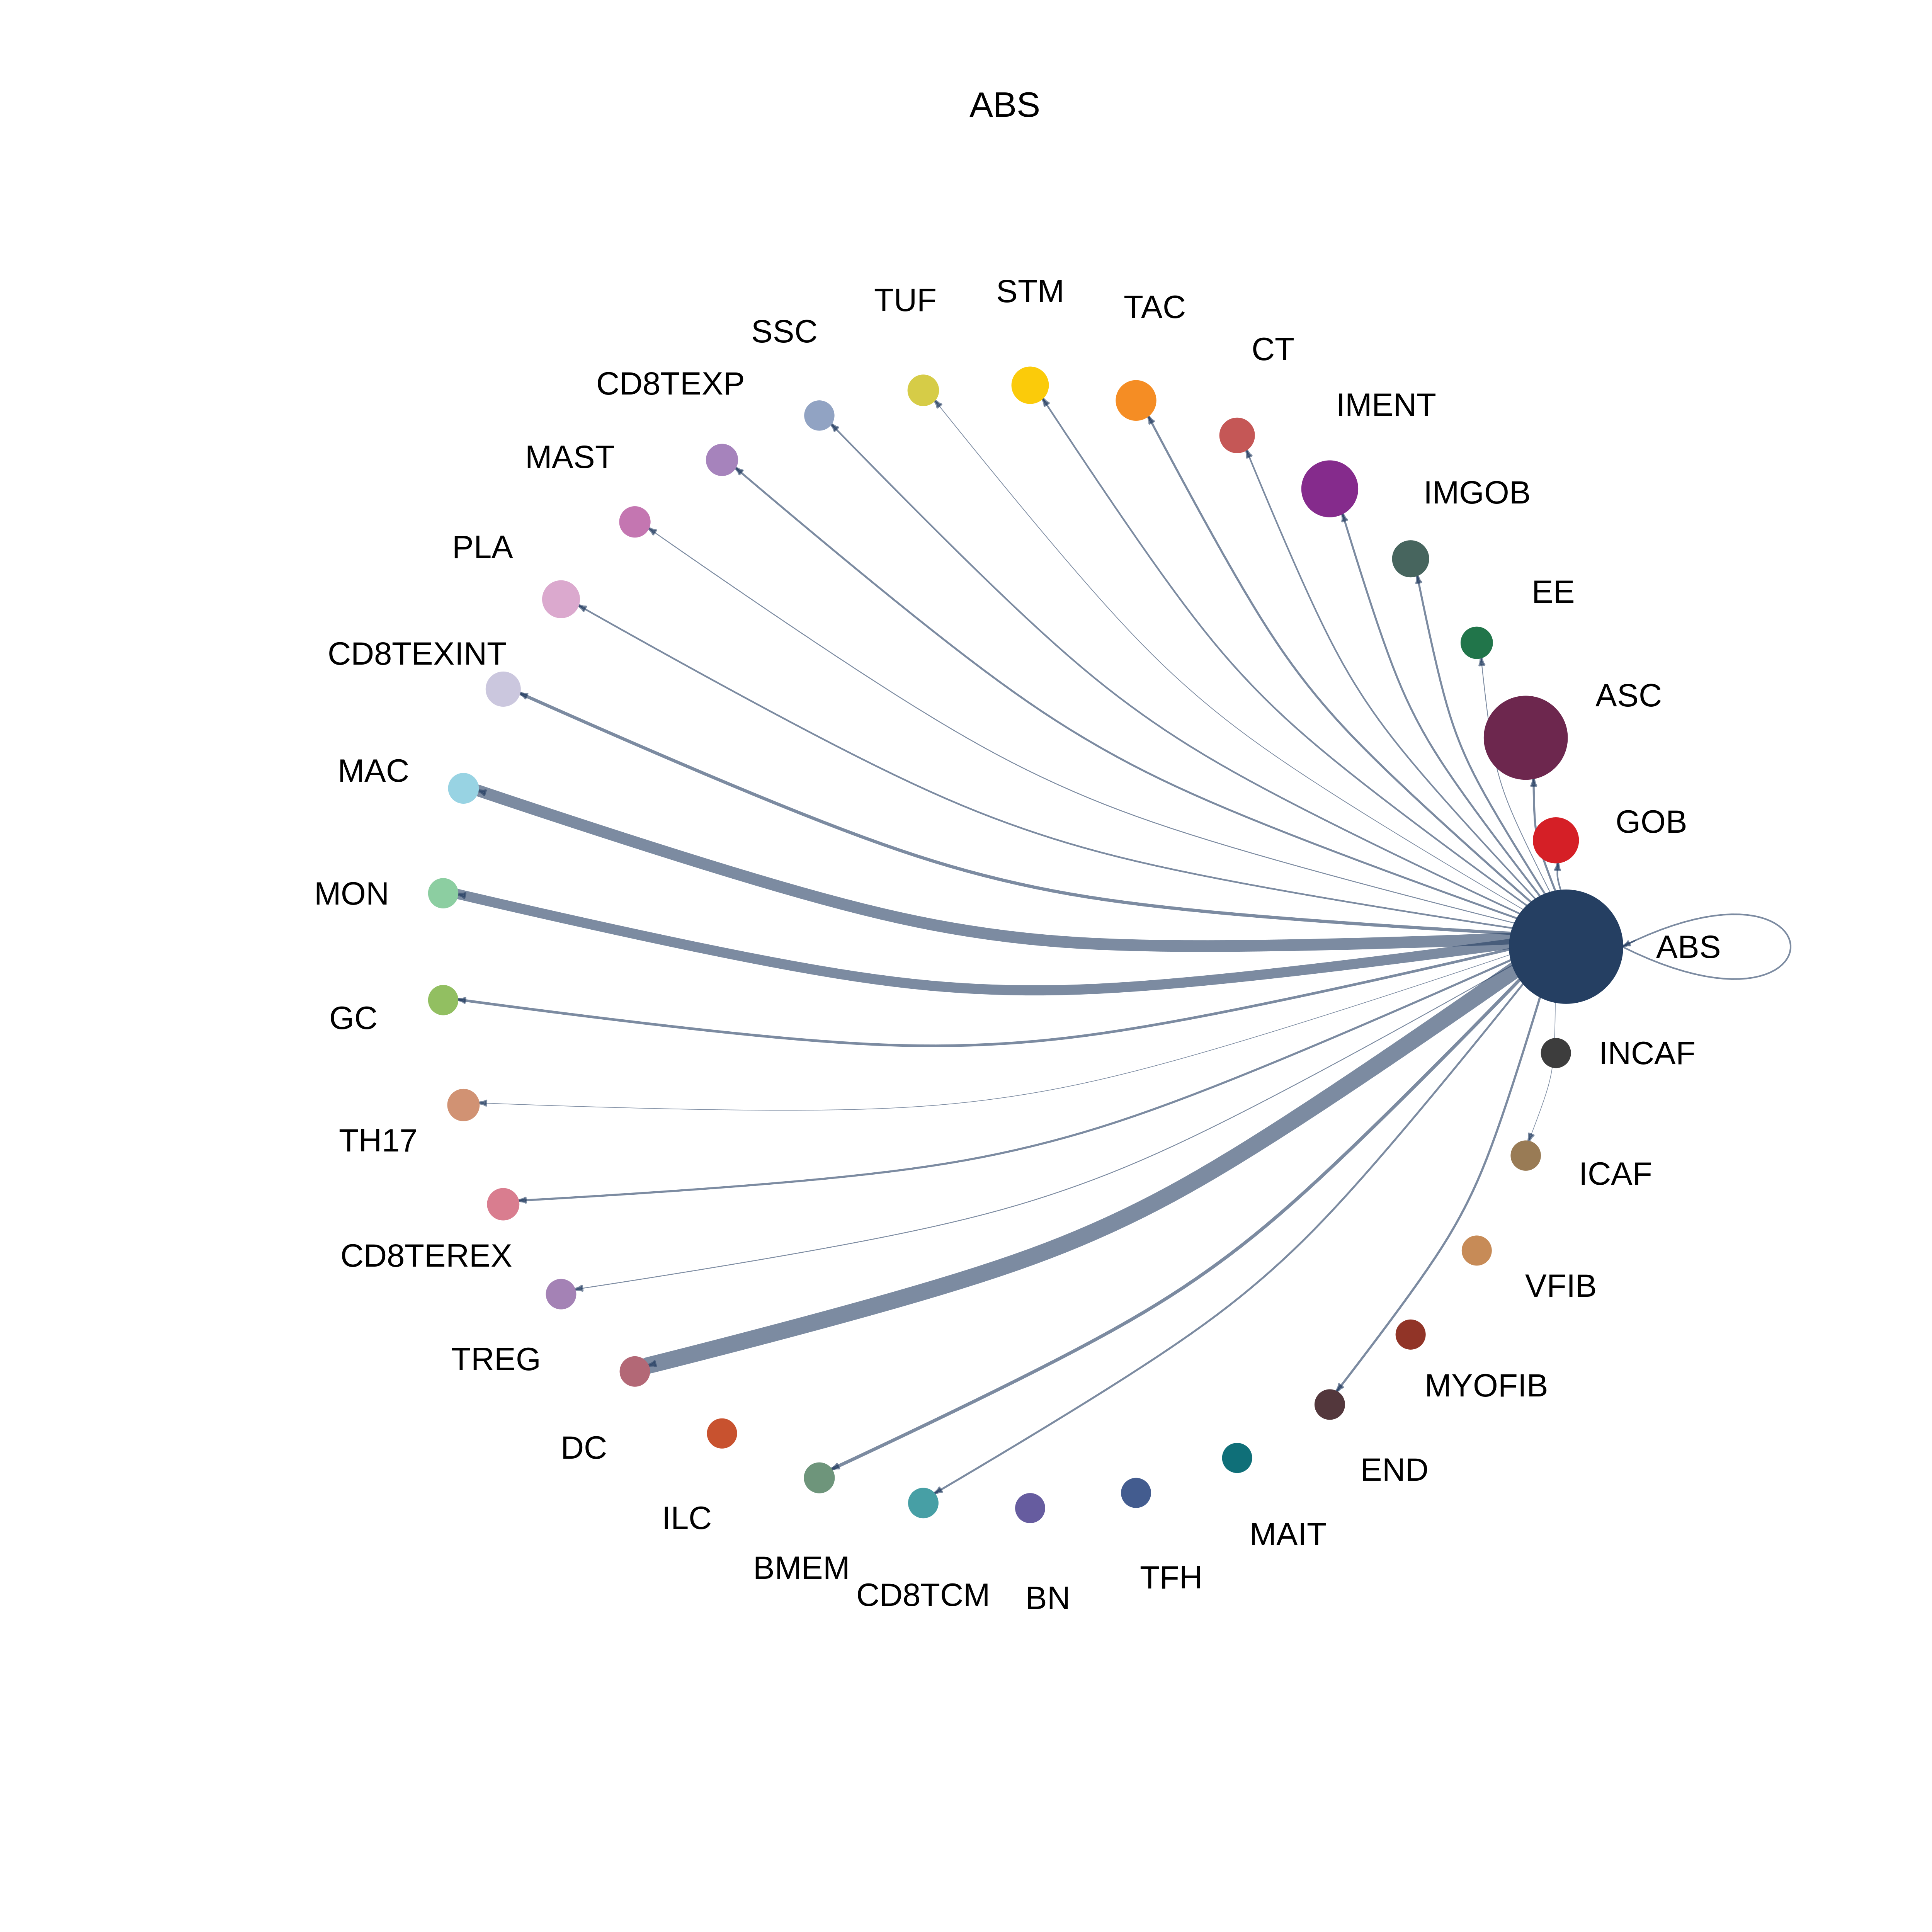 | 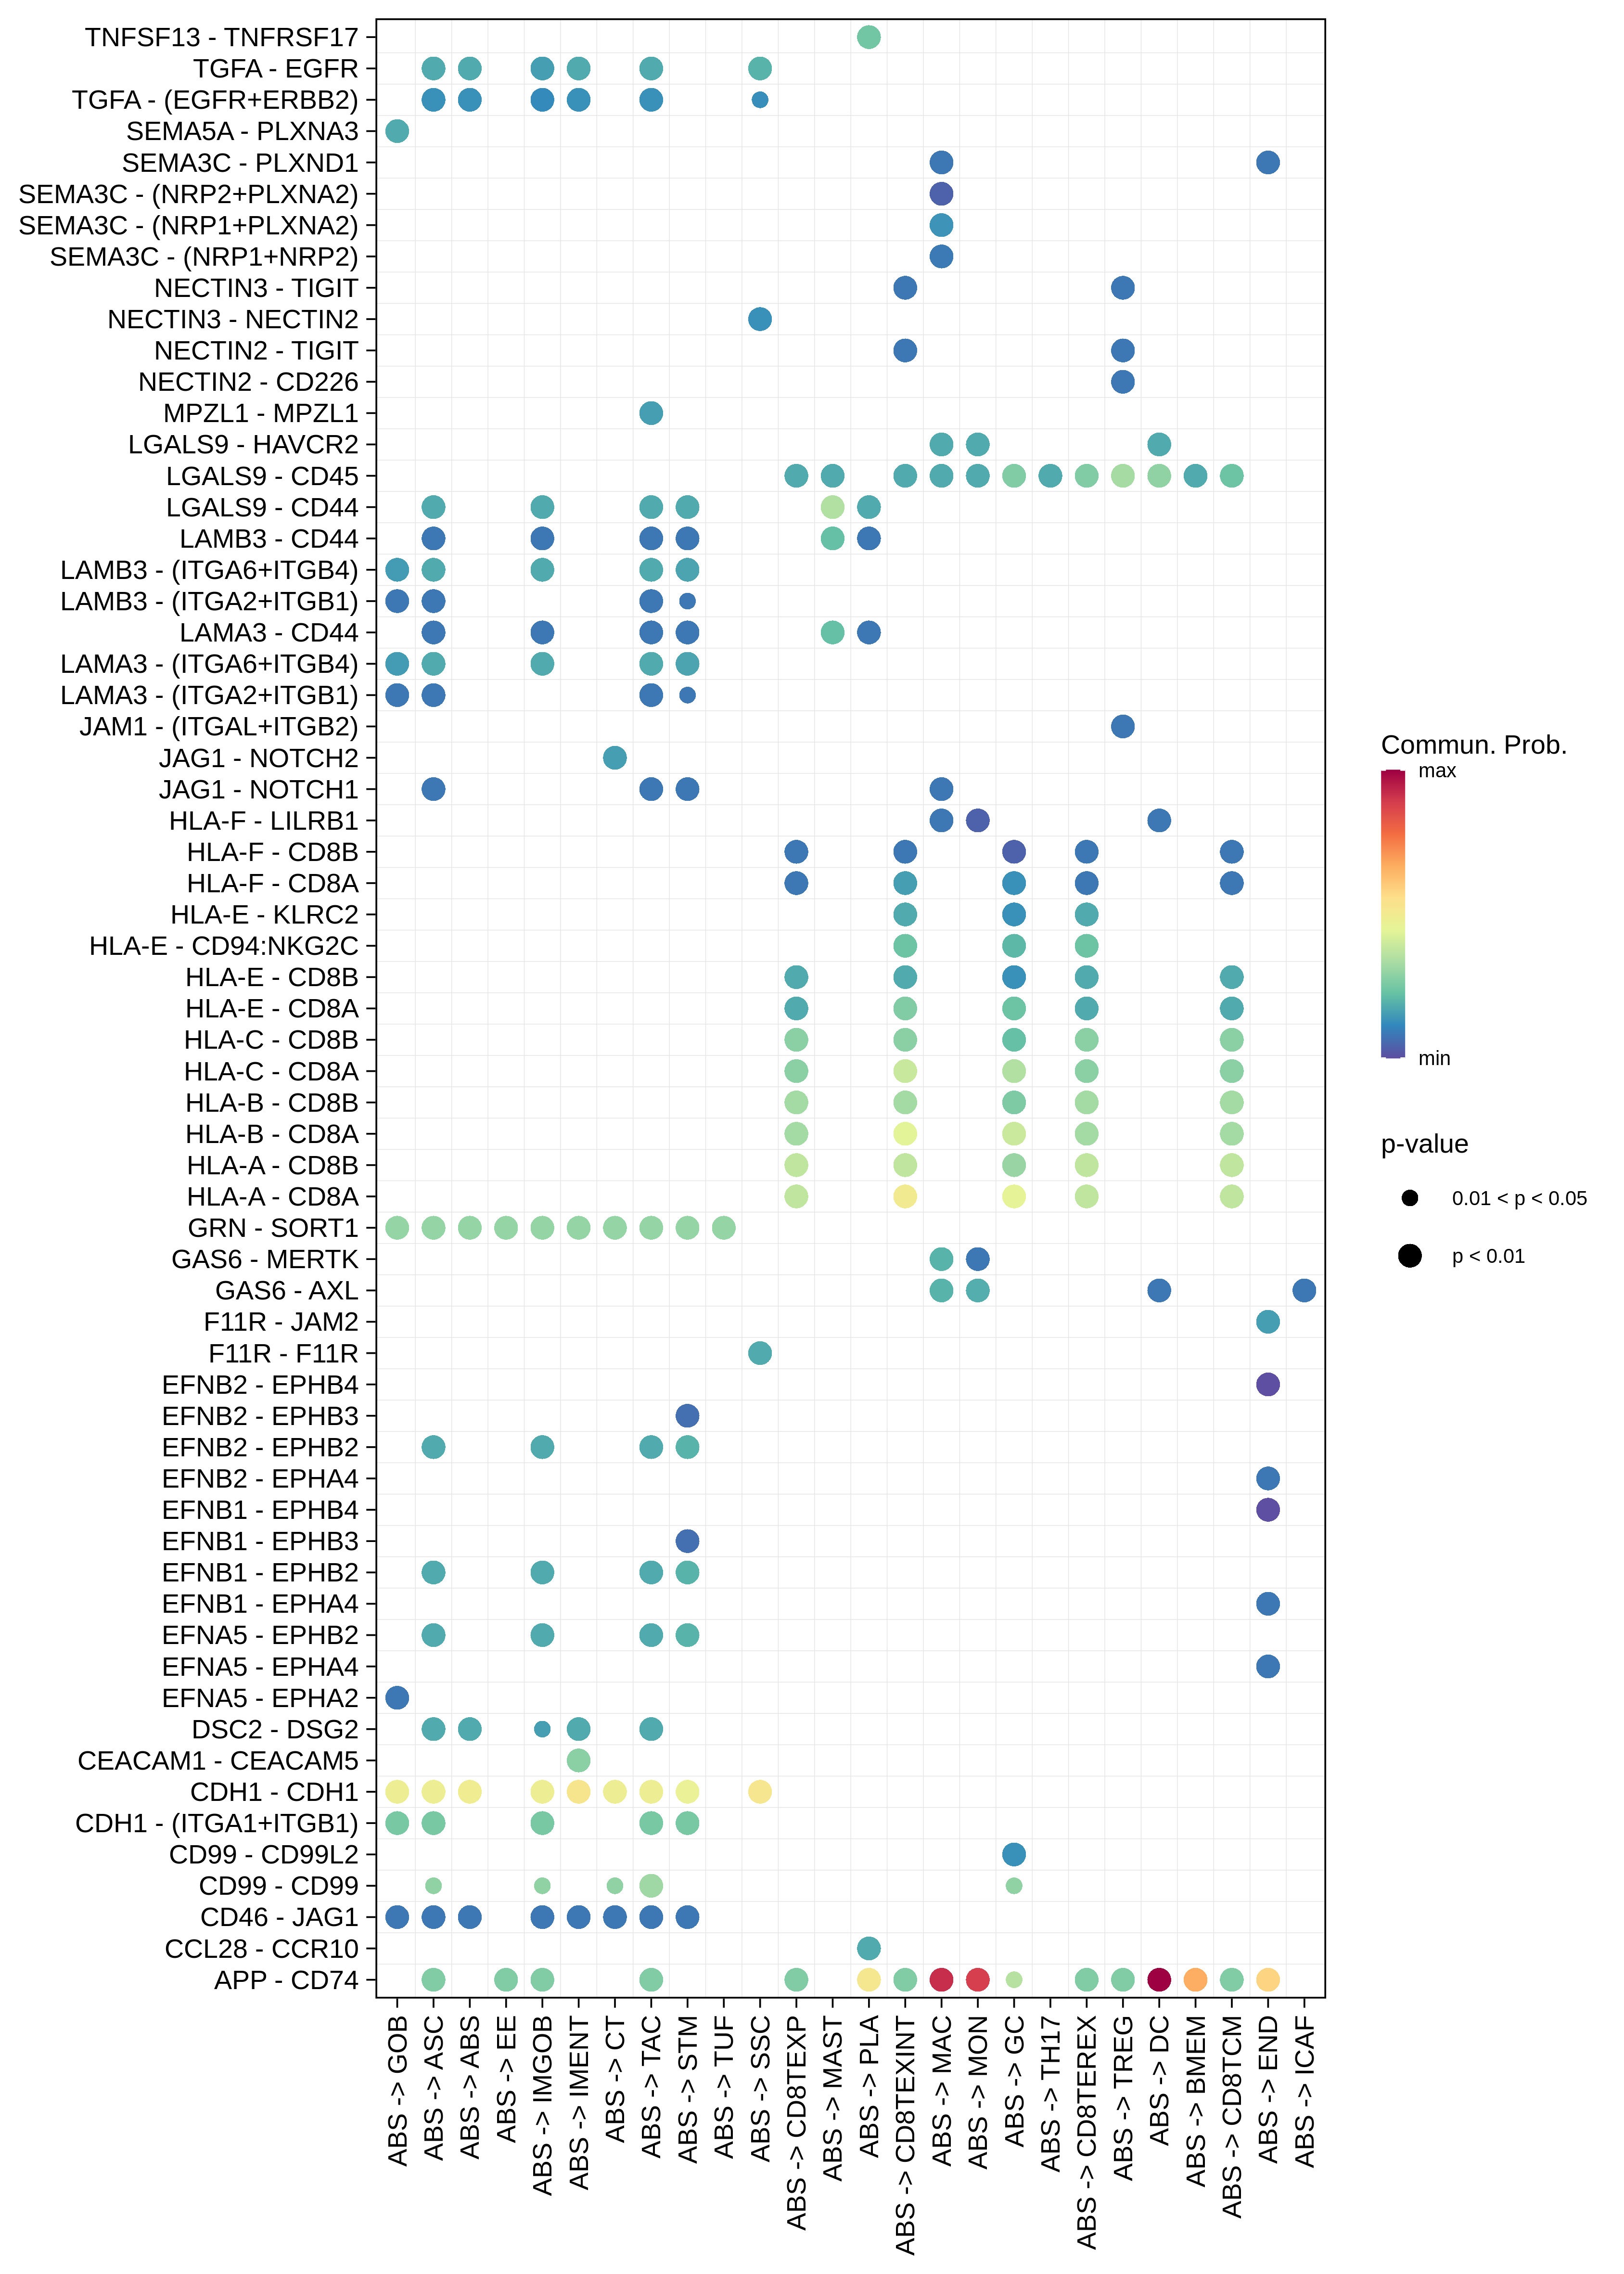 | 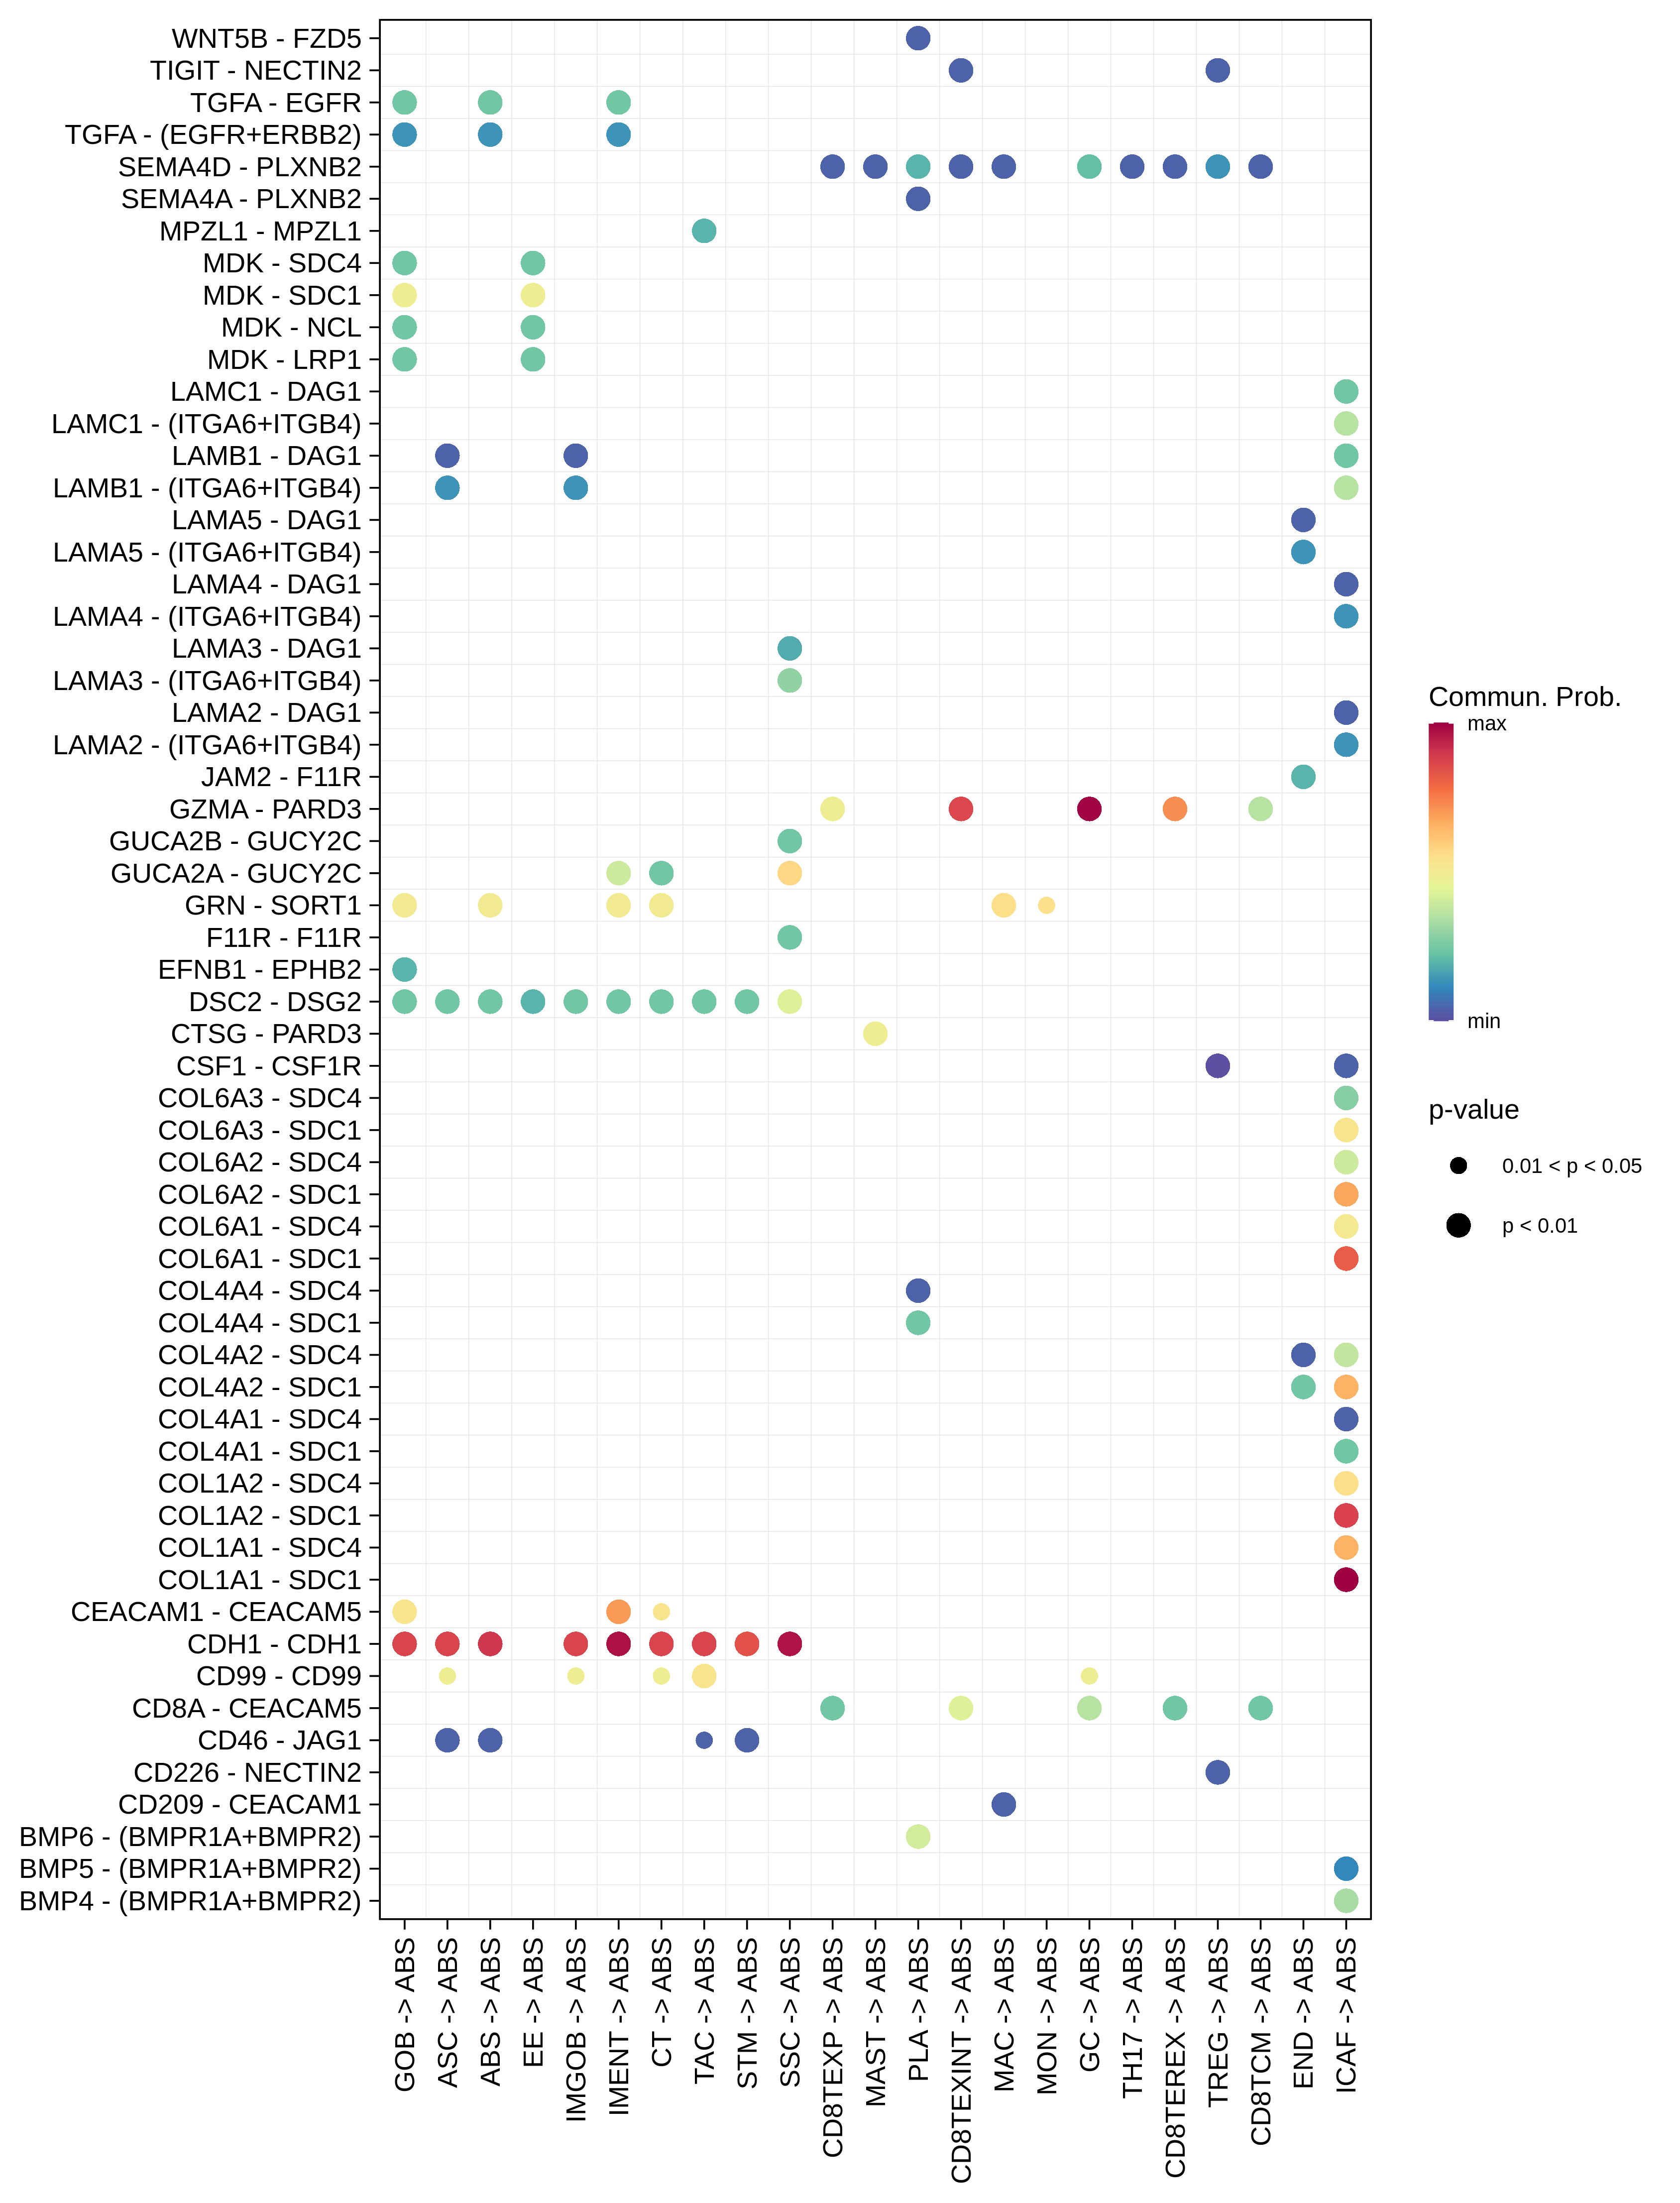 |
| ASC | 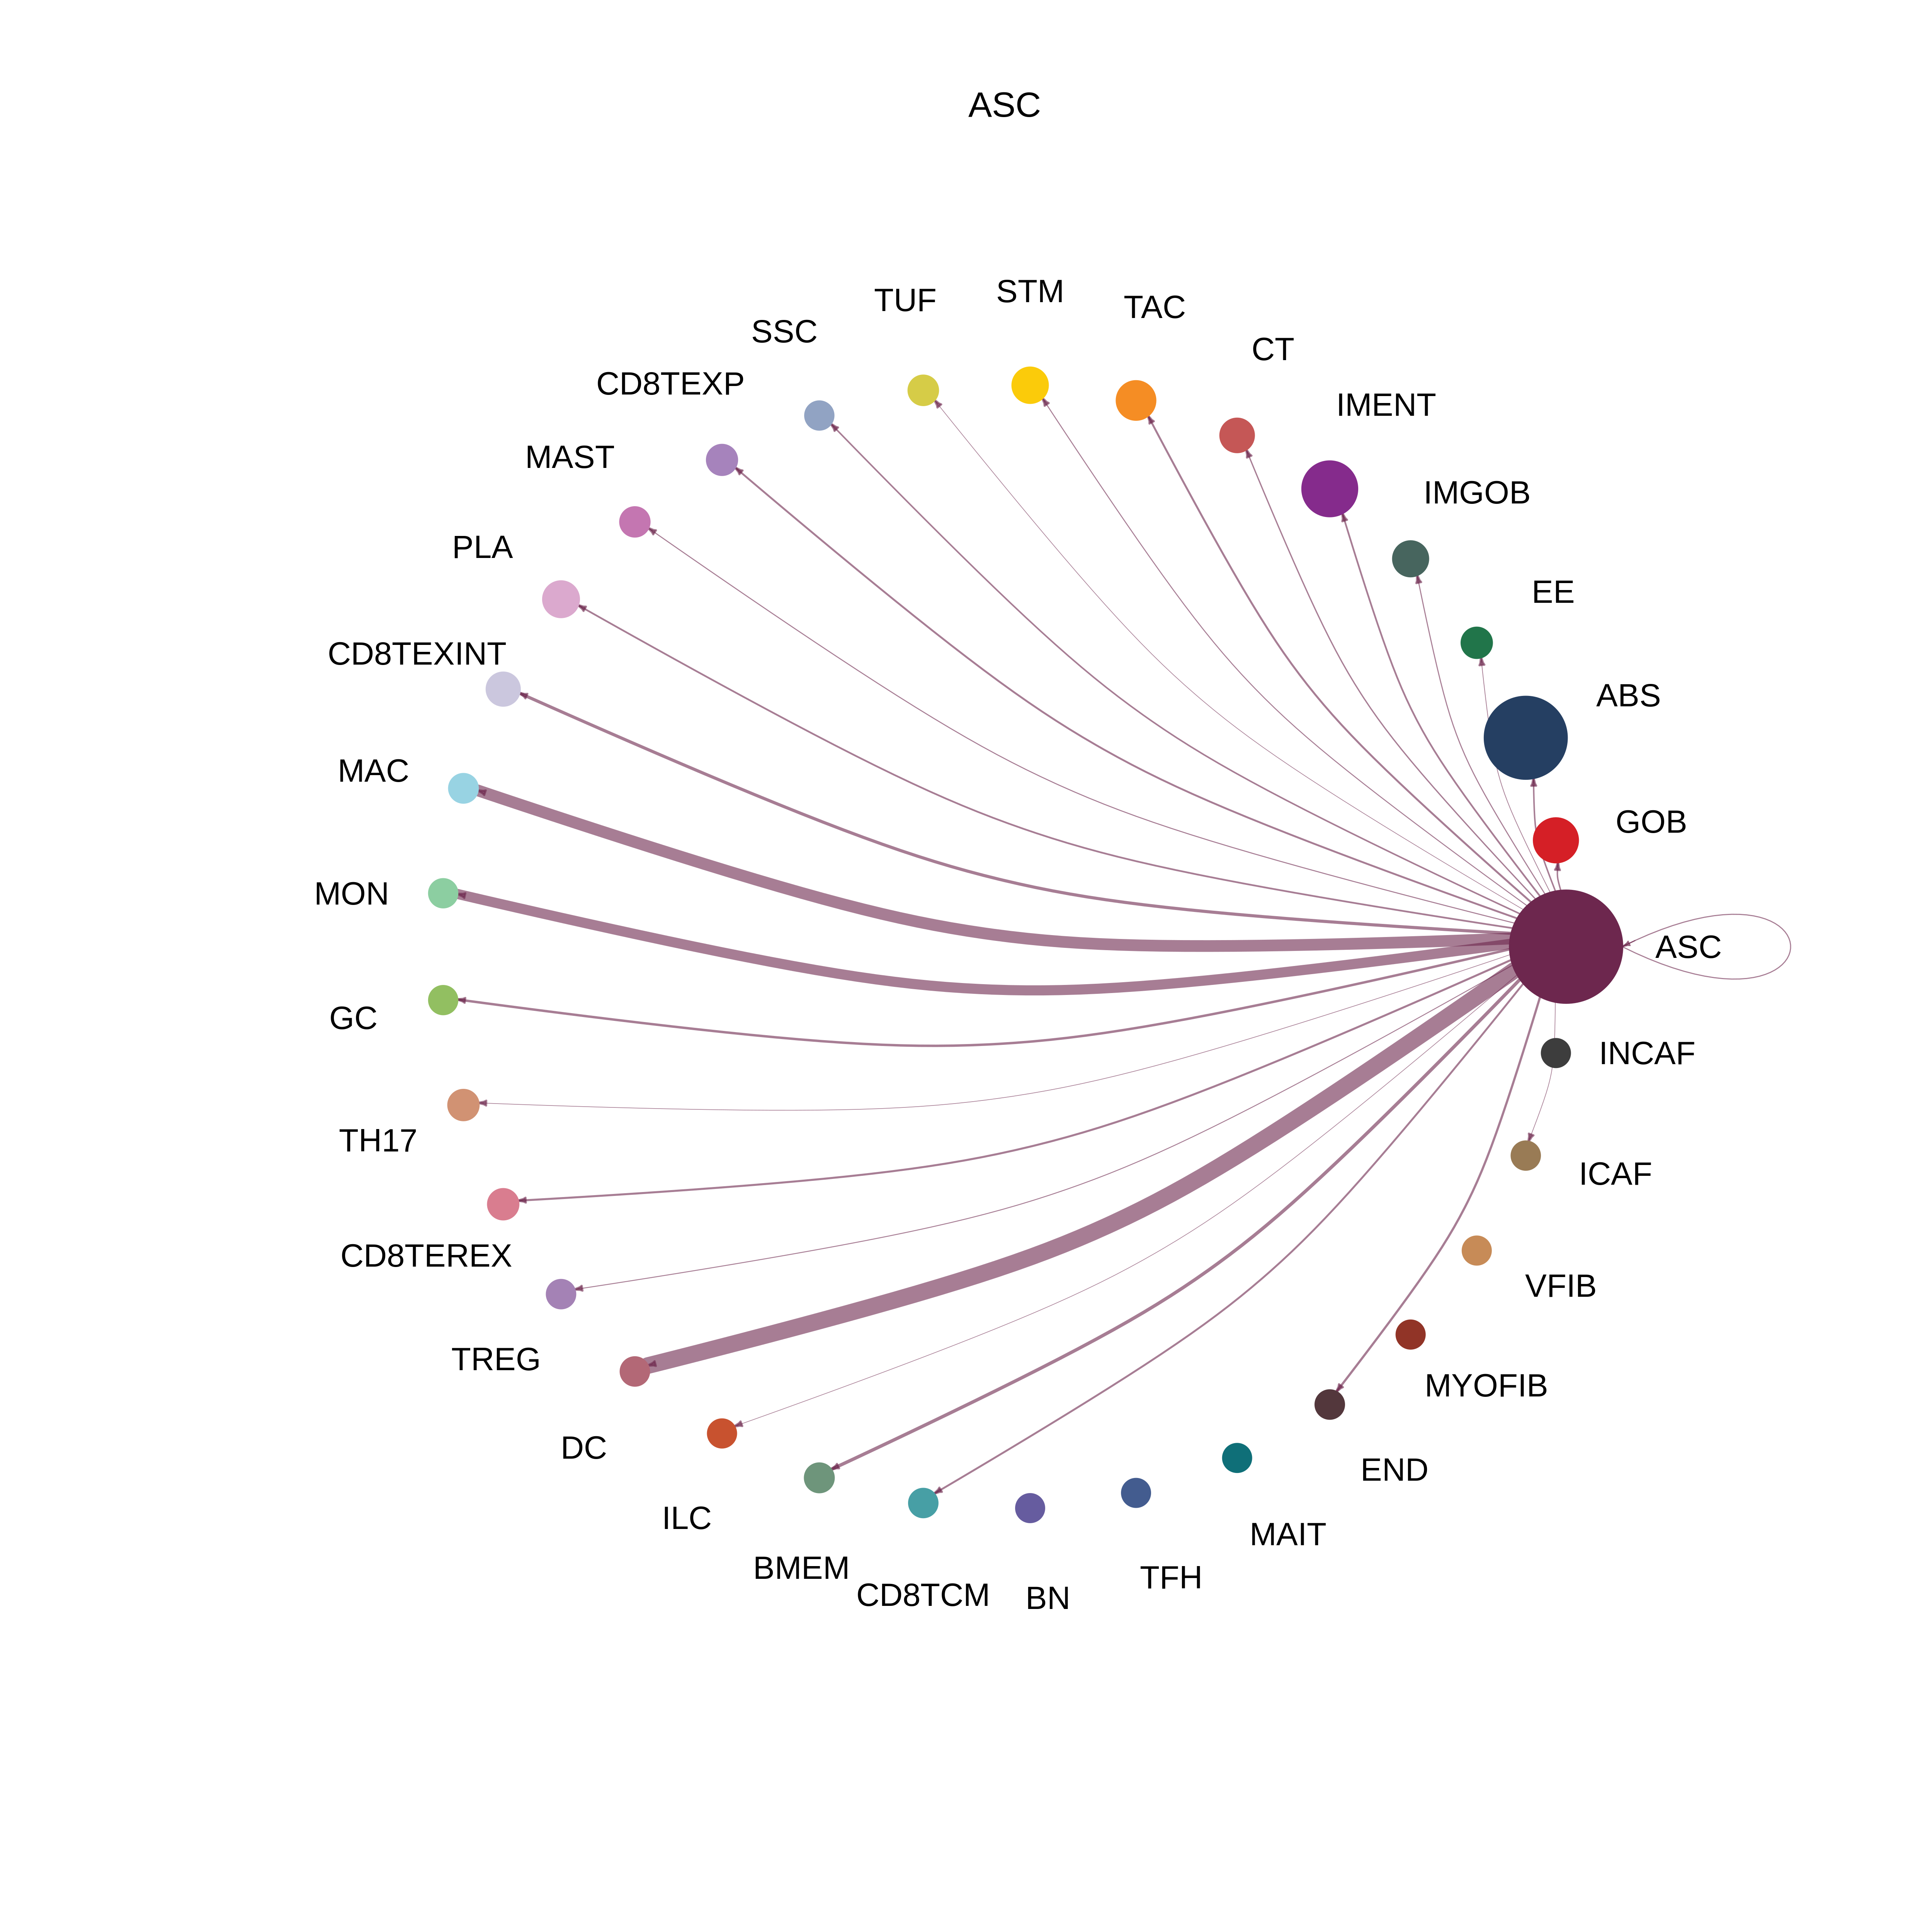 | 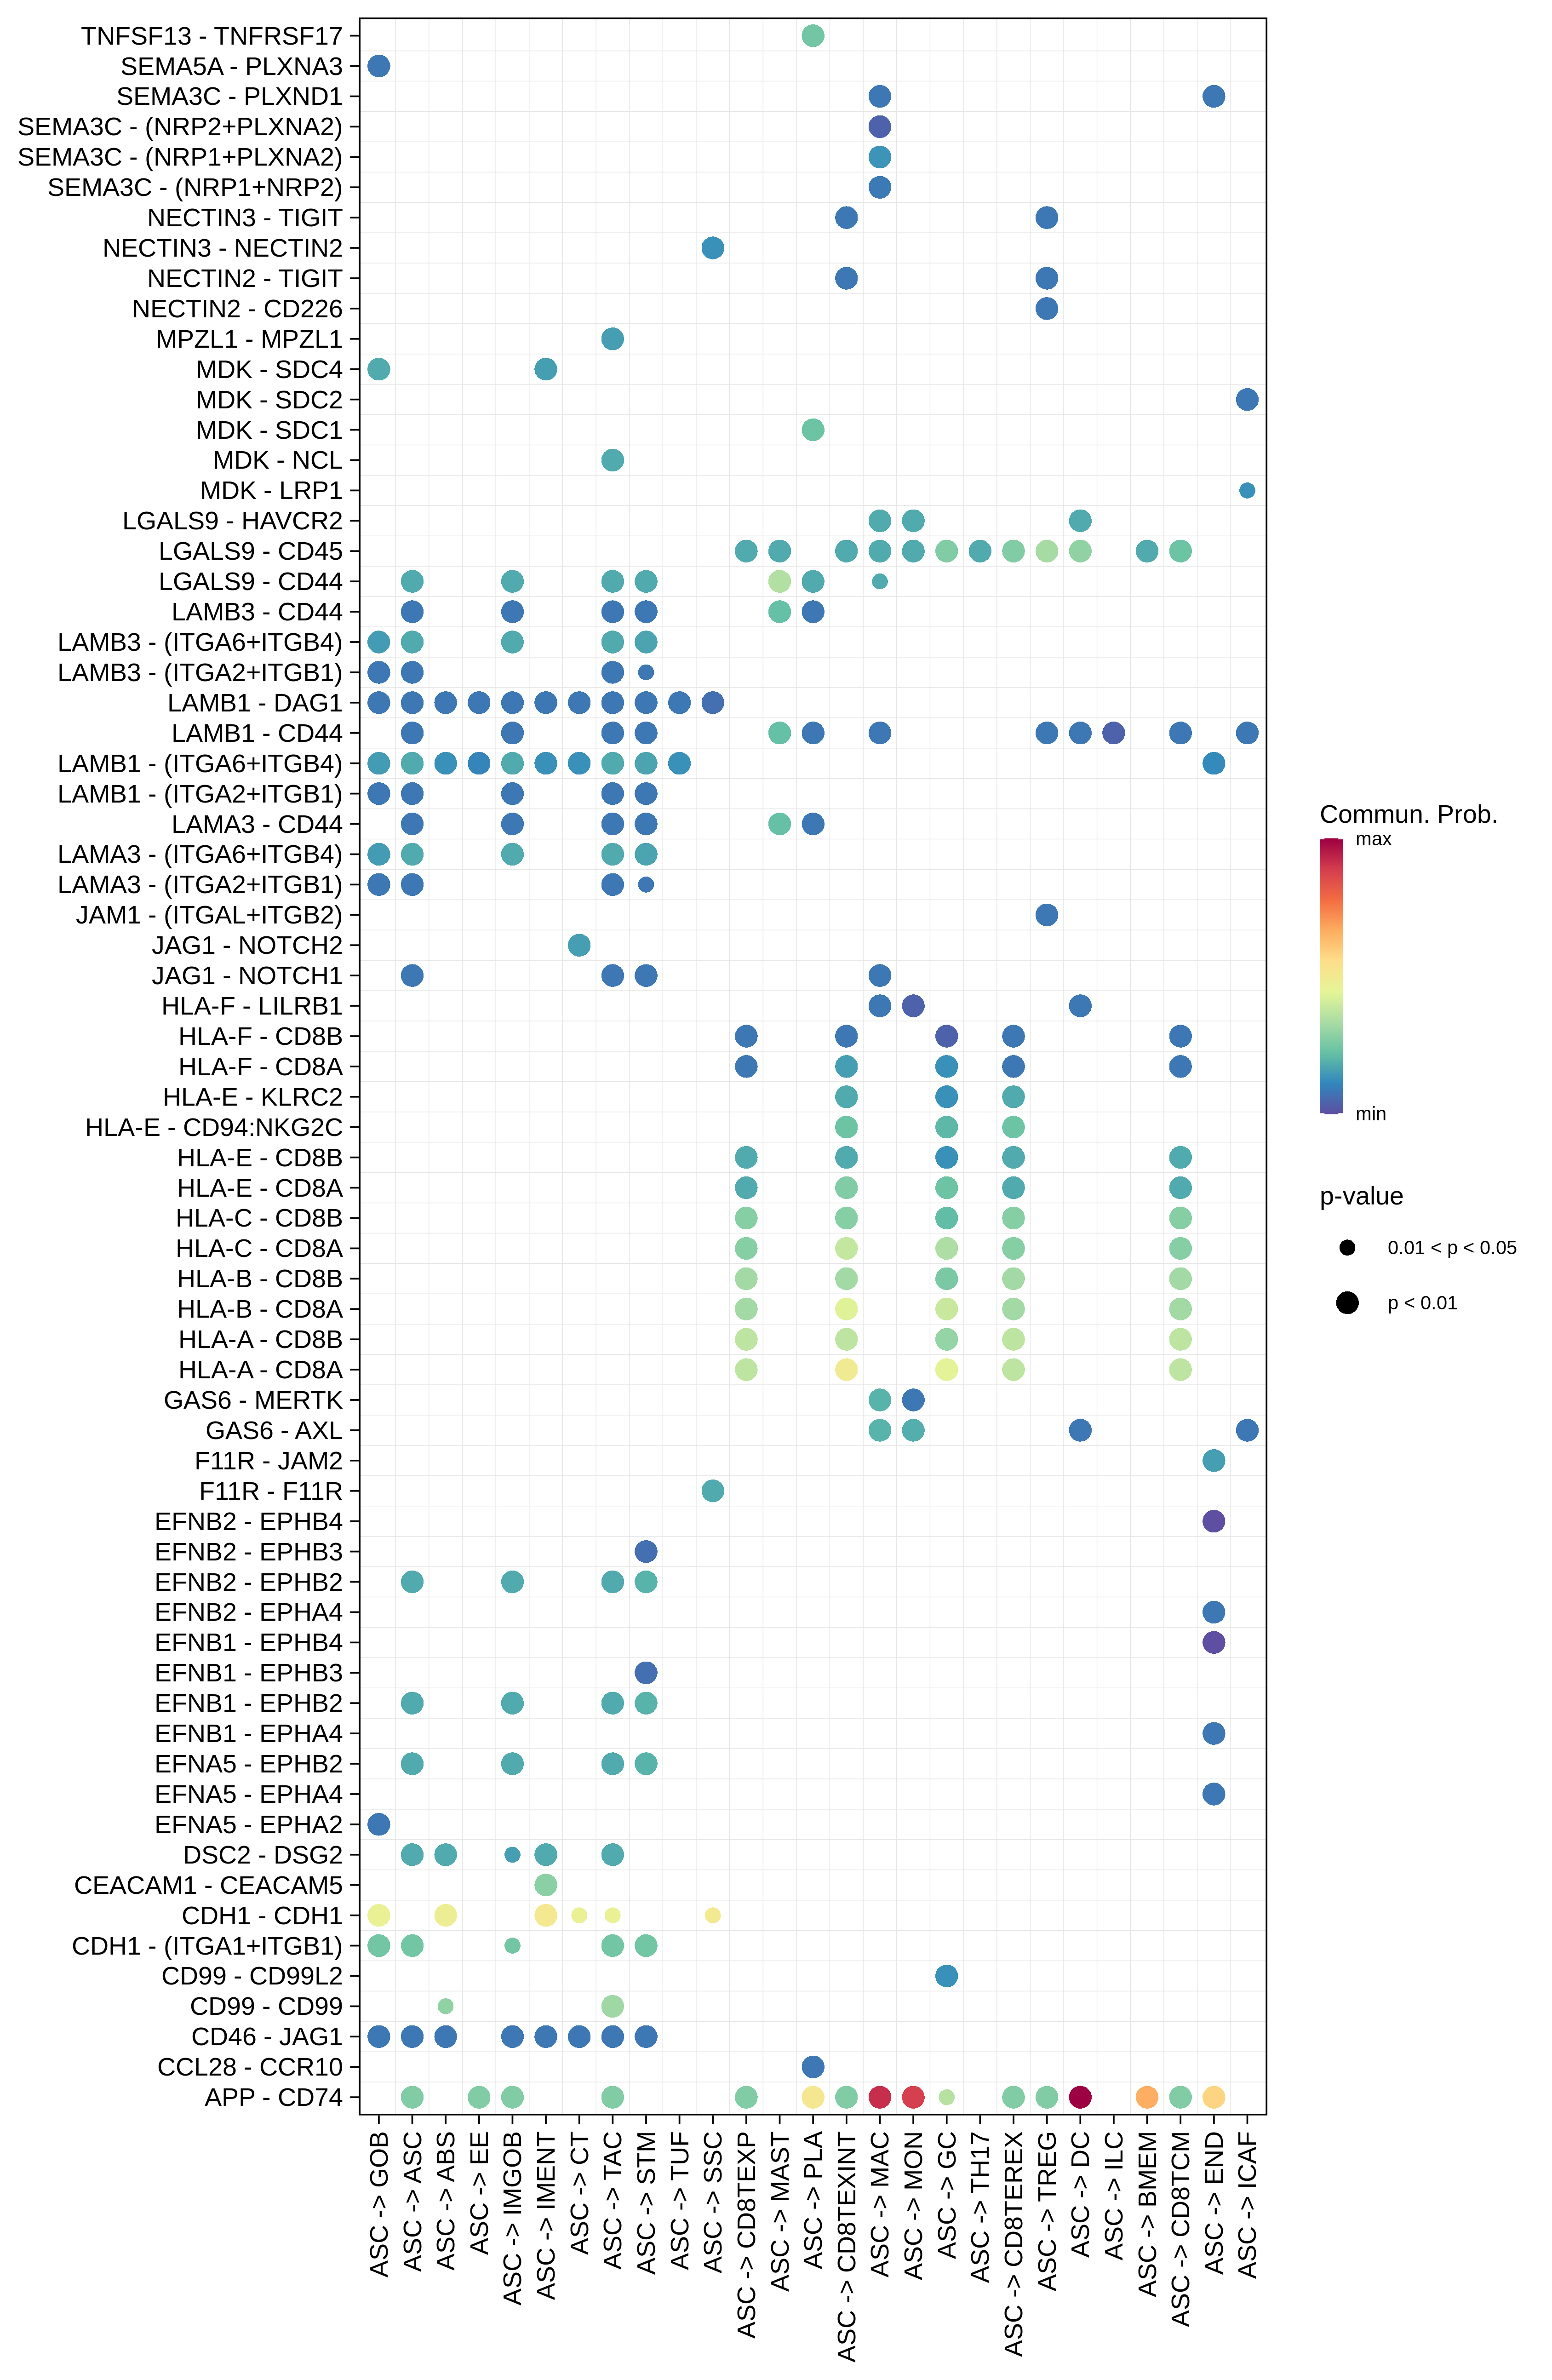 |  |
| Page: 1 2 3 4 5 6 7 8 9 10 11 12 13 14 |
| Disease State | Cell Type | Circle | Source | Target |
| AD | ABS |  |  |  |
| ASC |  |  |  |
| Page: 1 2 3 4 5 6 7 8 9 10 11 12 13 14 |
| Disease State | Cell Type | Circle | Source | Target |
| FAP | TAC |  | 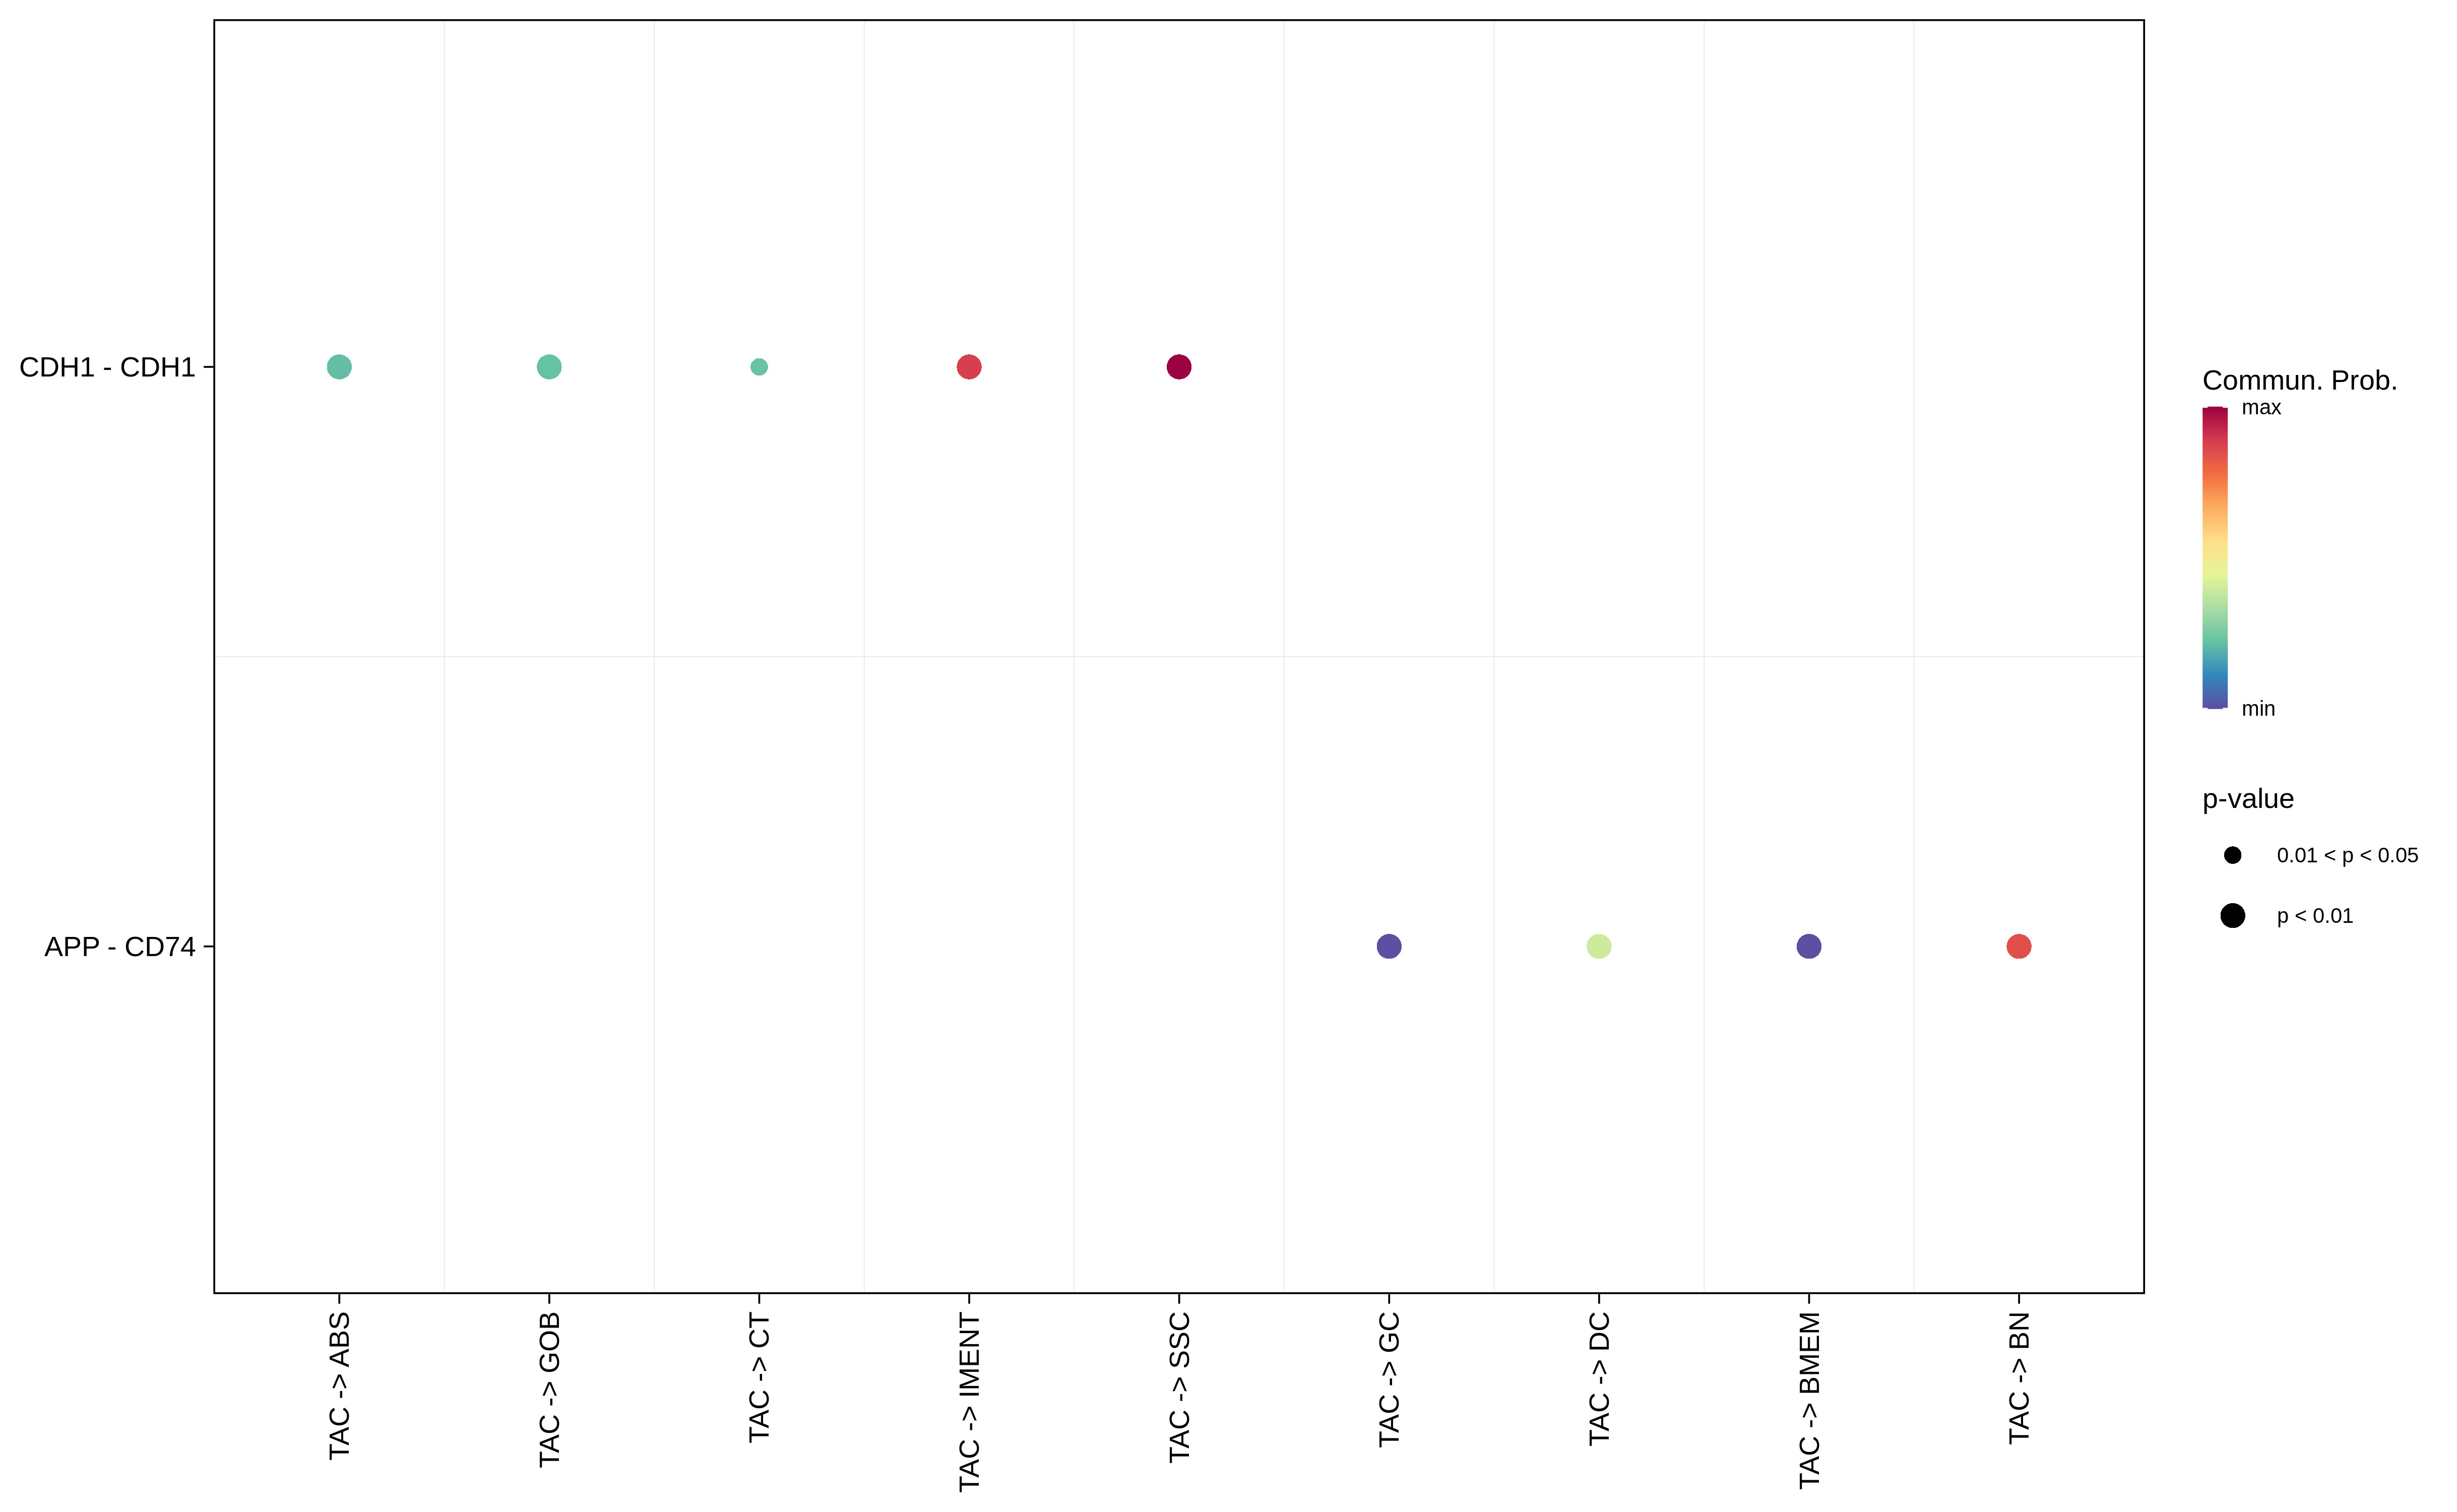 | 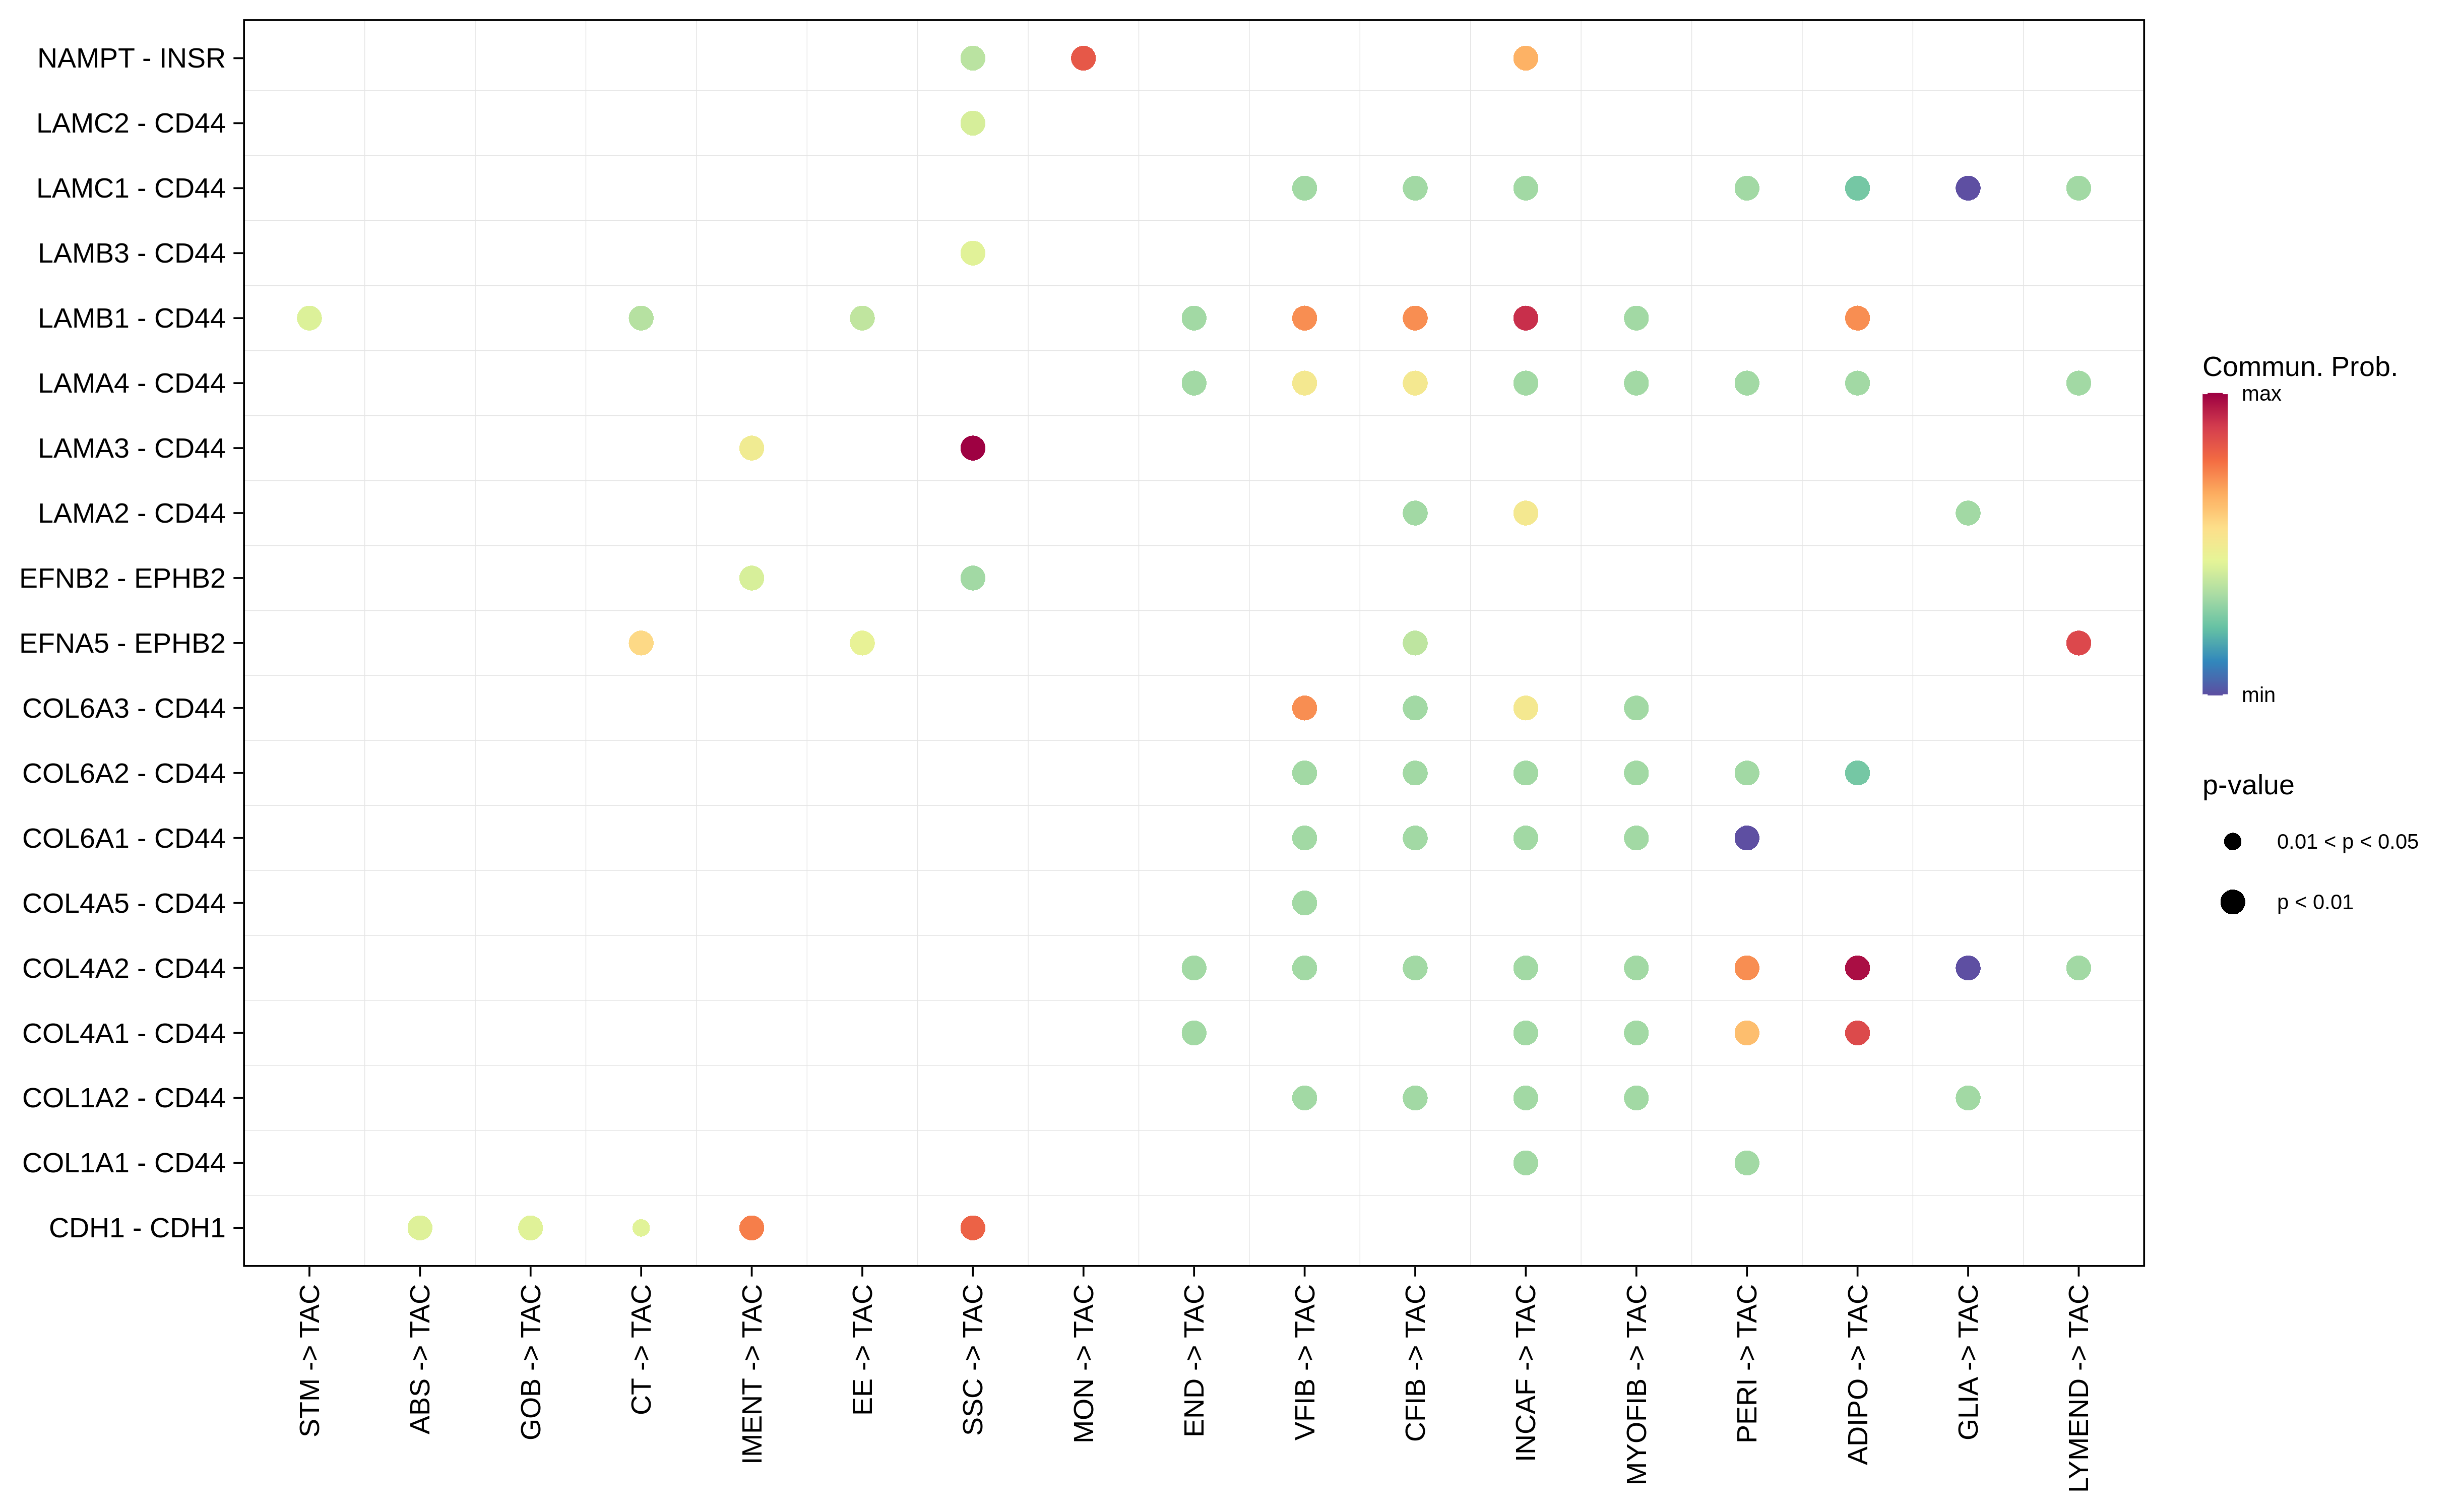 |
| TFH | 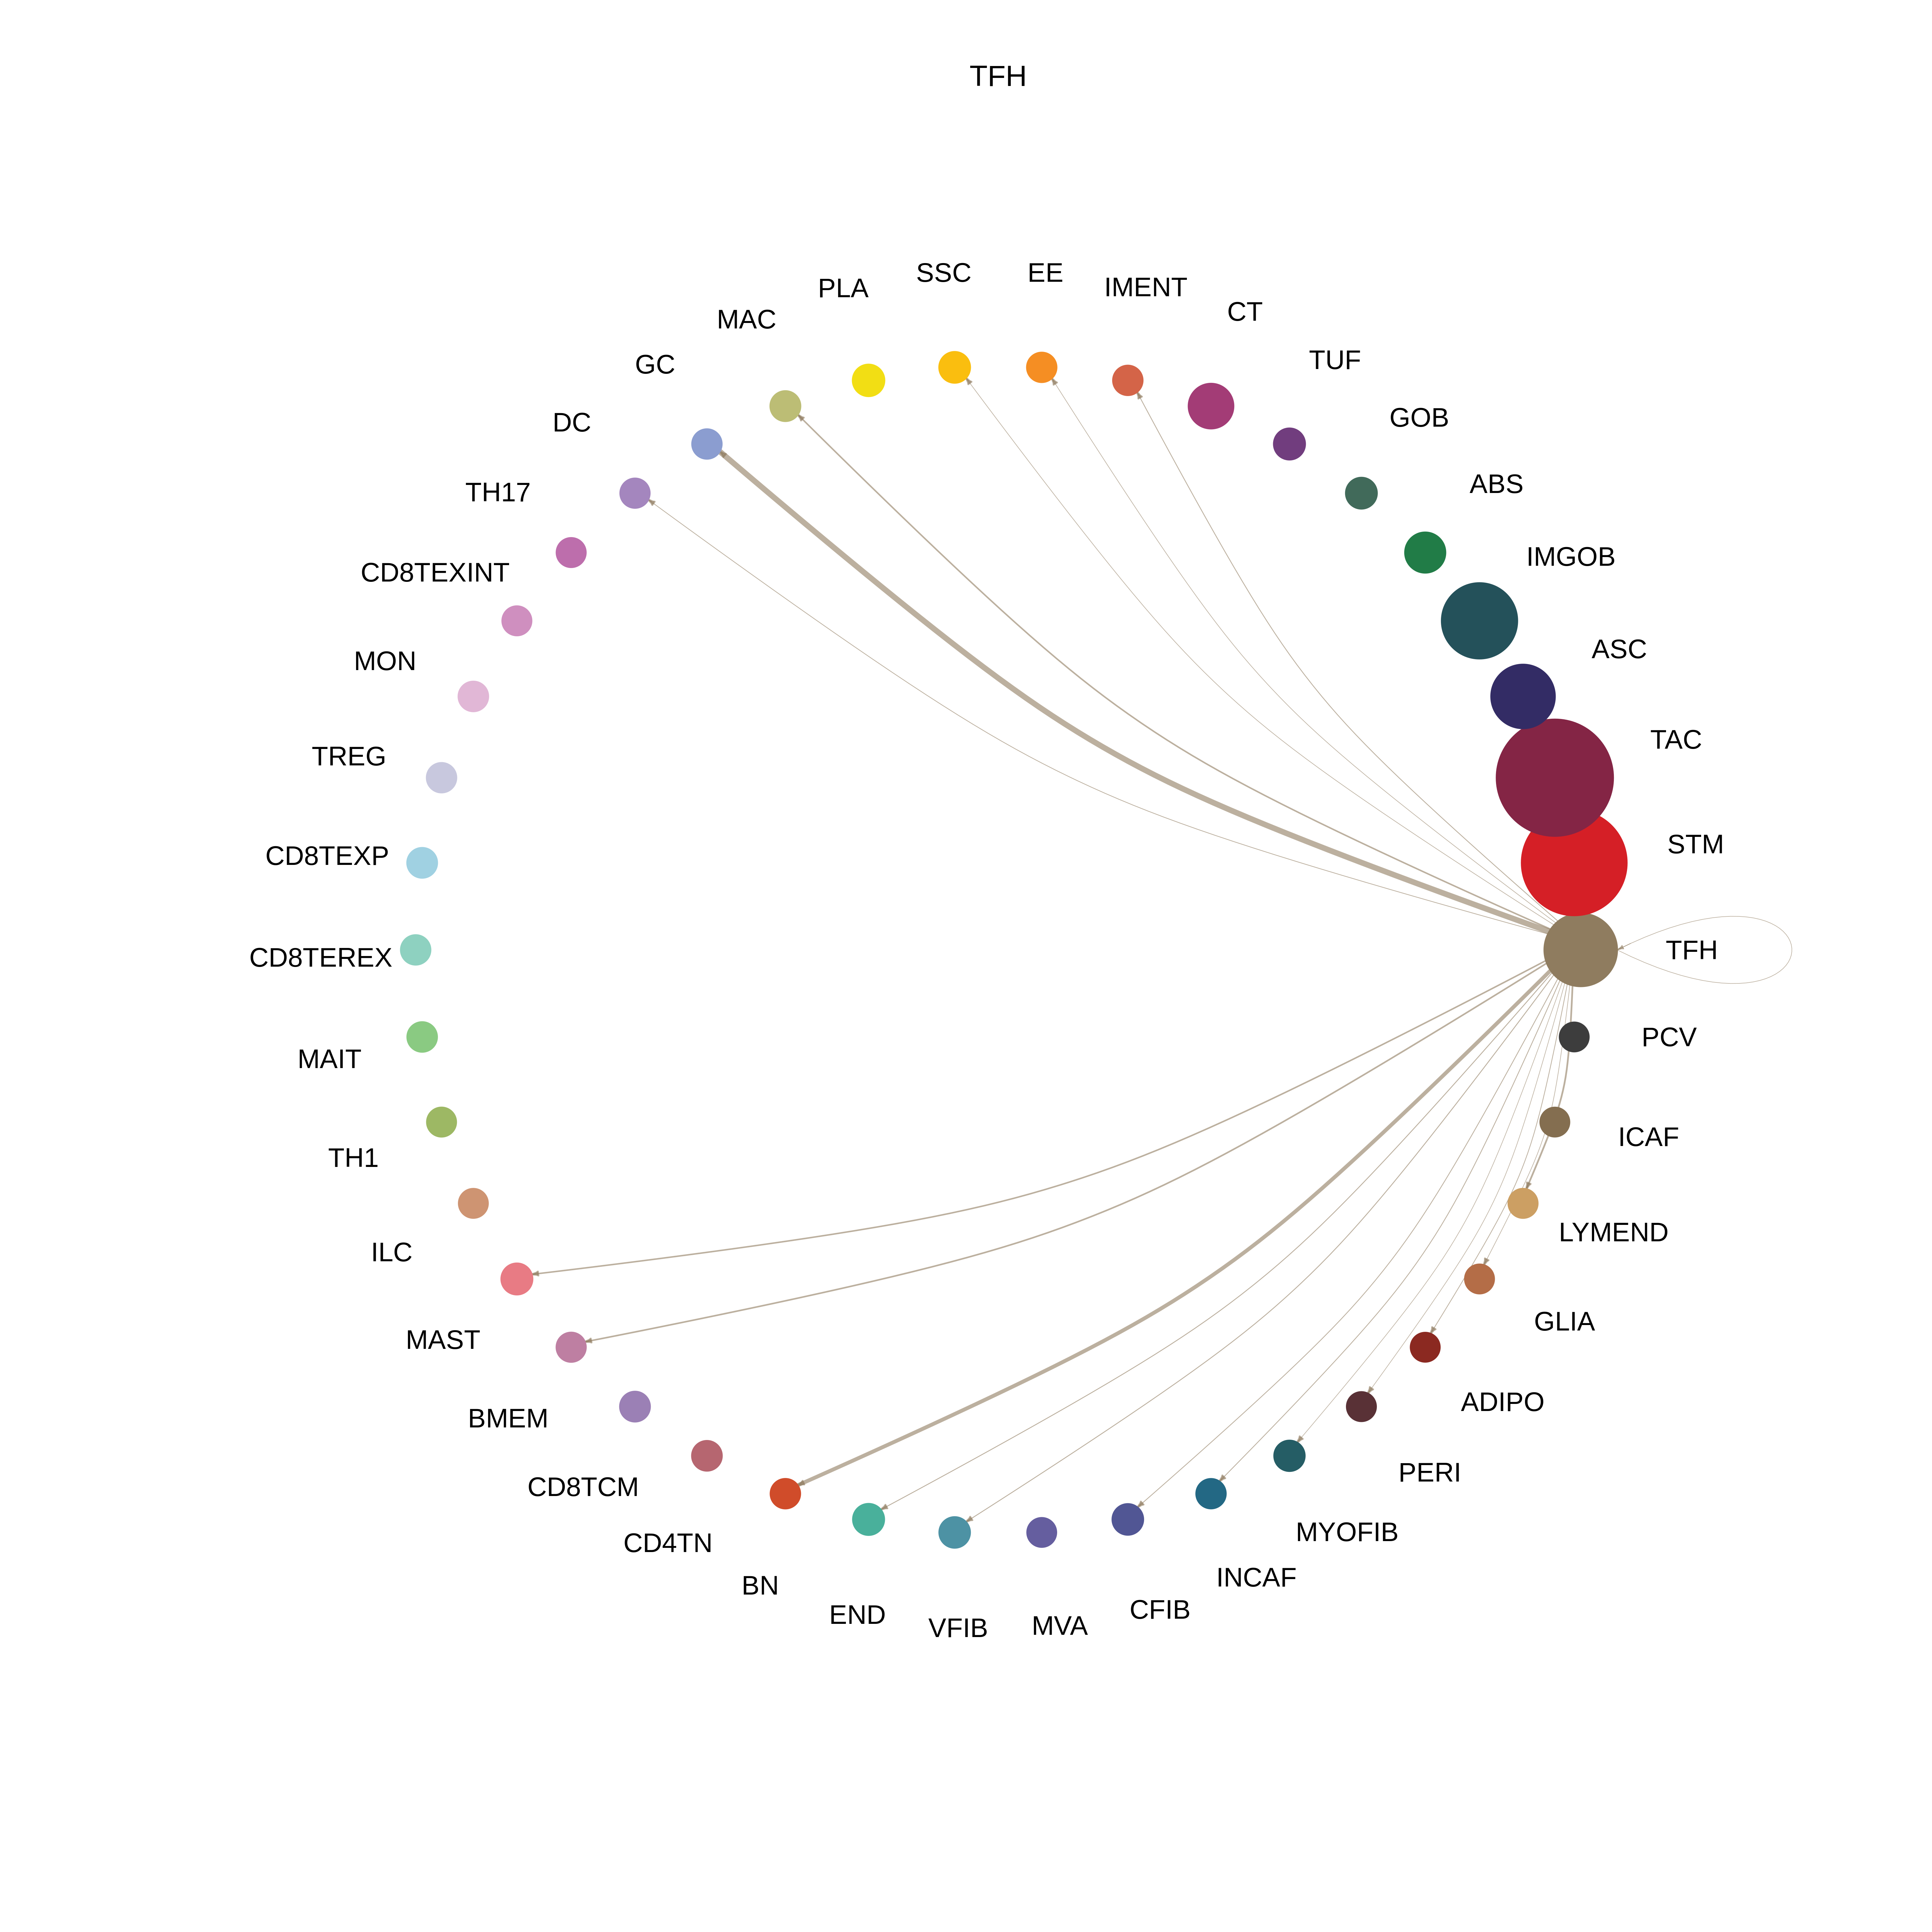 | 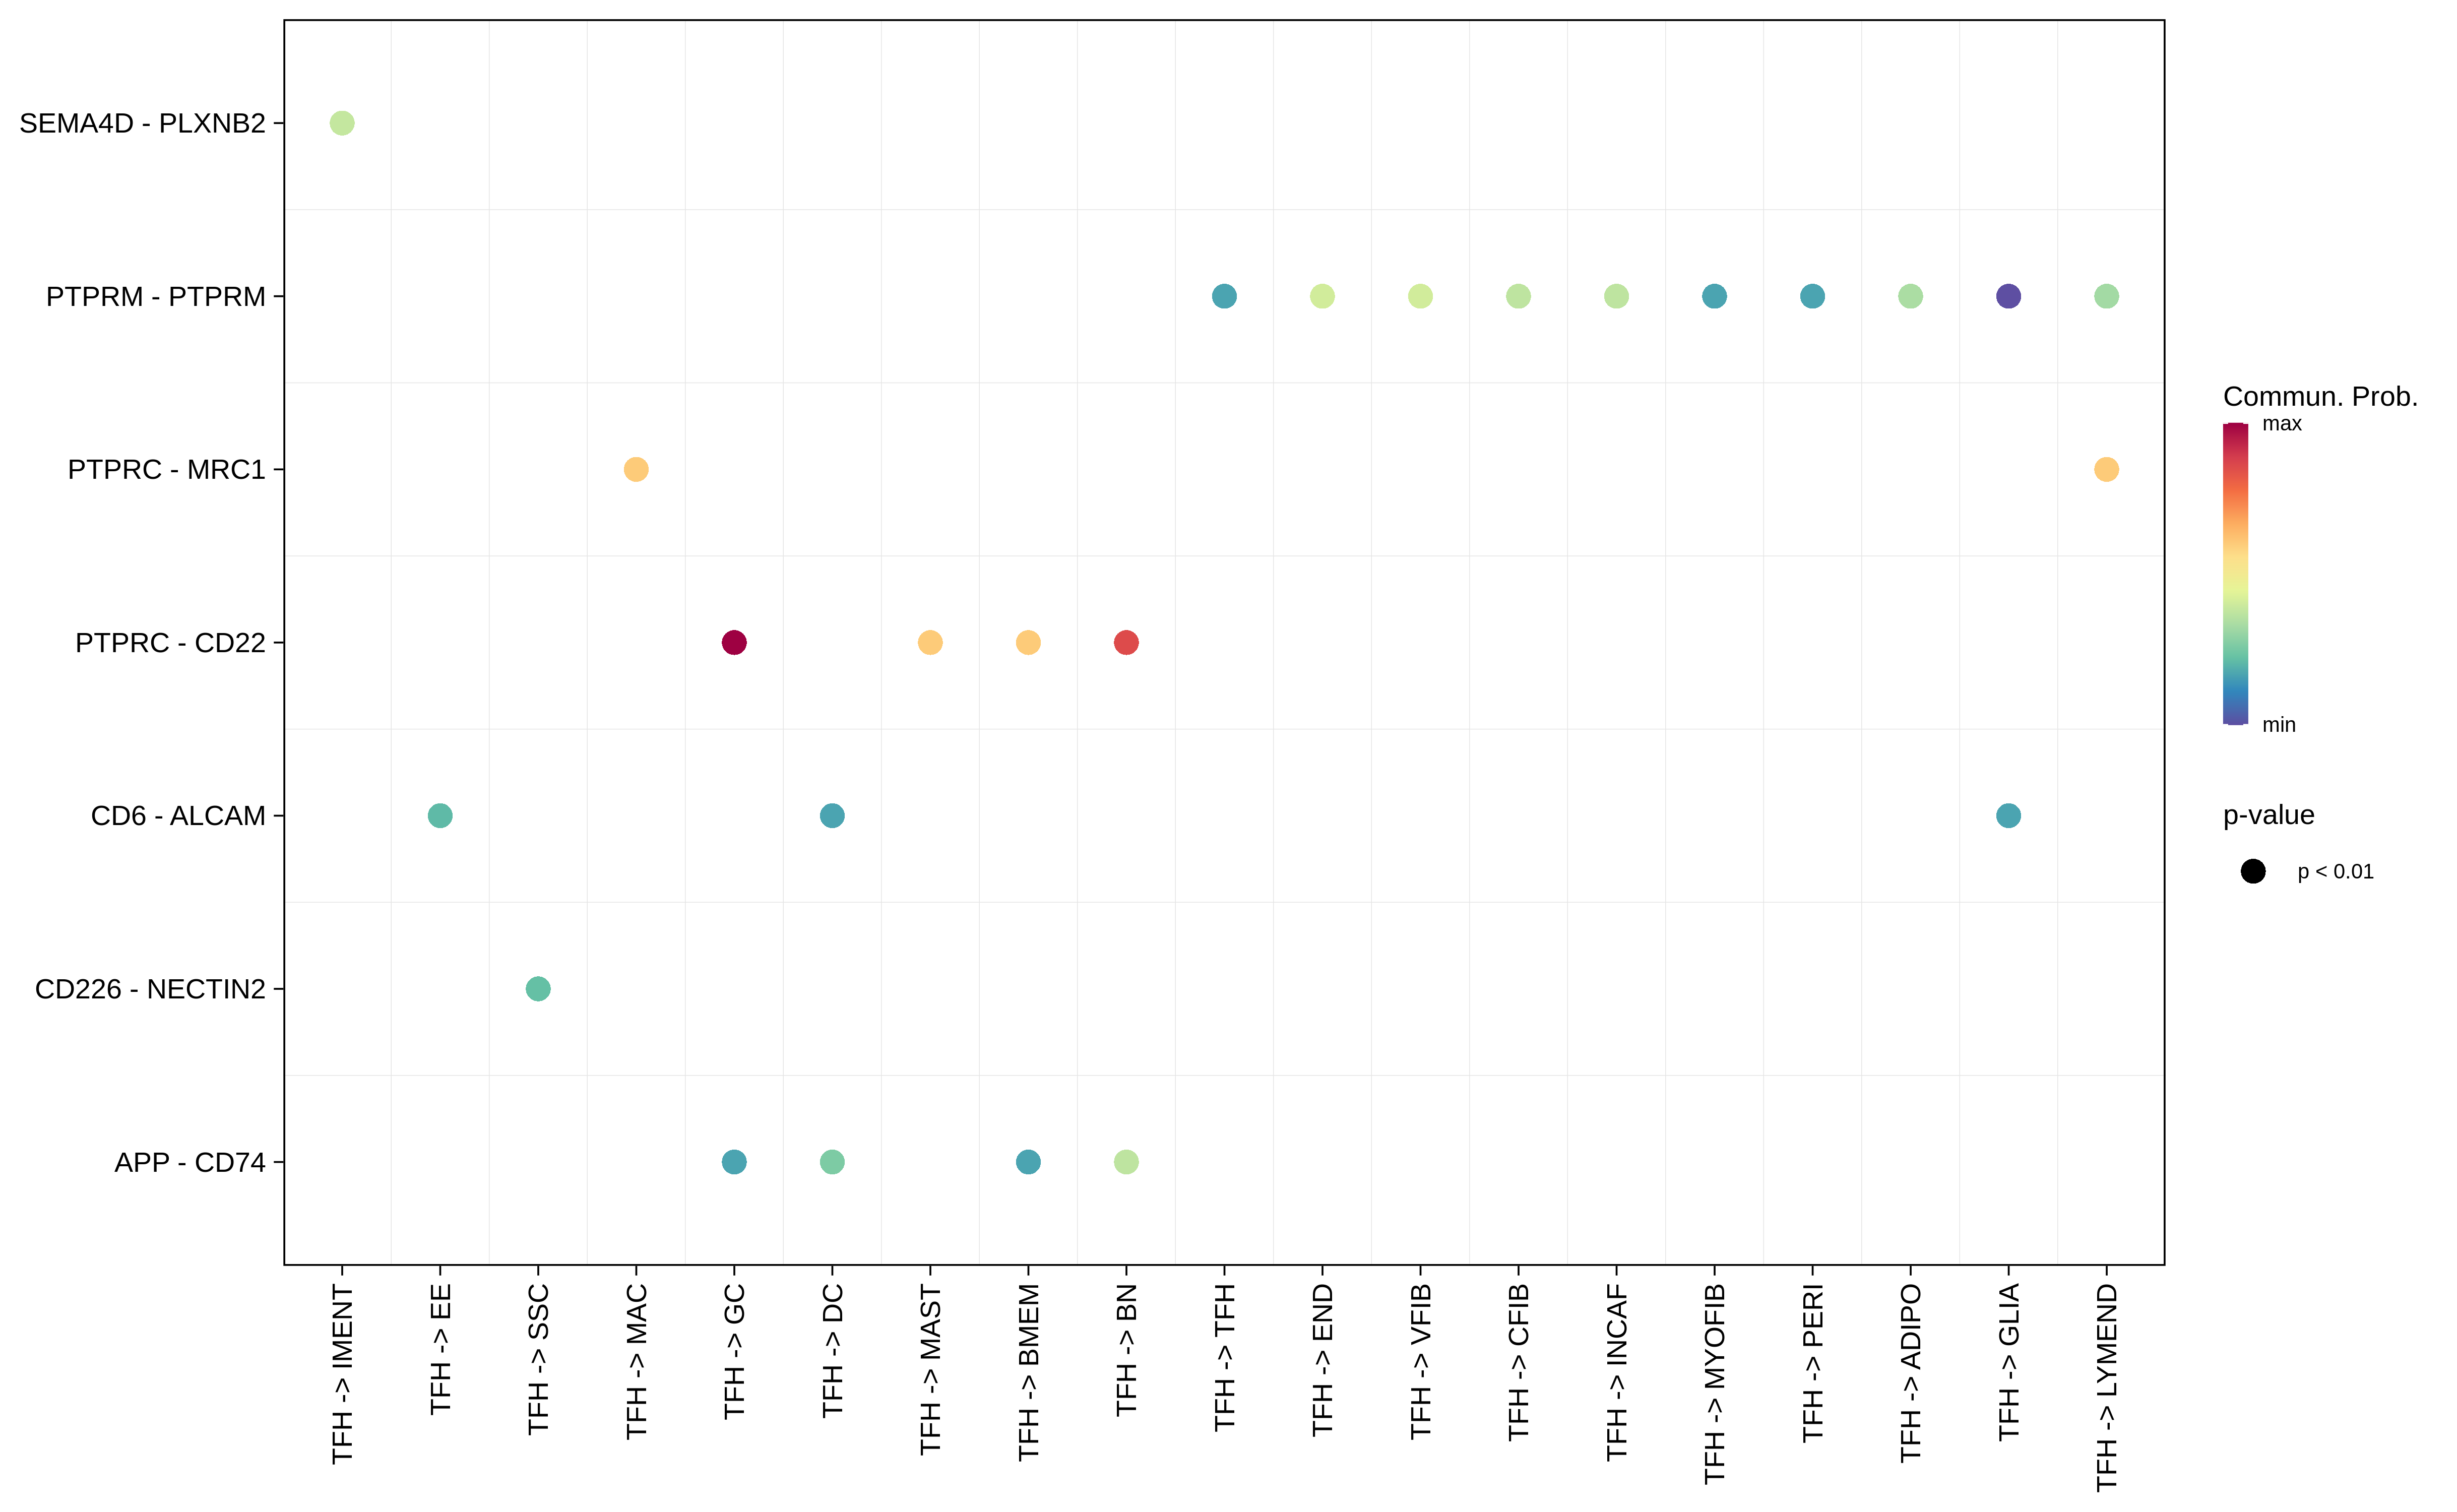 |  |
| Page: 1 2 3 4 5 6 7 8 9 10 11 12 13 14 15 16 17 18 19 20 |
| Disease State | Cell Type | Circle | Source | Target |
| MSI-H | ABS |  |  |  |
| ASC |  |  |  |
| Page: 1 2 3 4 5 6 7 8 9 10 |
| Disease State | Cell Type | Circle | Source | Target |
| MSS | ABS |  | 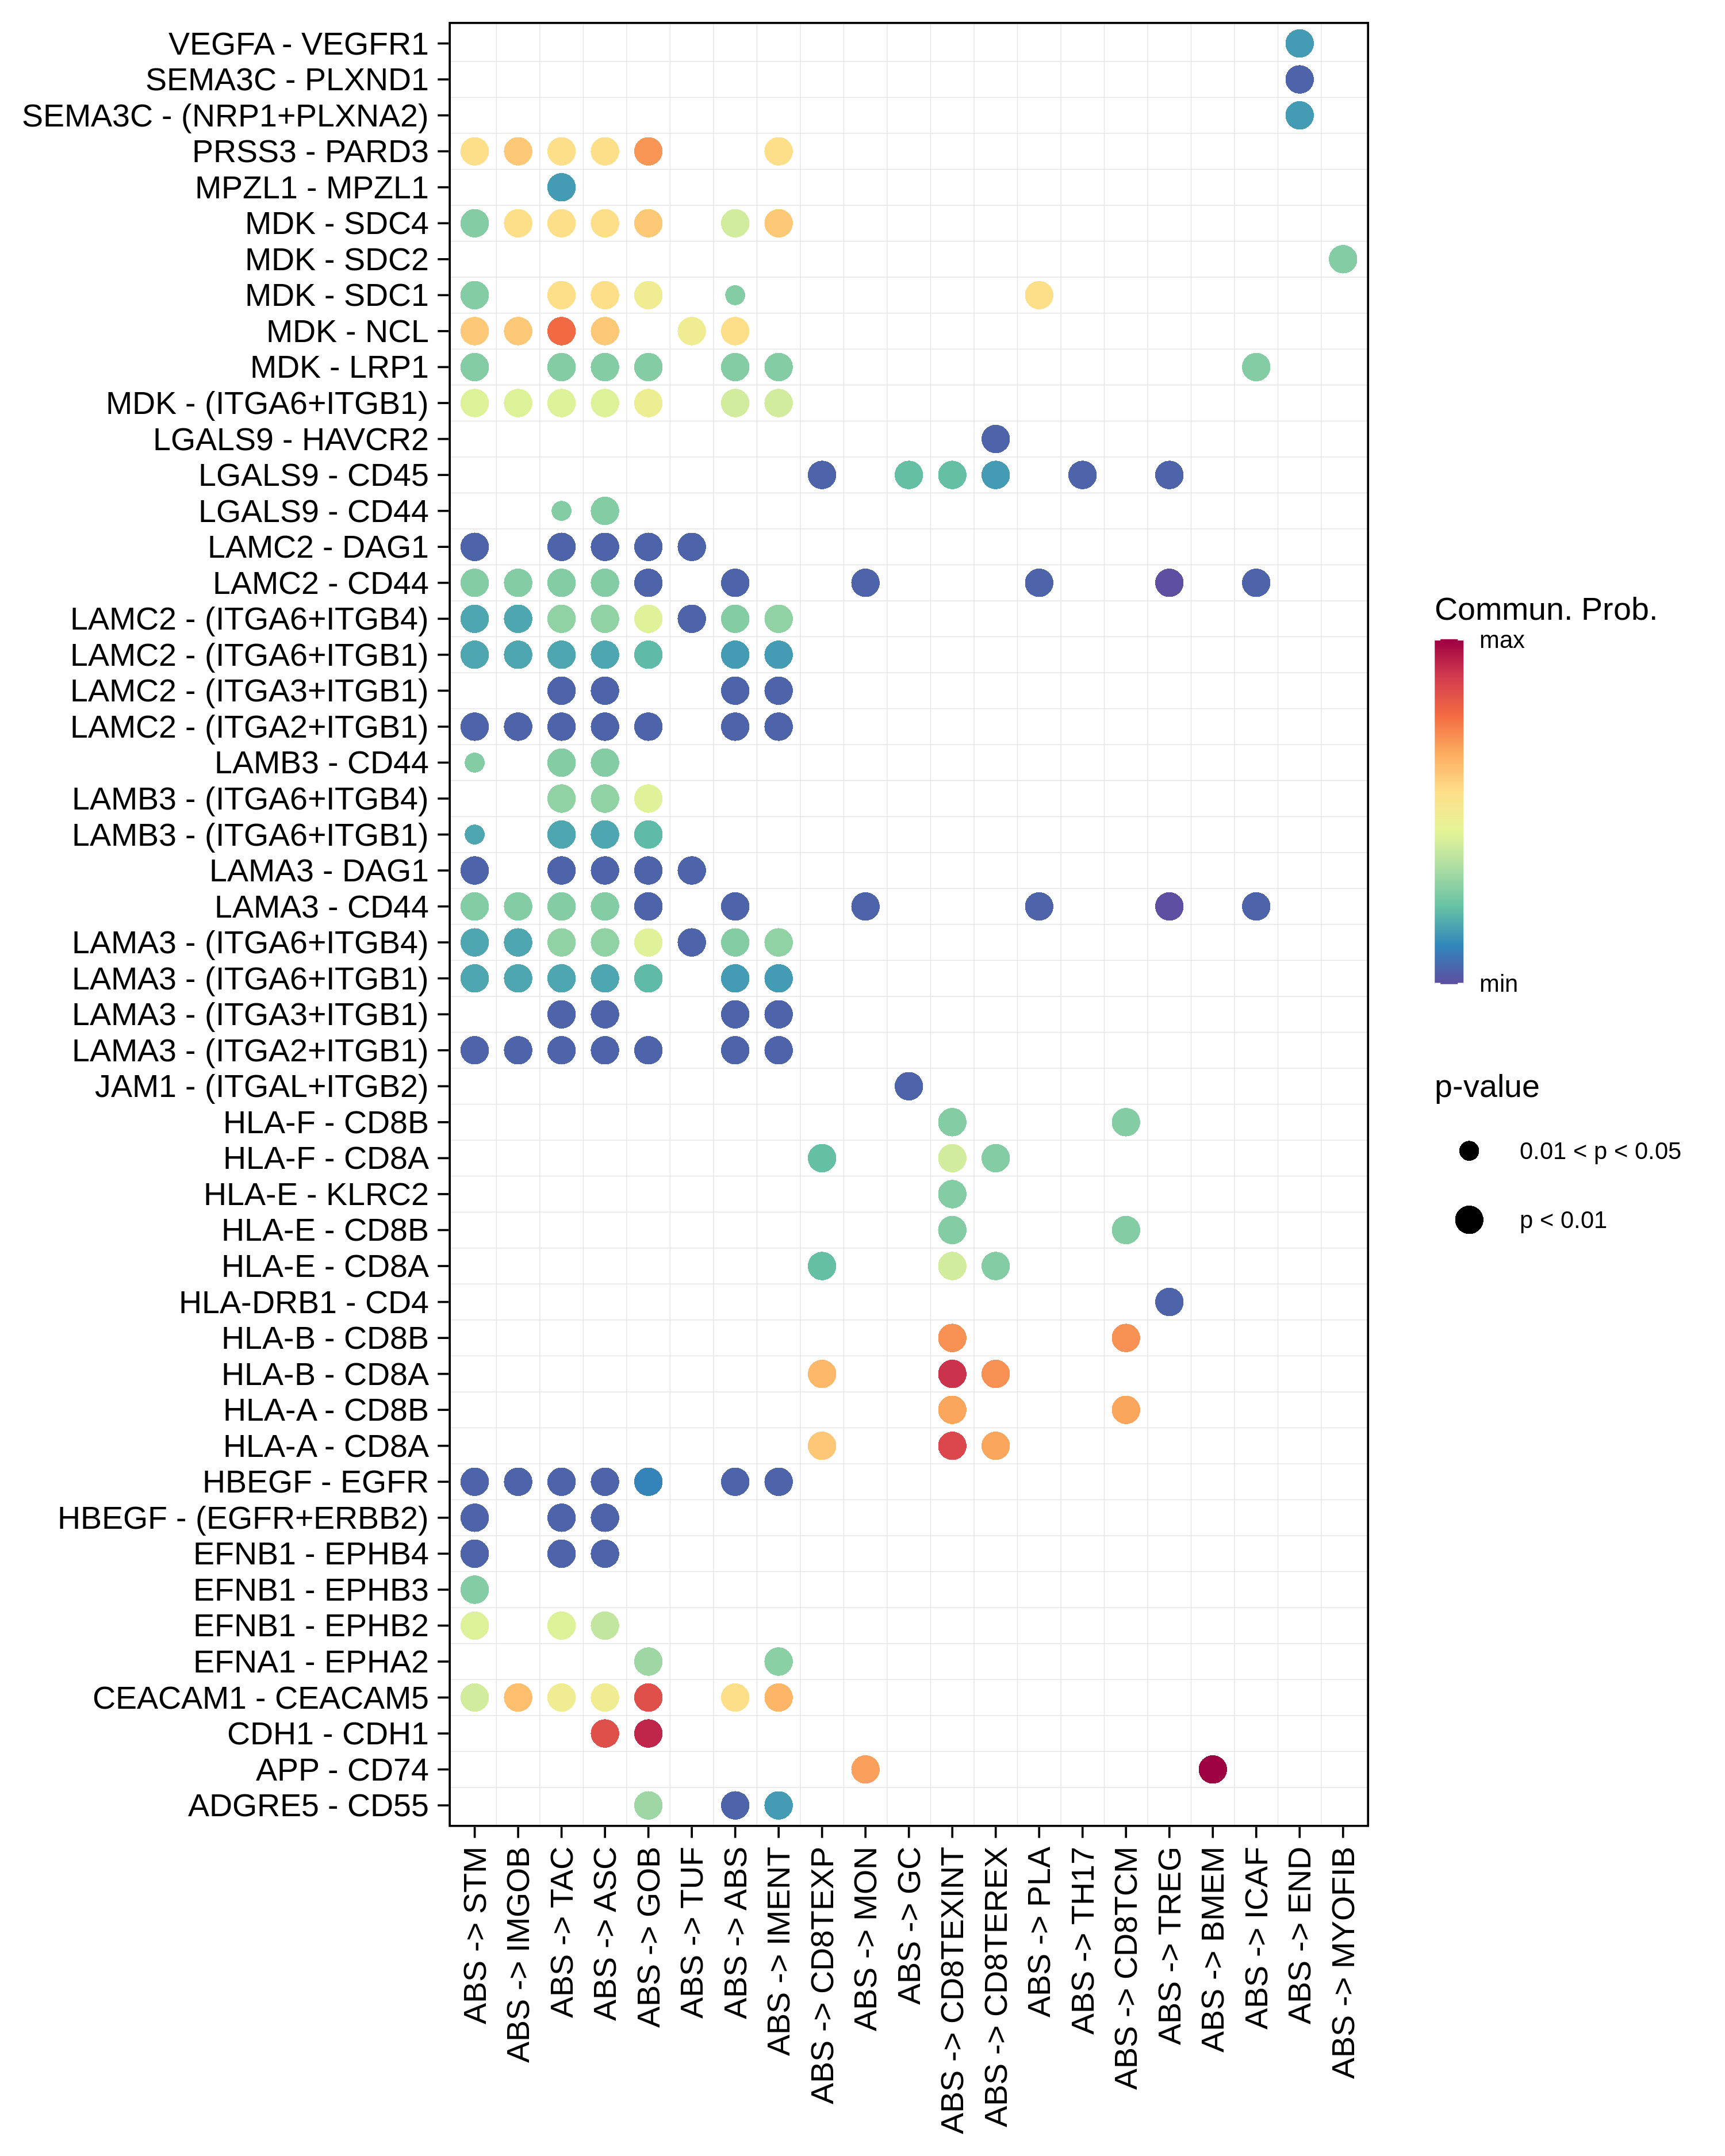 | 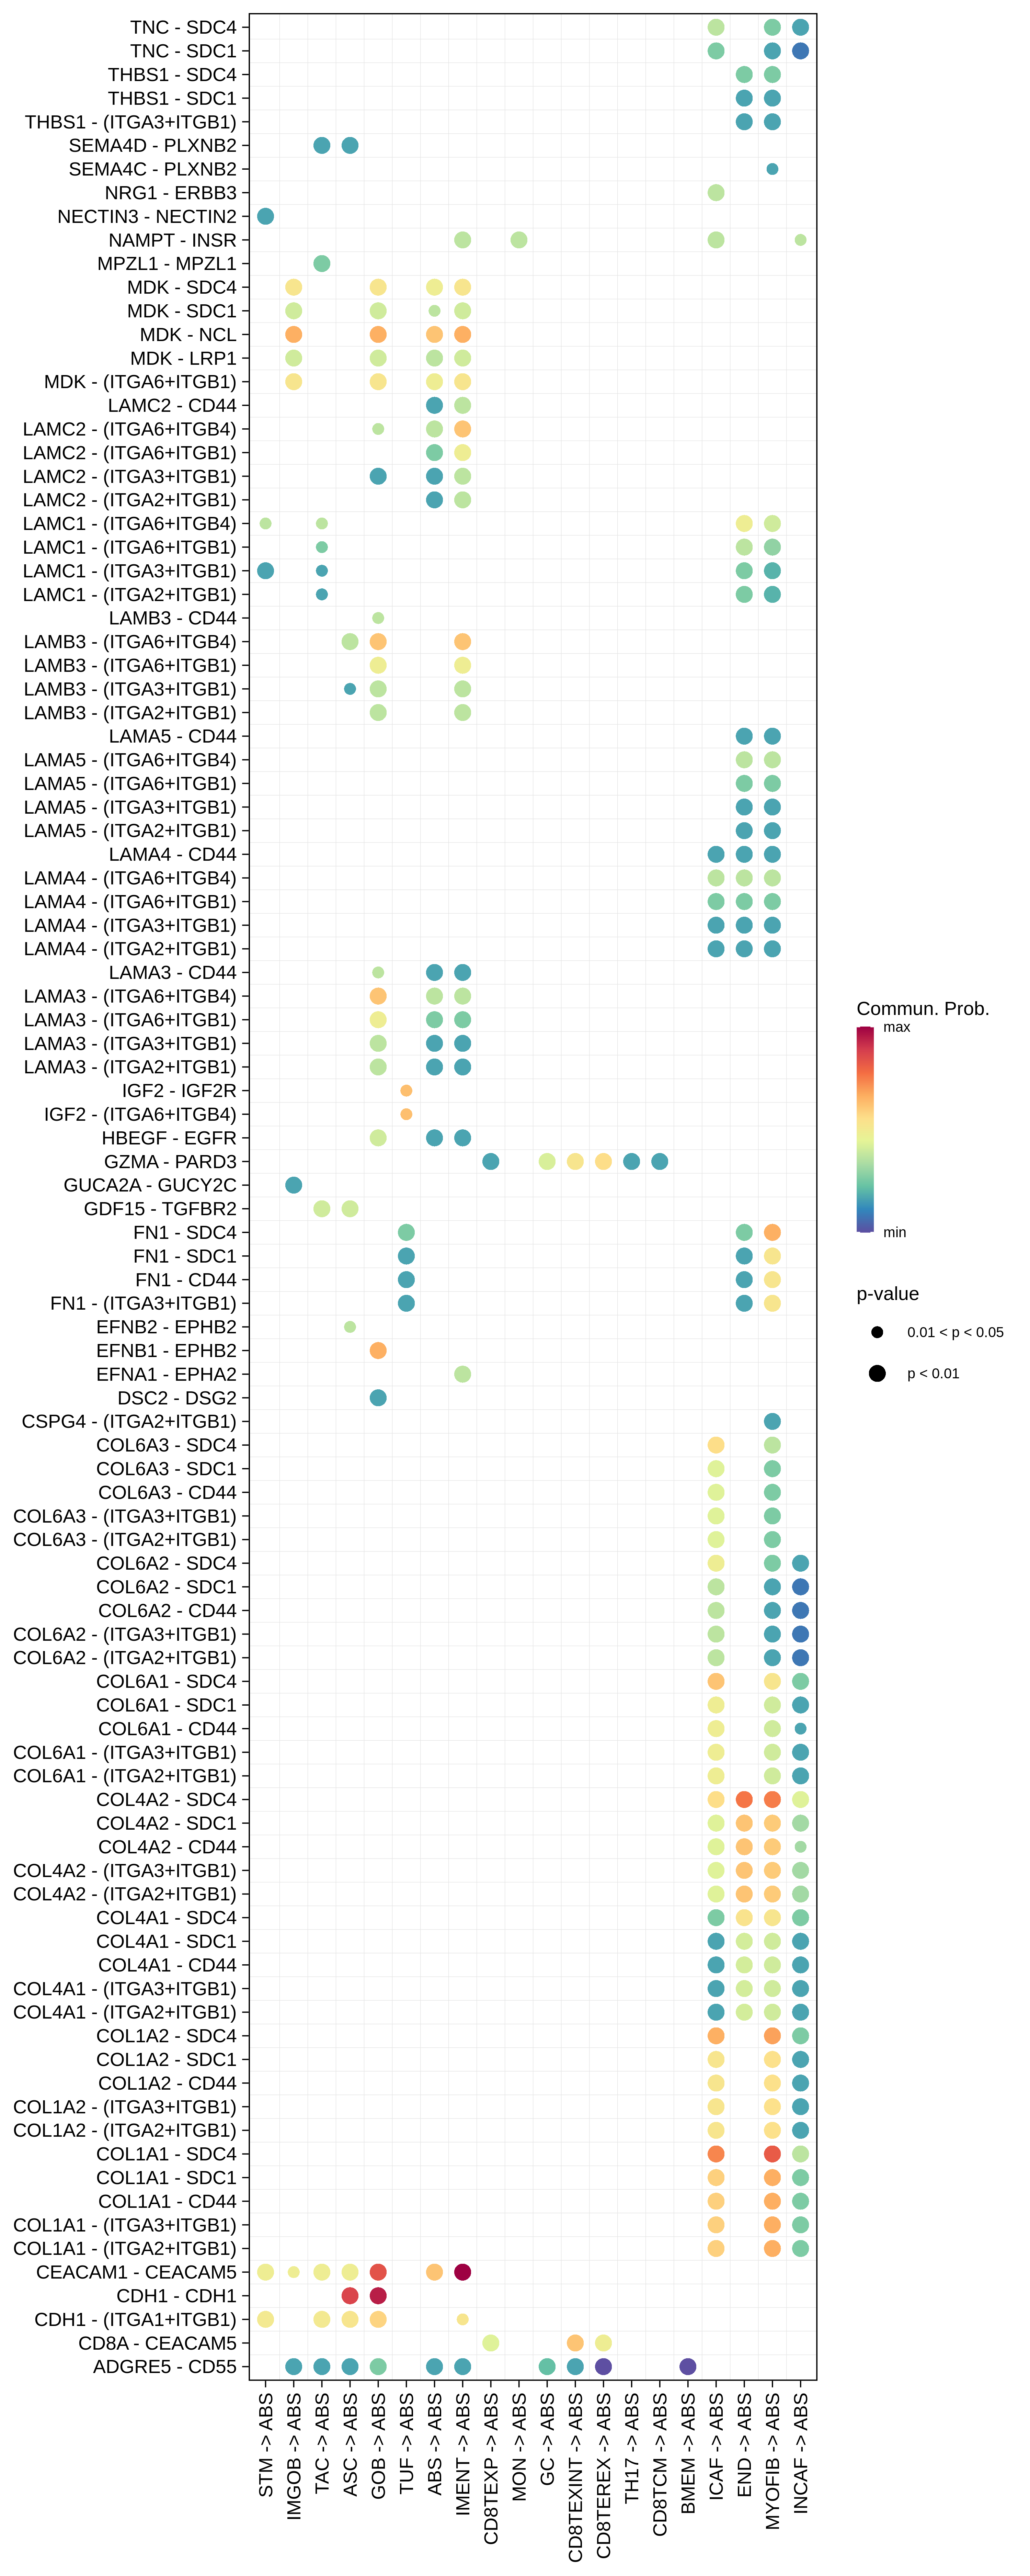 |
| ASC | 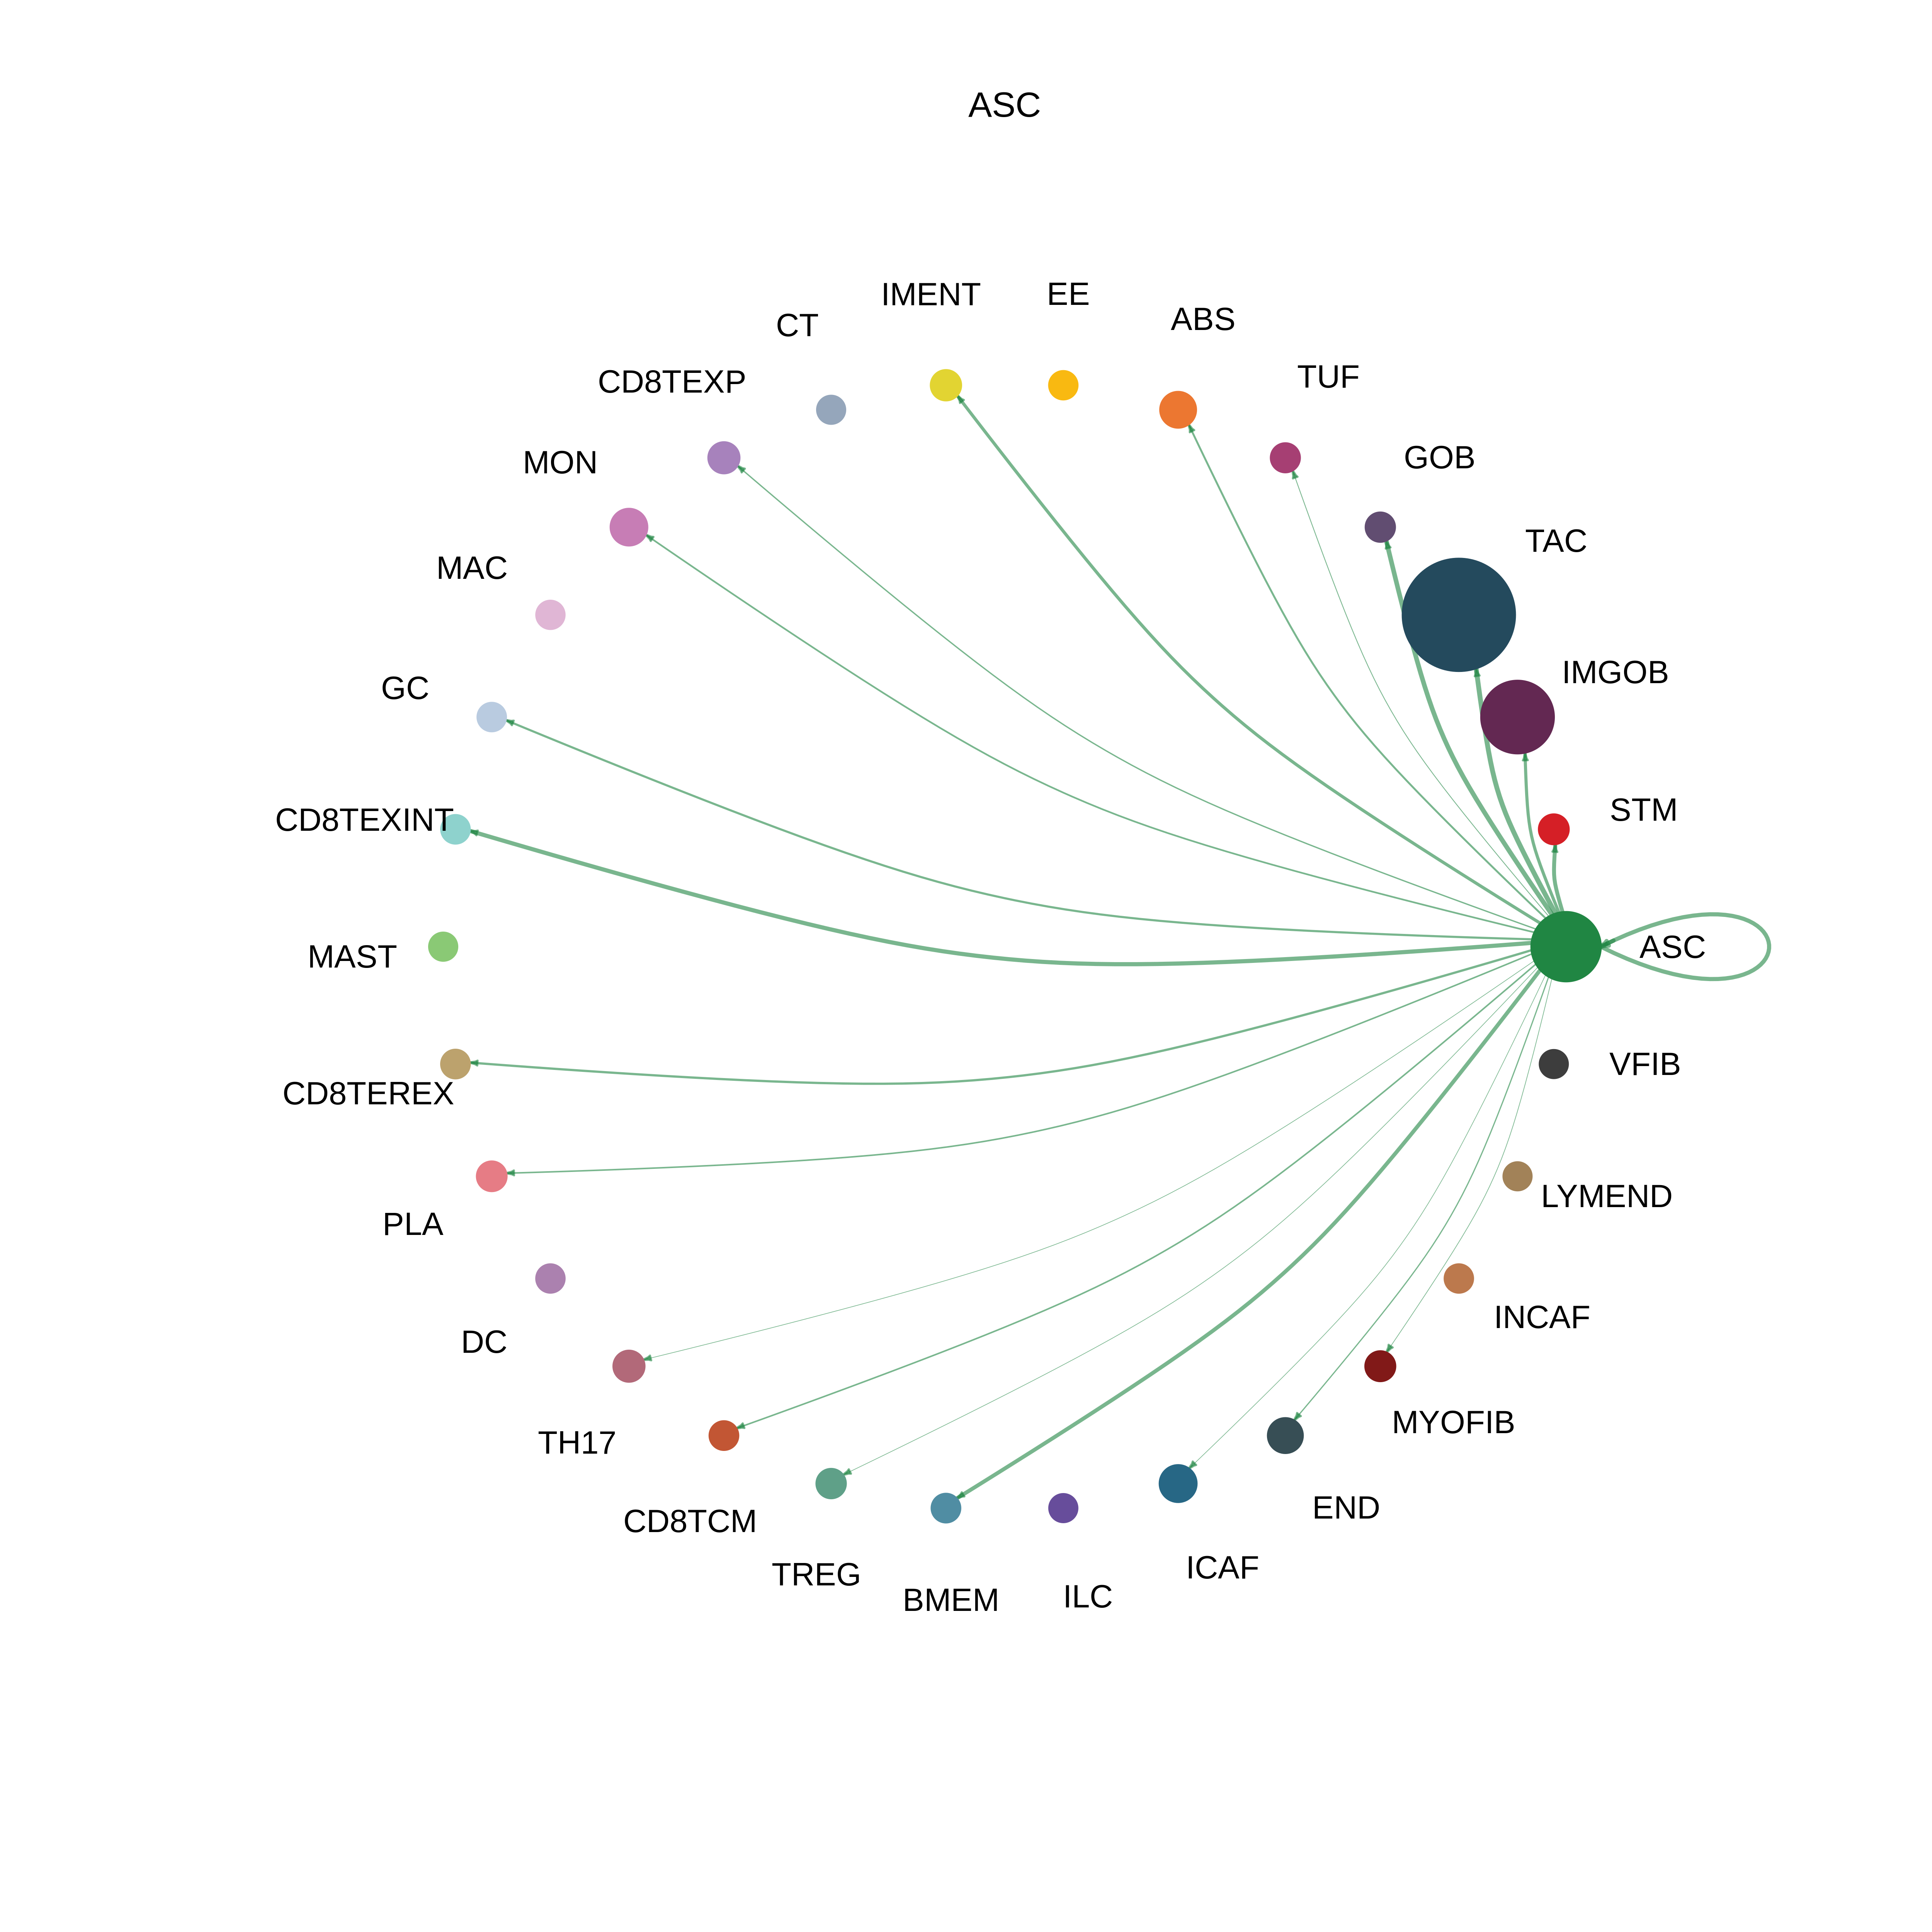 | 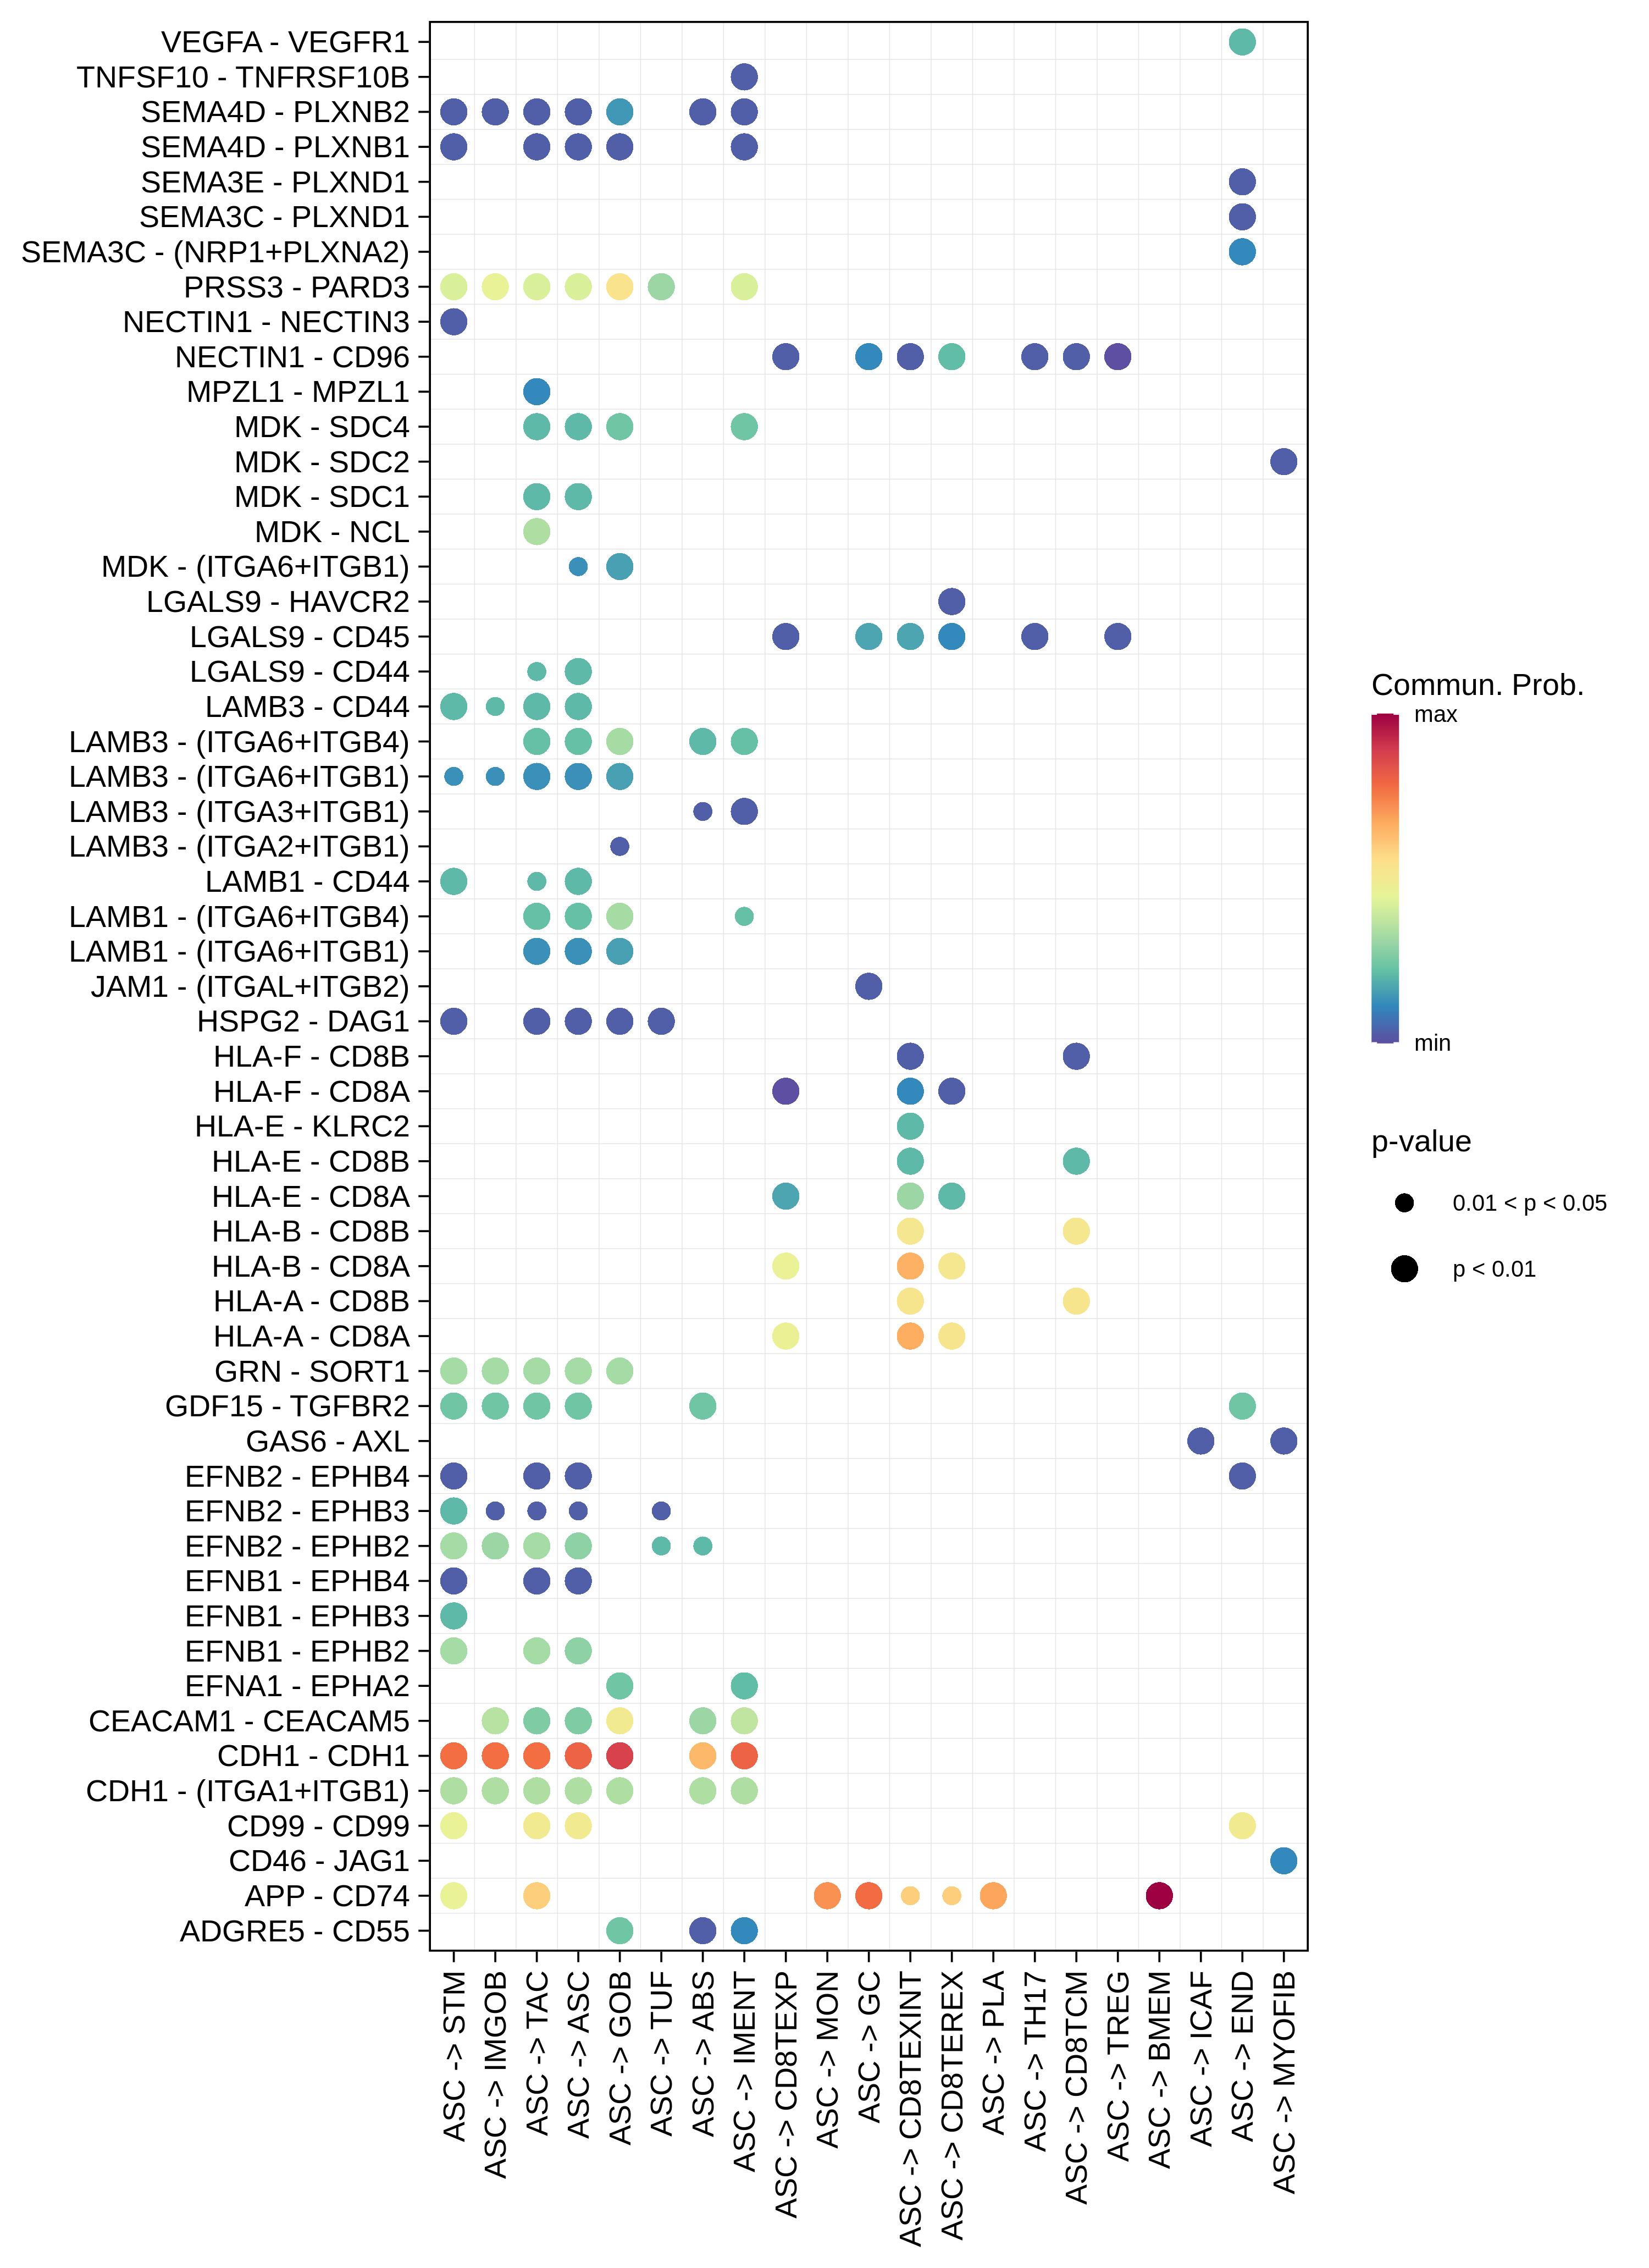 |  |
| Page: 1 2 3 4 5 6 7 8 9 10 11 |
| Disease State | Cell Type | Circle | Source | Target |
| CRC | ABS |  |  |  |
| ADIPO | 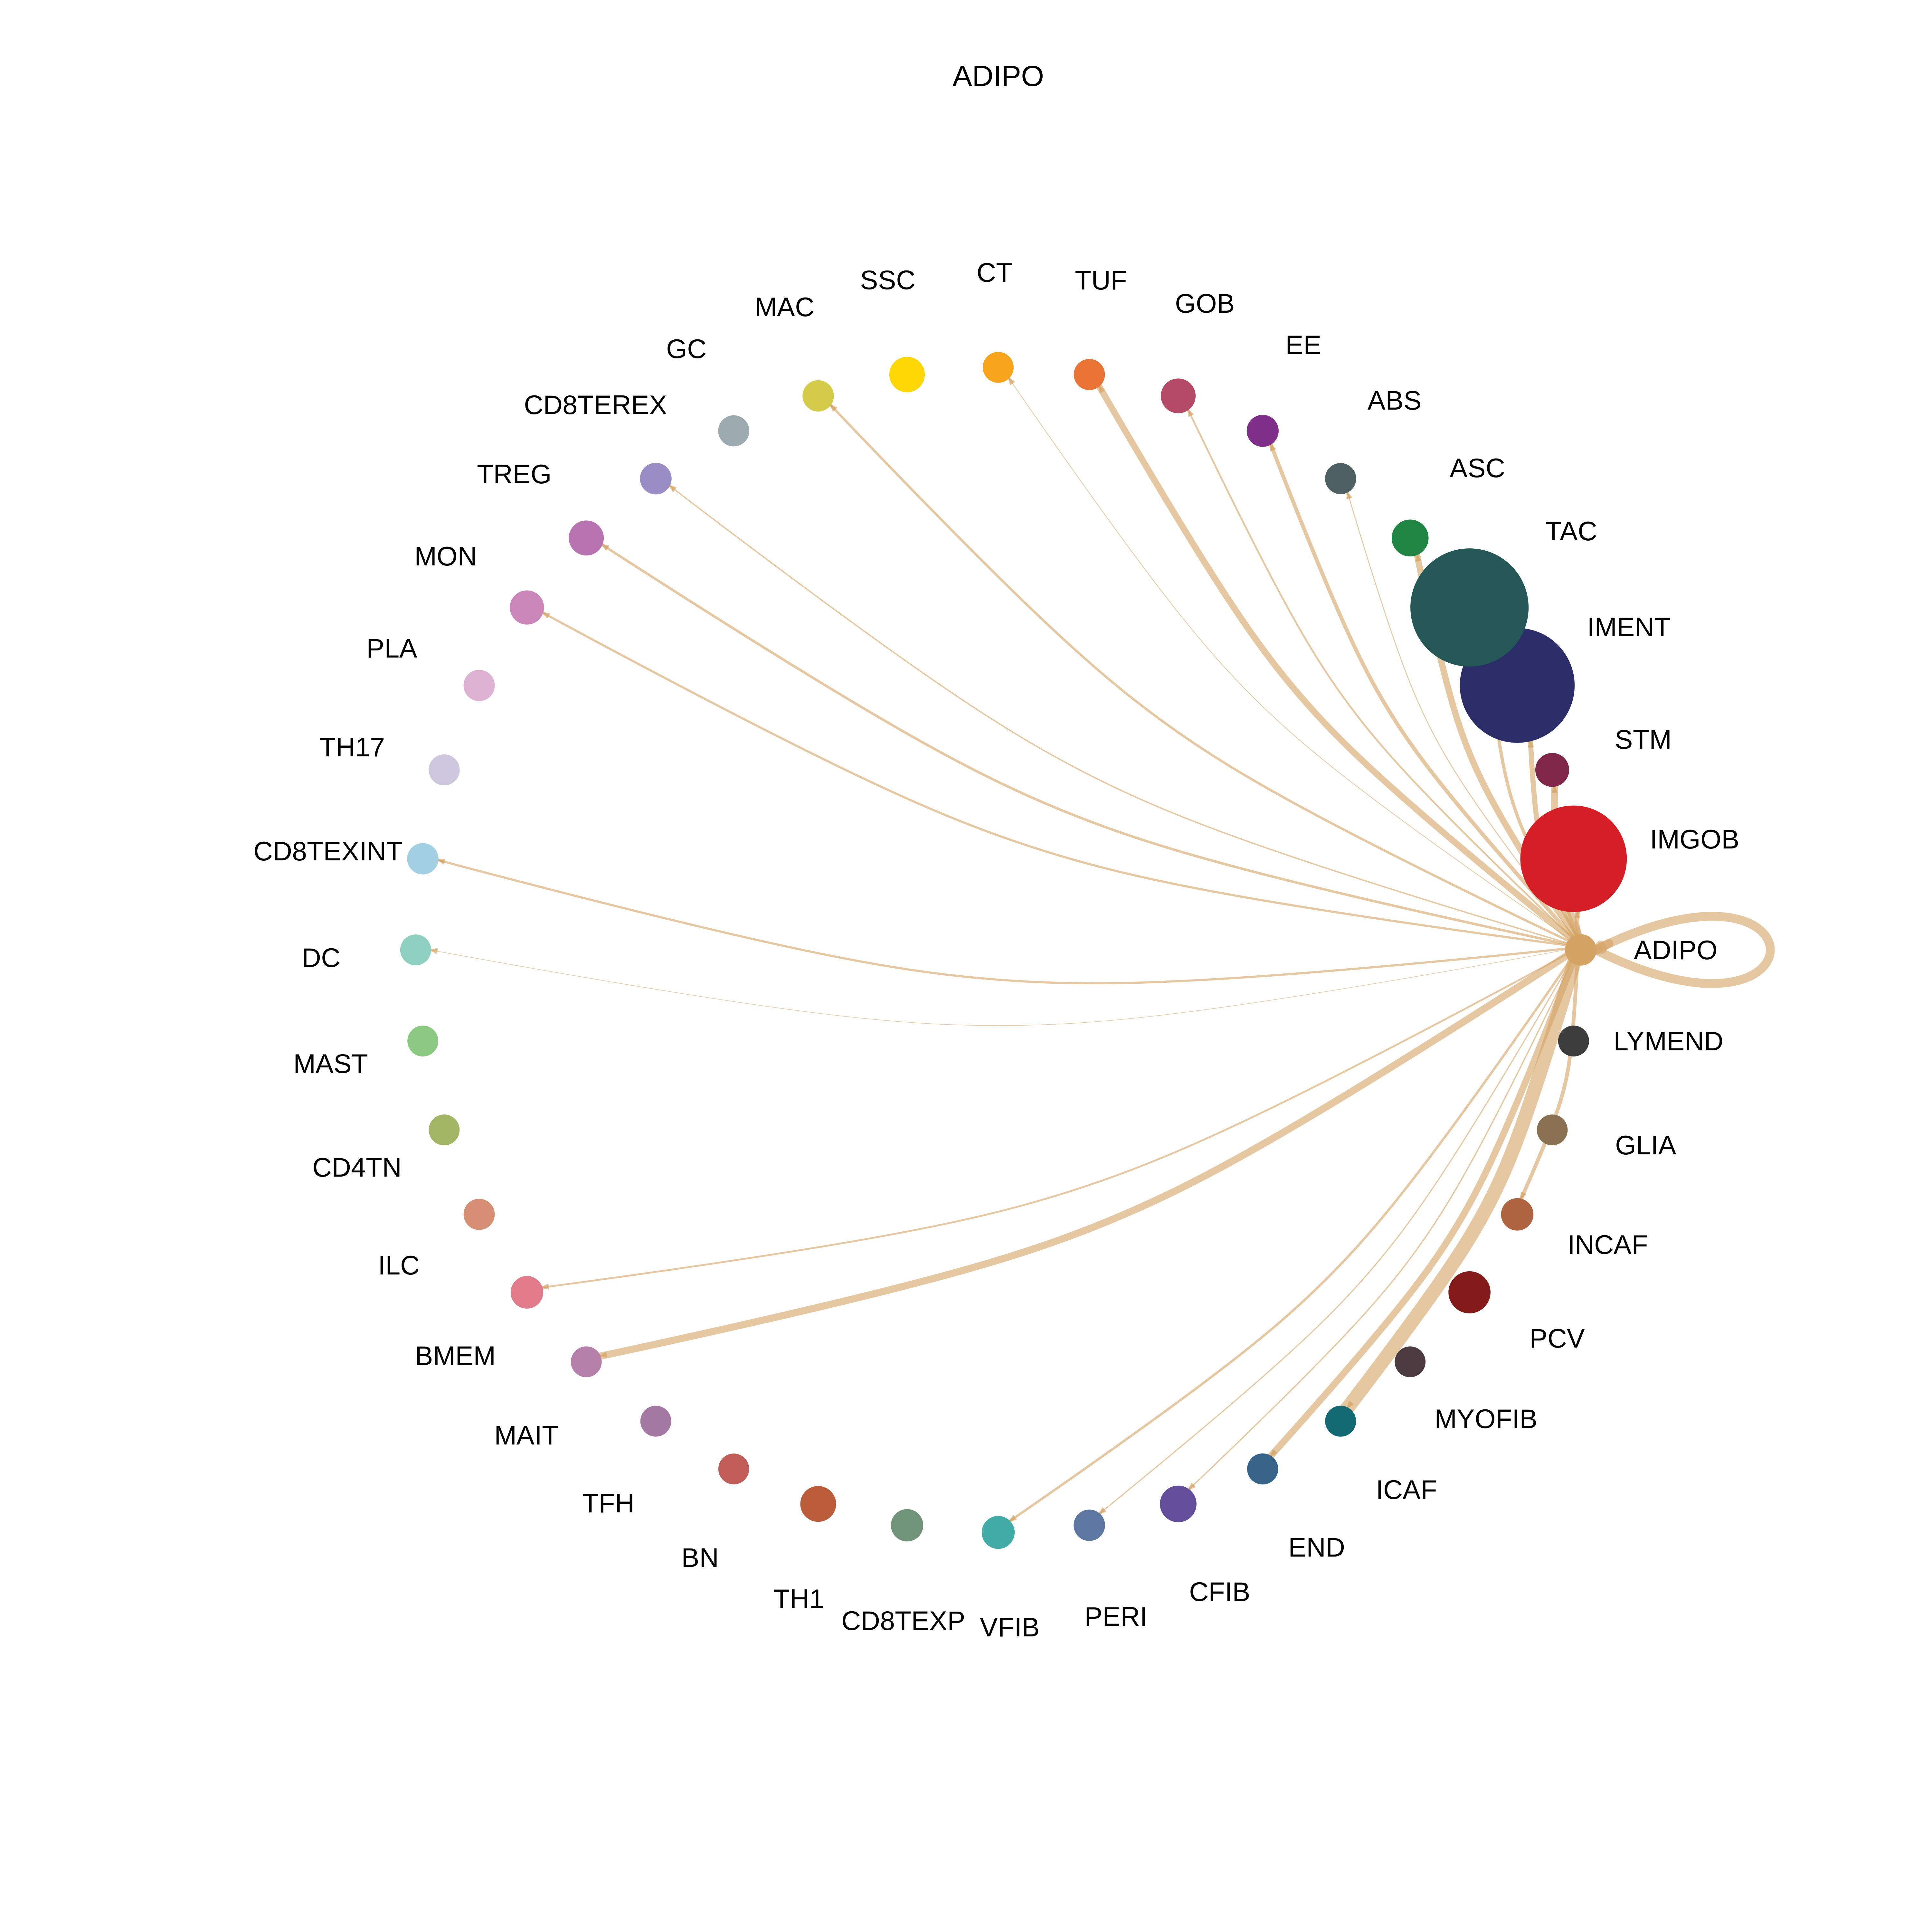 | 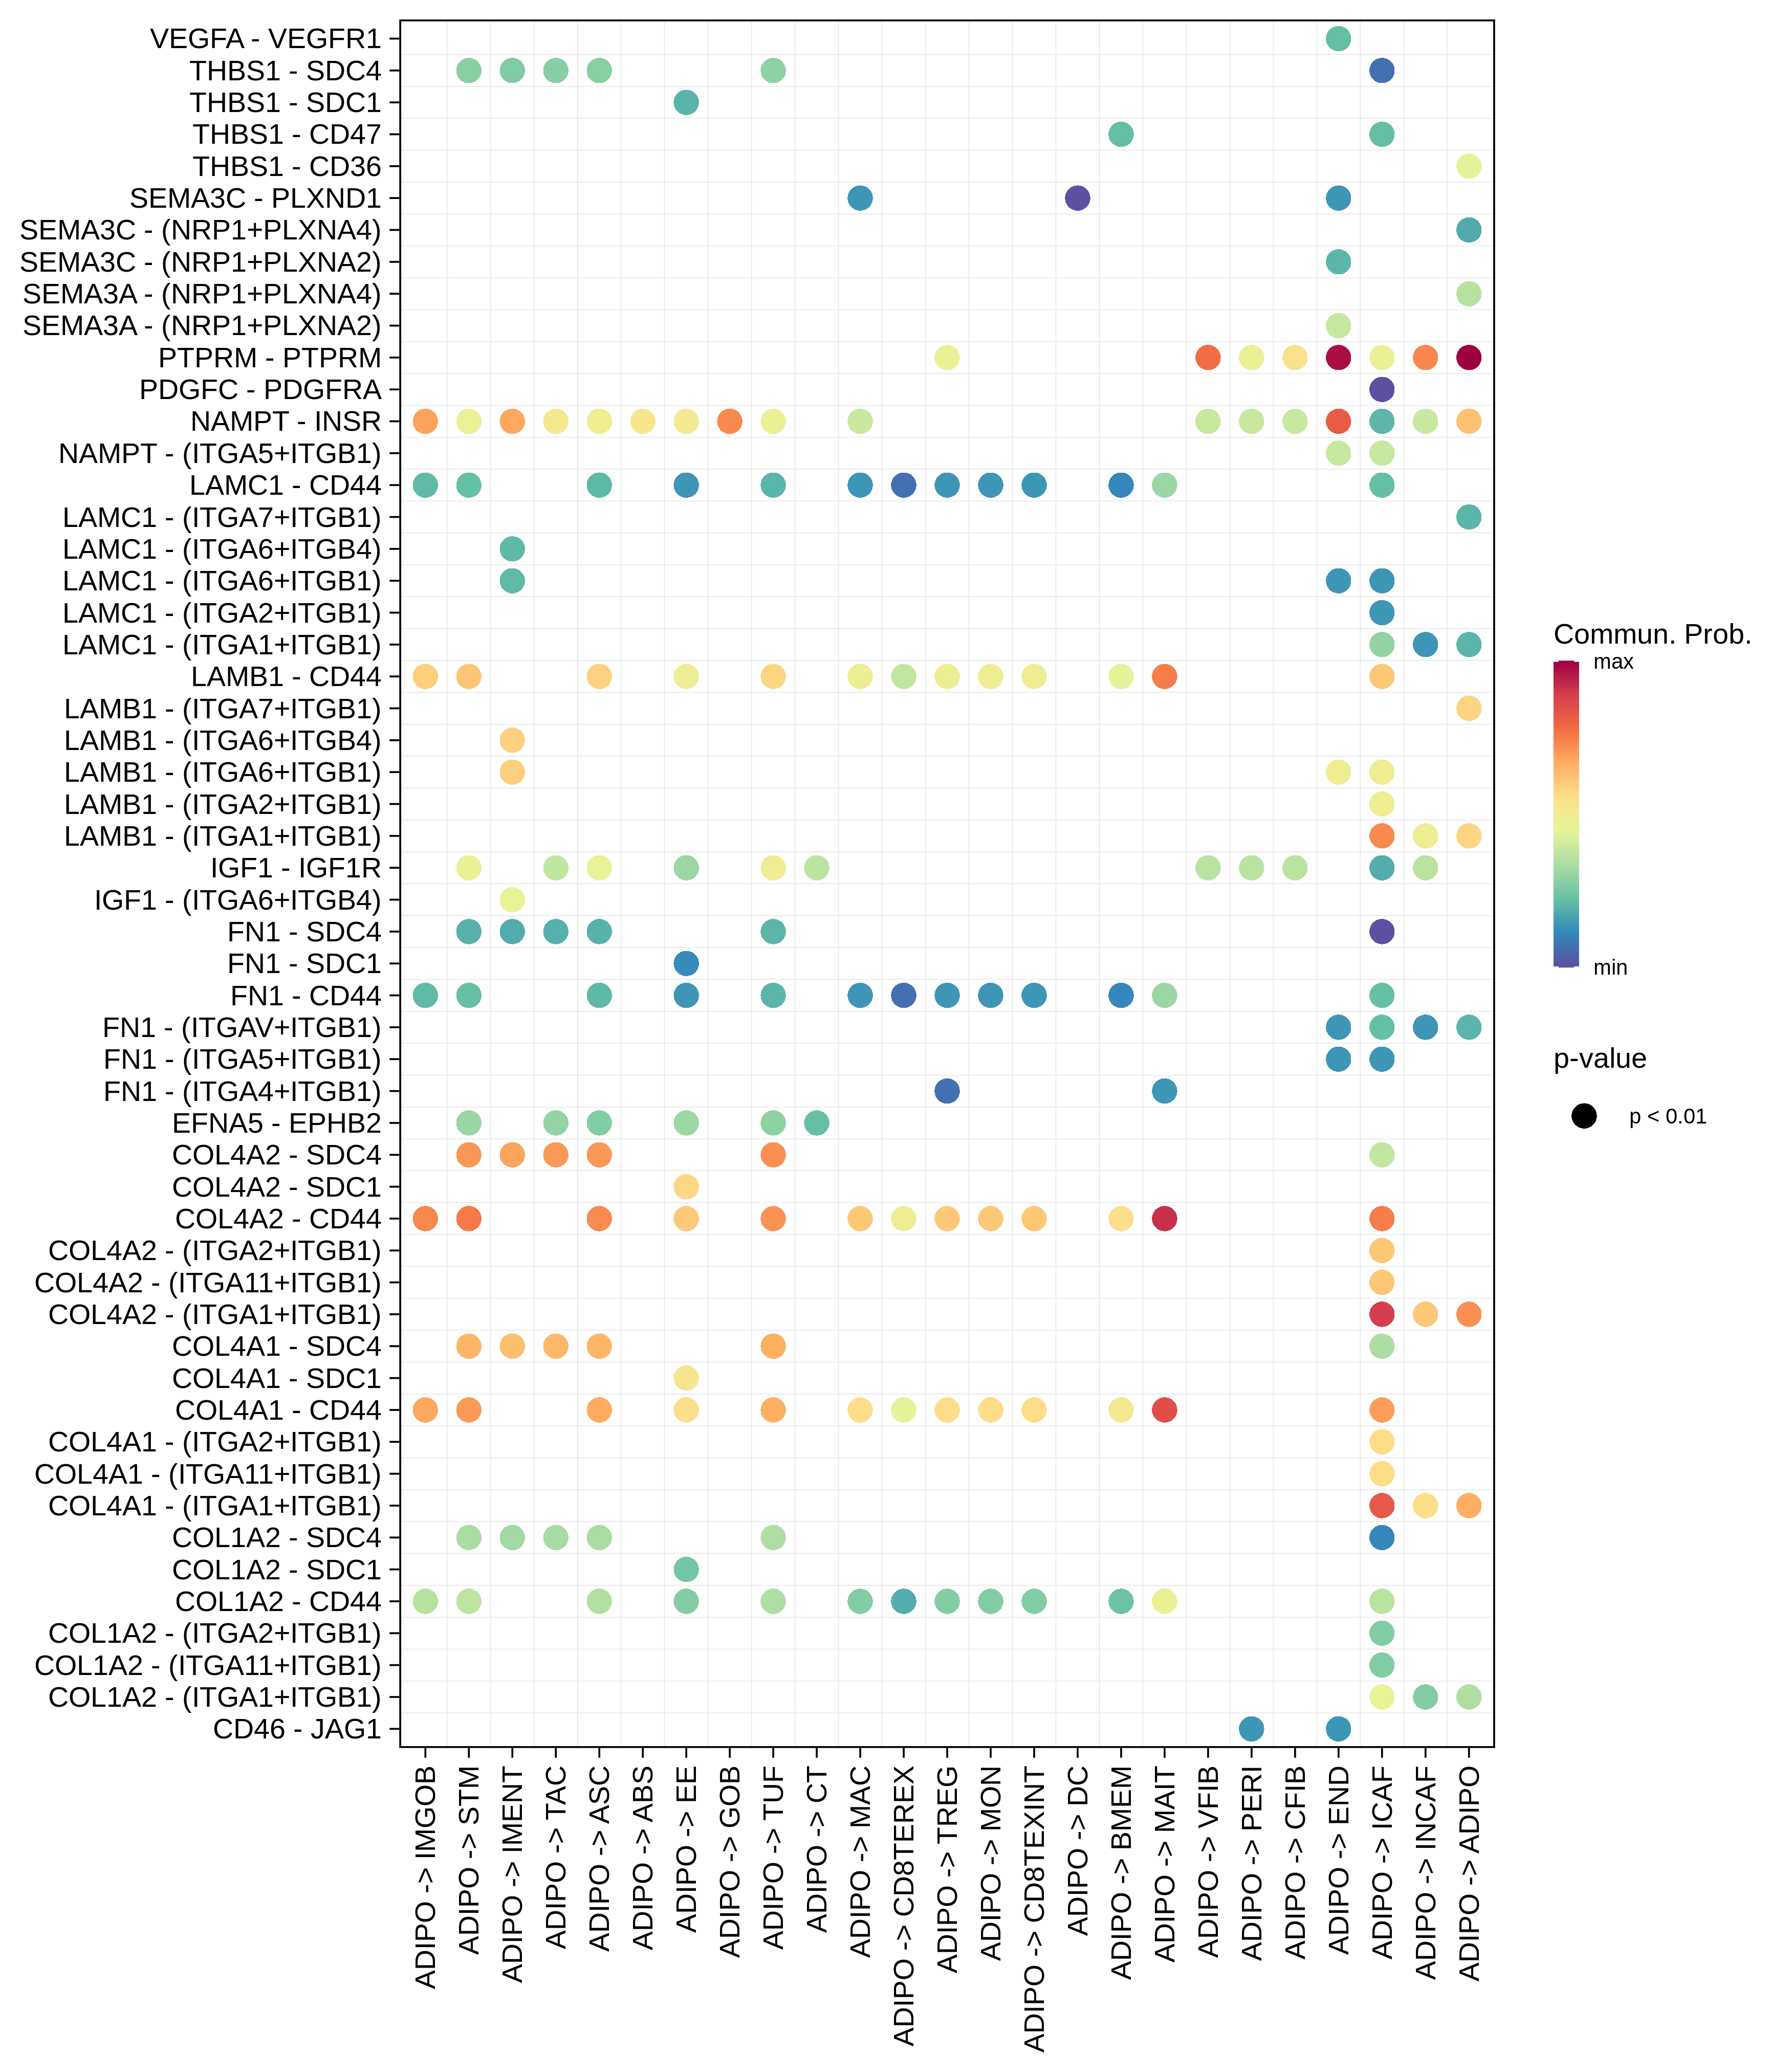 | 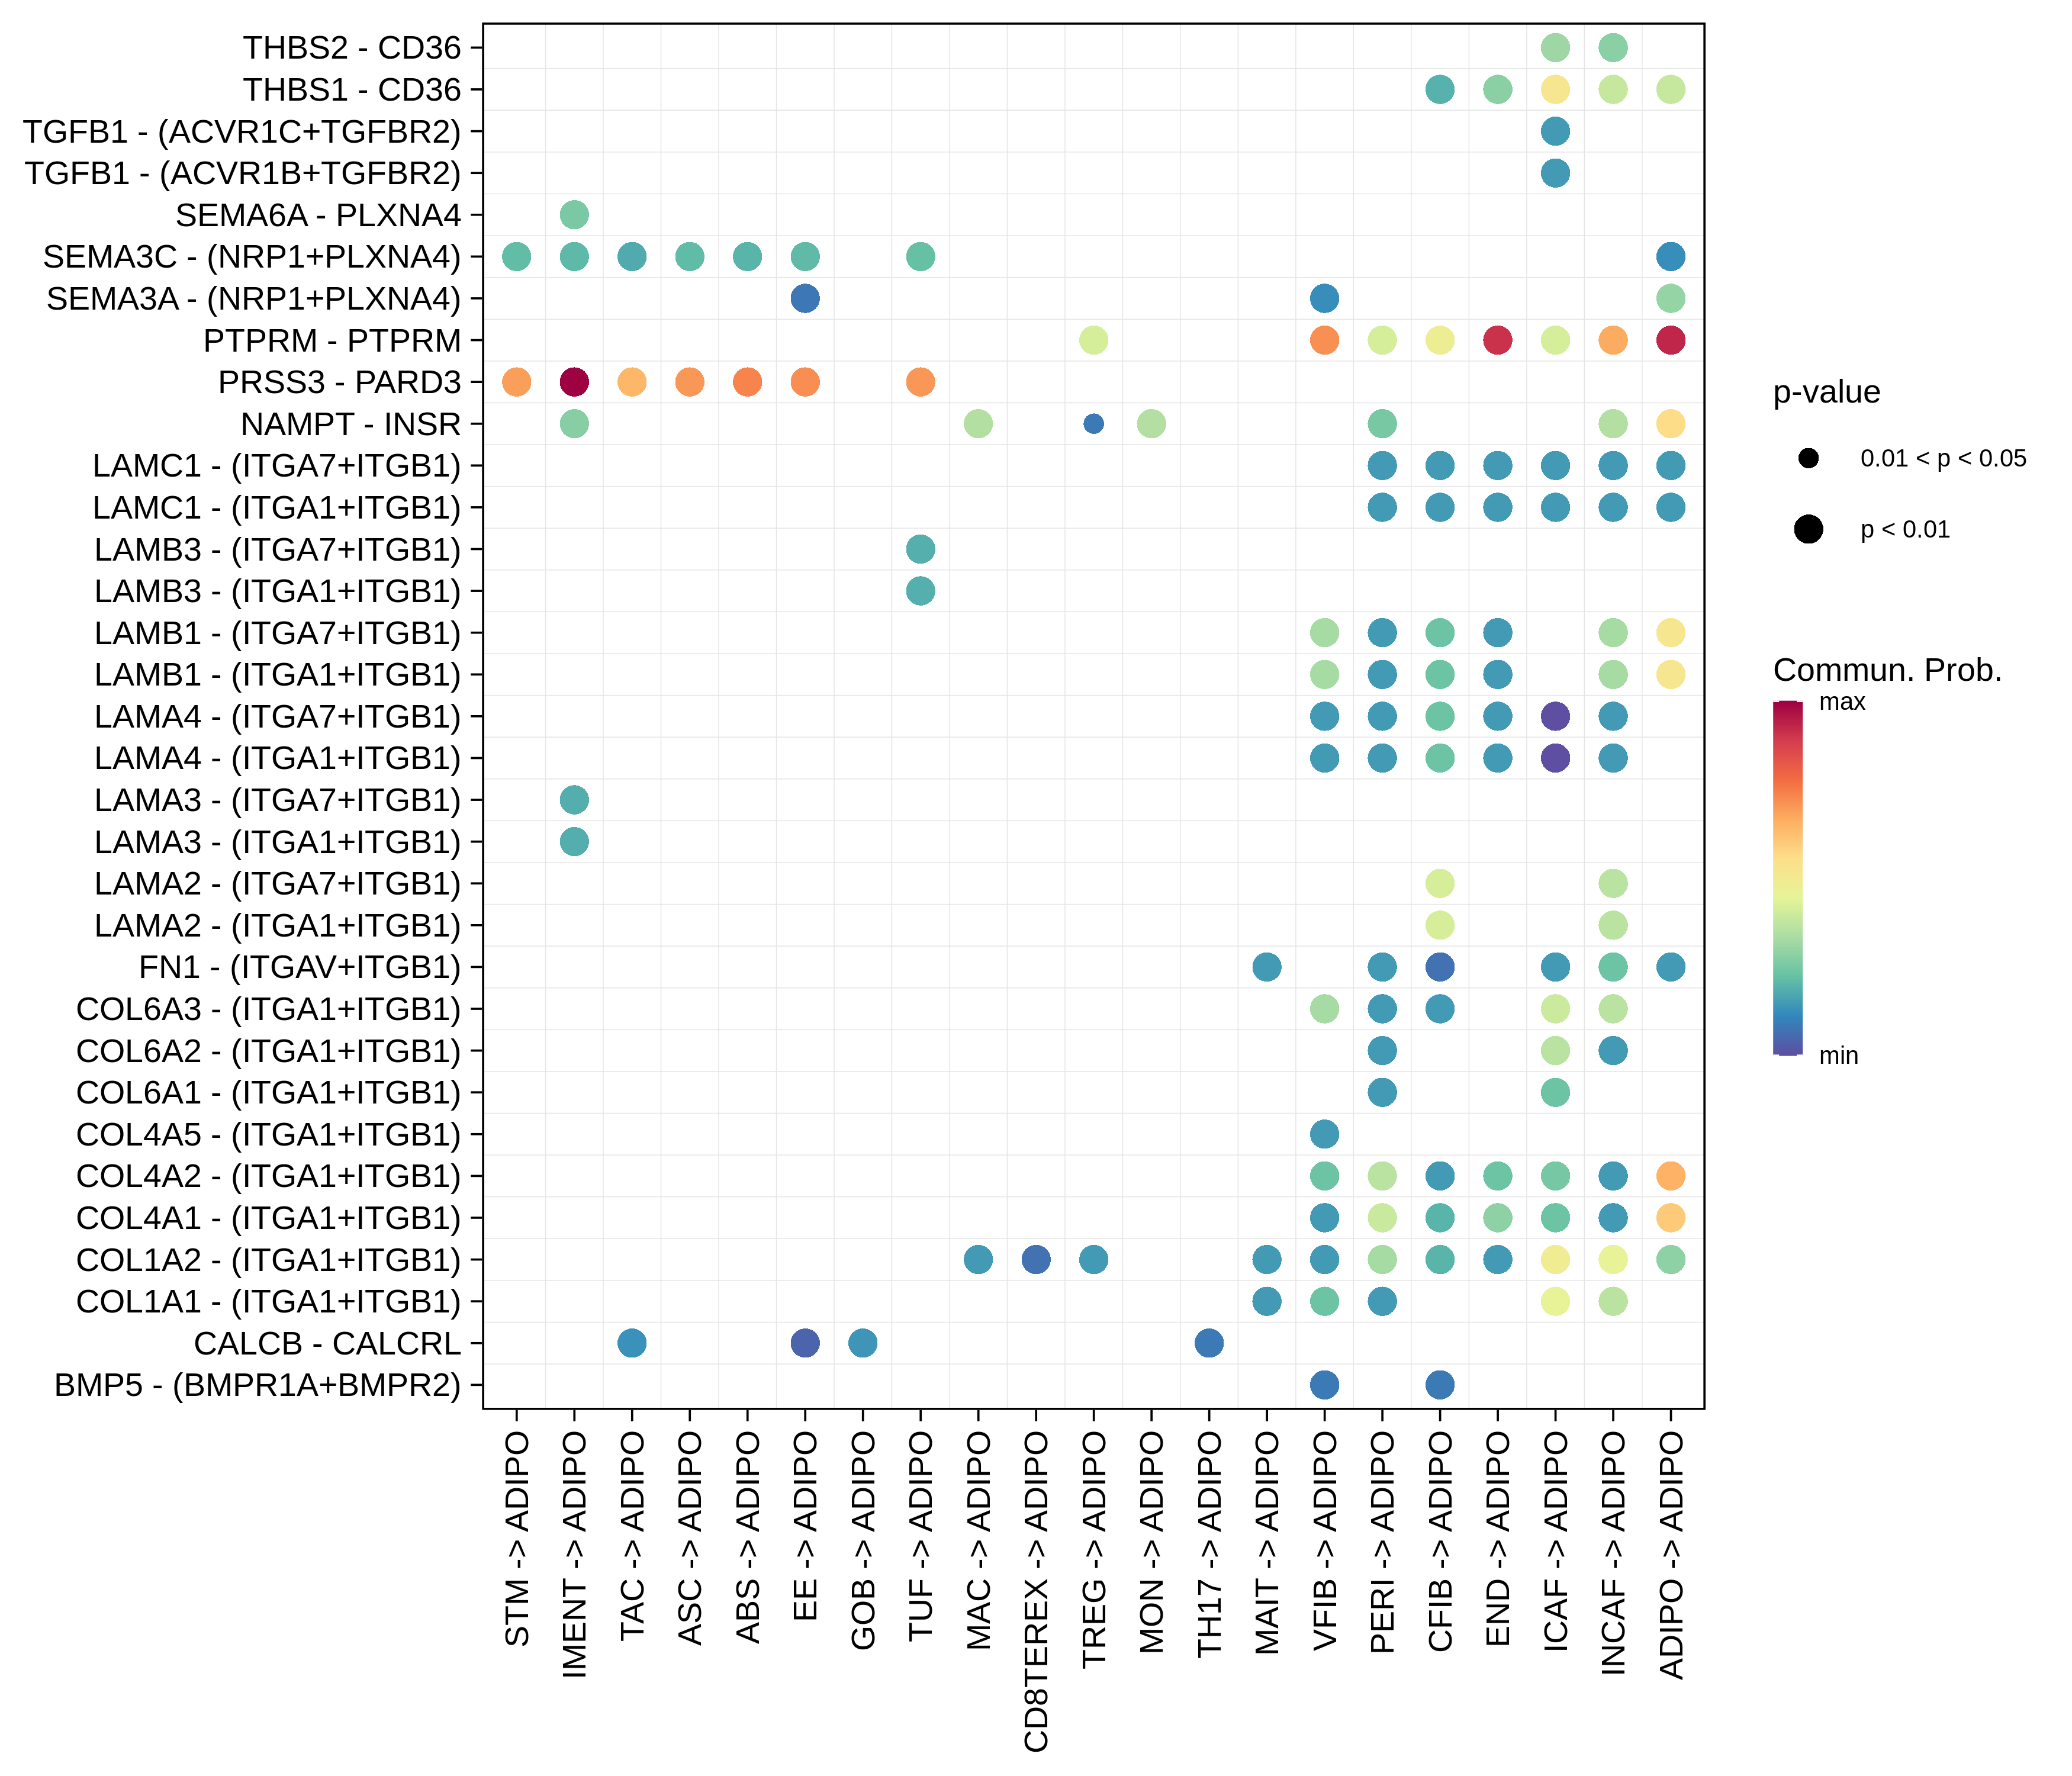 |
| ∗The cell-cell communications between each two interacting cell types in different states-derived samples of Colorectum tissue. Different colors in the circle plot represent different cell groups and the edge width is proportional to the indicated number of ligand-receptor pairs. |
| ∗Bubble plot of proportion to the communication probability in significant signaling pathways between this cell type and its source and target cell population. Each row represents the significant ligand and receptor gene pairs. |
| Page: 1 2 3 4 5 6 7 8 9 10 11 12 13 14 15 |
Top |
Stemness, Senescence, Metaplasia and NeoTCR signature analysis |
 |  |  |  |
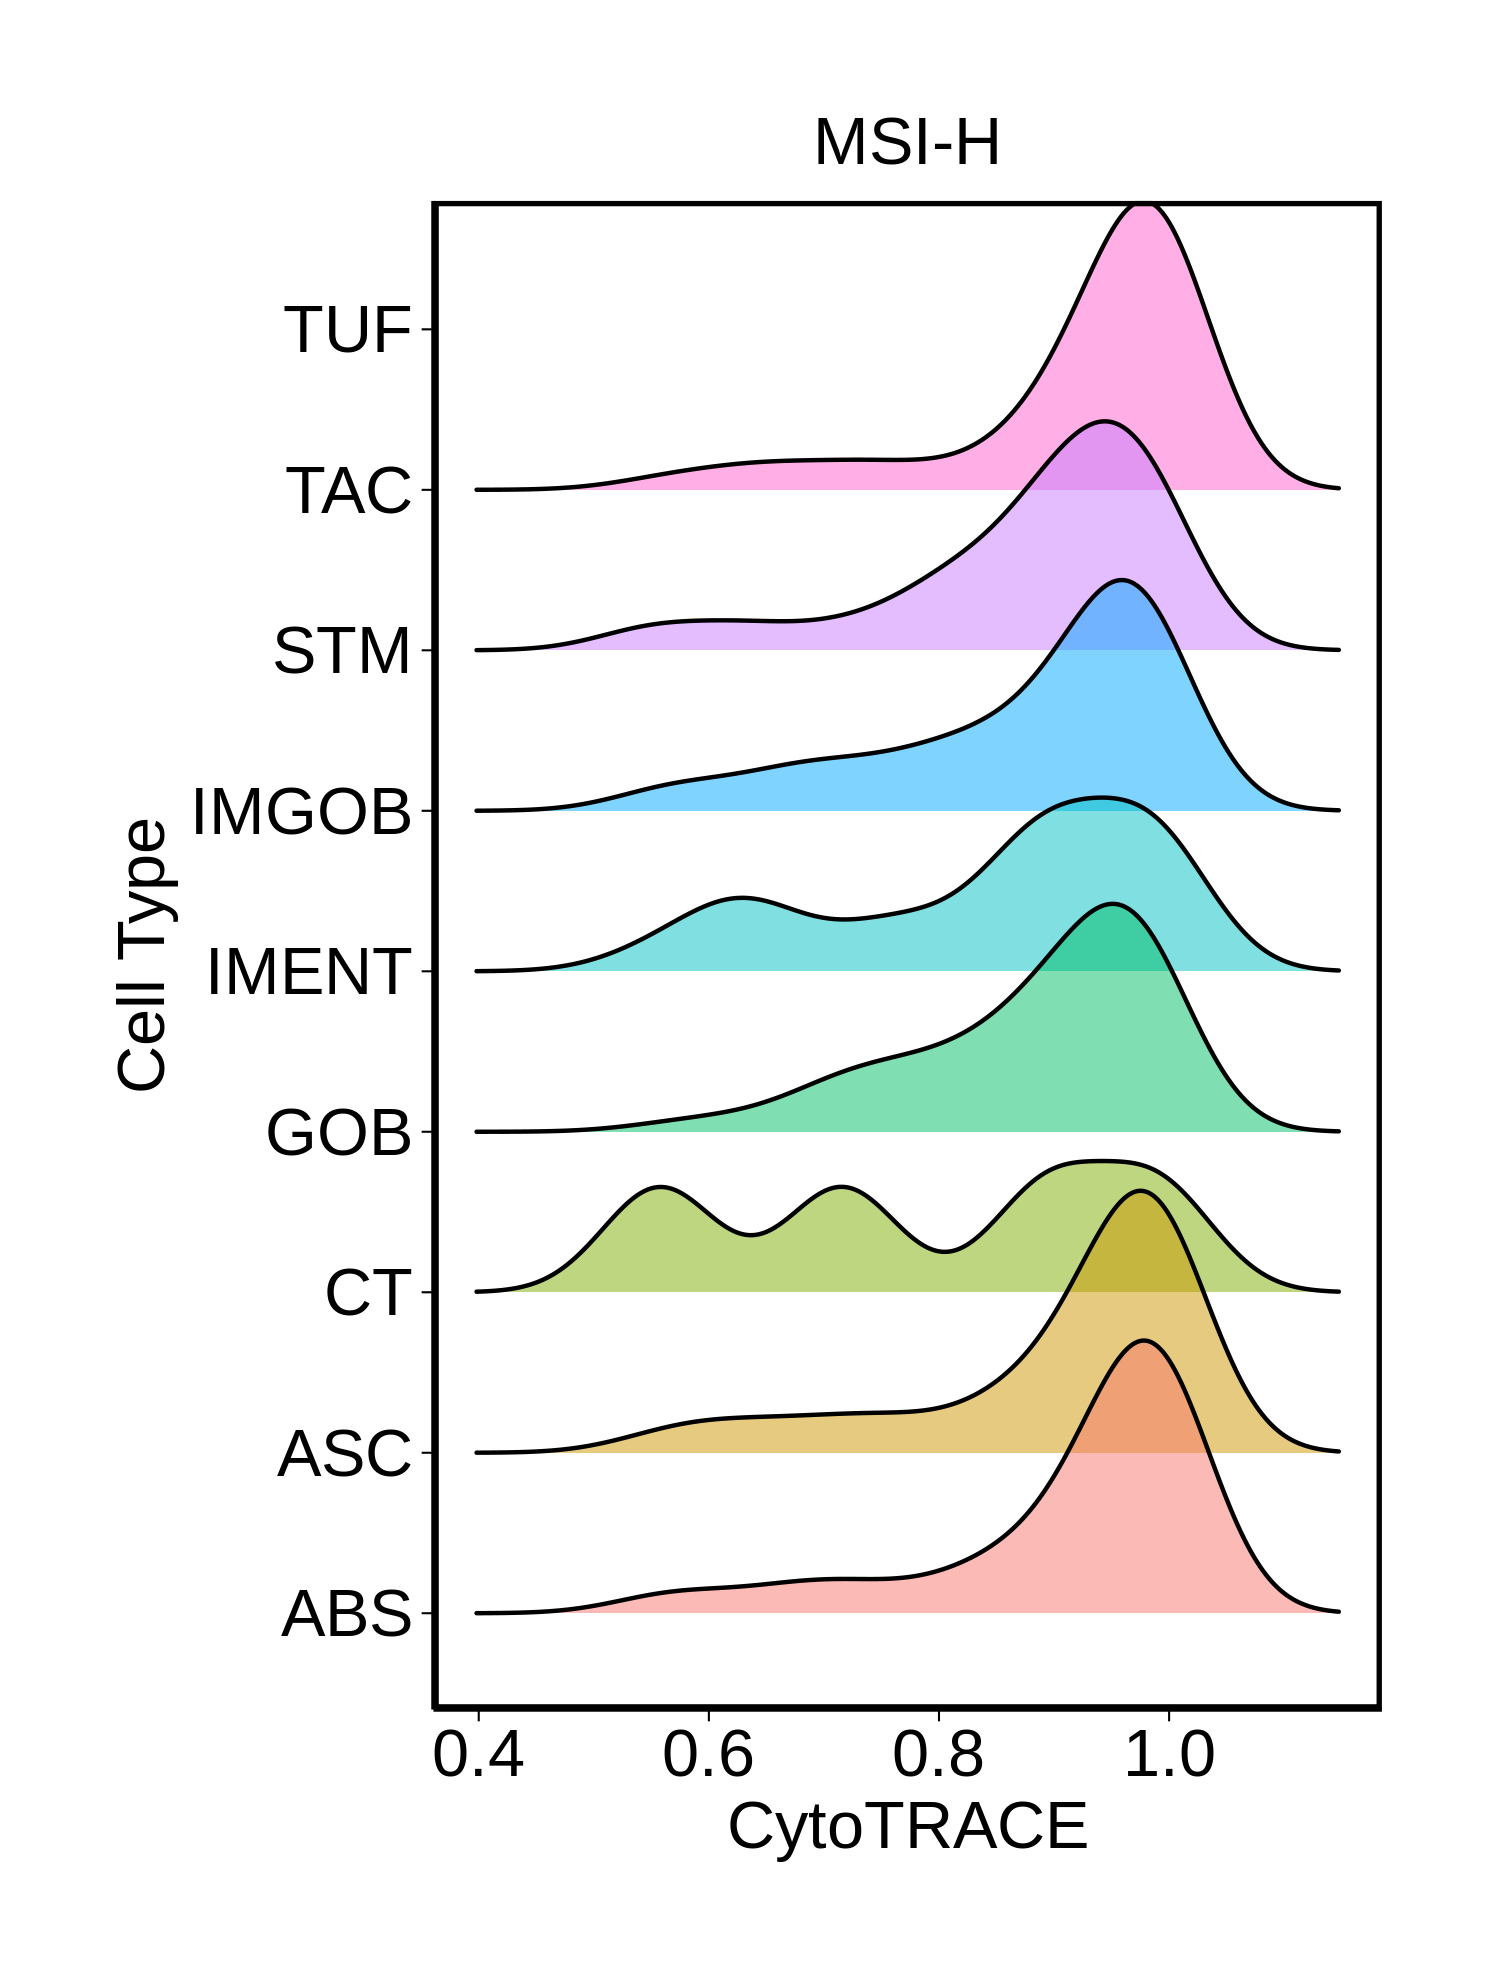 | 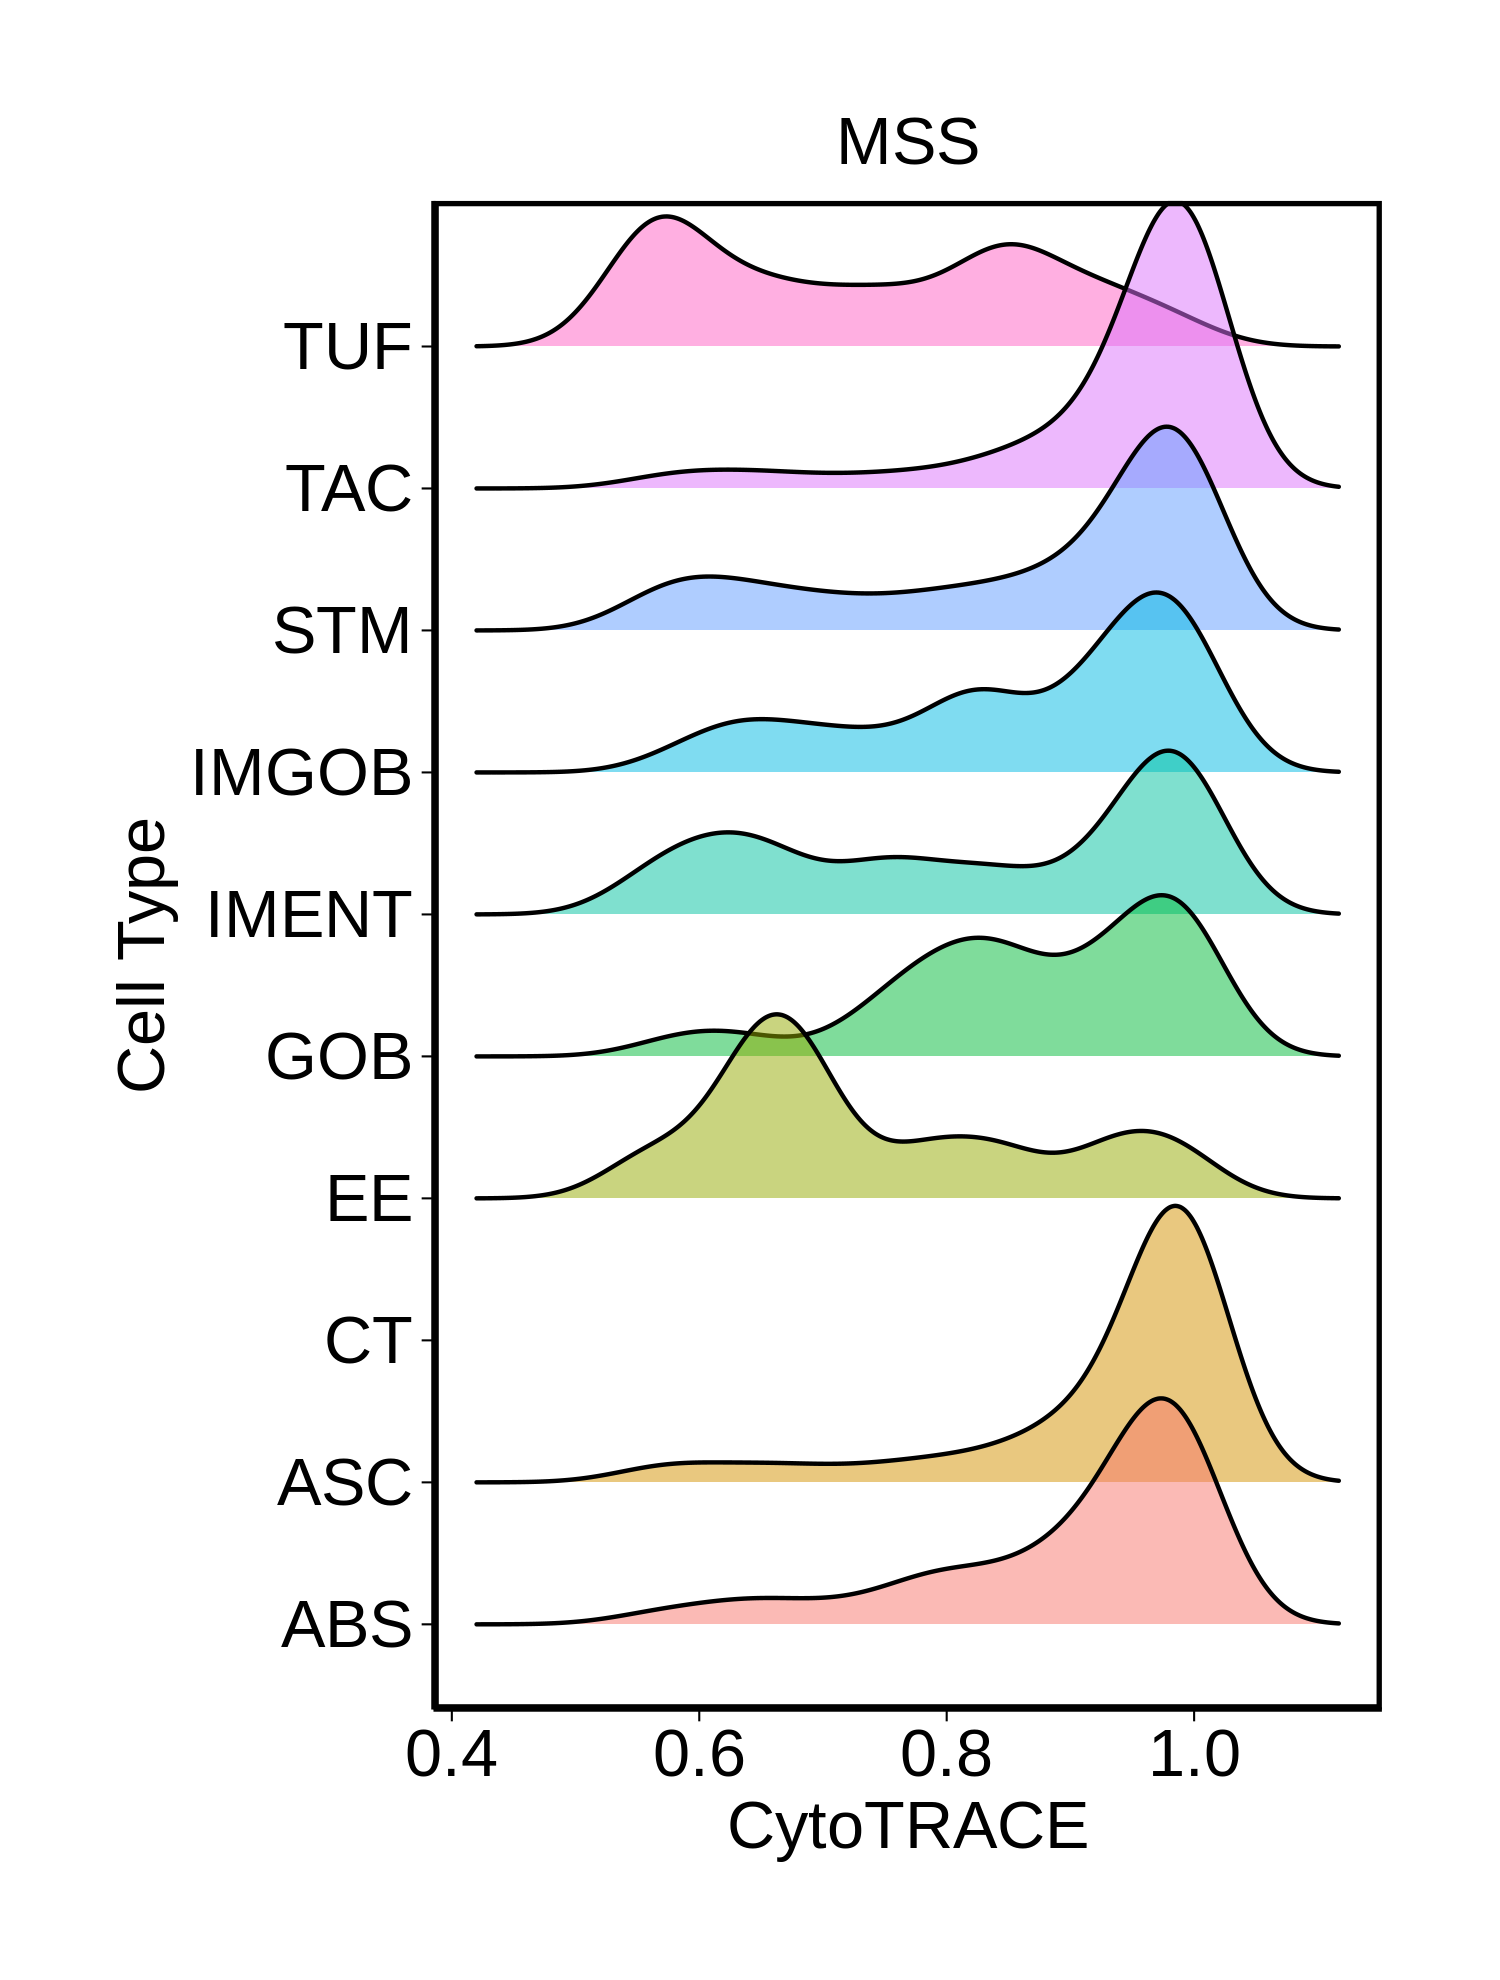 | 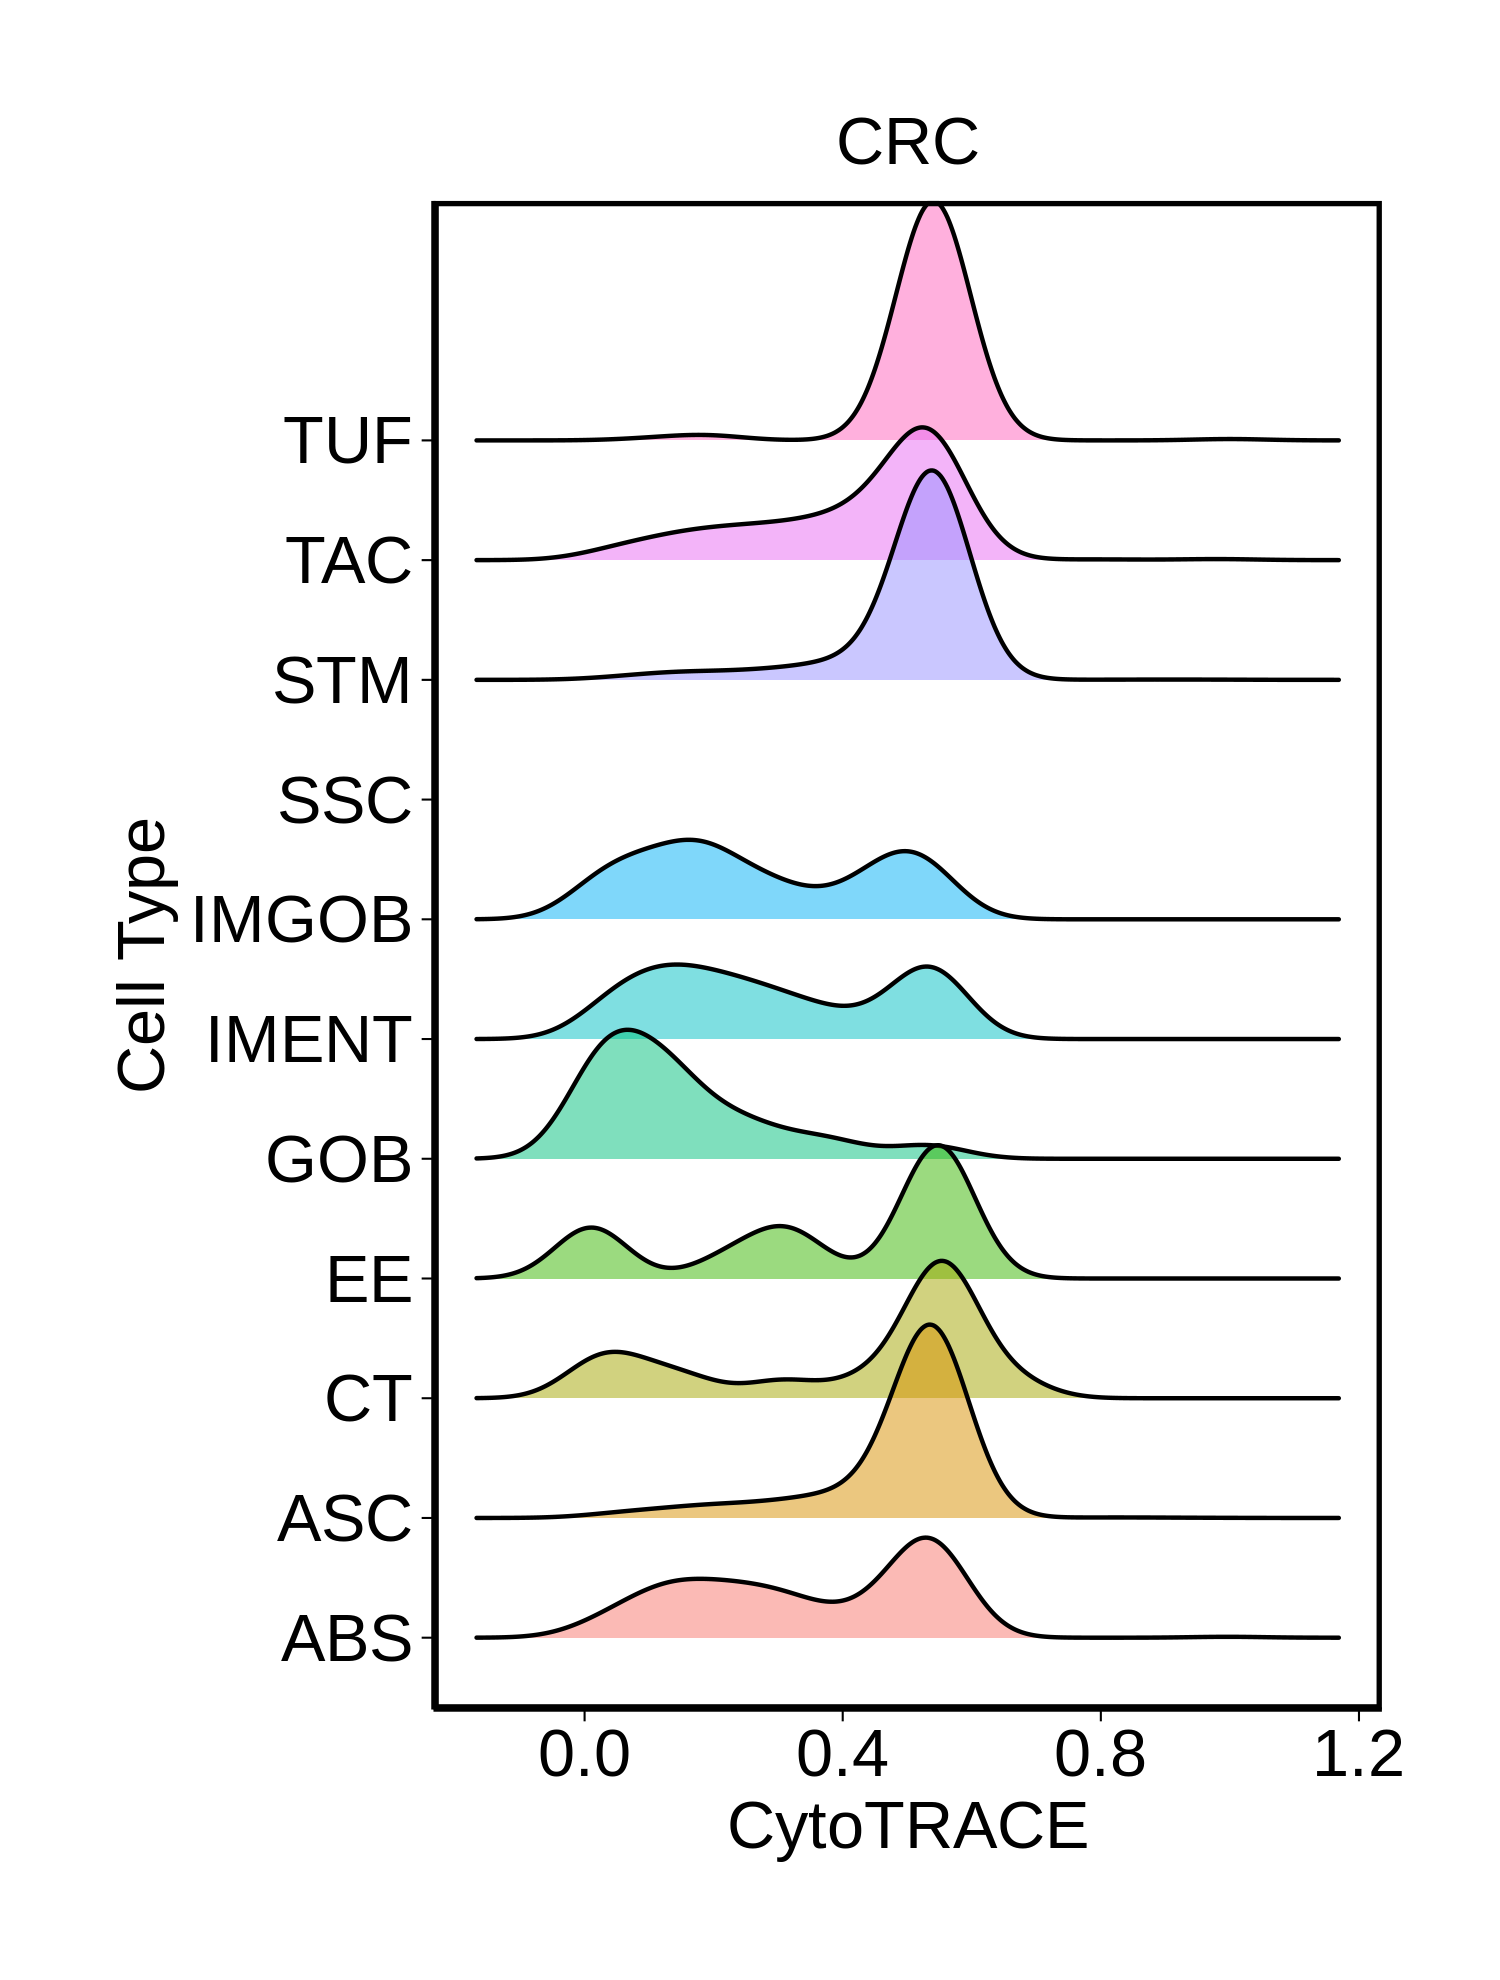 |
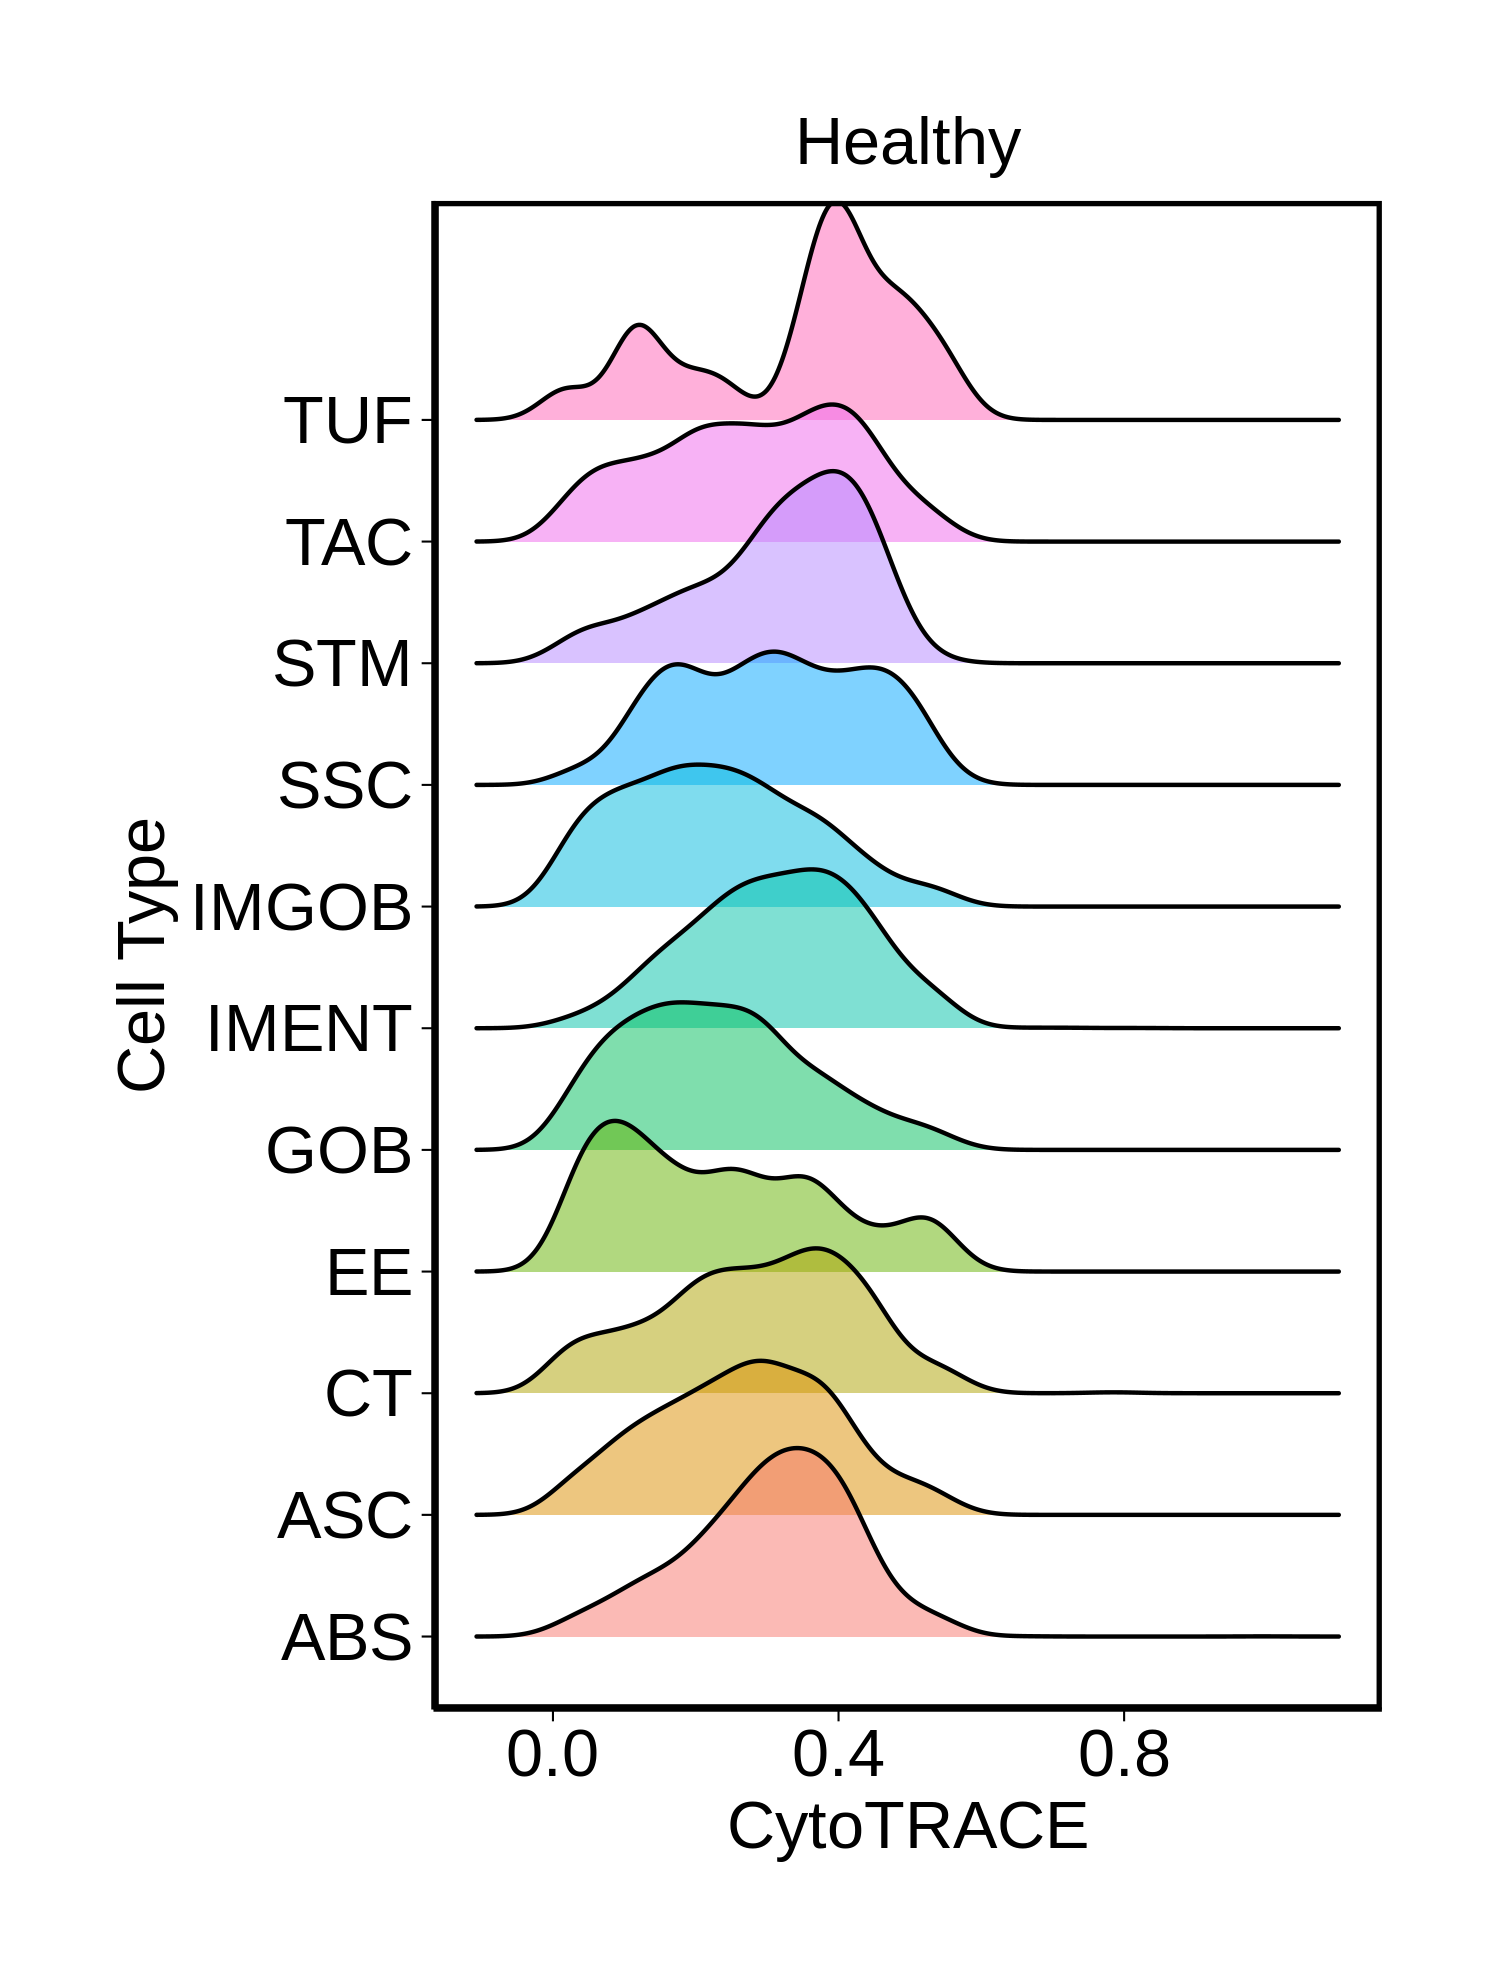
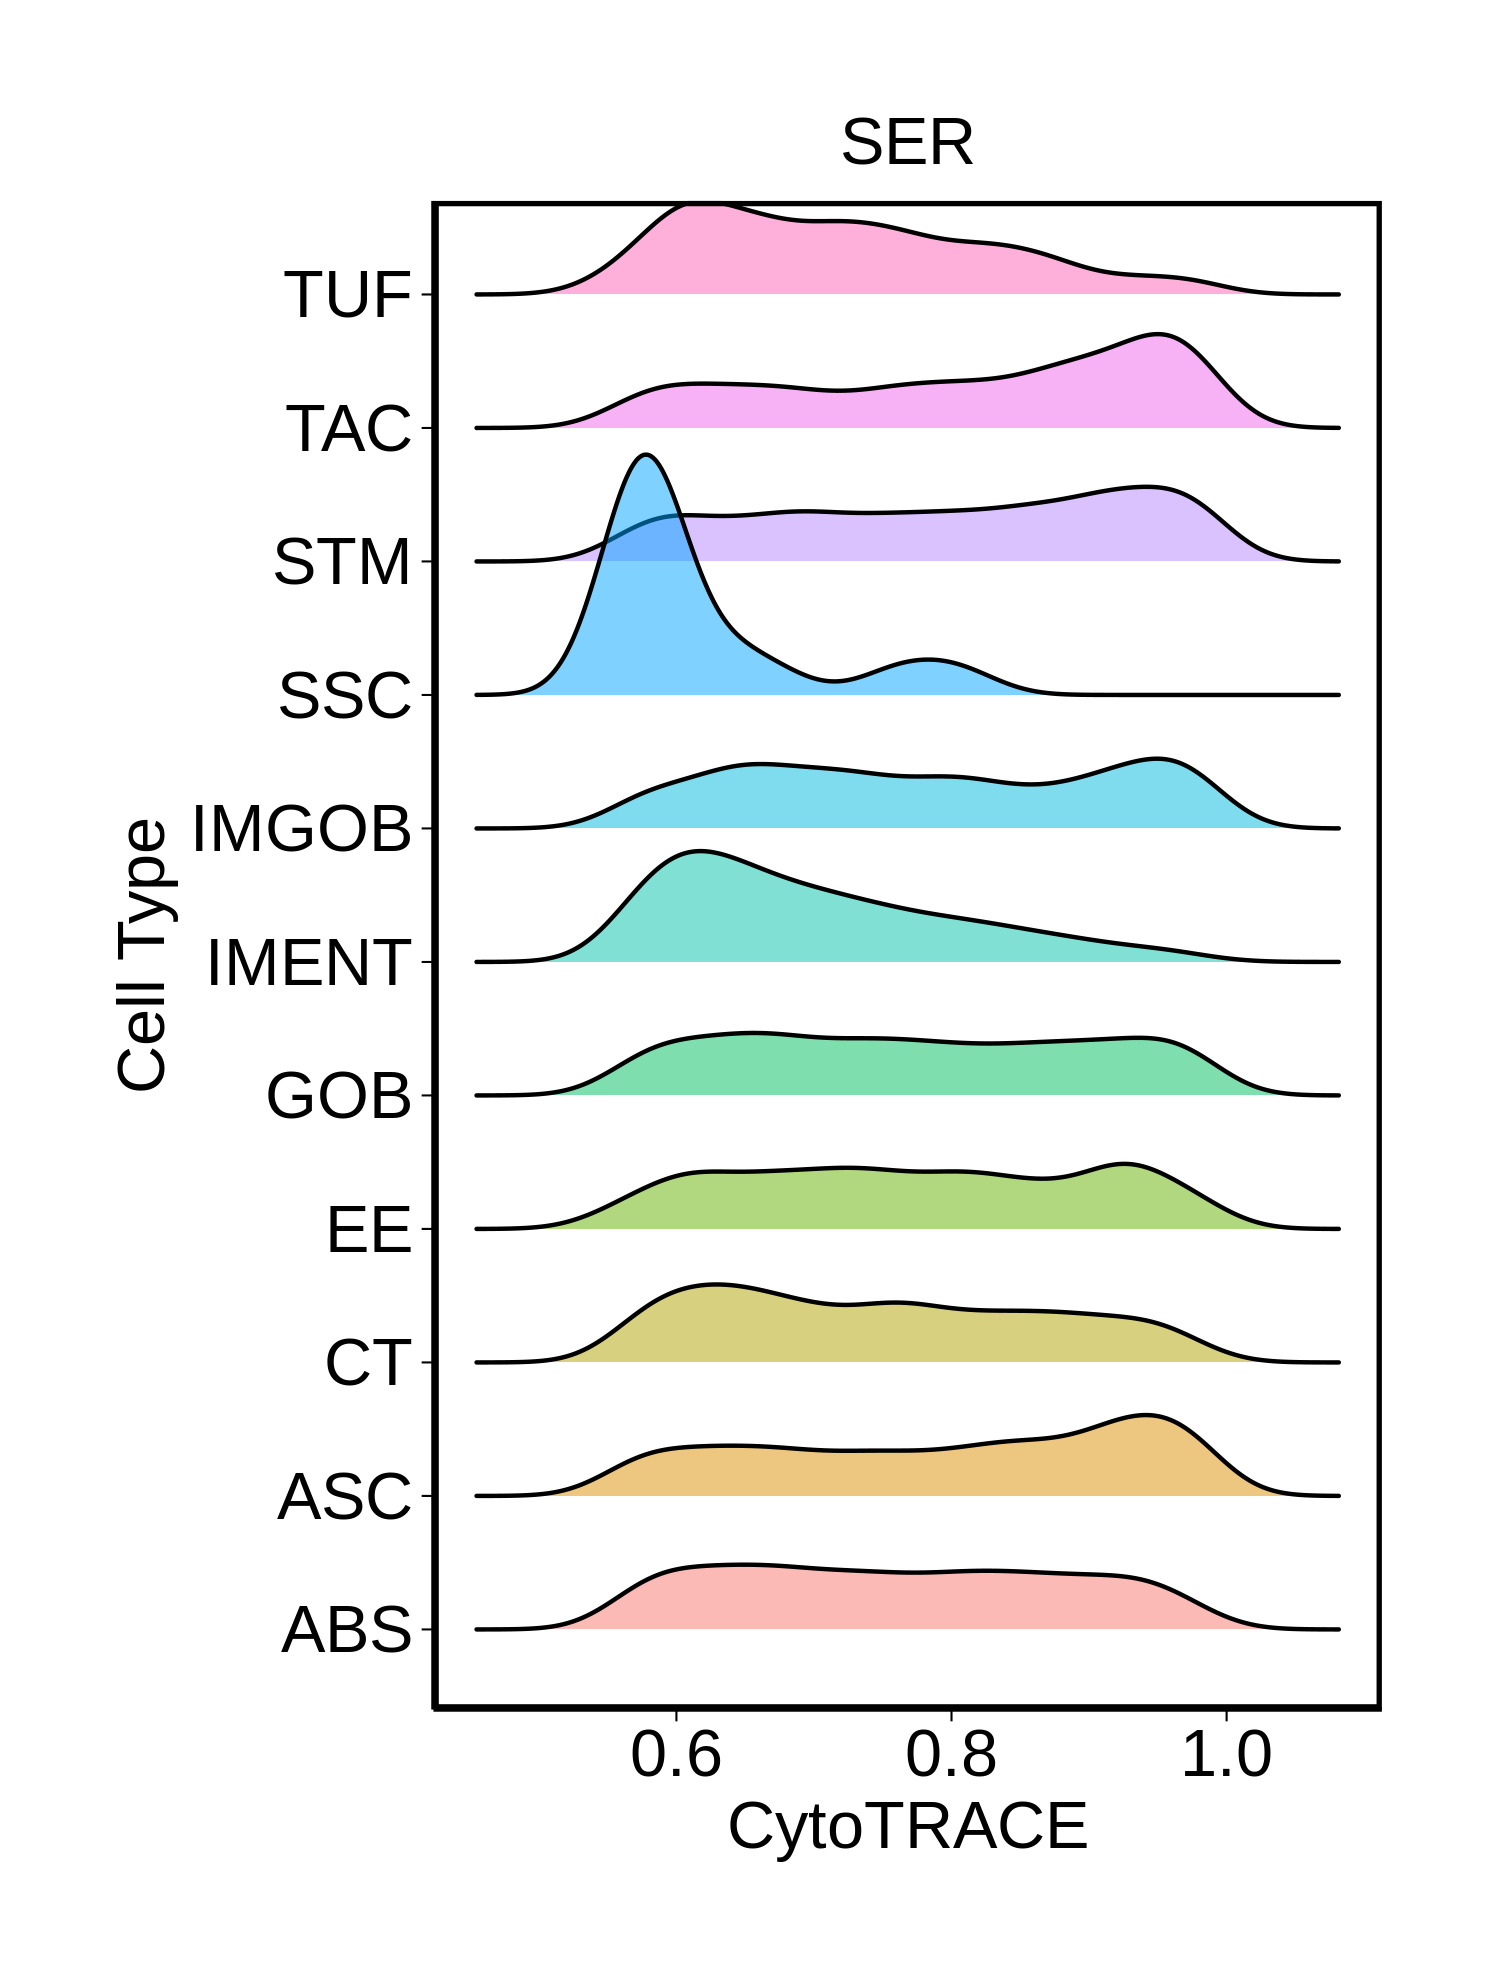
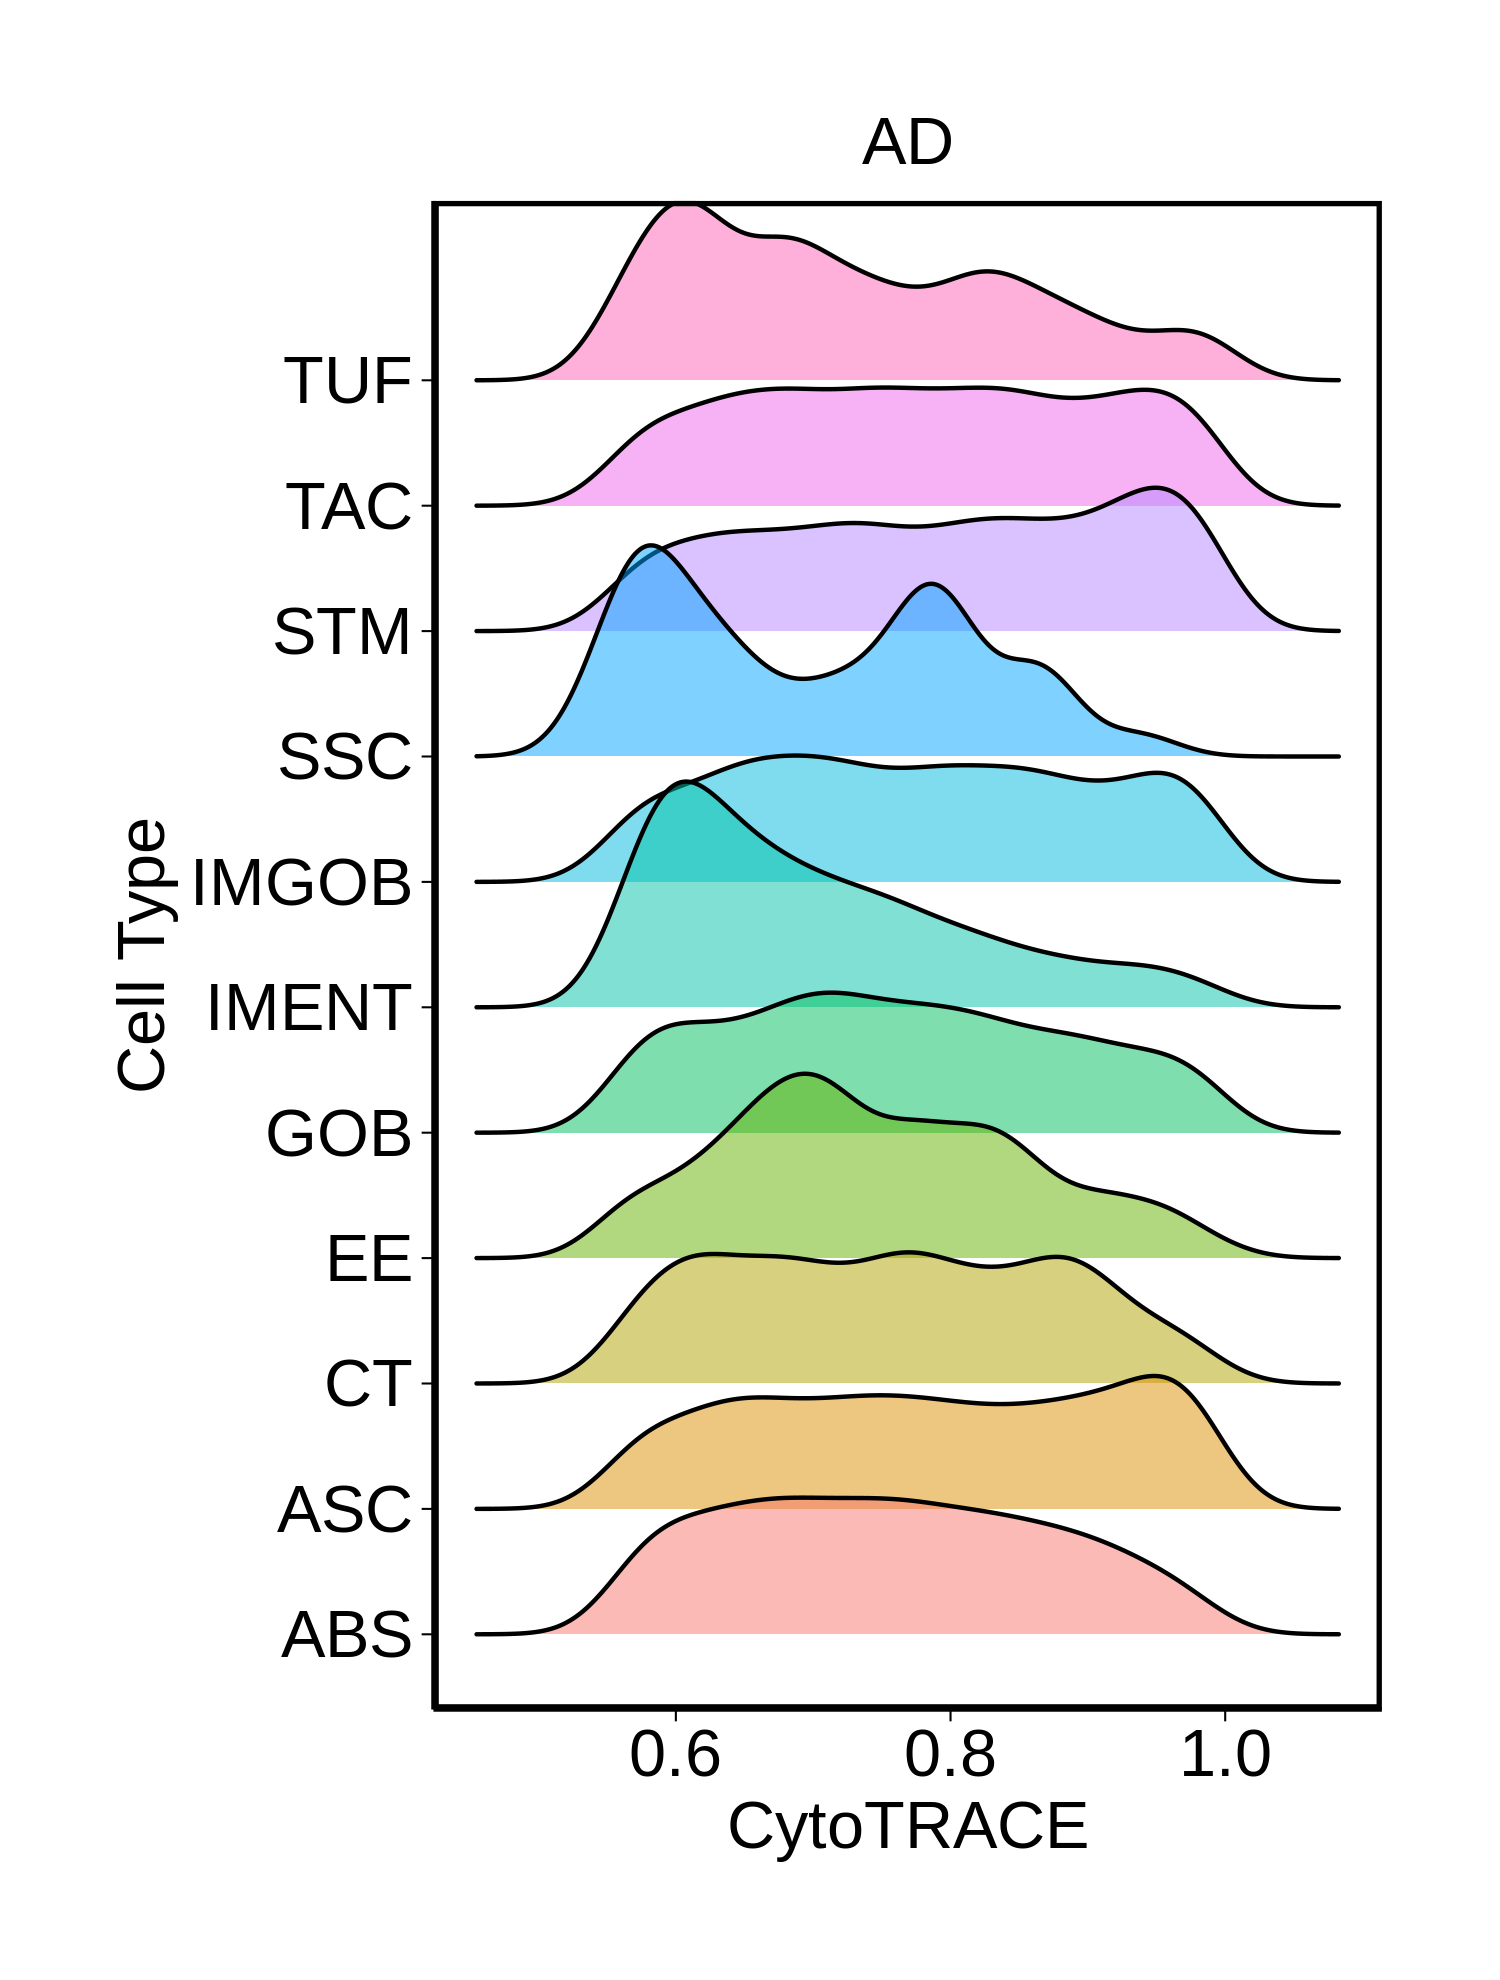
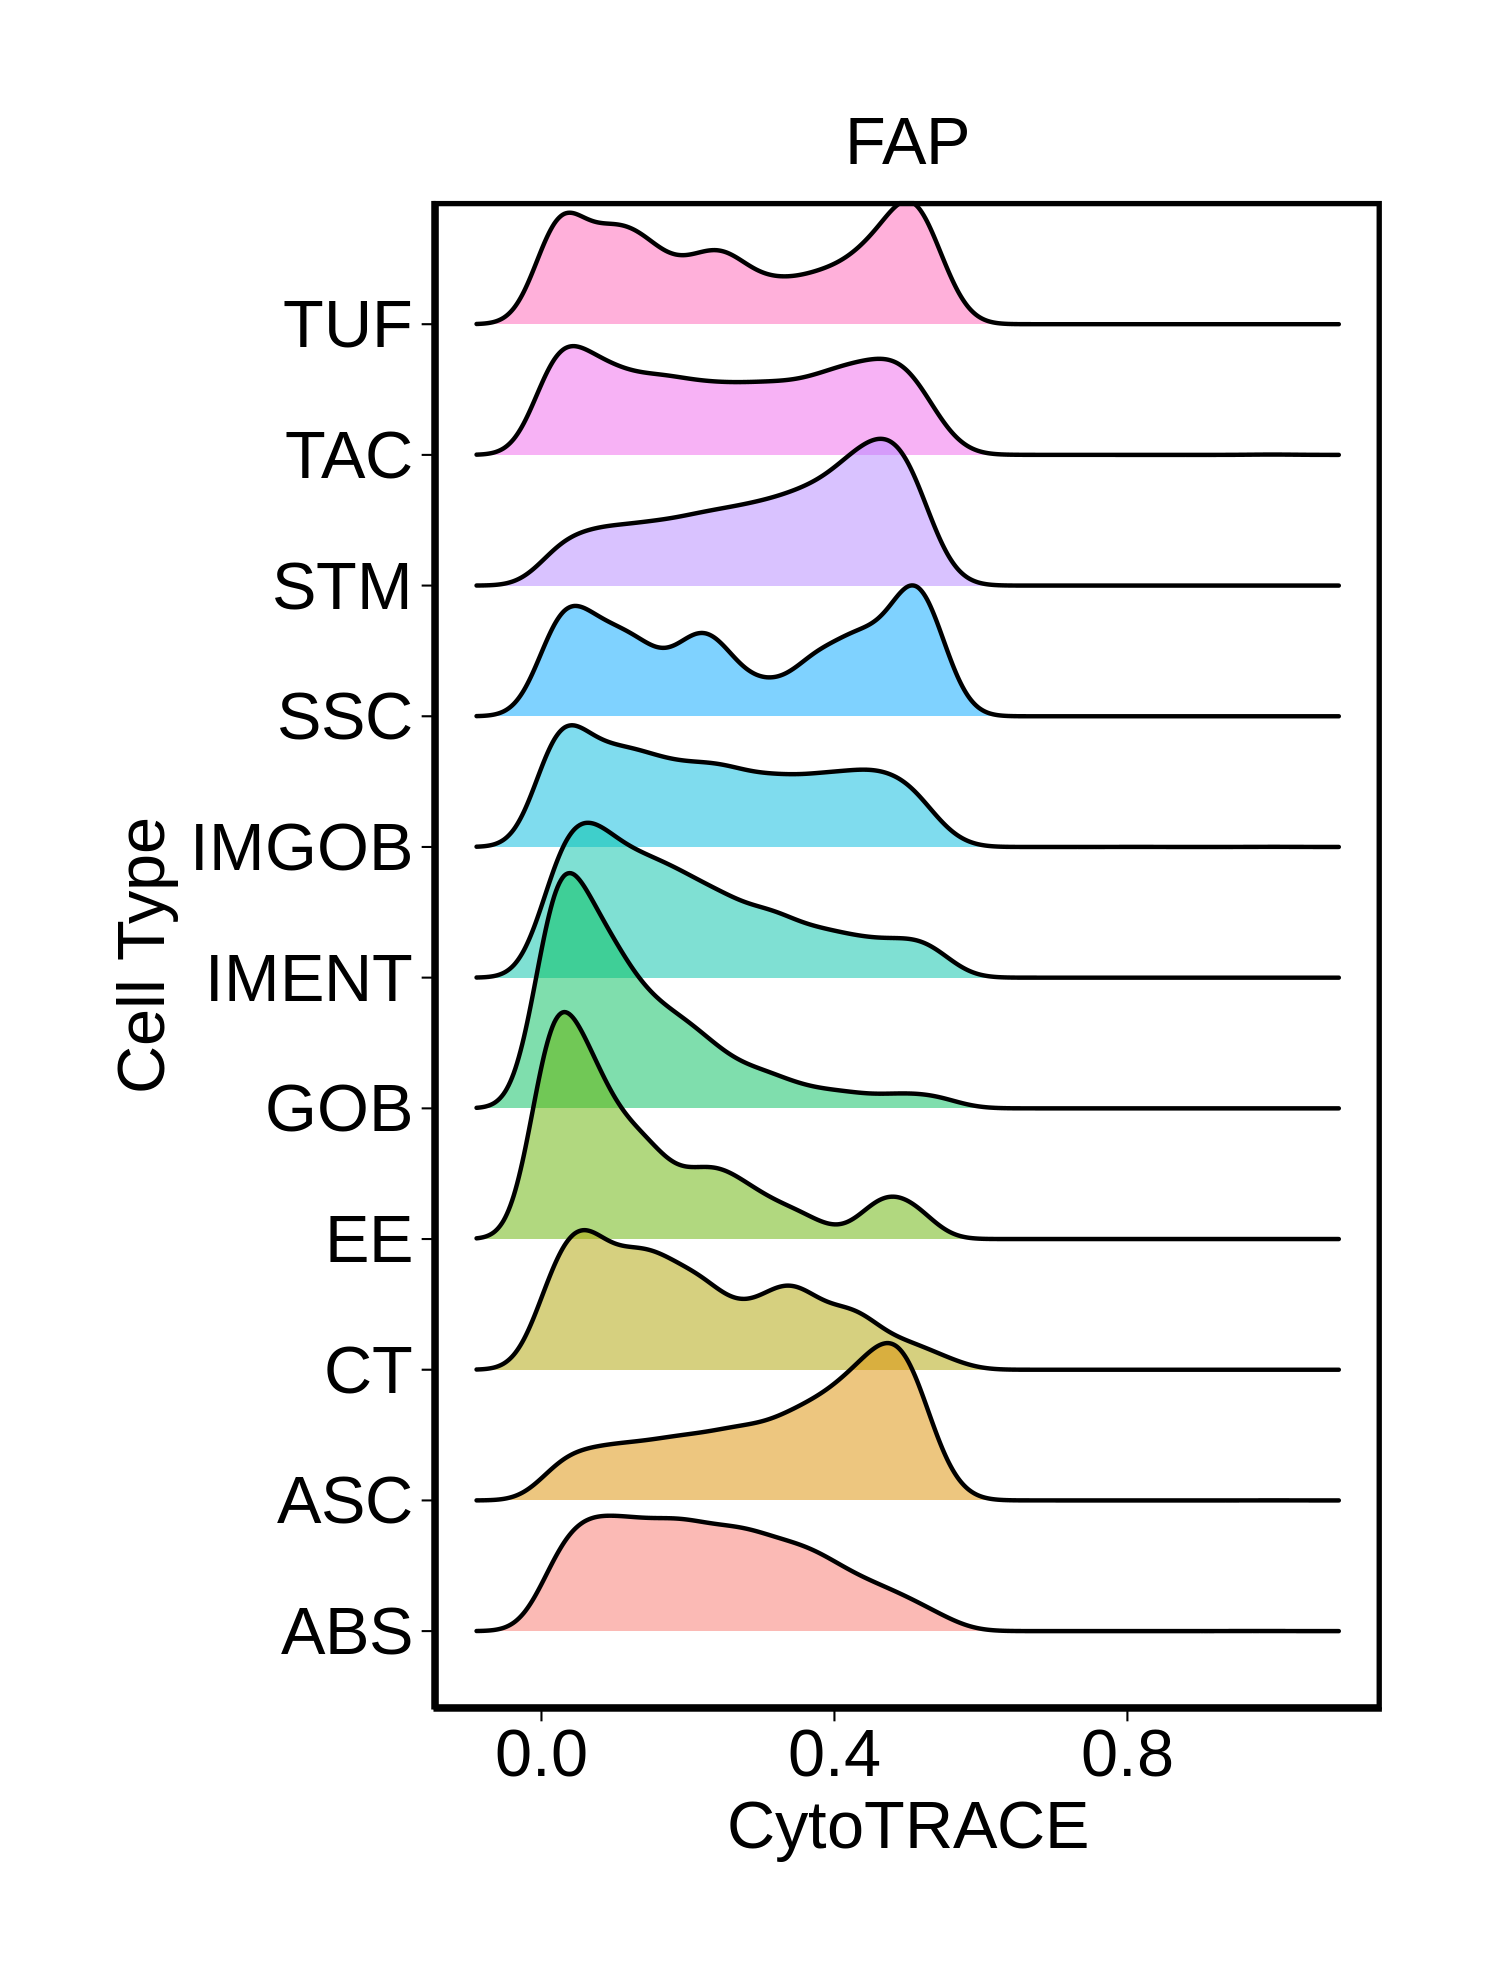
| ∗Ridge plots of CytoTRACE score distributions for epithelial cells. |
| Disease State | Epithelia | Immune | Stromal |
| Healthy | 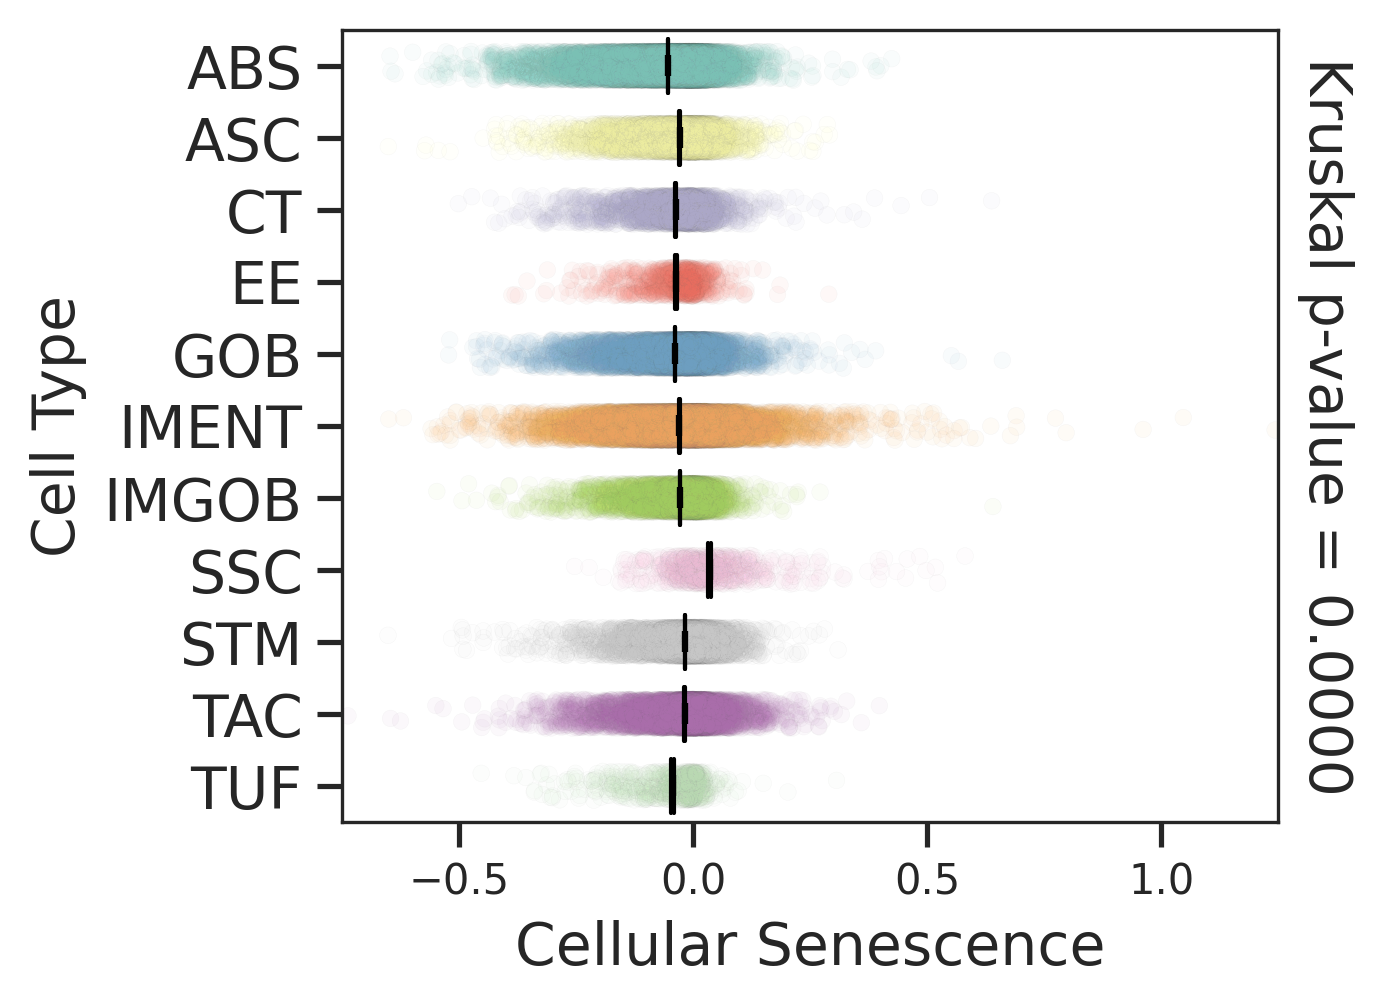 | 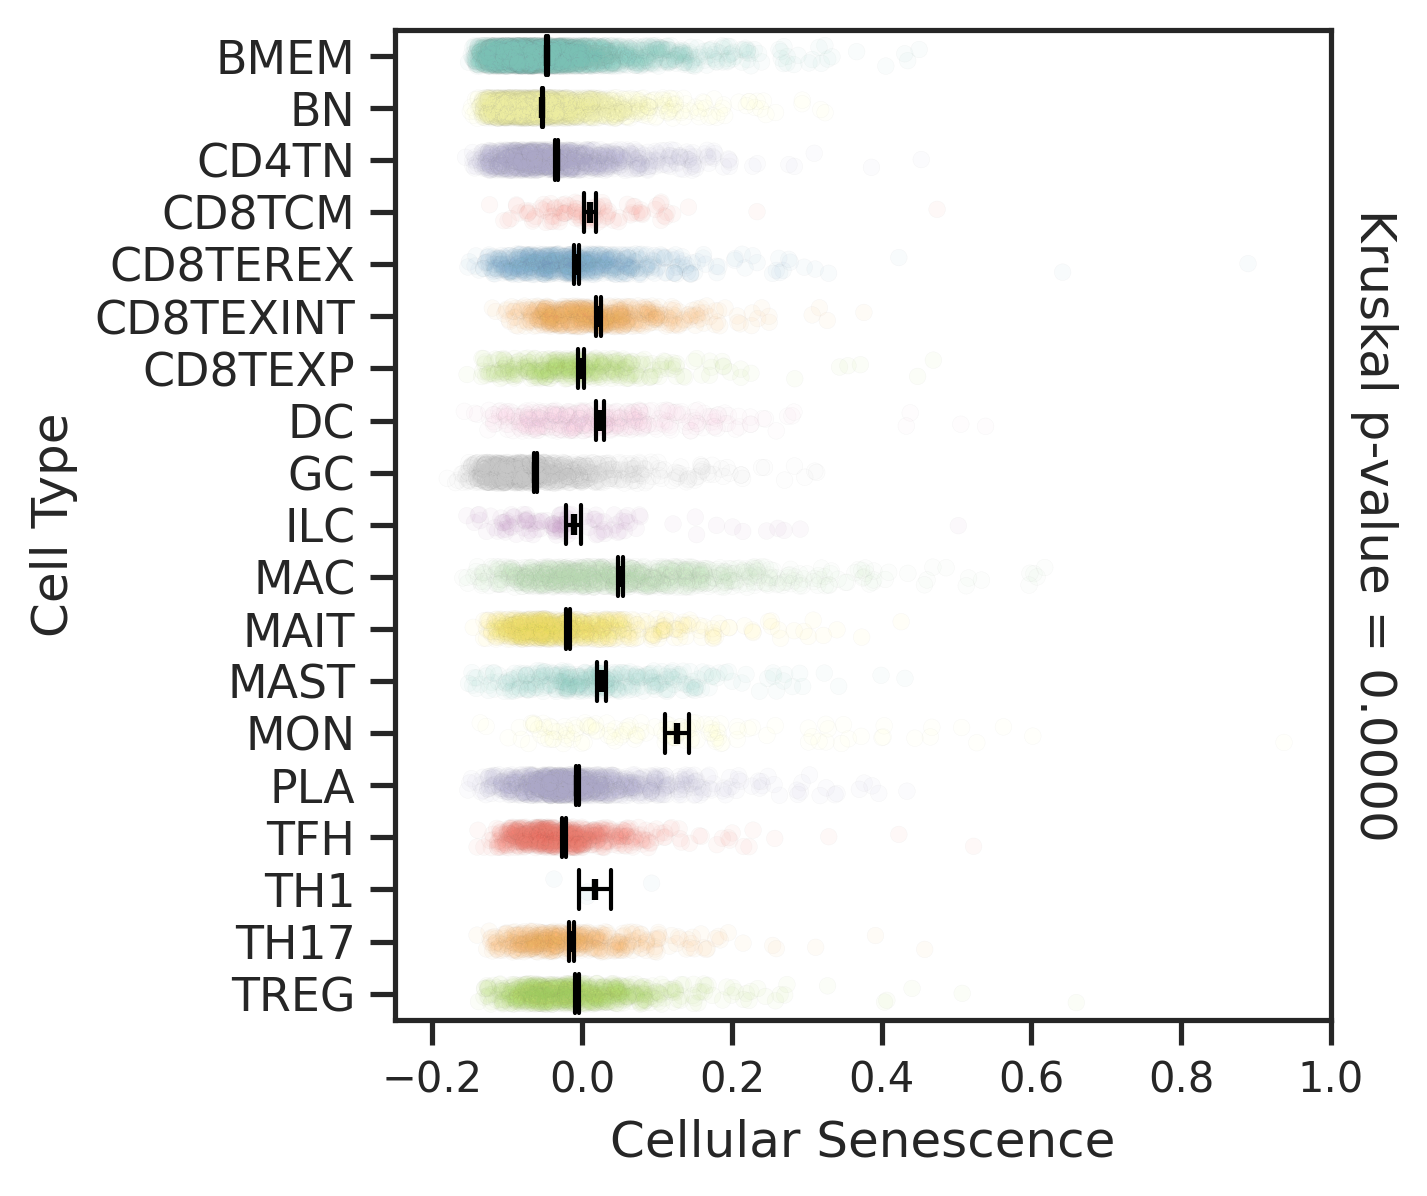 | 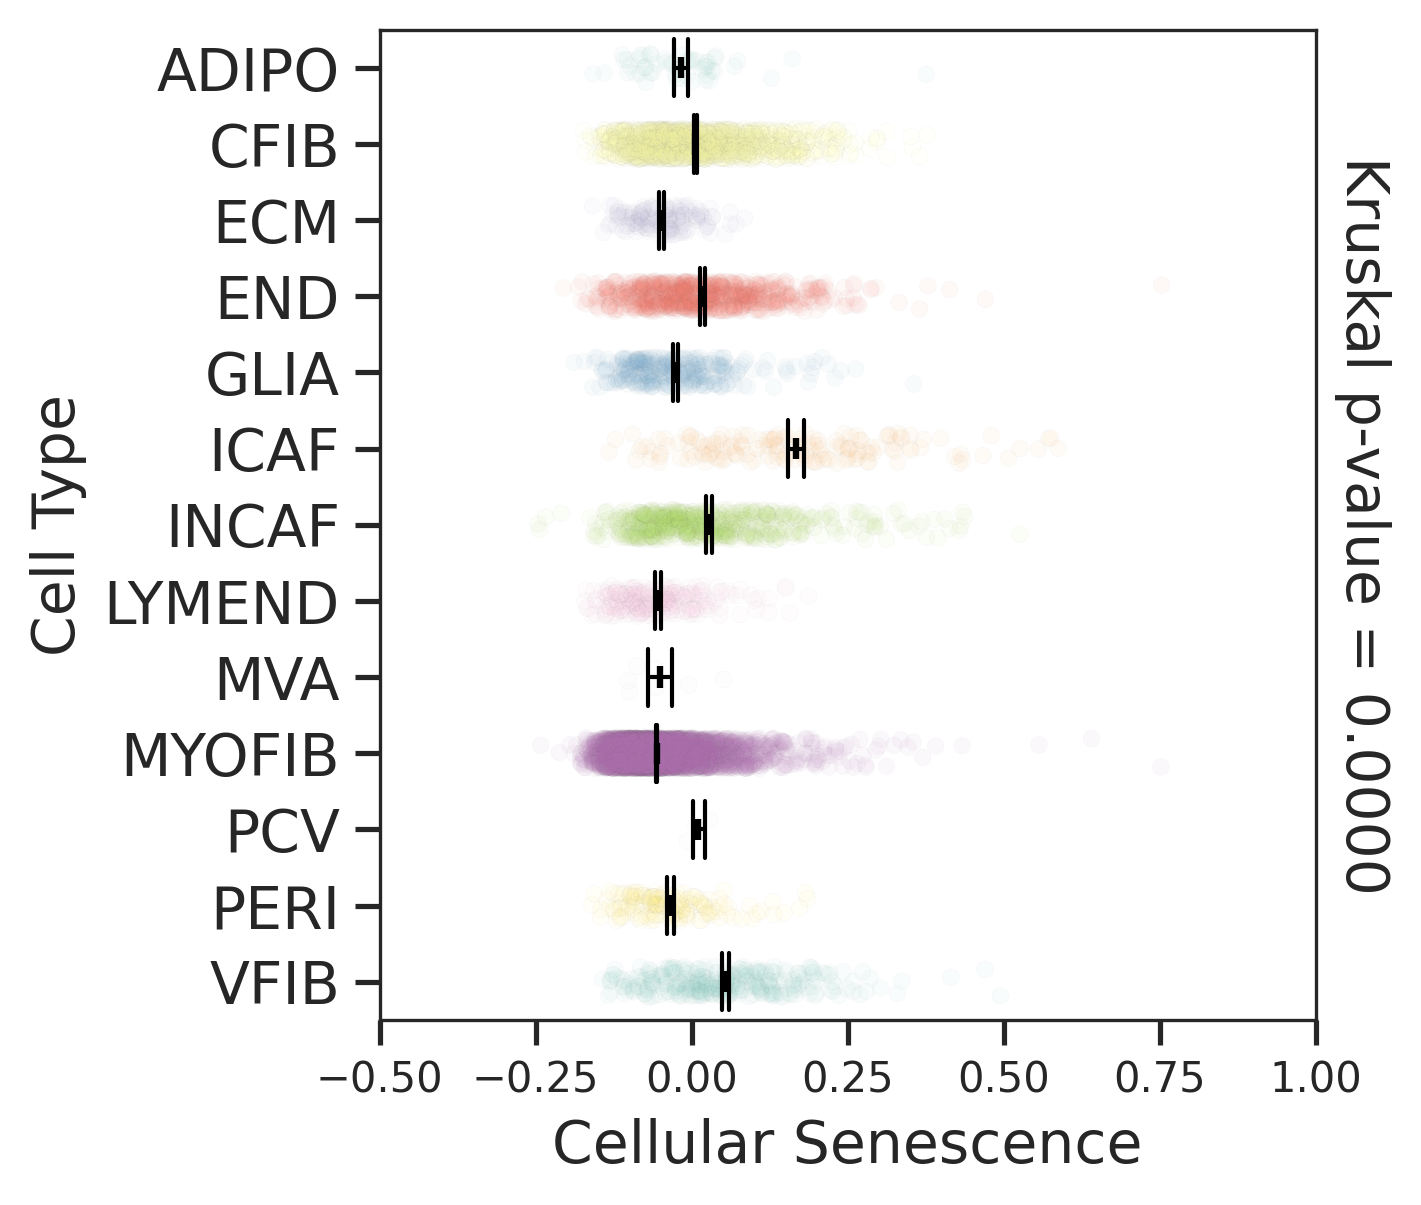 |
| SER | 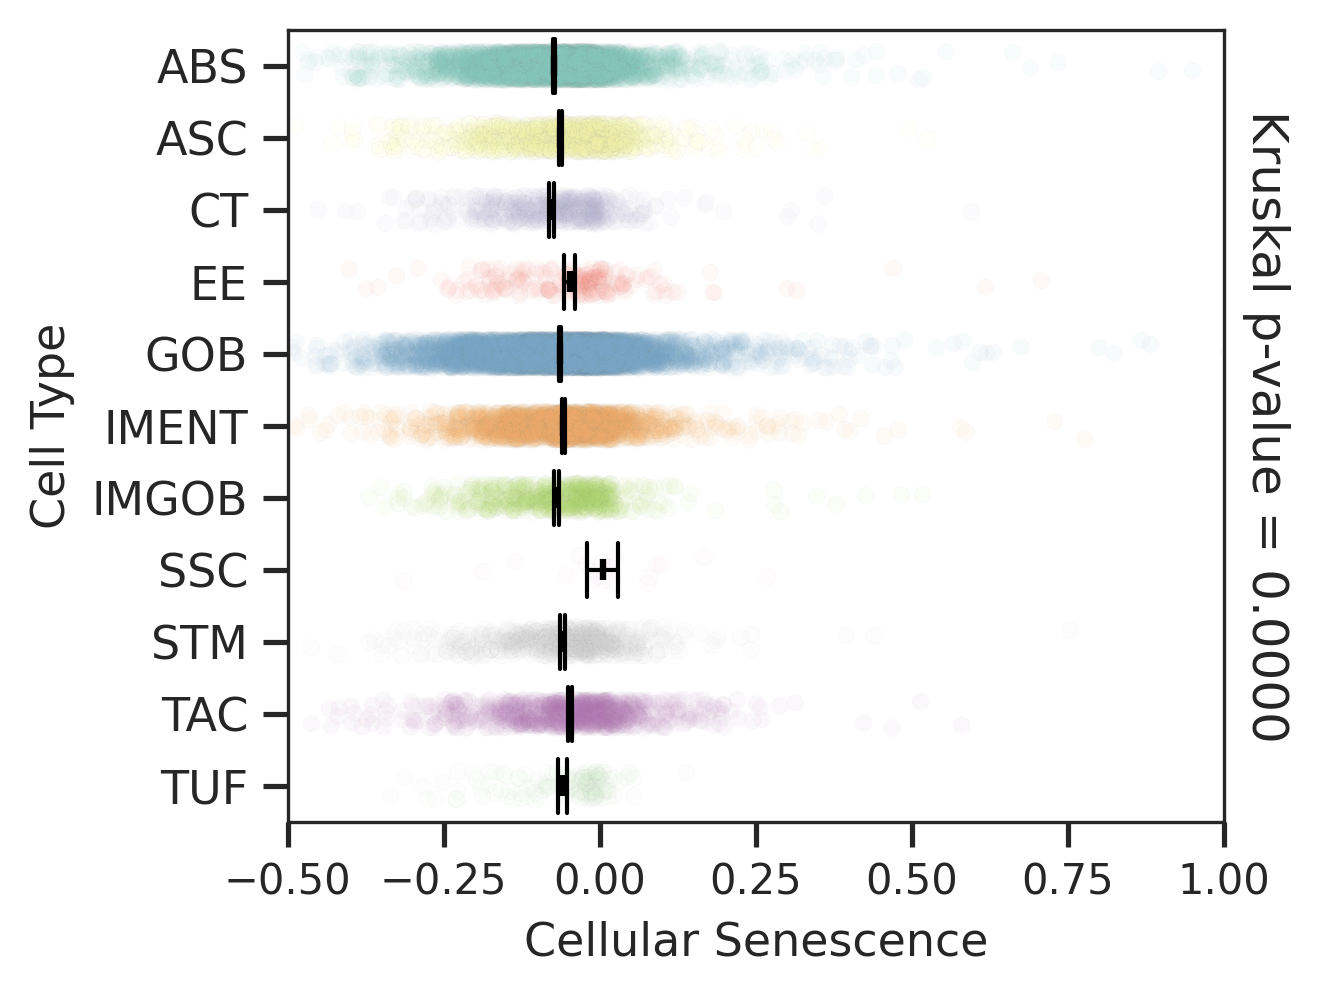 | 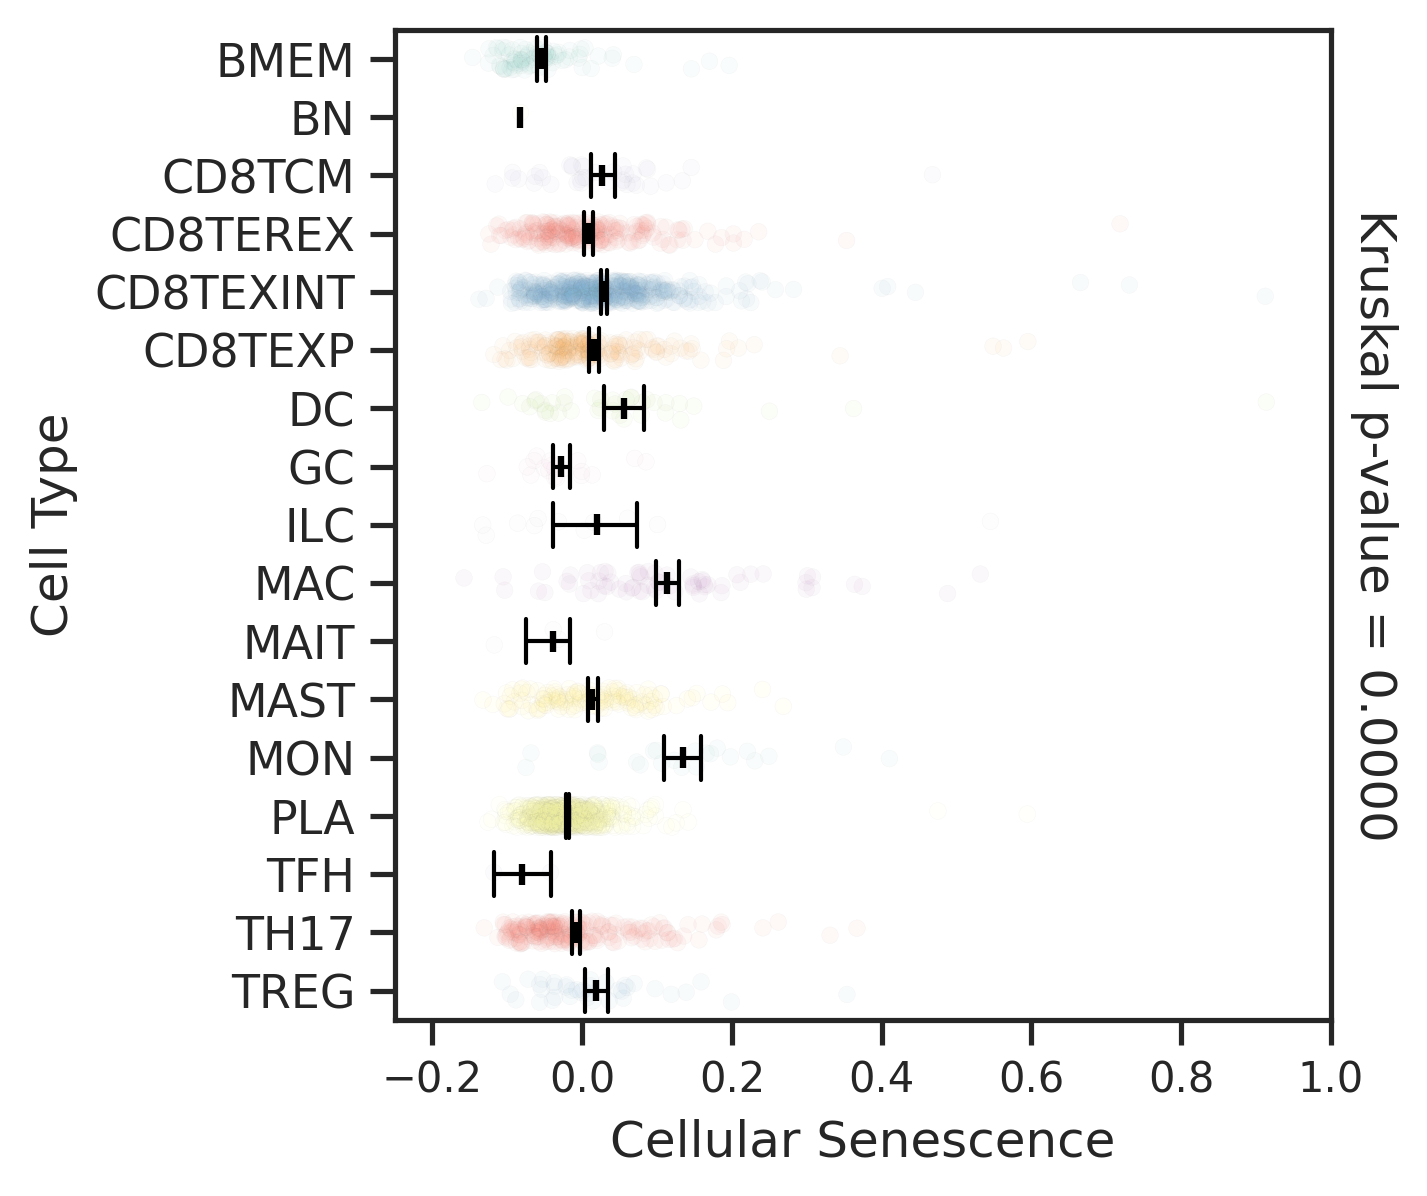 | 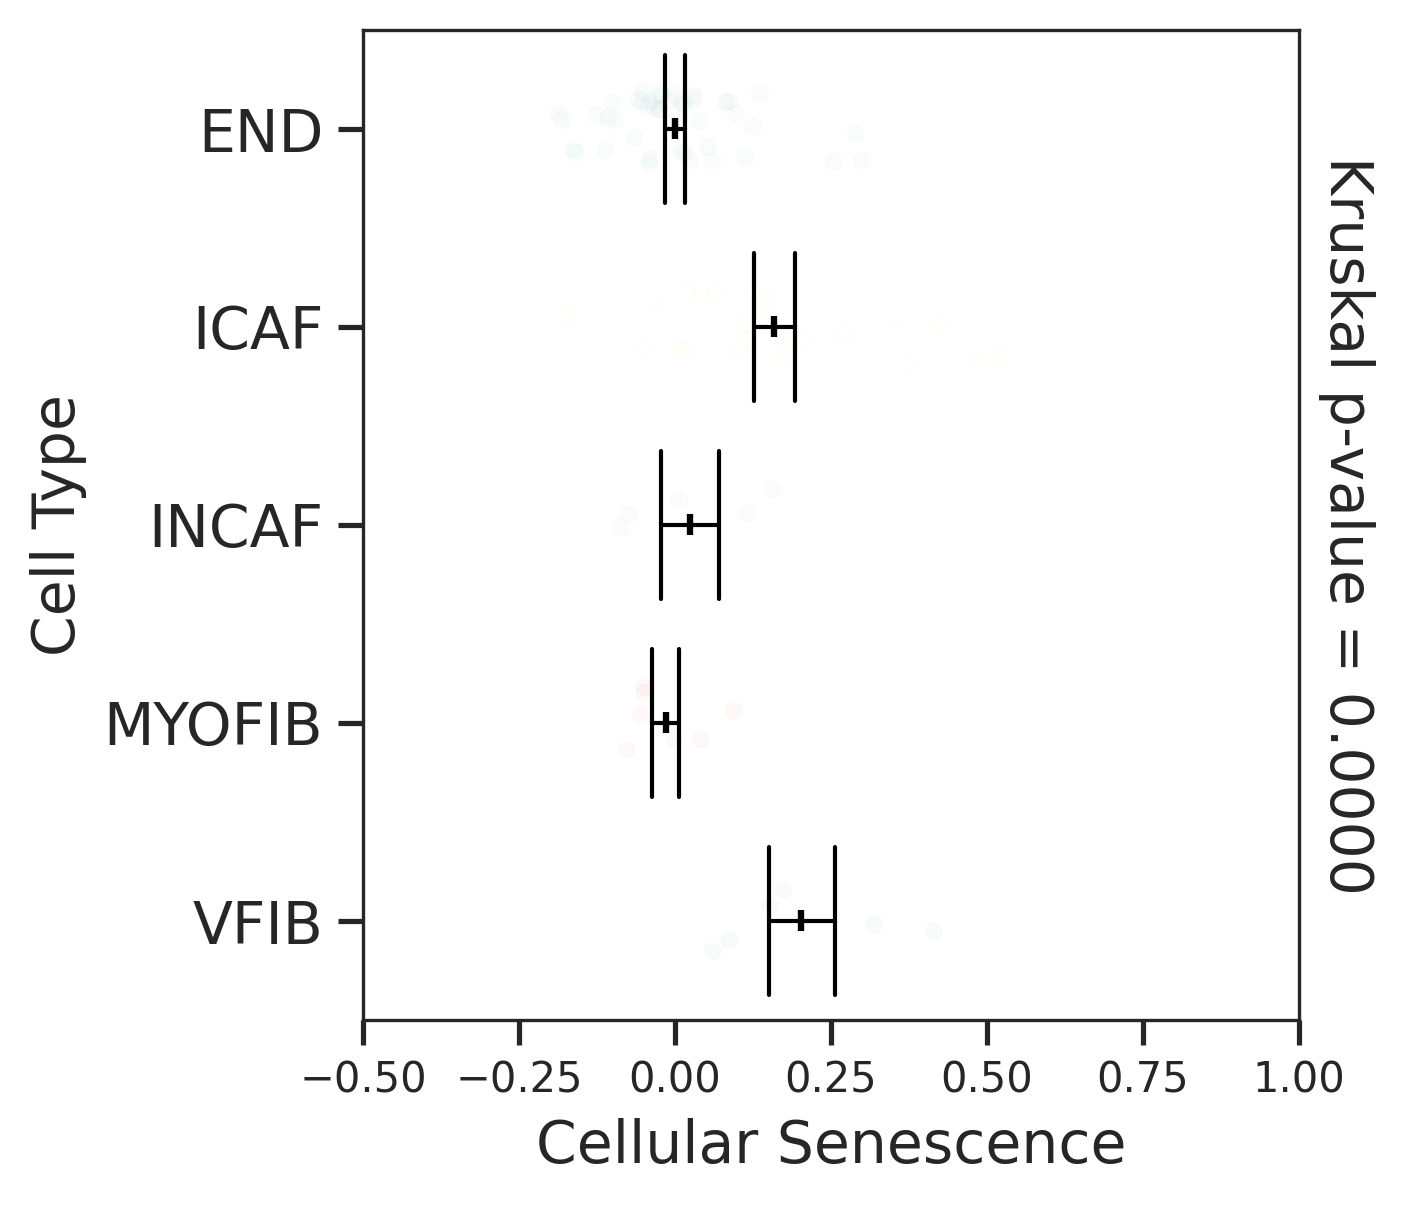 |
| AD | 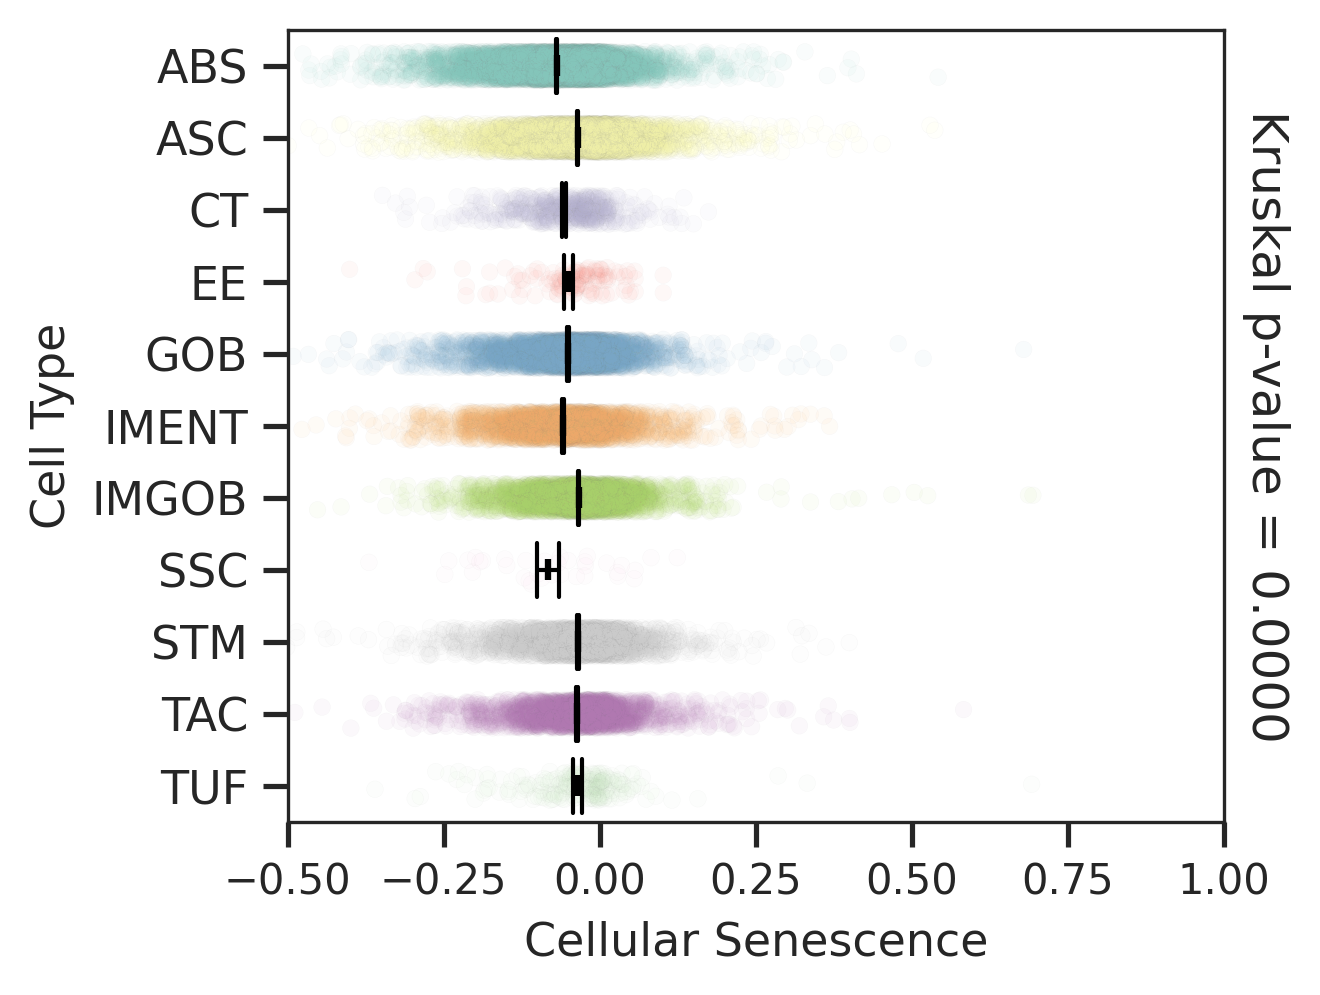 | 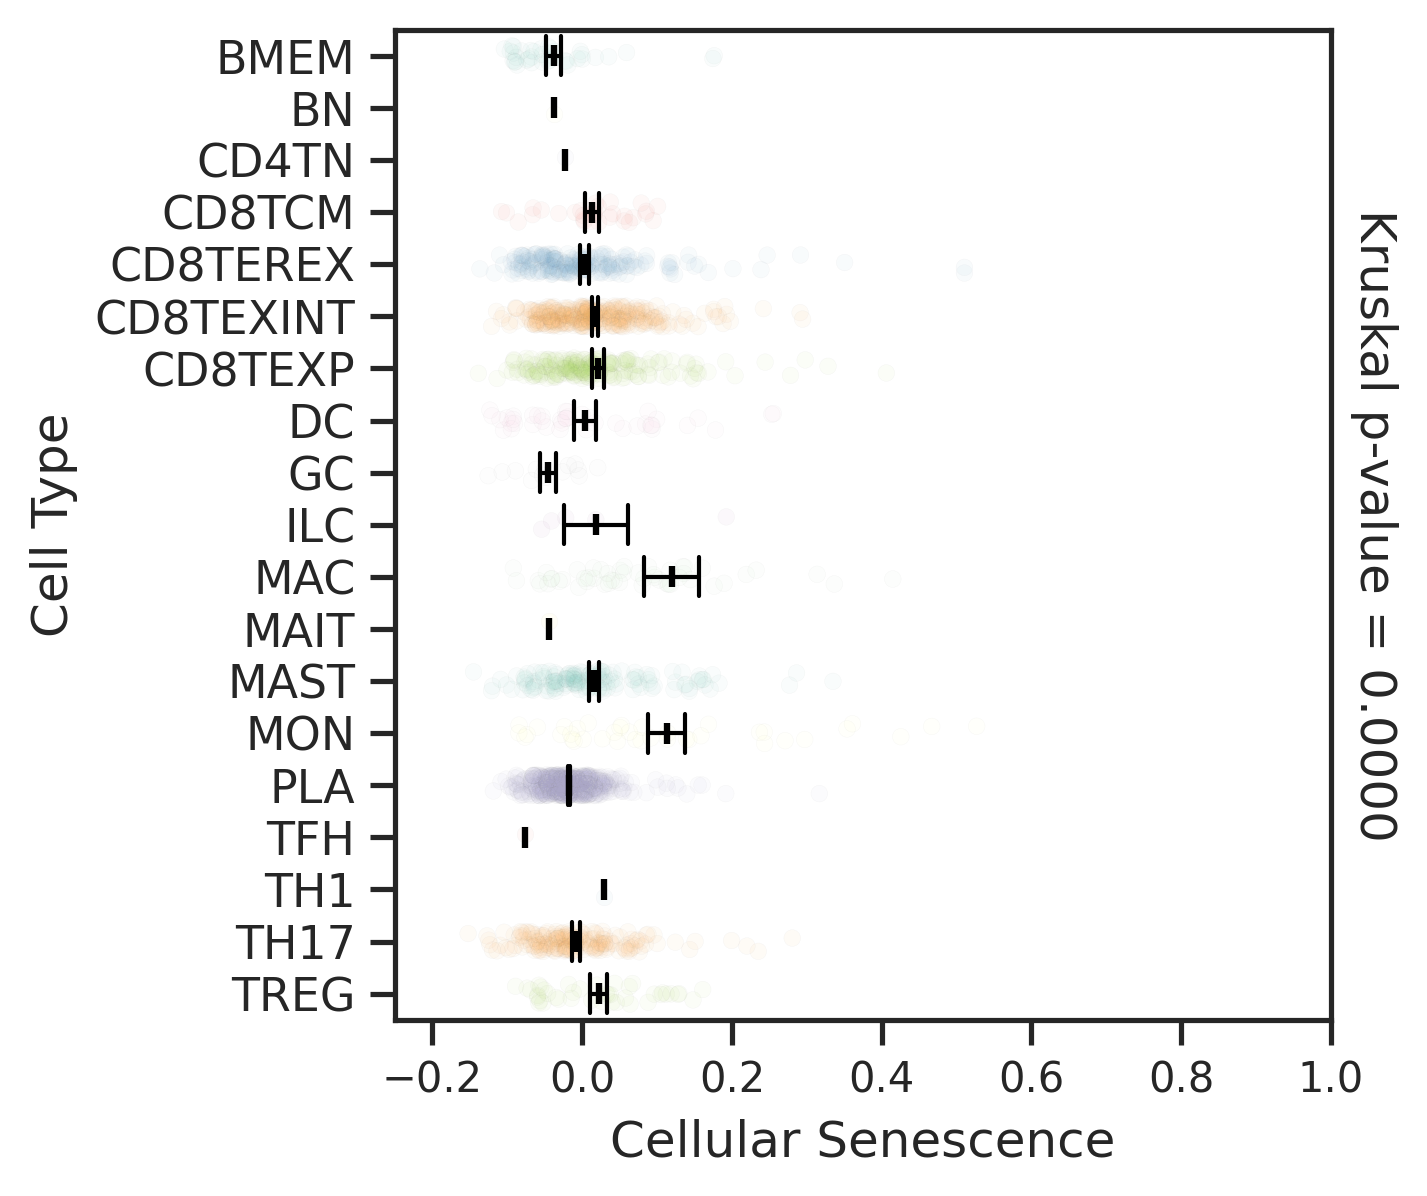 | 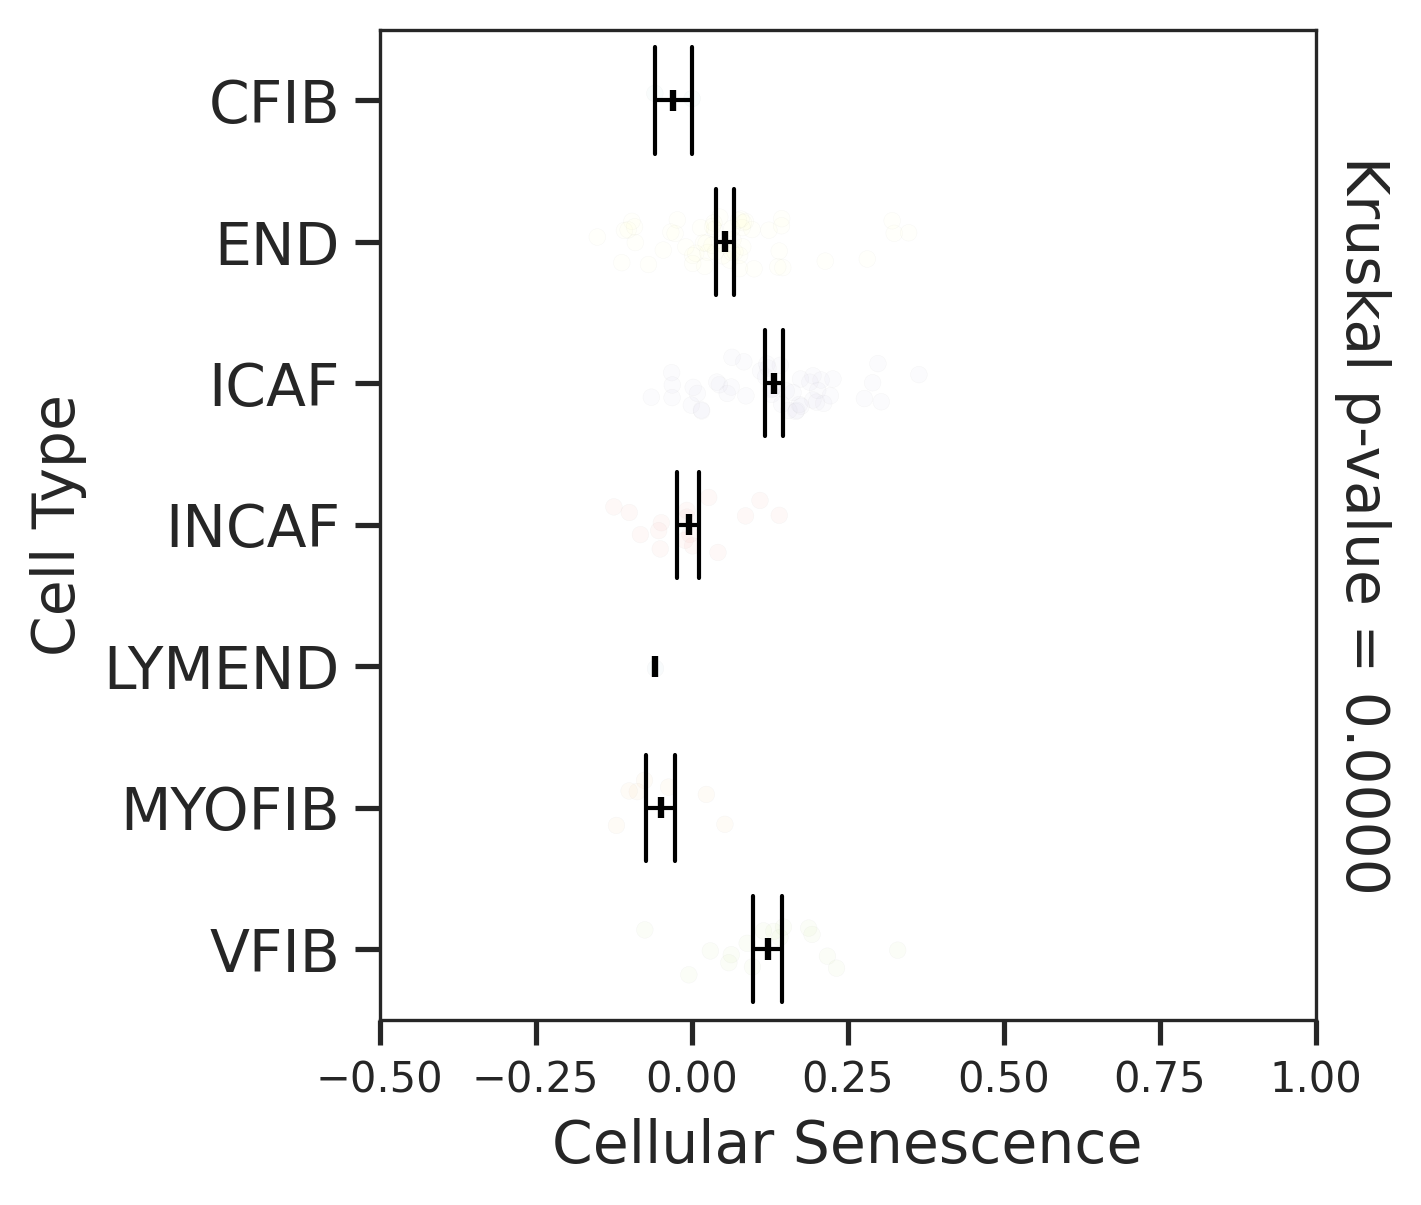 |
| FAP | 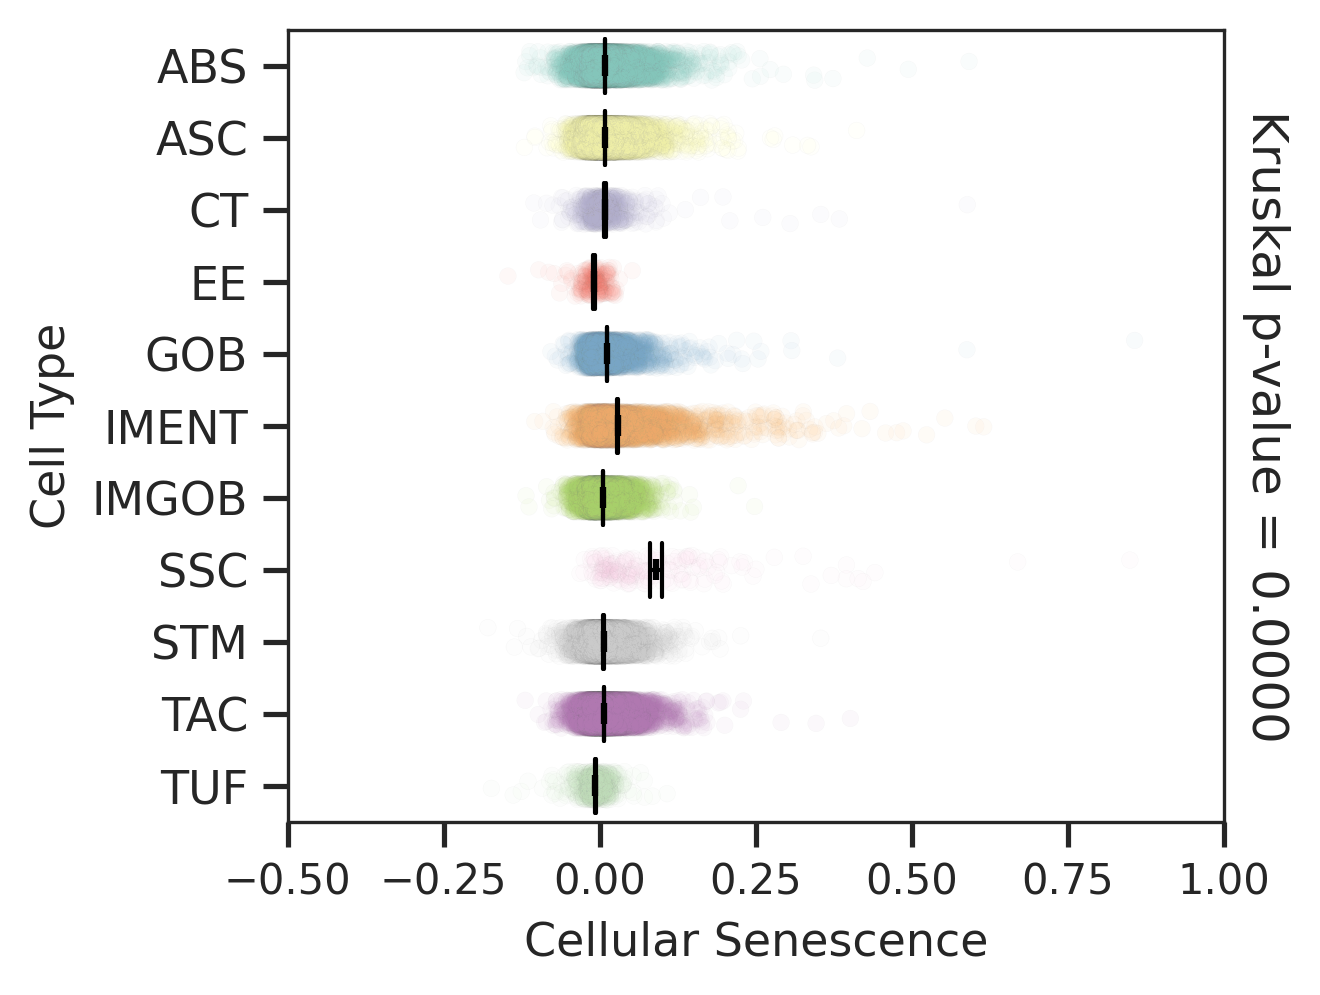 | 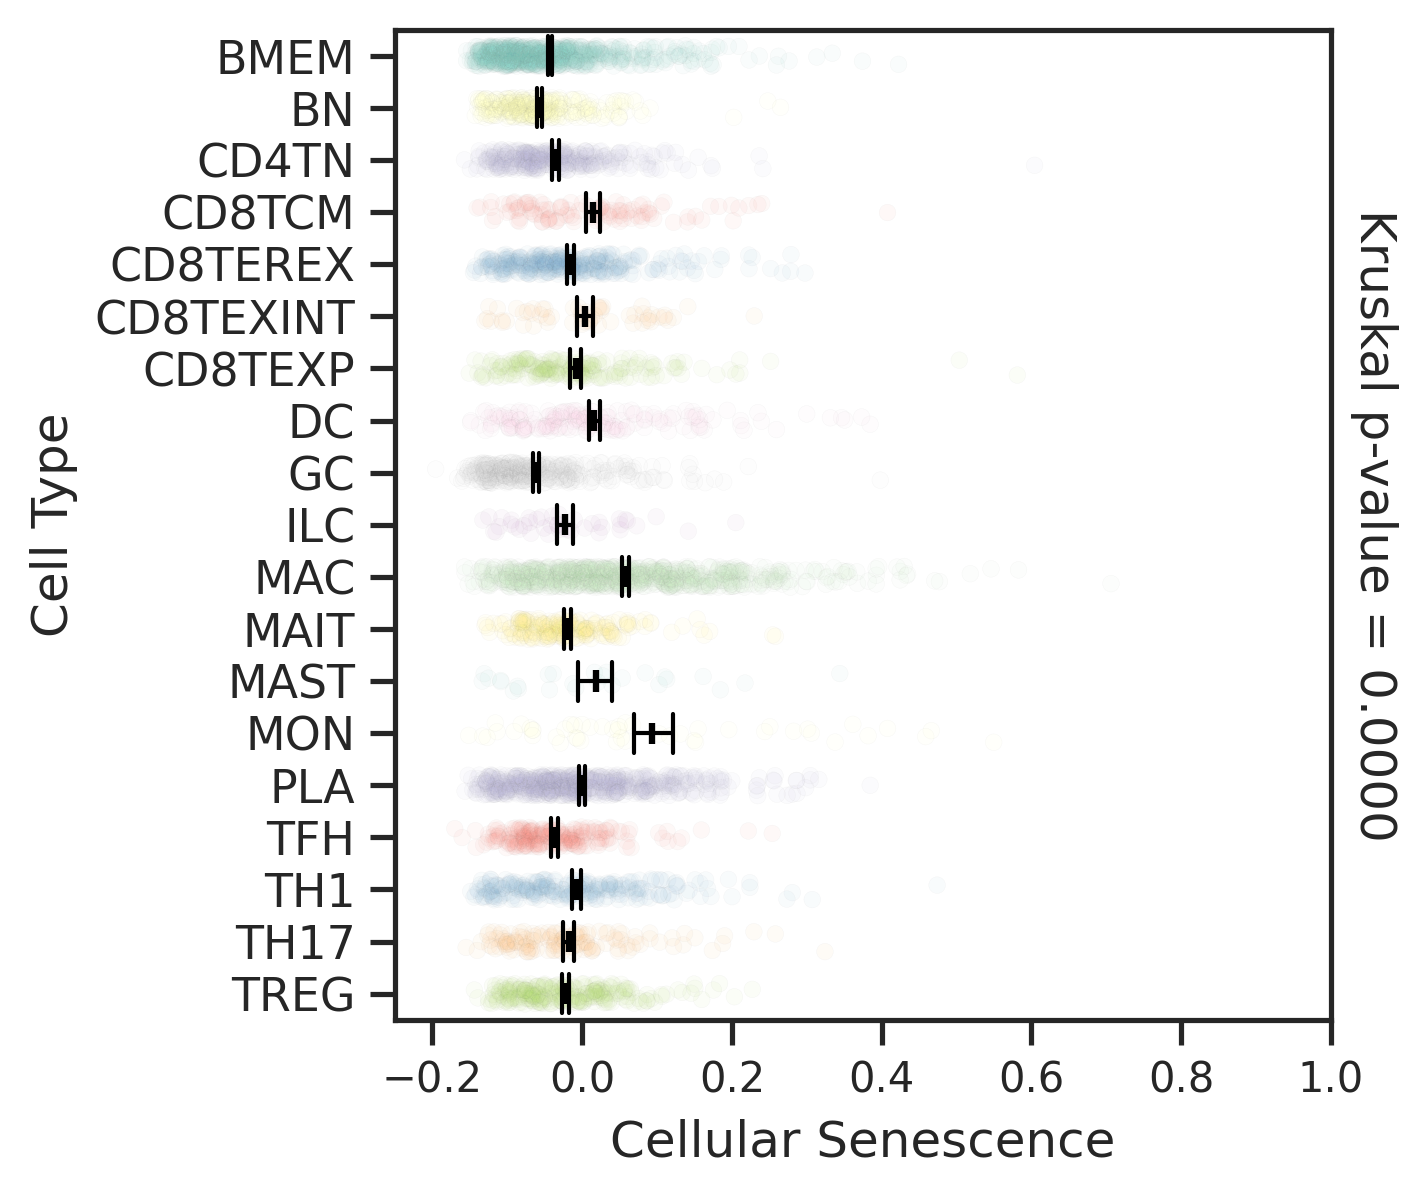 | 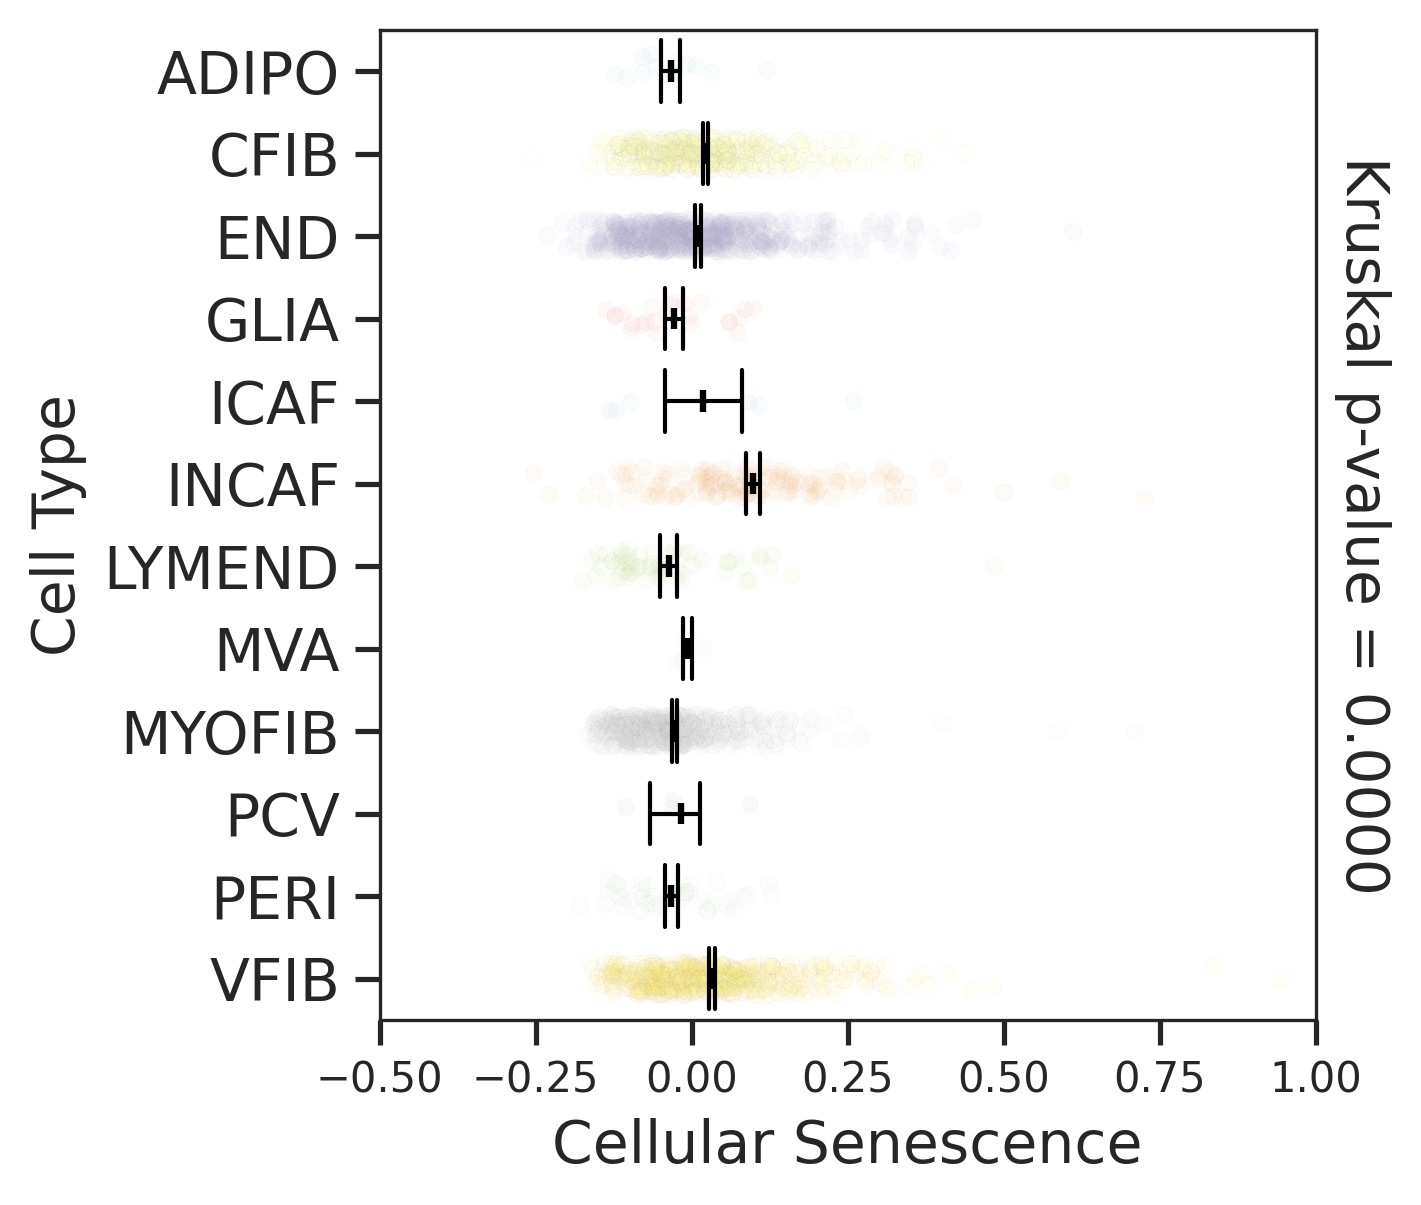 |
| MSI-H | 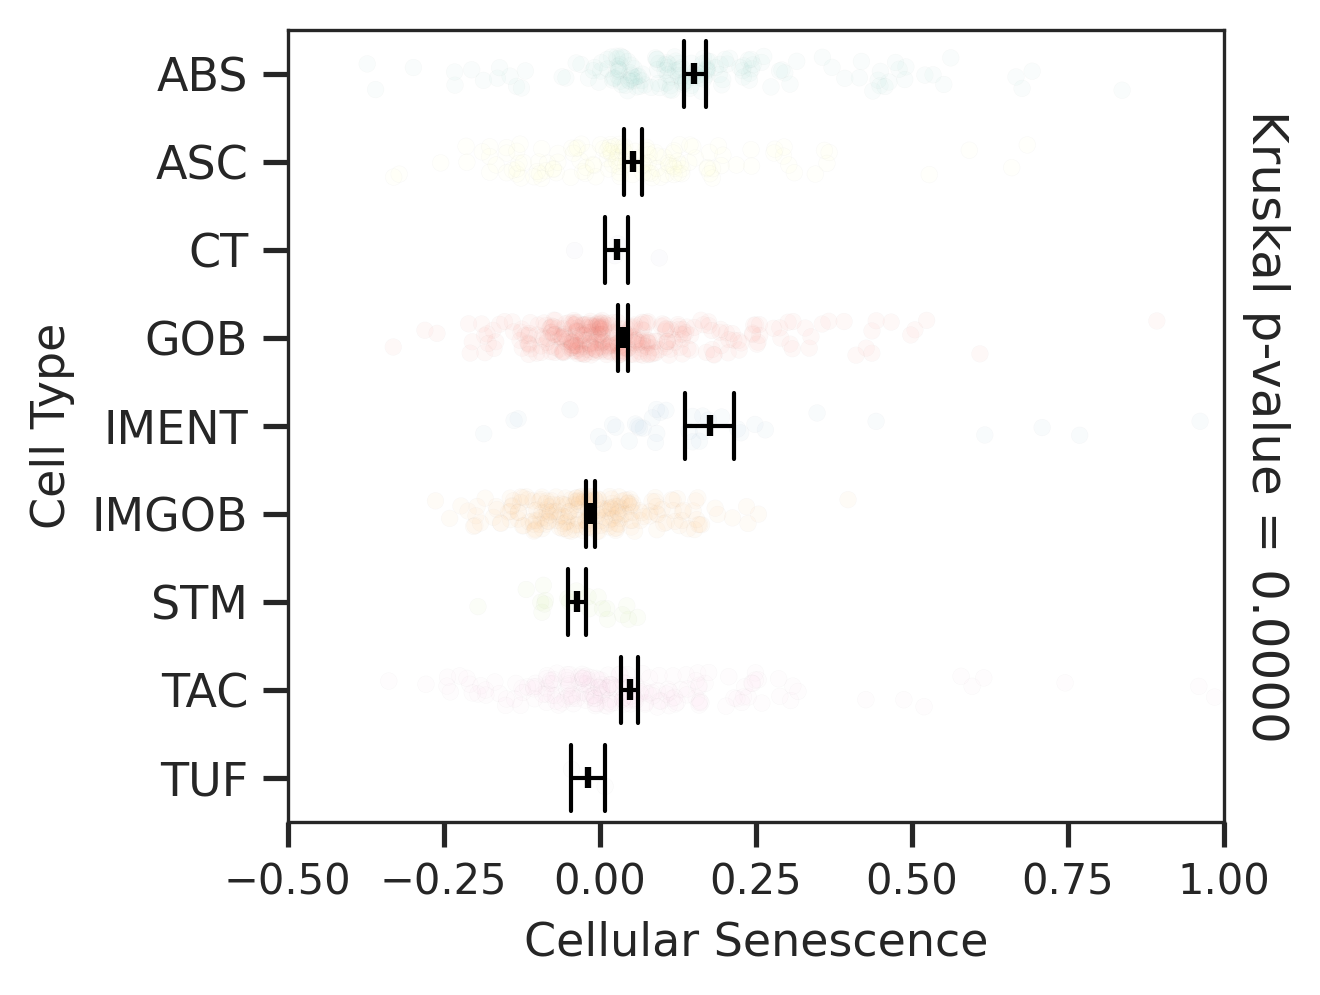 | 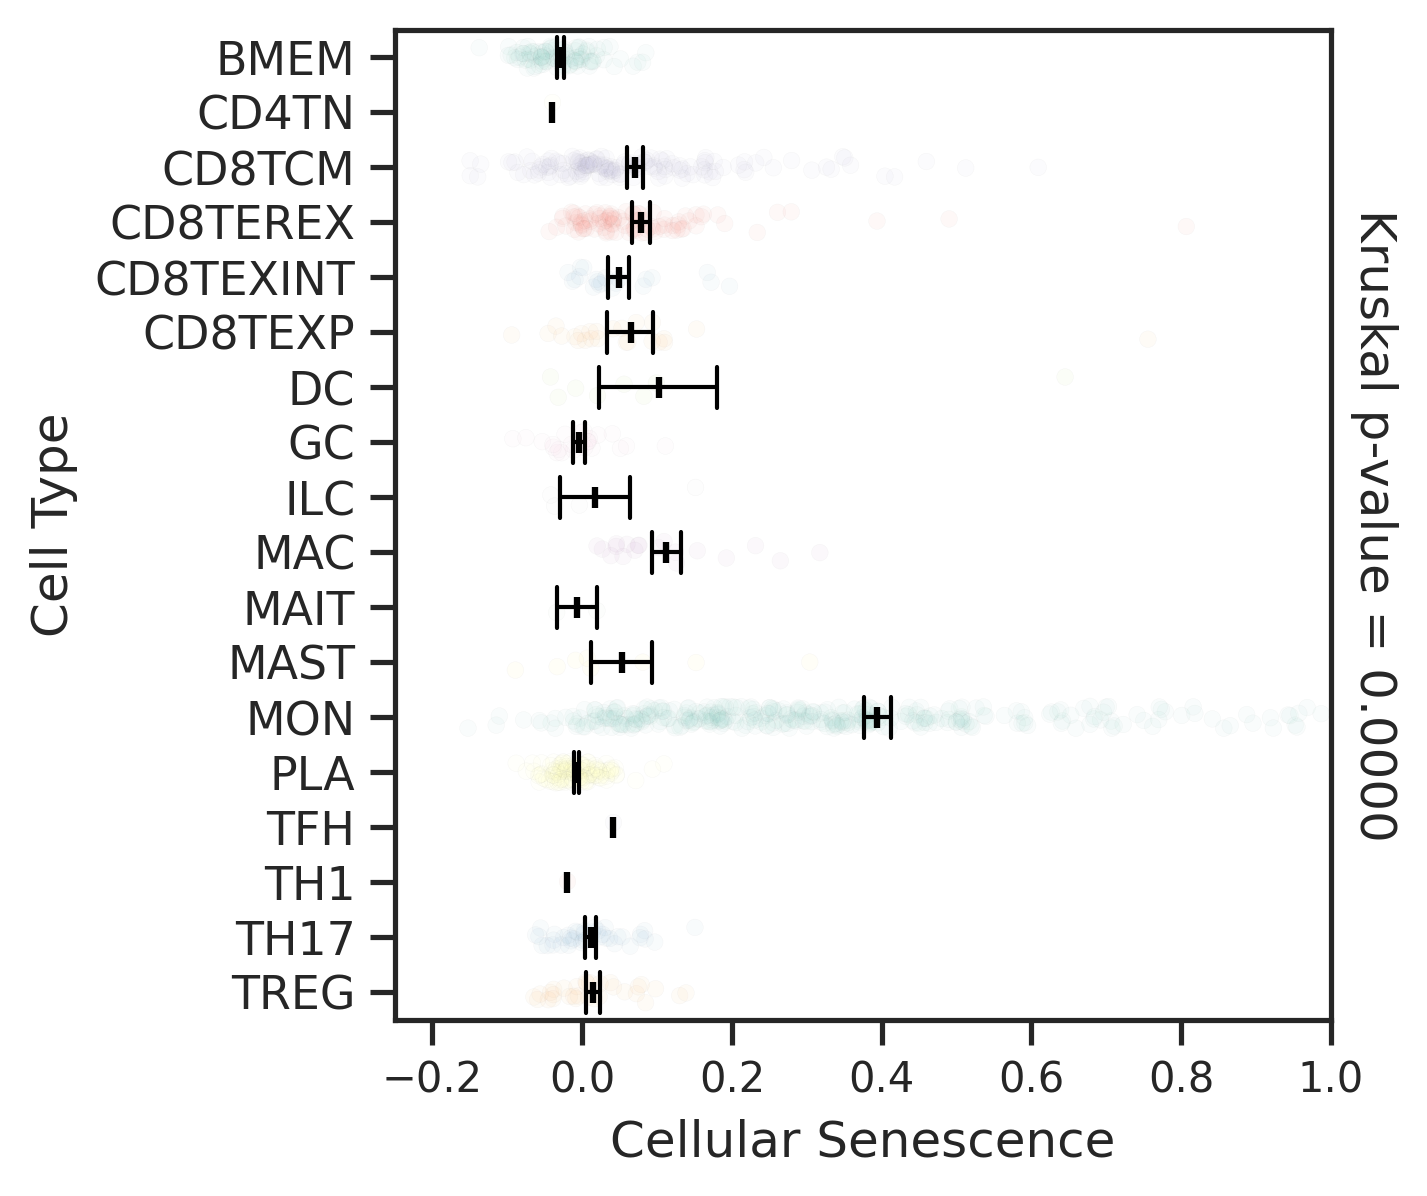 | 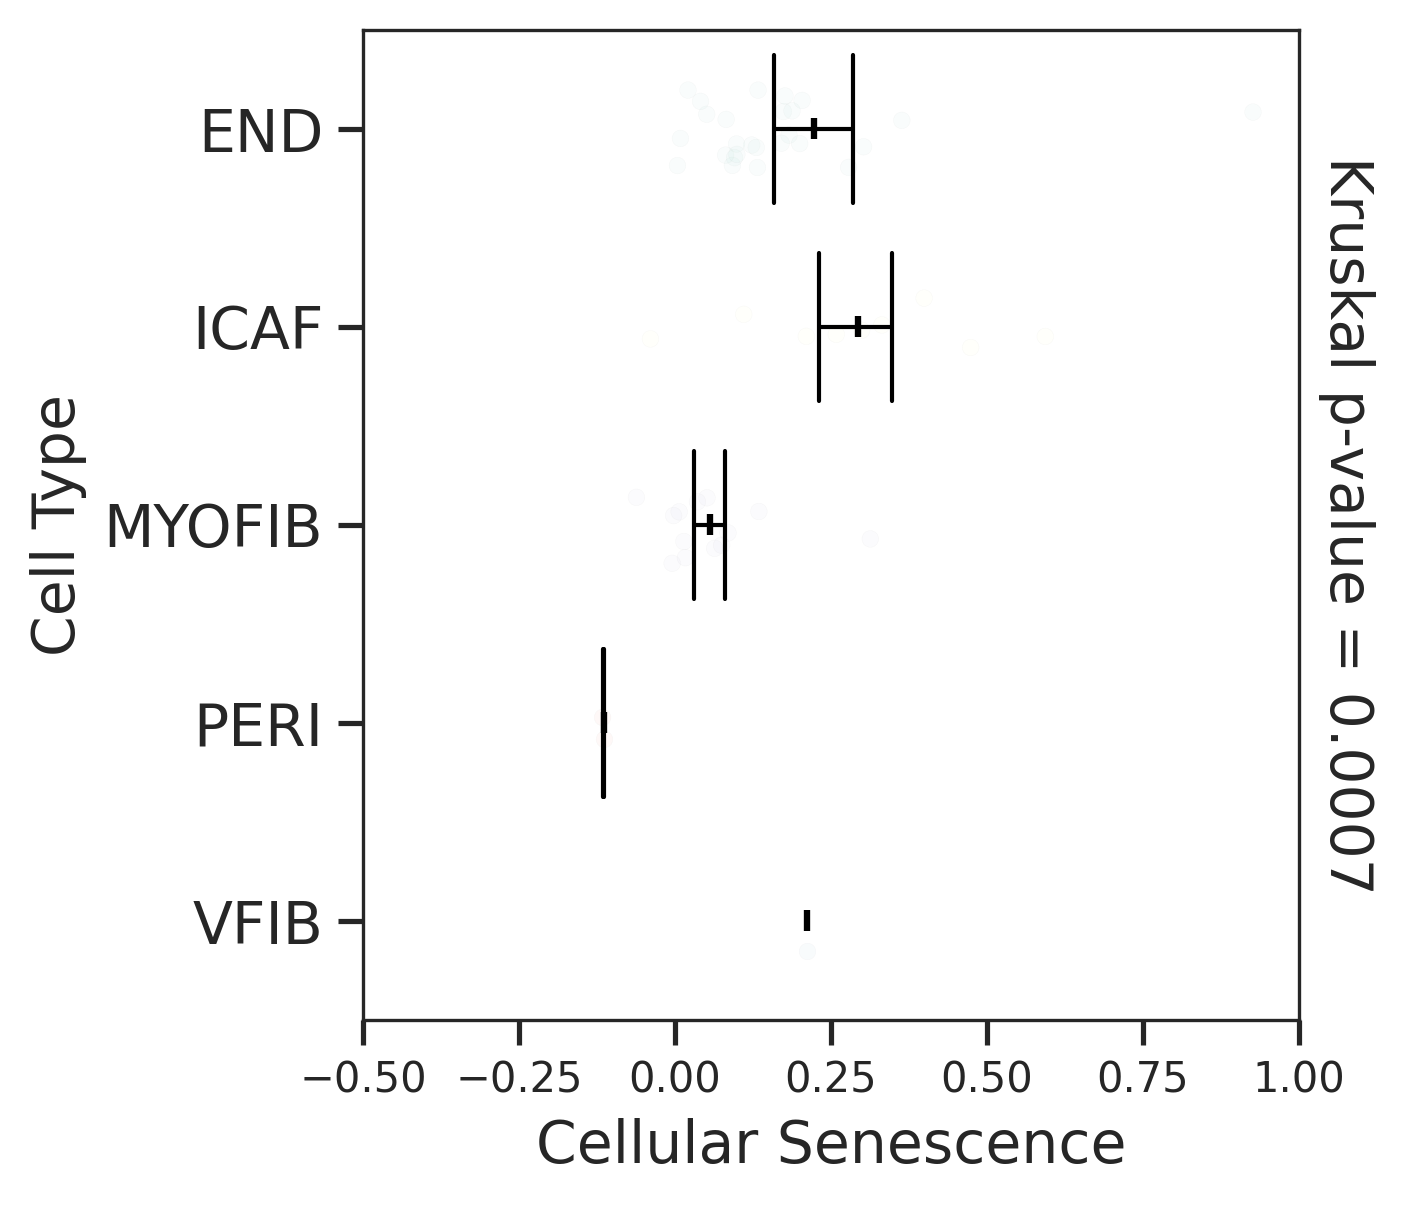 |
| MSS | 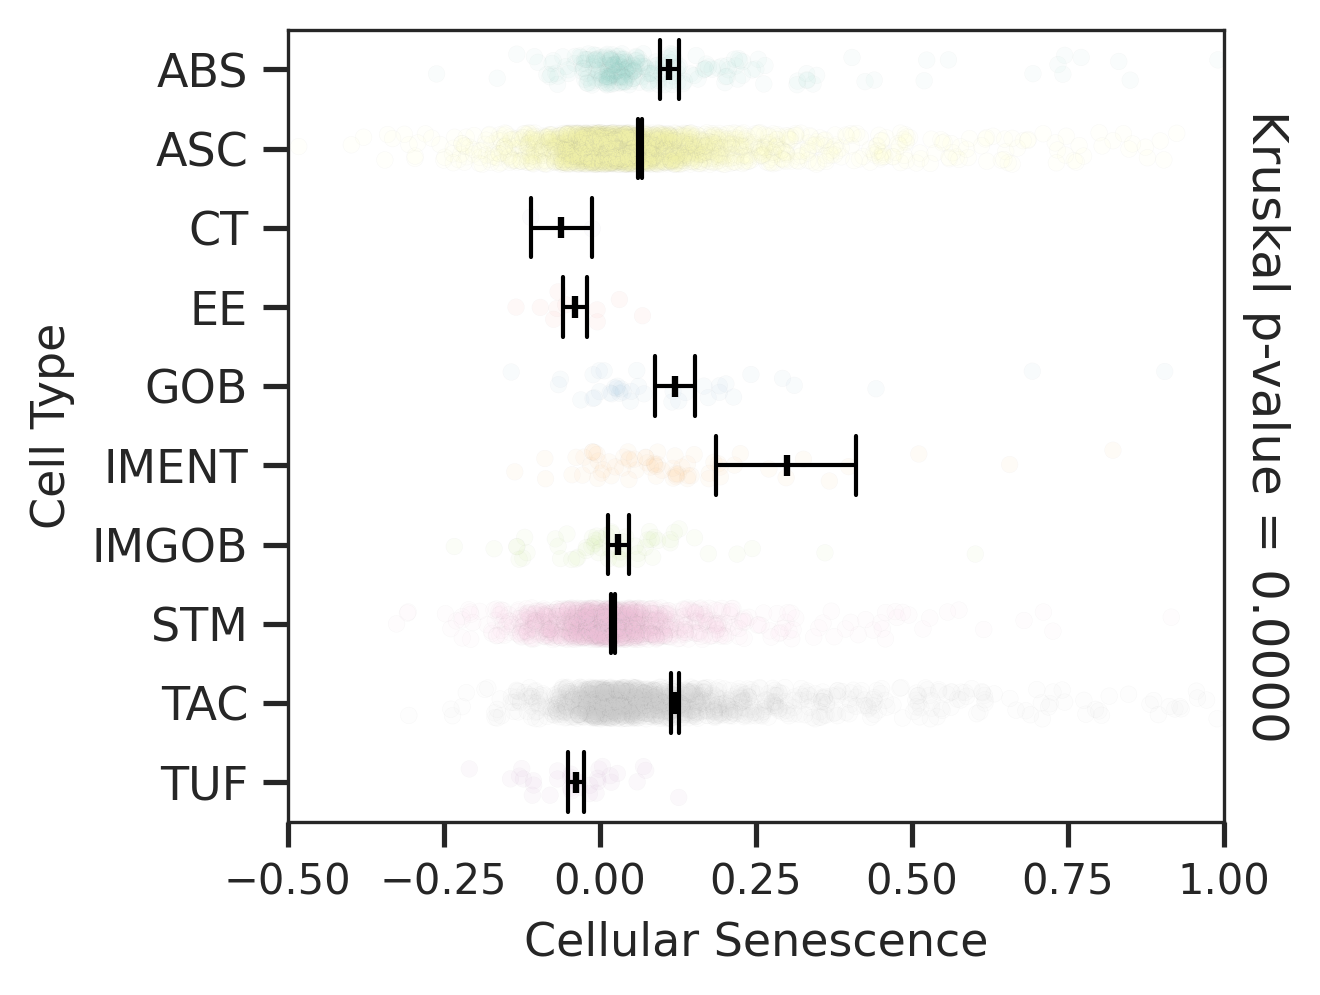 | 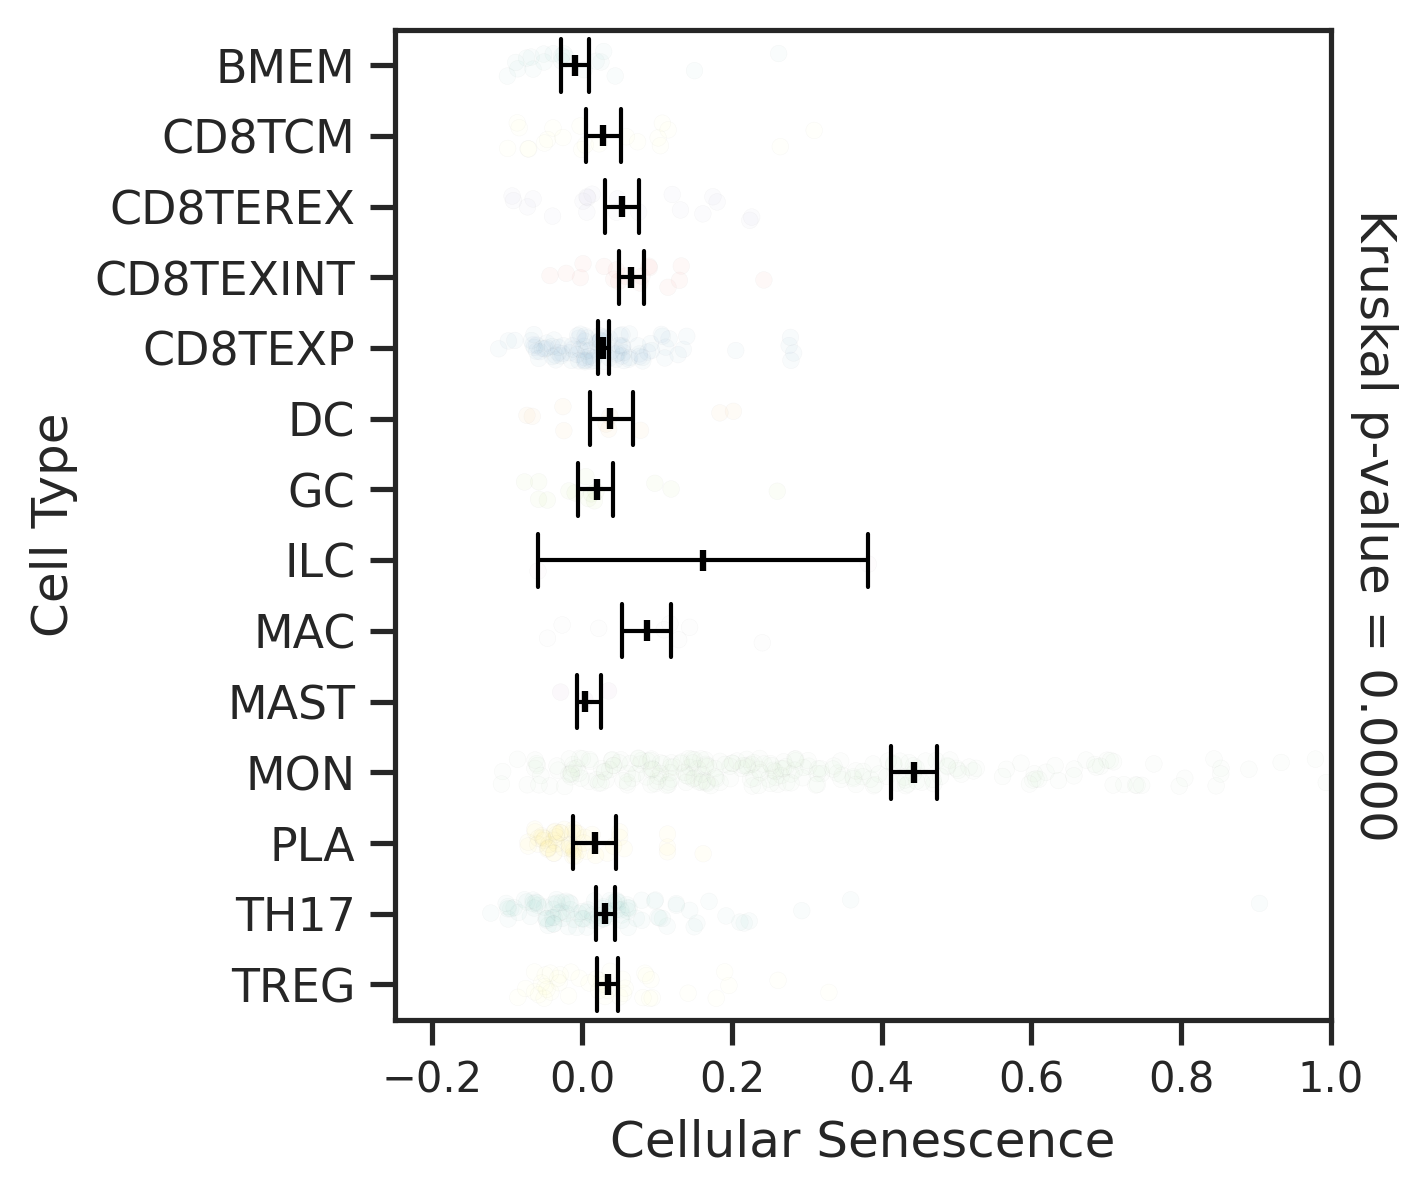 | 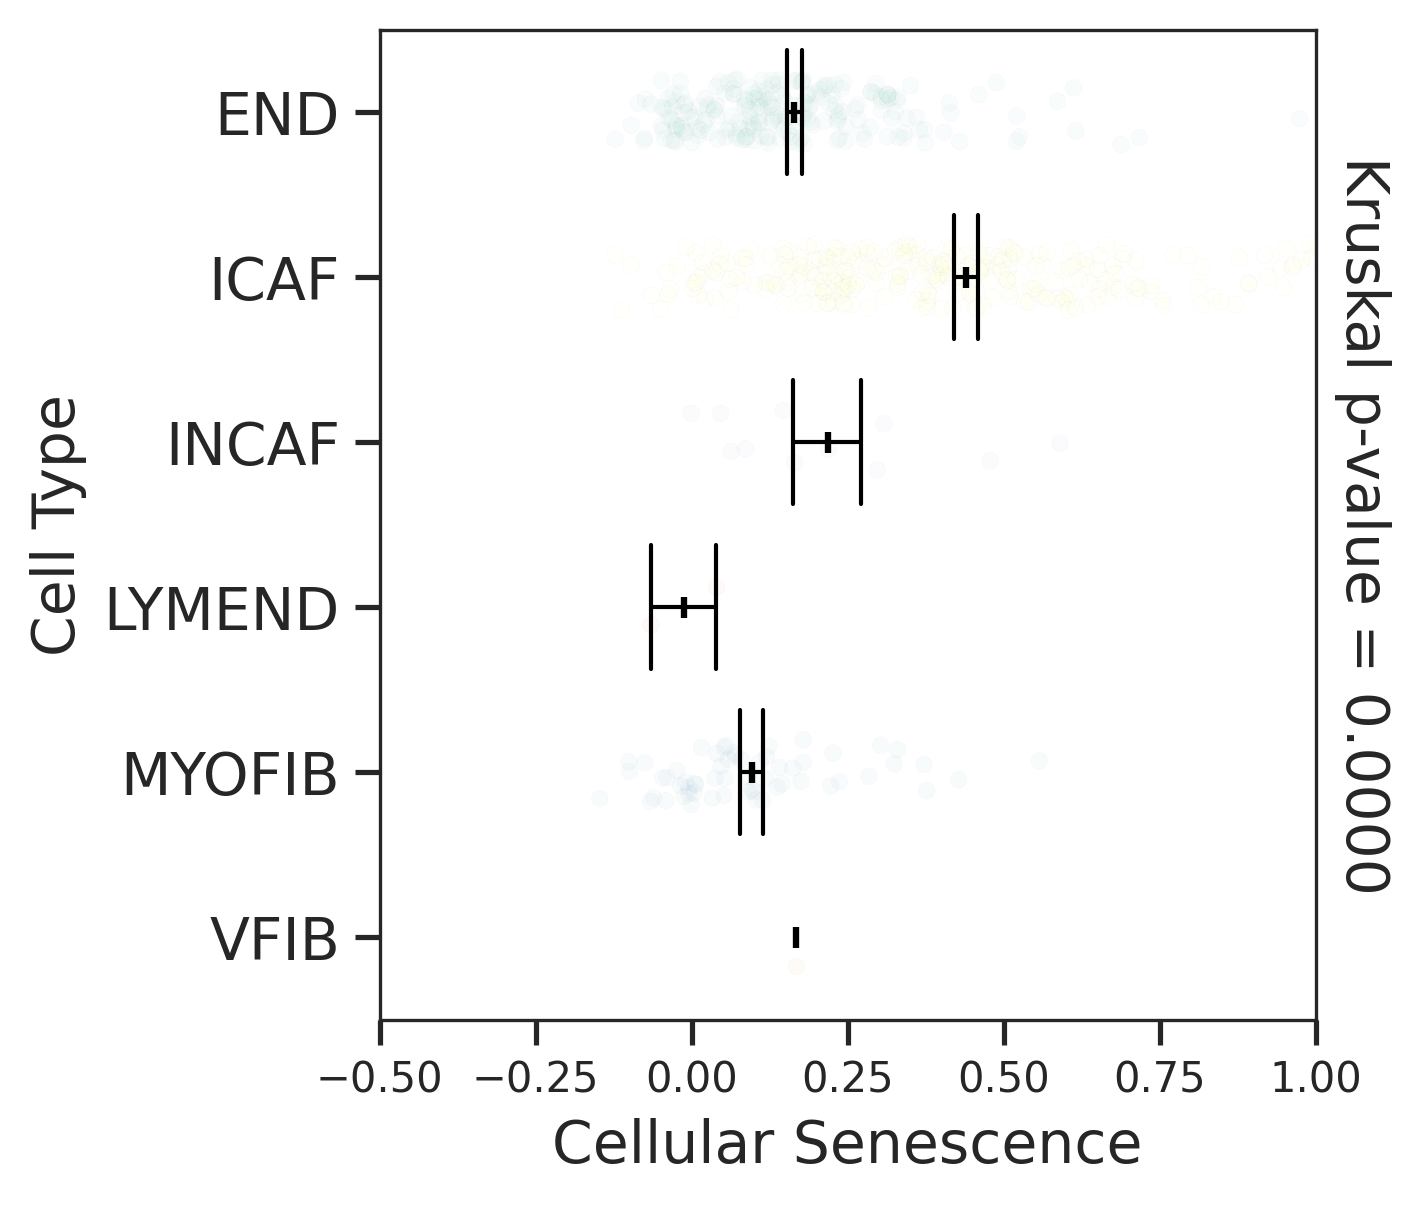 |
| CRC | 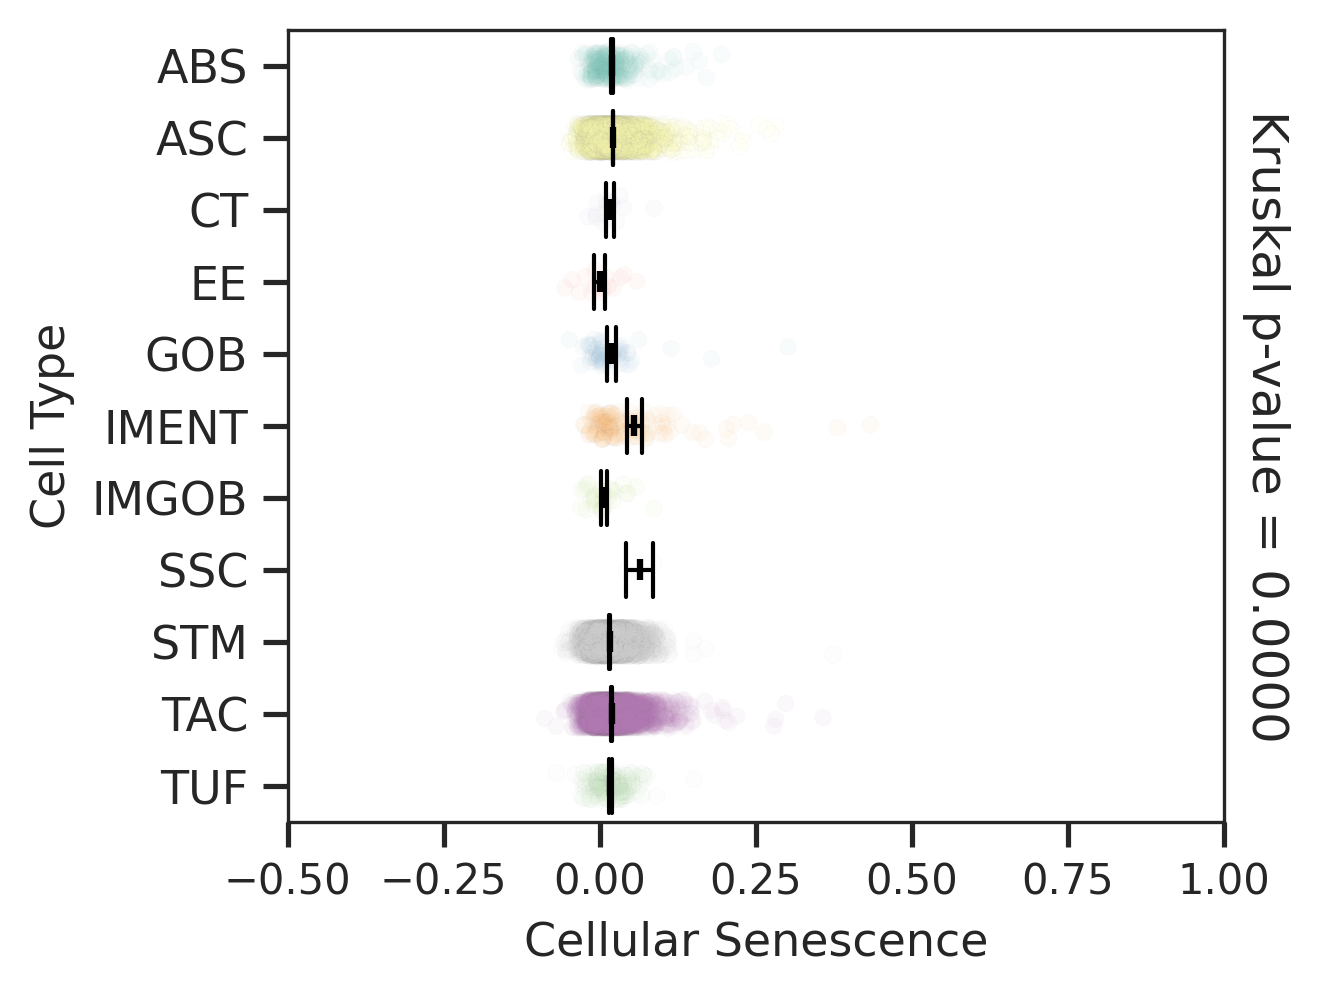 | 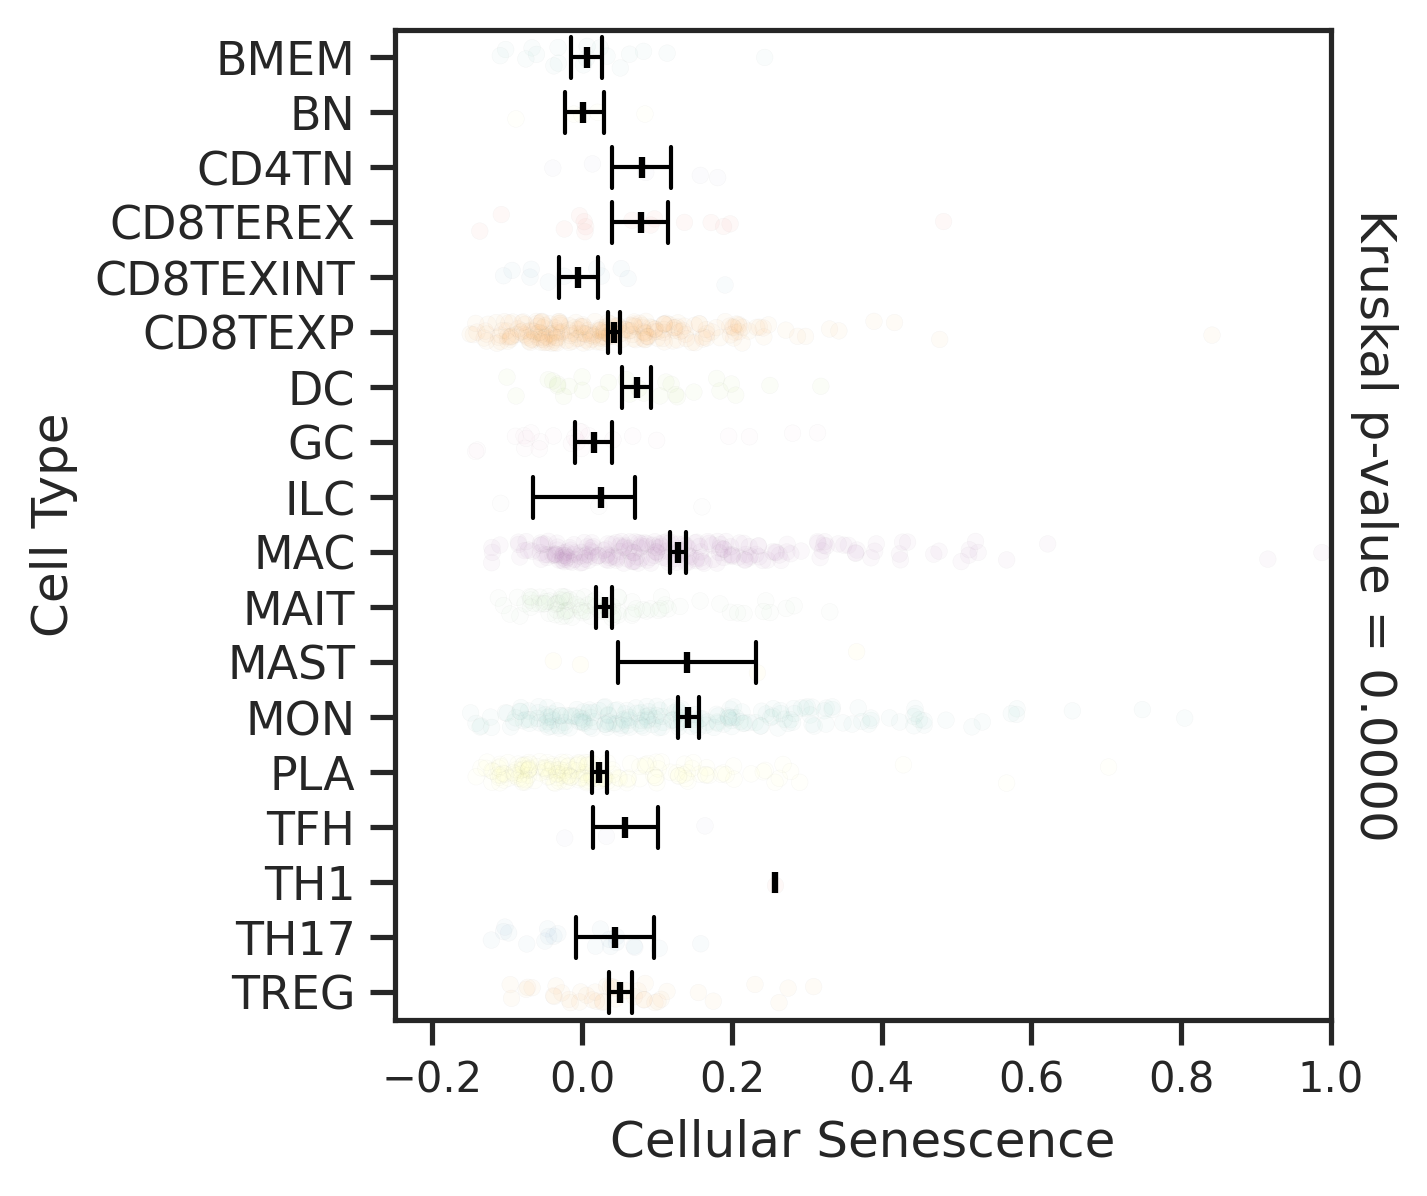 | 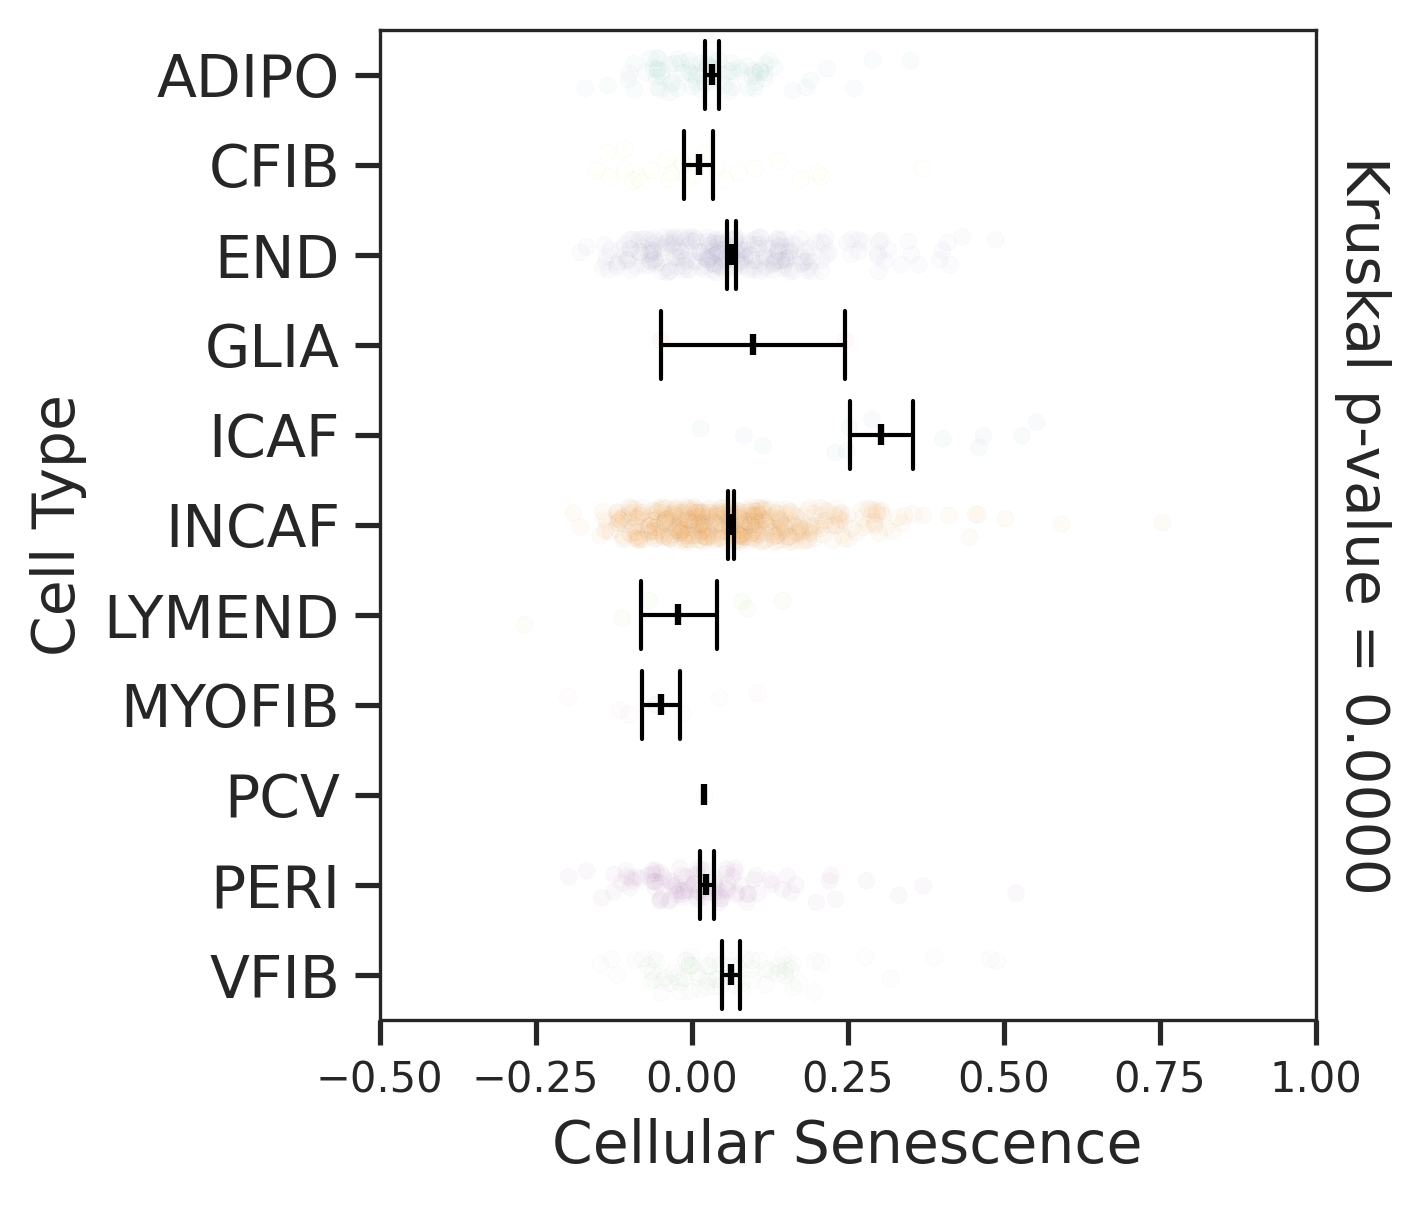 |
| ∗Comparisons for degree of cellular senescence among epithelial, immune and stromal cell populations of Colorectum tissue with different disease states. |
| Healthy | SER | AD | |
 |  |  | |
| FAP | MSI-H | MSS | CRC |
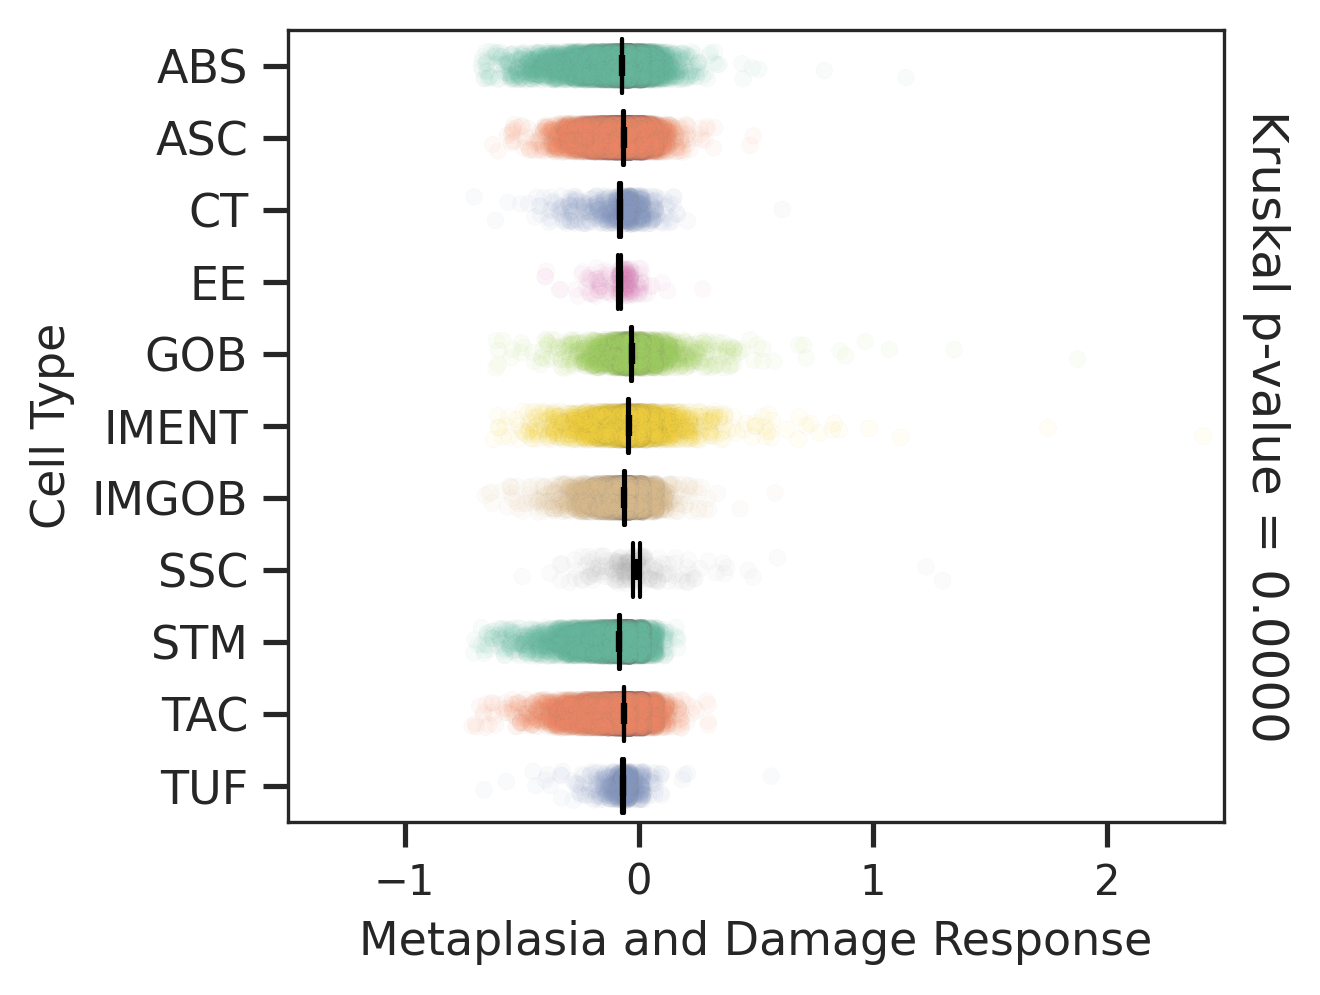 | 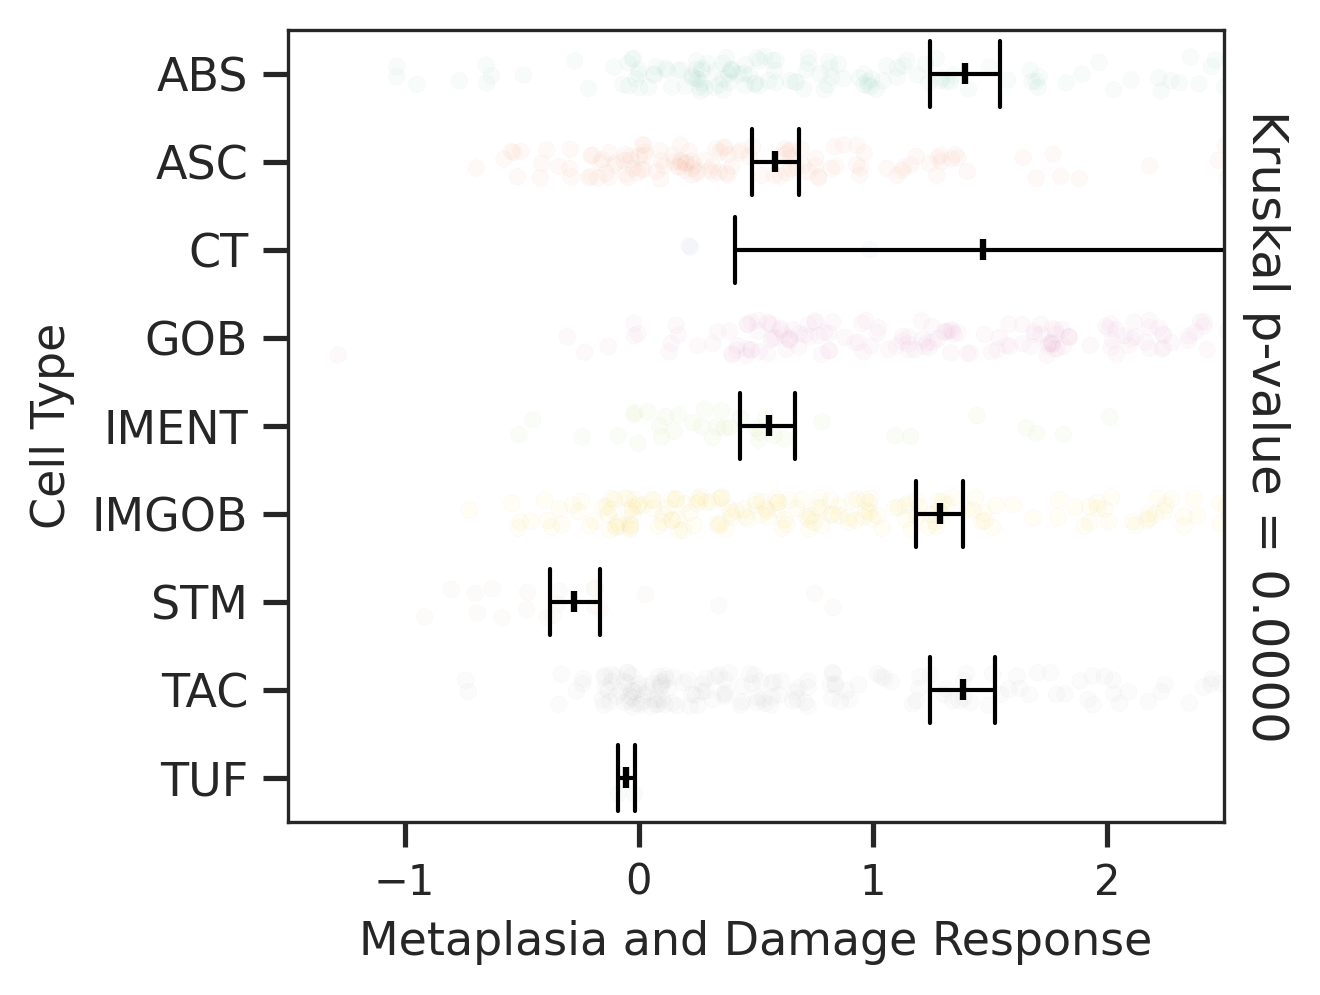 | 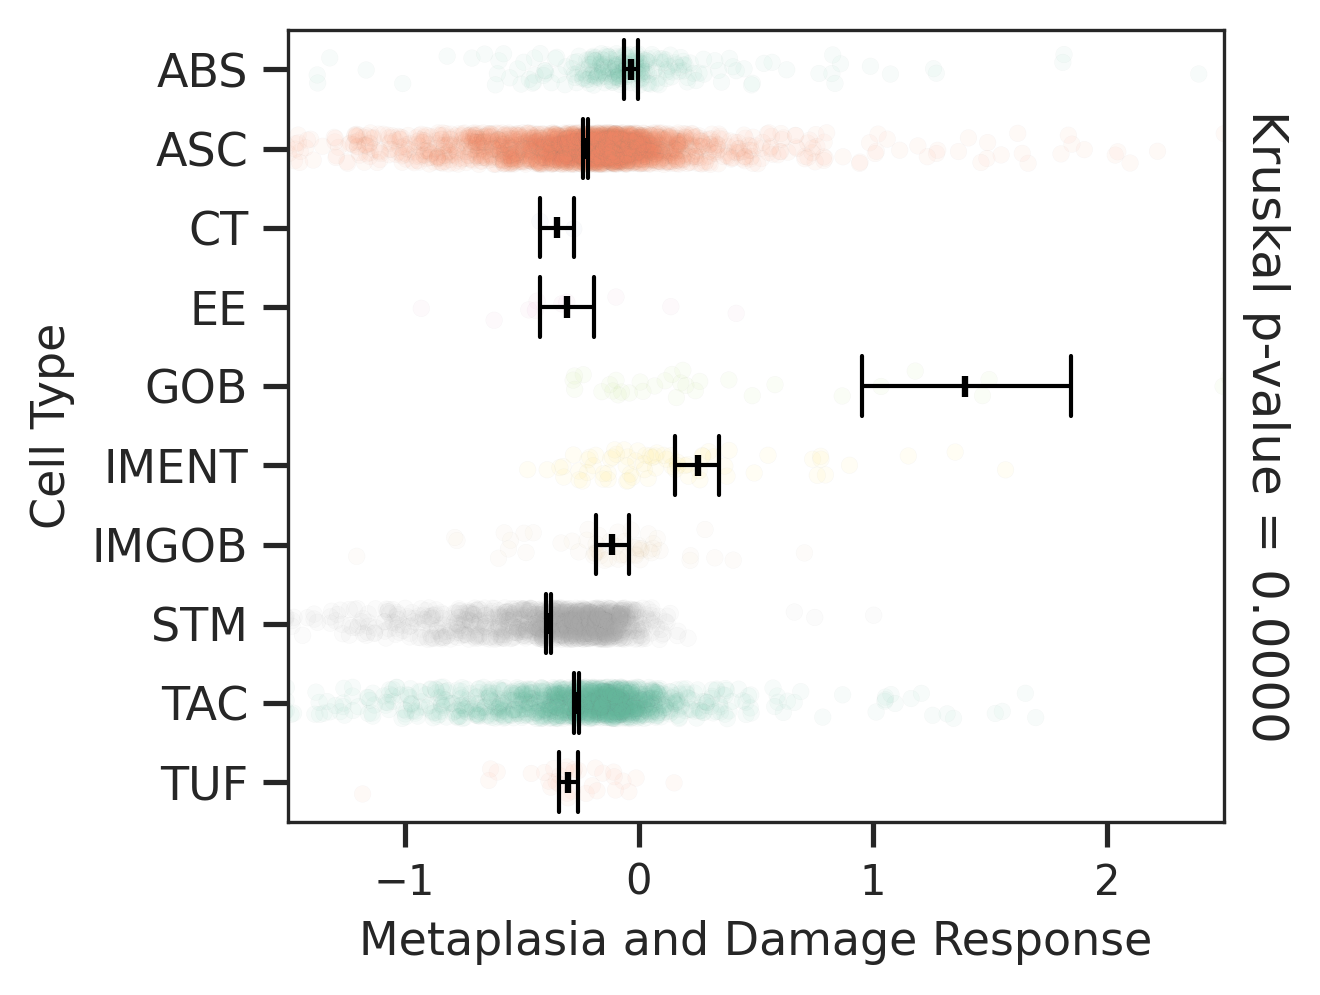 | 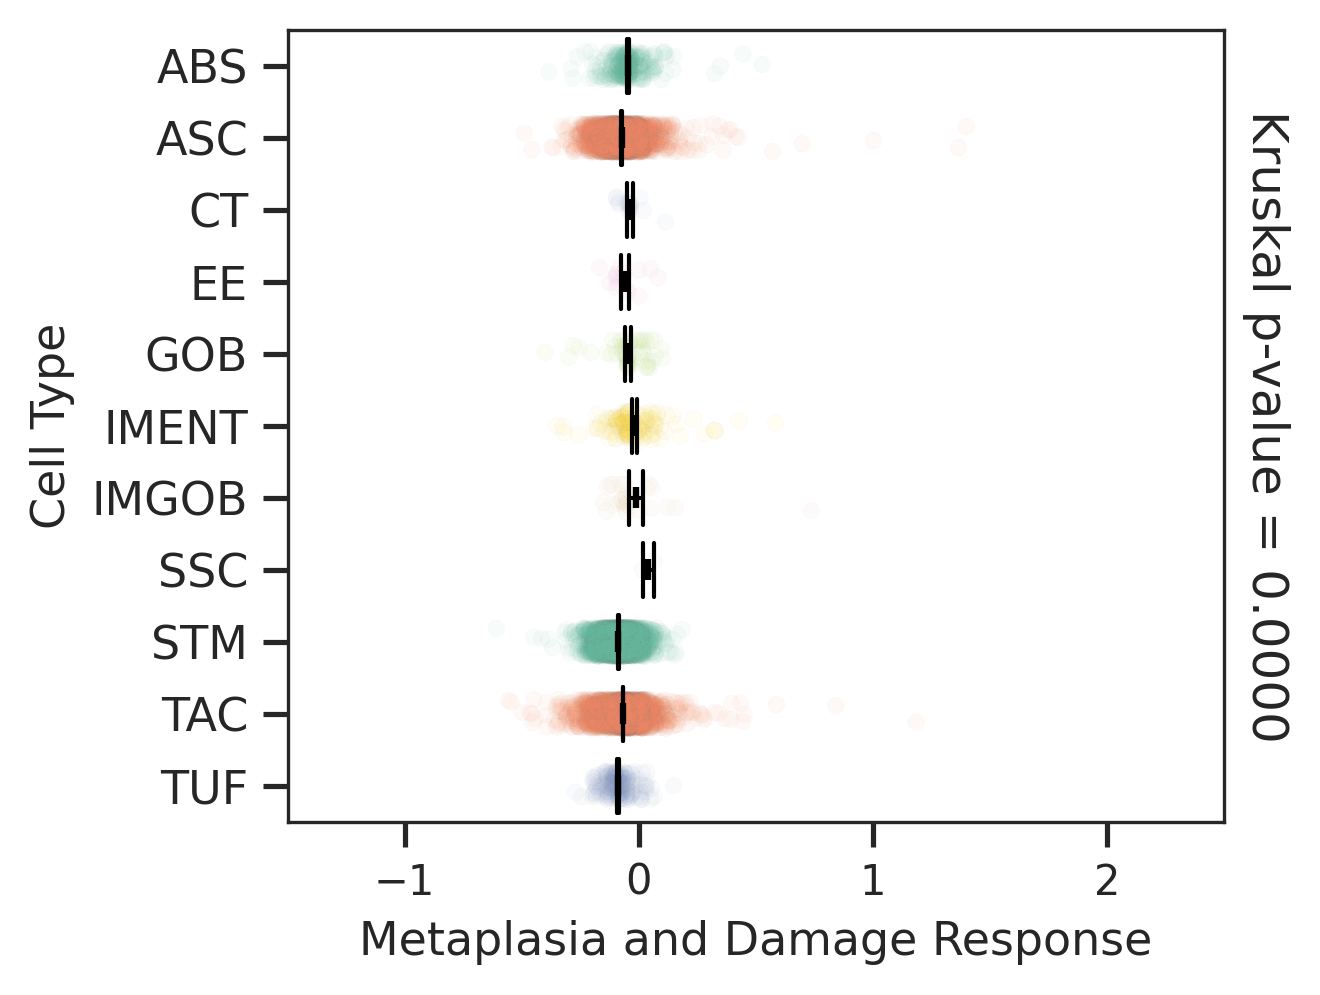 |
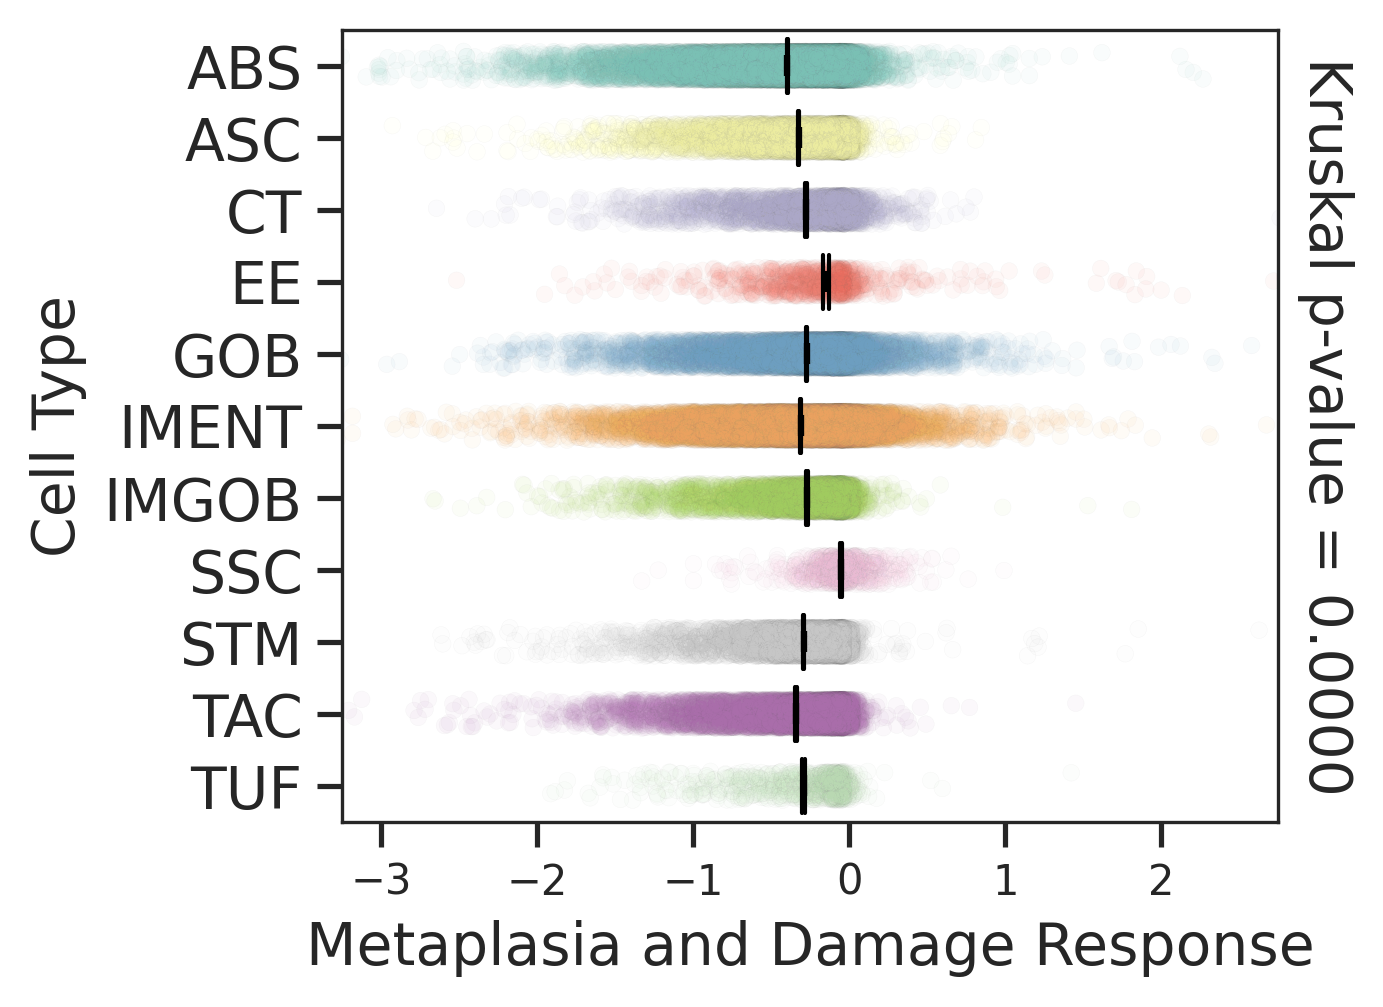
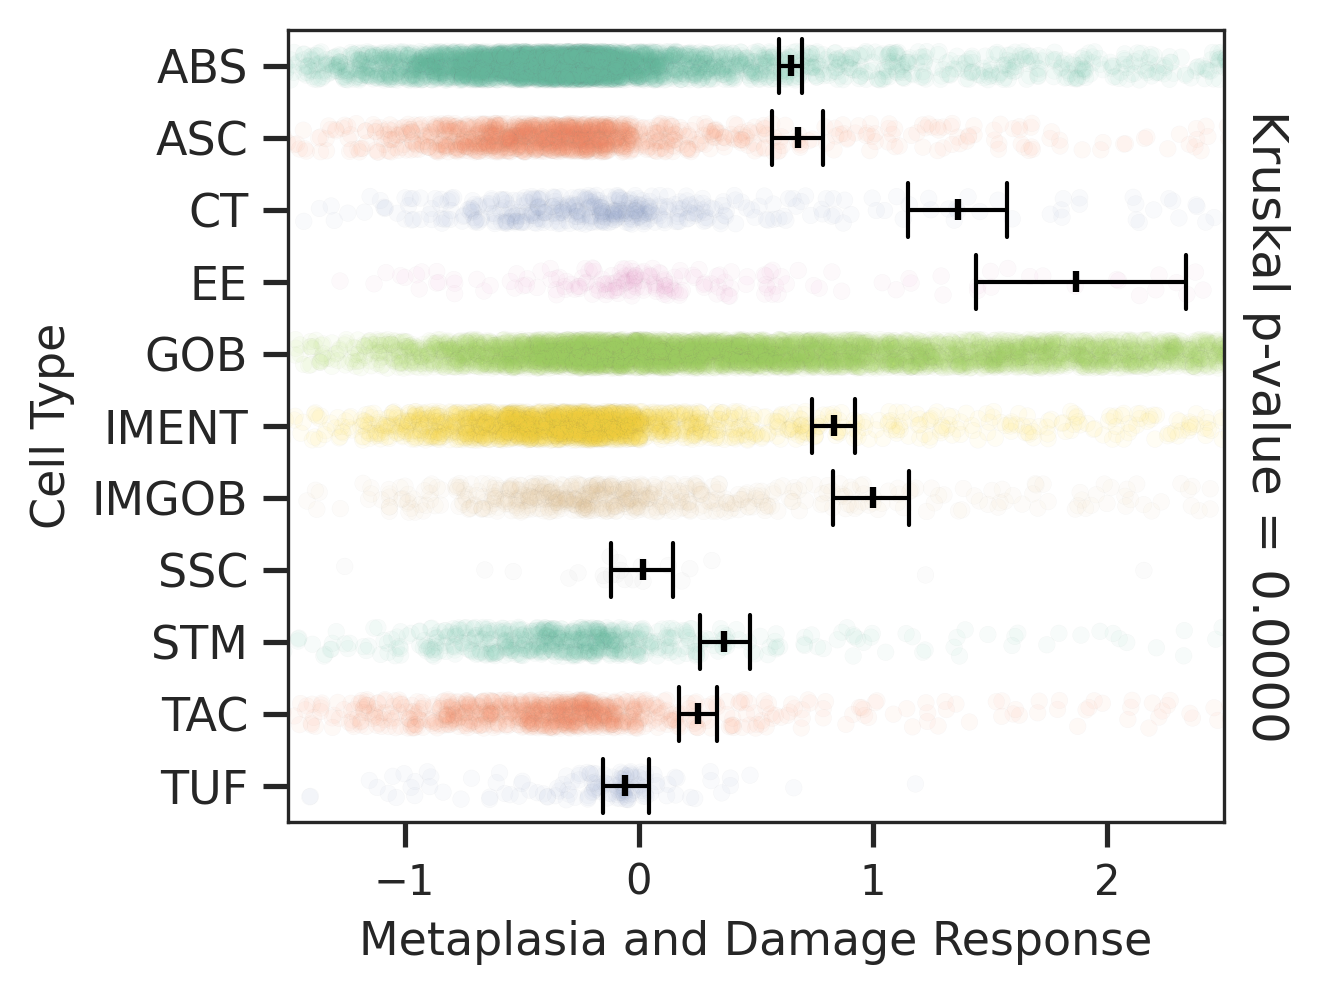
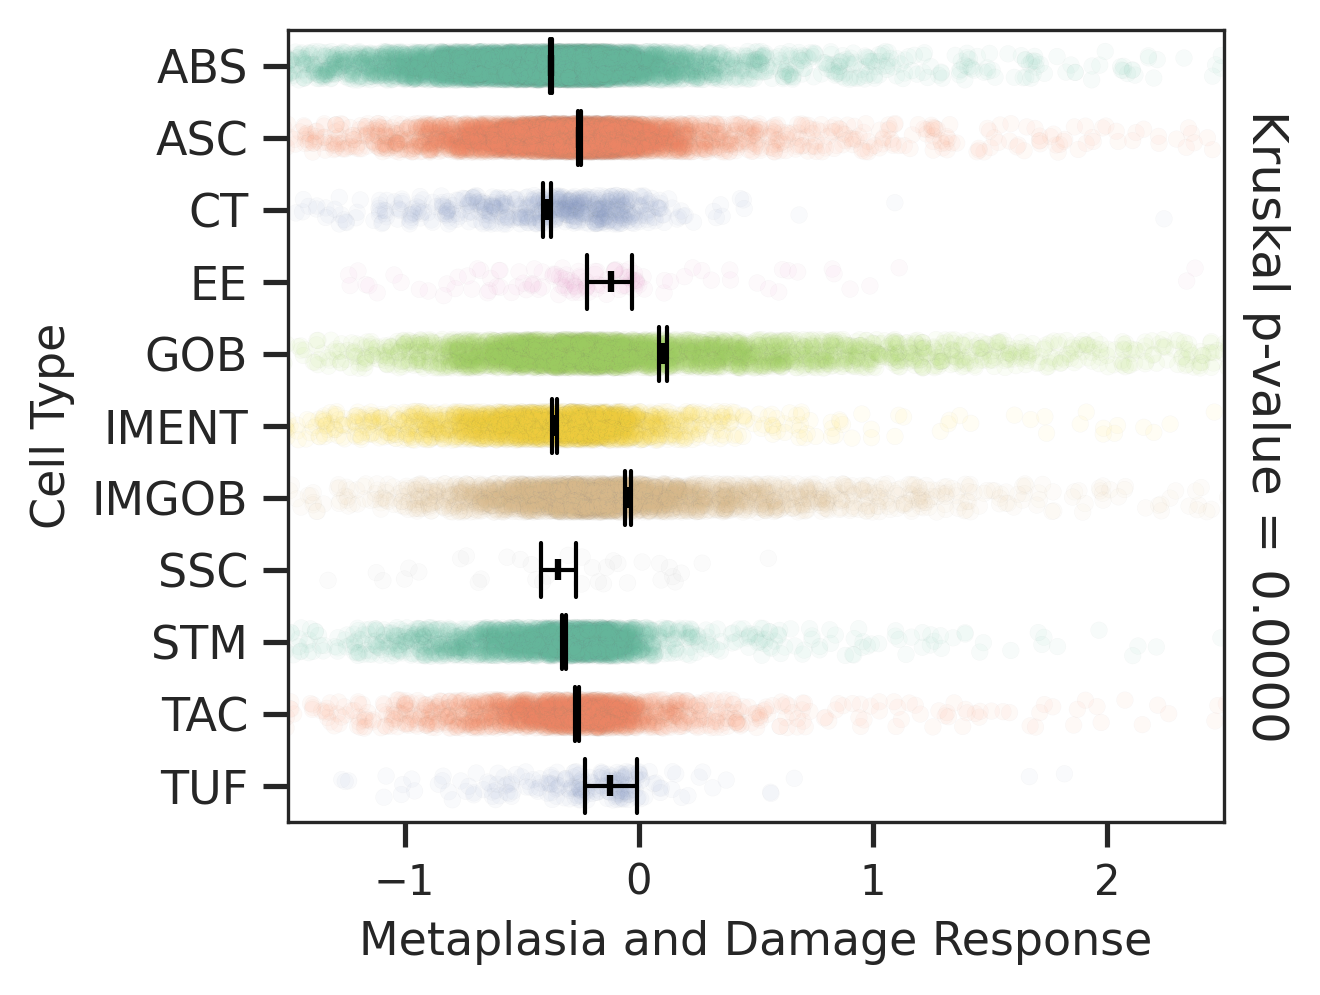
| ∗Comparisons of Metaplasia-associated damage scores among epithelial cell subpopulations. |
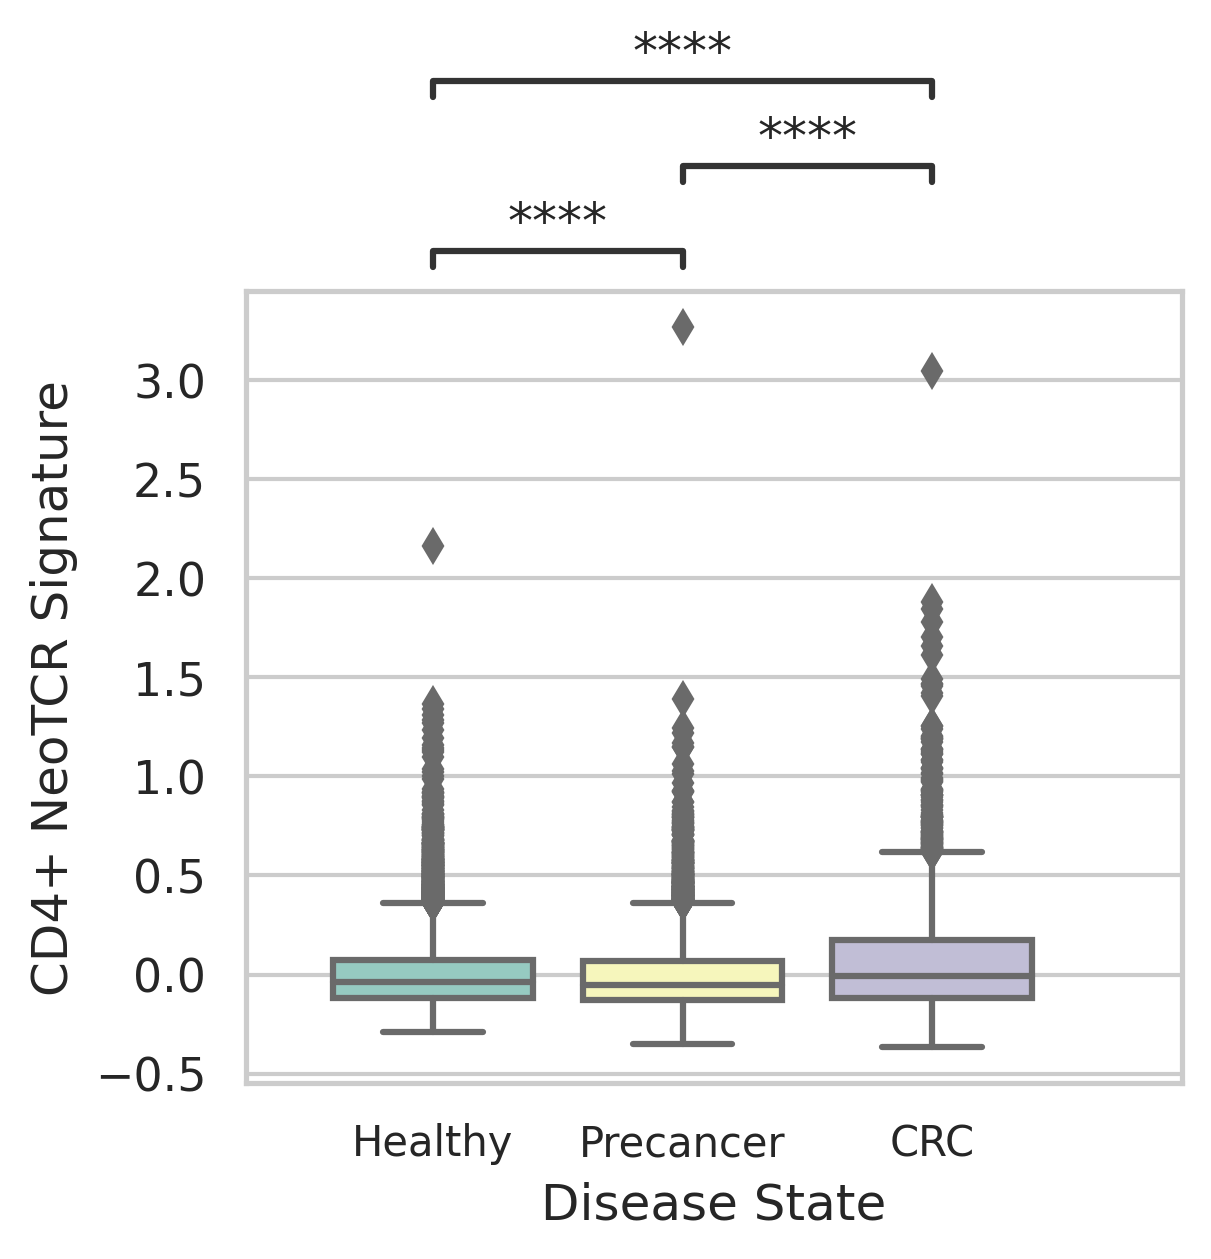 | 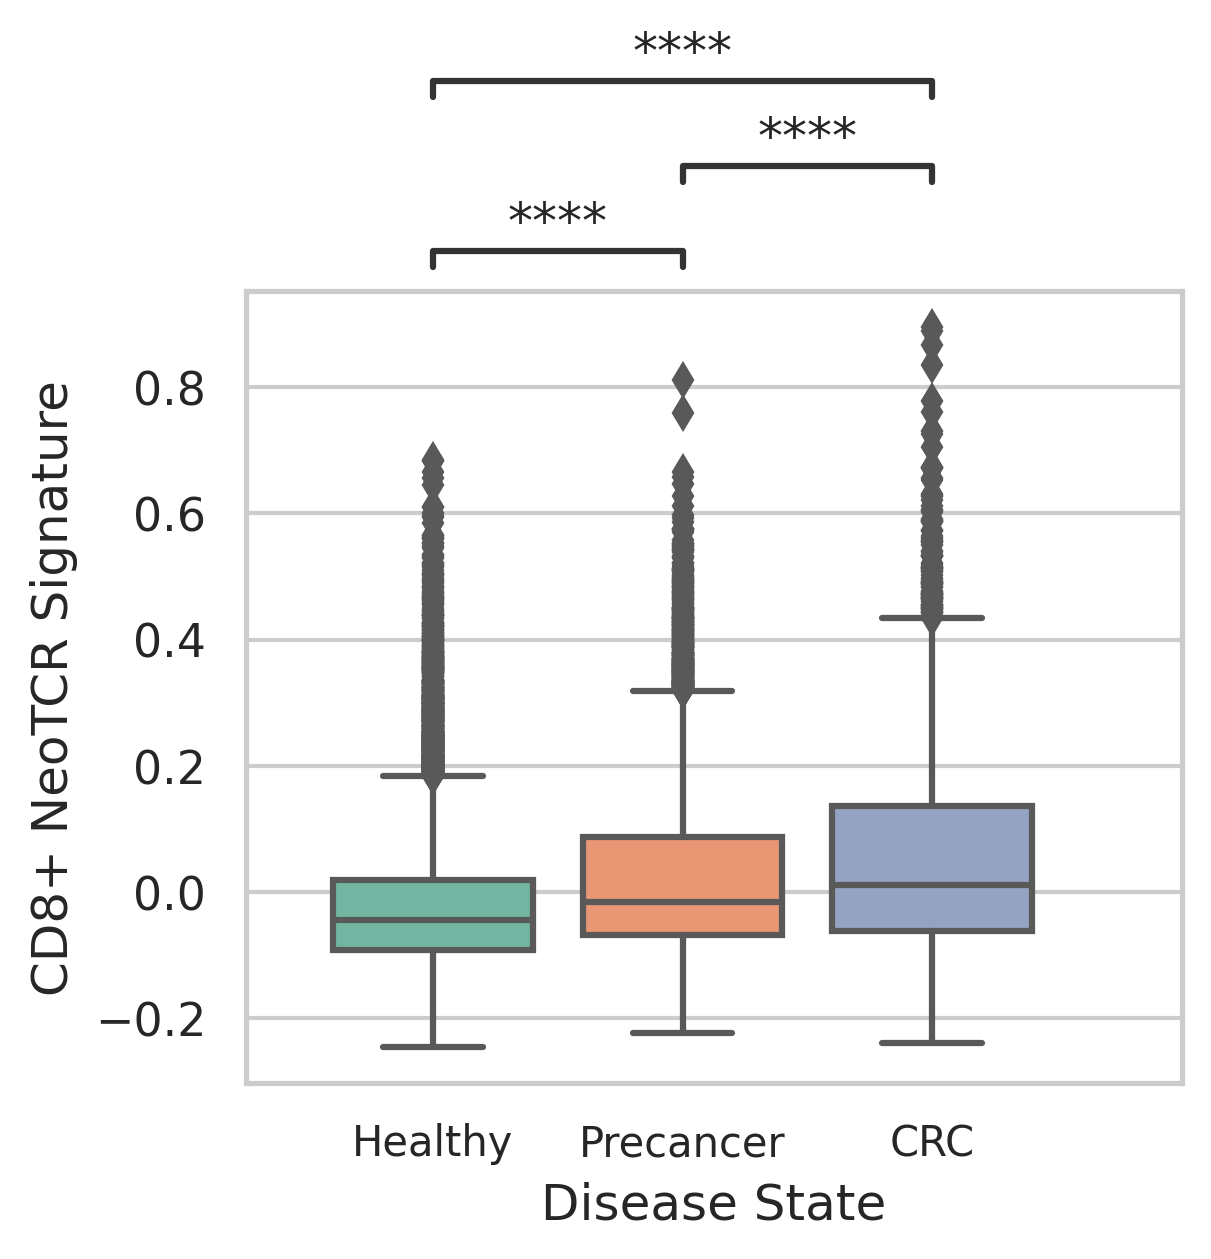 |
| ∗Comparisons of CD4+ and CD8+ NeoTCR signature scores among different disease states. |

Copyright 2023-Present -The University of Texas Health Science Center at Houston |