Schematic overview of the cellular and molecular mechanisms involved in the cancer progression, including the proposed cellular and molecular mechanisms in cancer cells trajectory. AT1: alveolar type 1 cells; AT2: alveolar type 2 cells; AAH: atypical adenomatous hyperplasia; AIS: adenocarcinoma in situ; MIA: minimally invasive adenocarcinoma; IA: invasive adenocarcinoma; EMT: epithelial-mesenchymal transition

Home

Download

Statistics

Help

Contact

Center for Computational Systems Medicine
leaf

Tissue samples summary

leaf

Annotation details for different cell compartments

leaf

Cell type statistics by disease state

leaf

Cell type dynamics in malignant transformation

leaf

Cell lineage trajectory inference

leaf

TF regulatory network analysis

leaf

Cell-cell interaction analysis

leaf

Stemness, Senescence, Metaplasia and NeoTCR signature analysis

Tissue: Liver

Tissue samples summary

check button Cell type statistics by tissue samples.
EpitheliaImmuneStromal
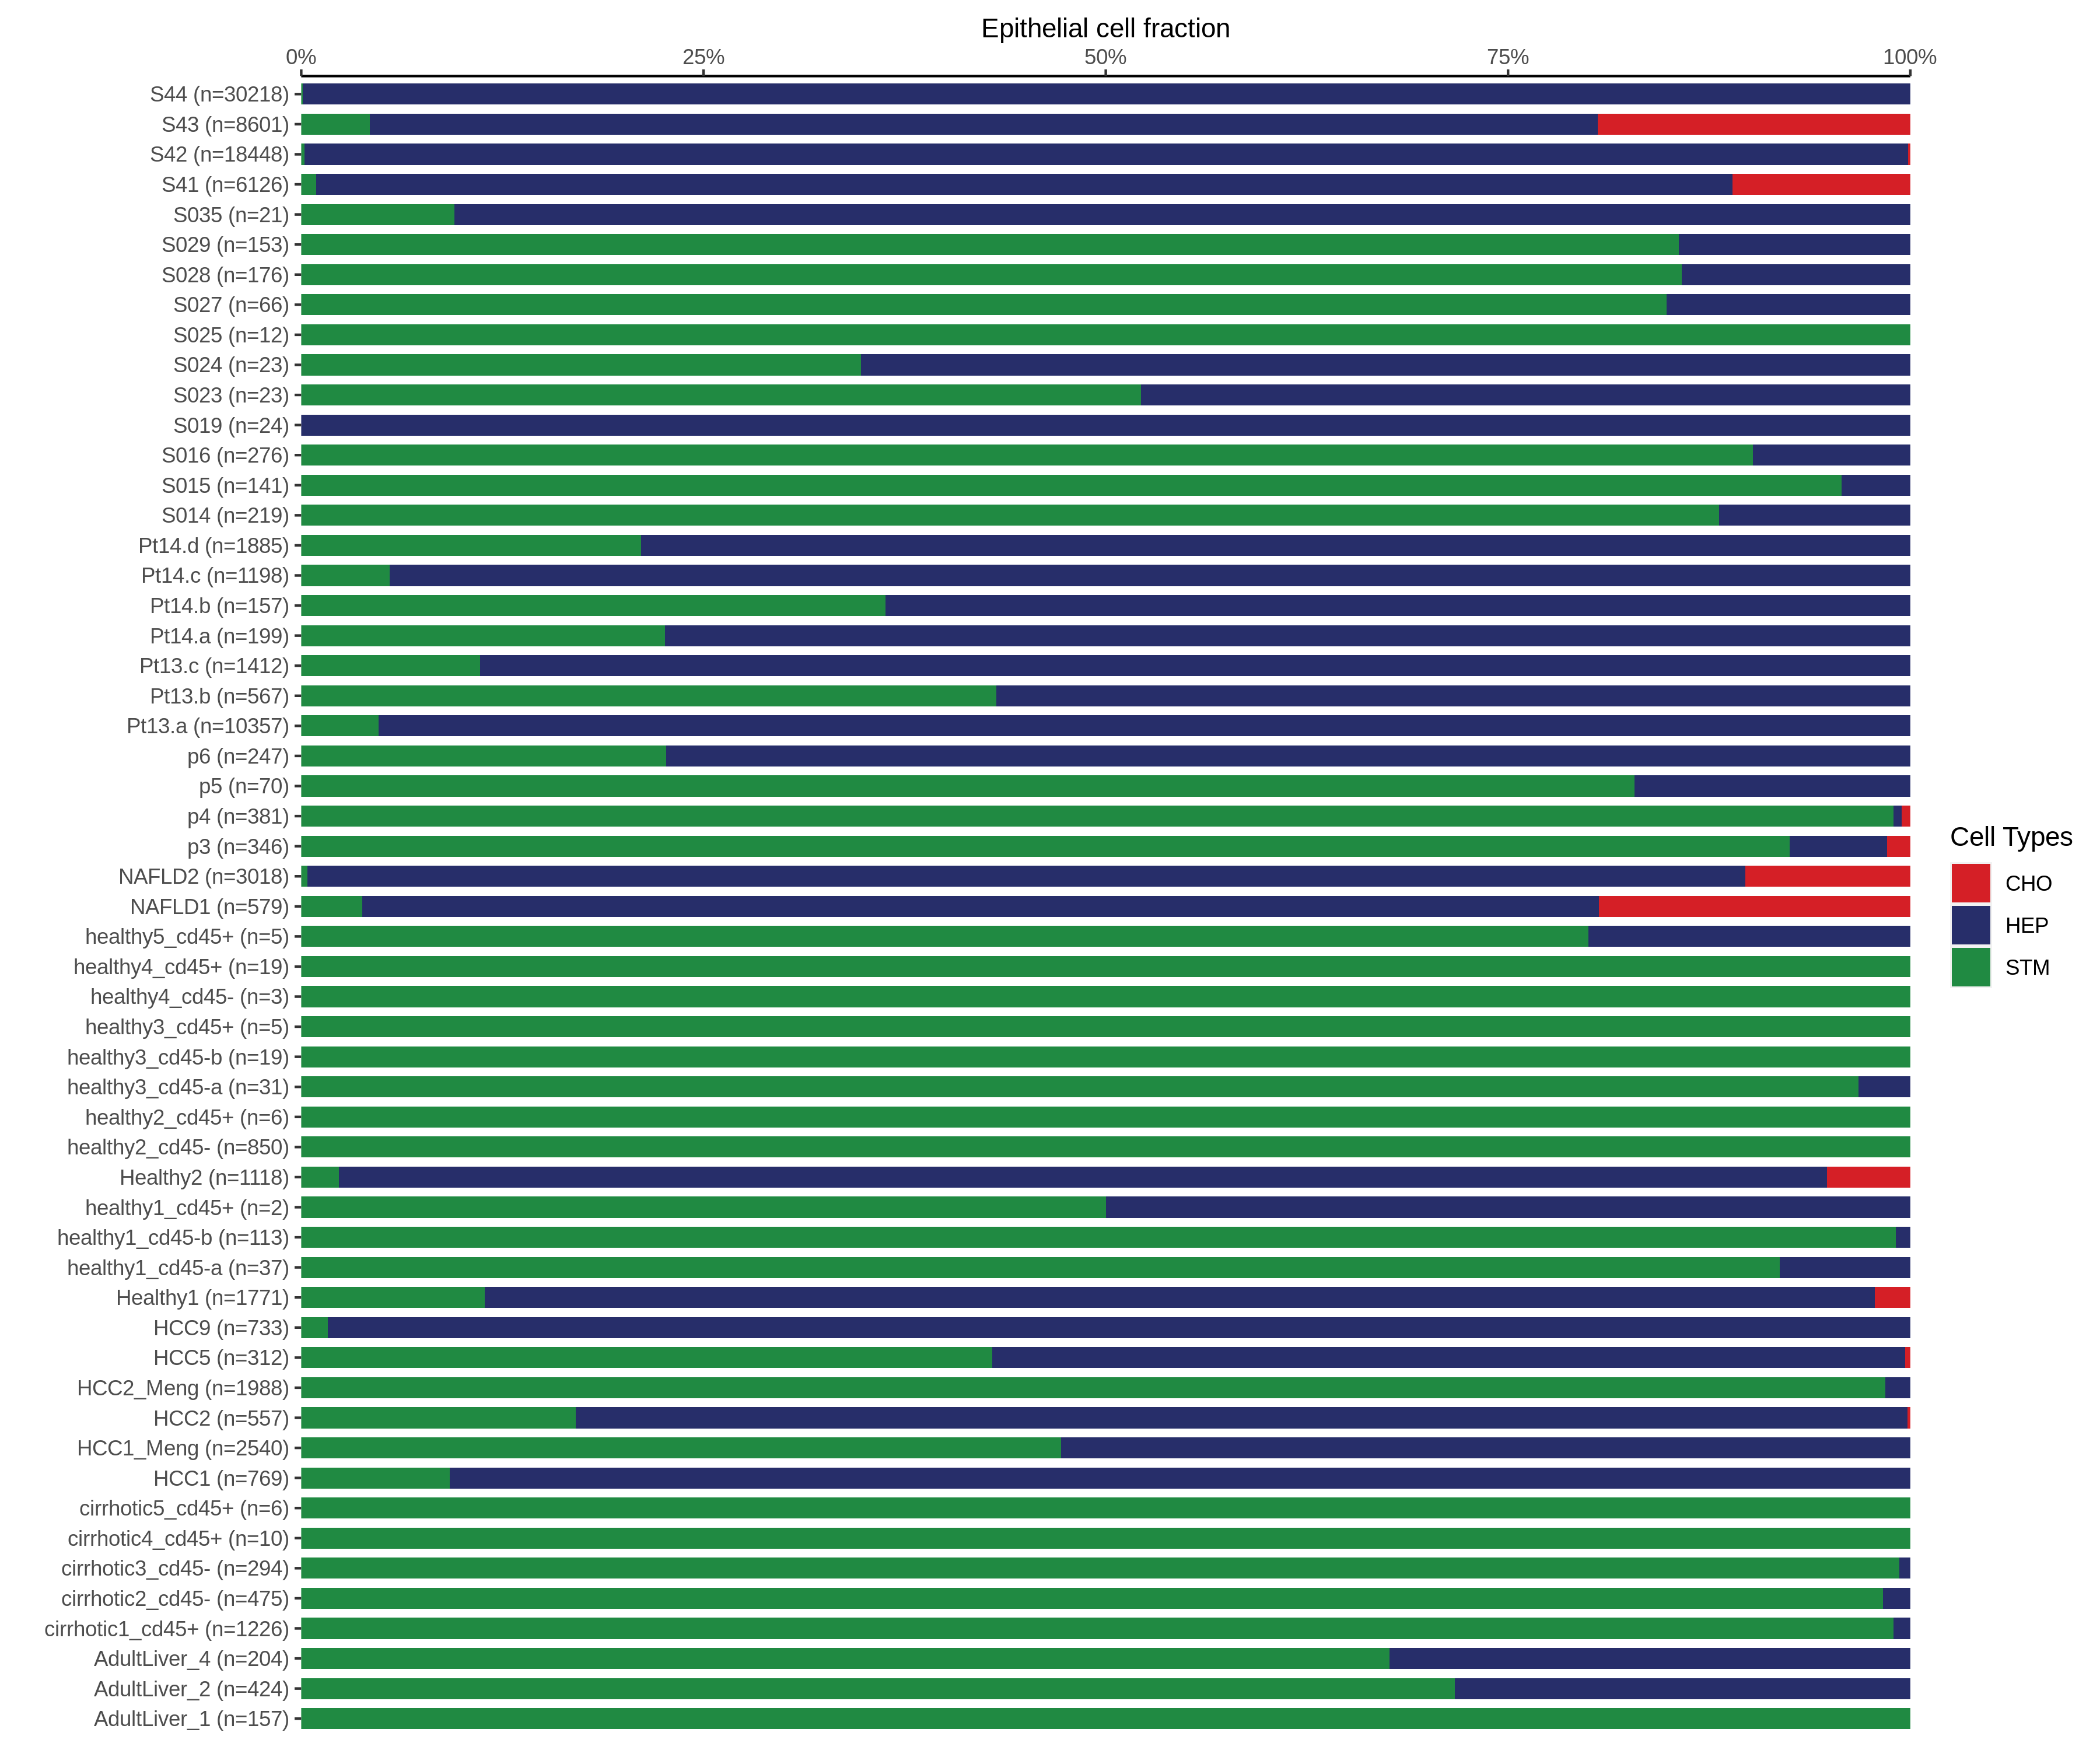
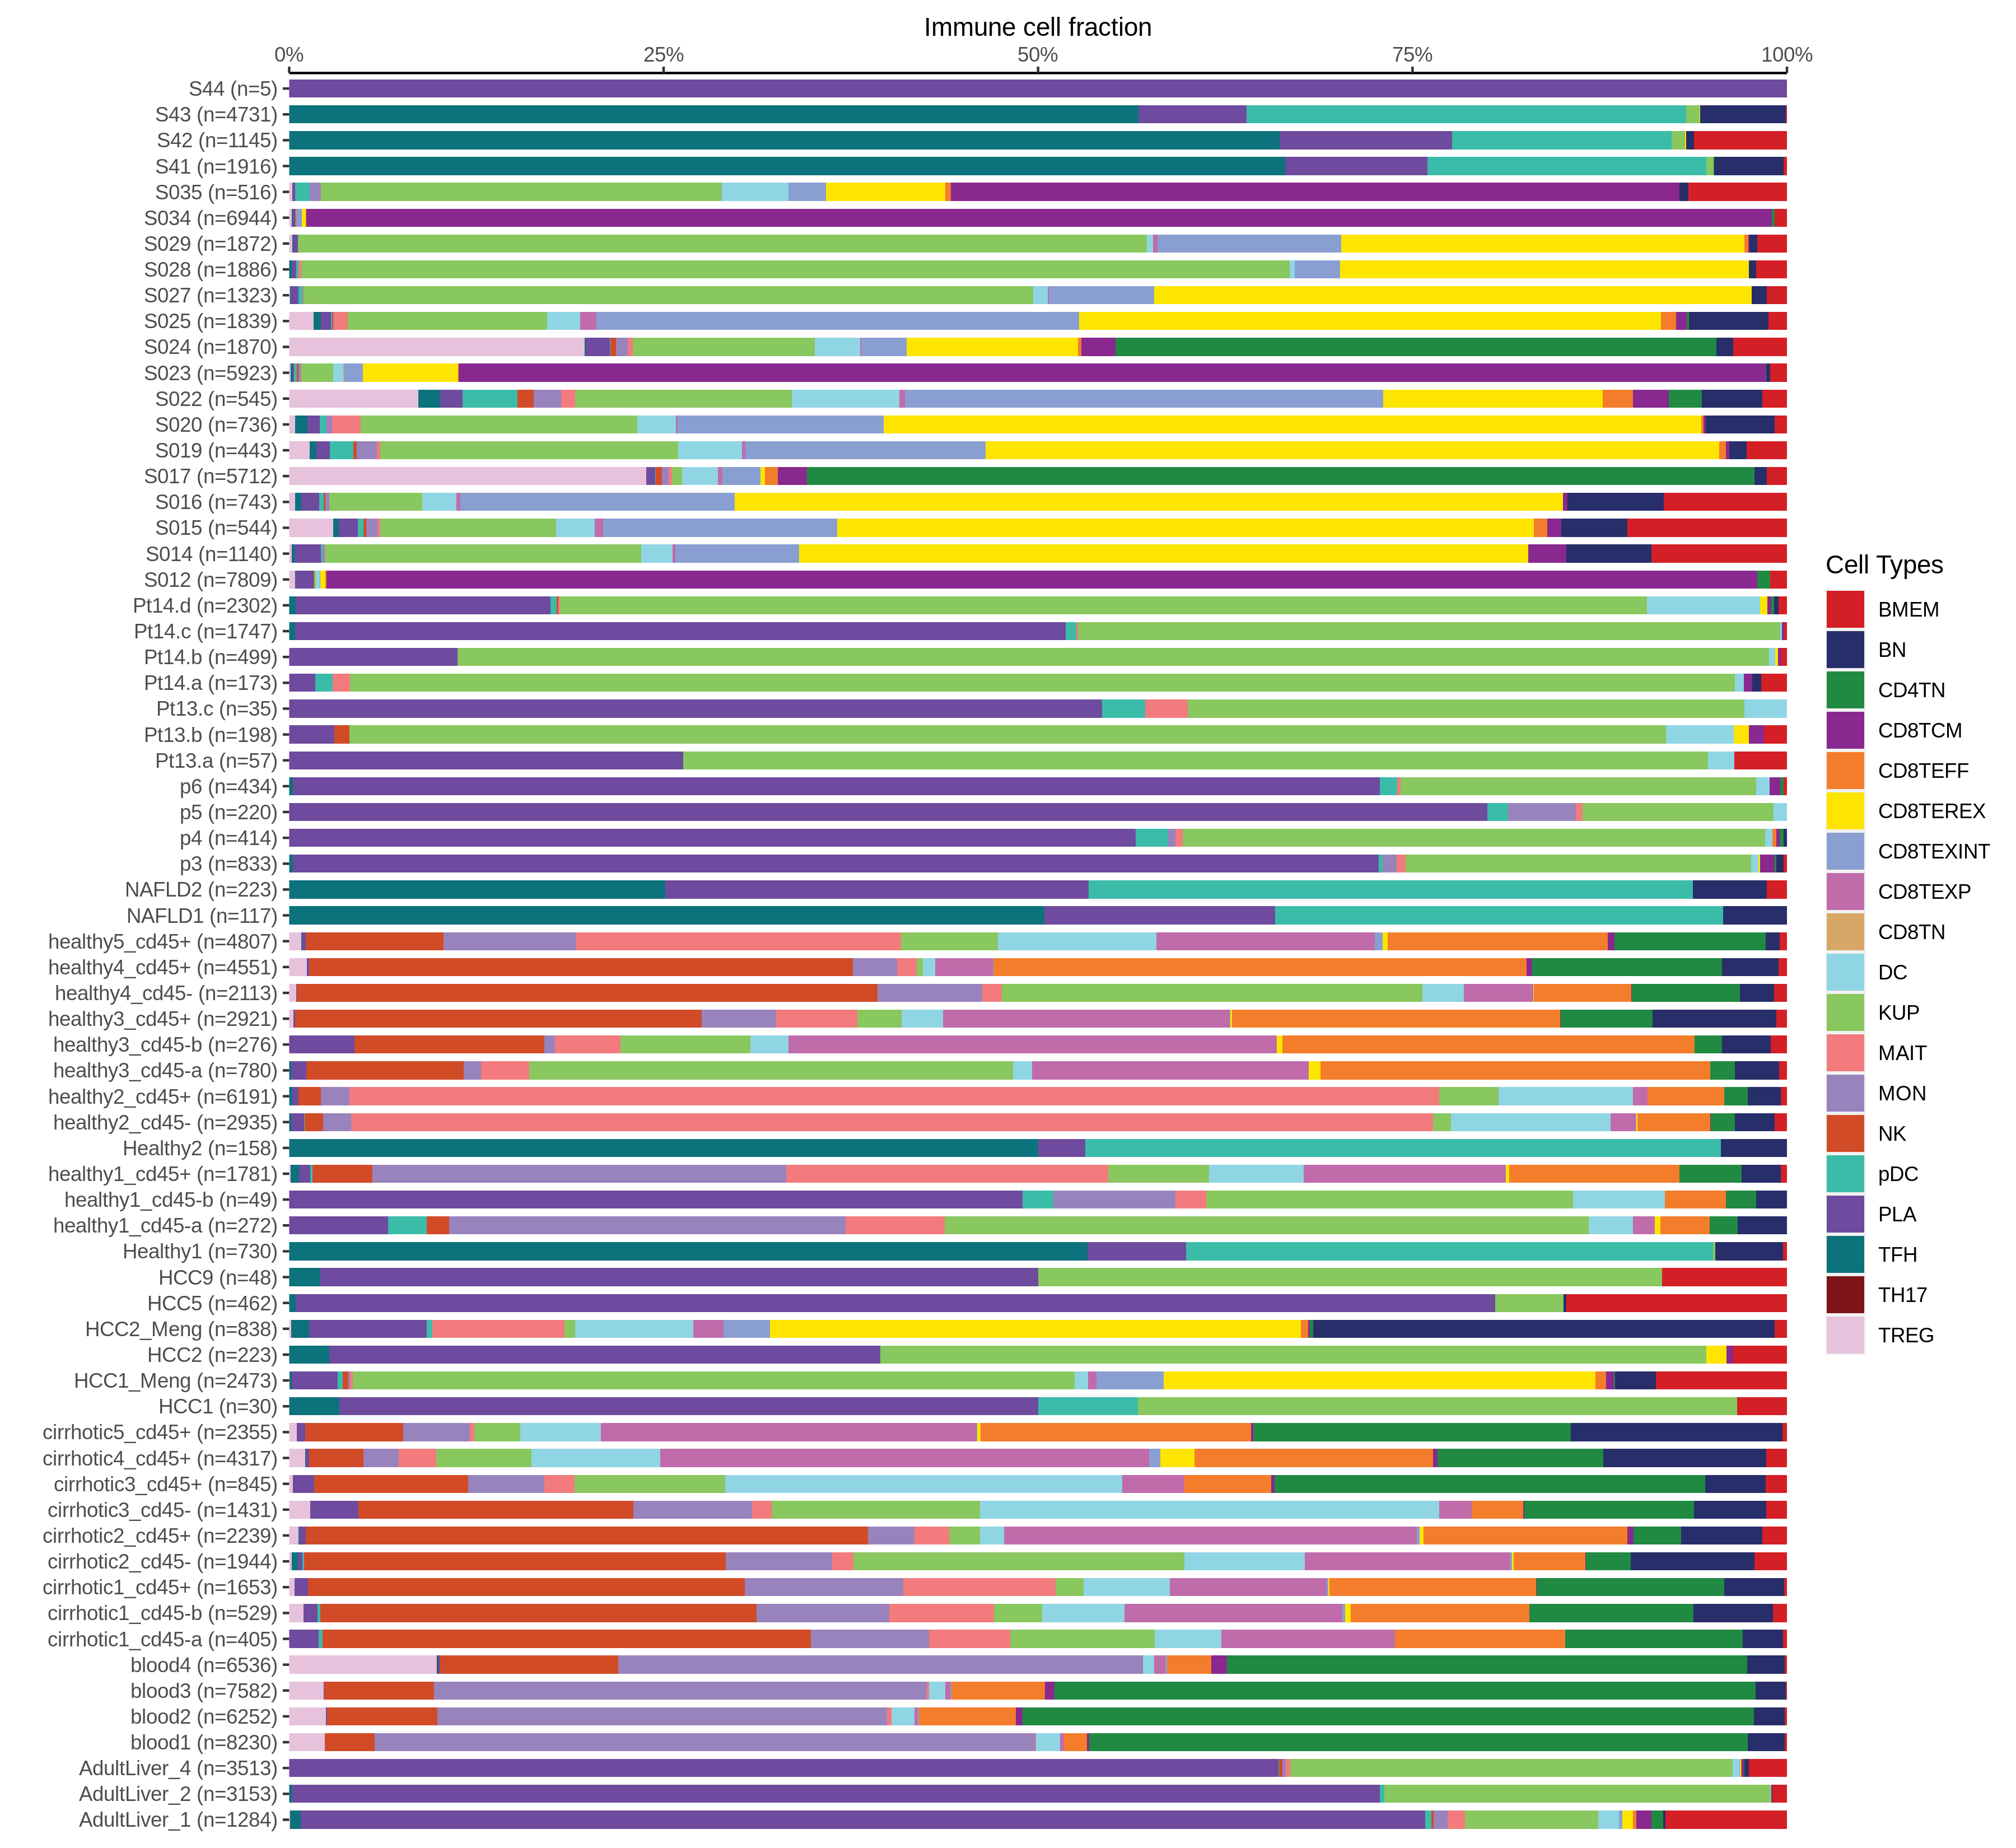
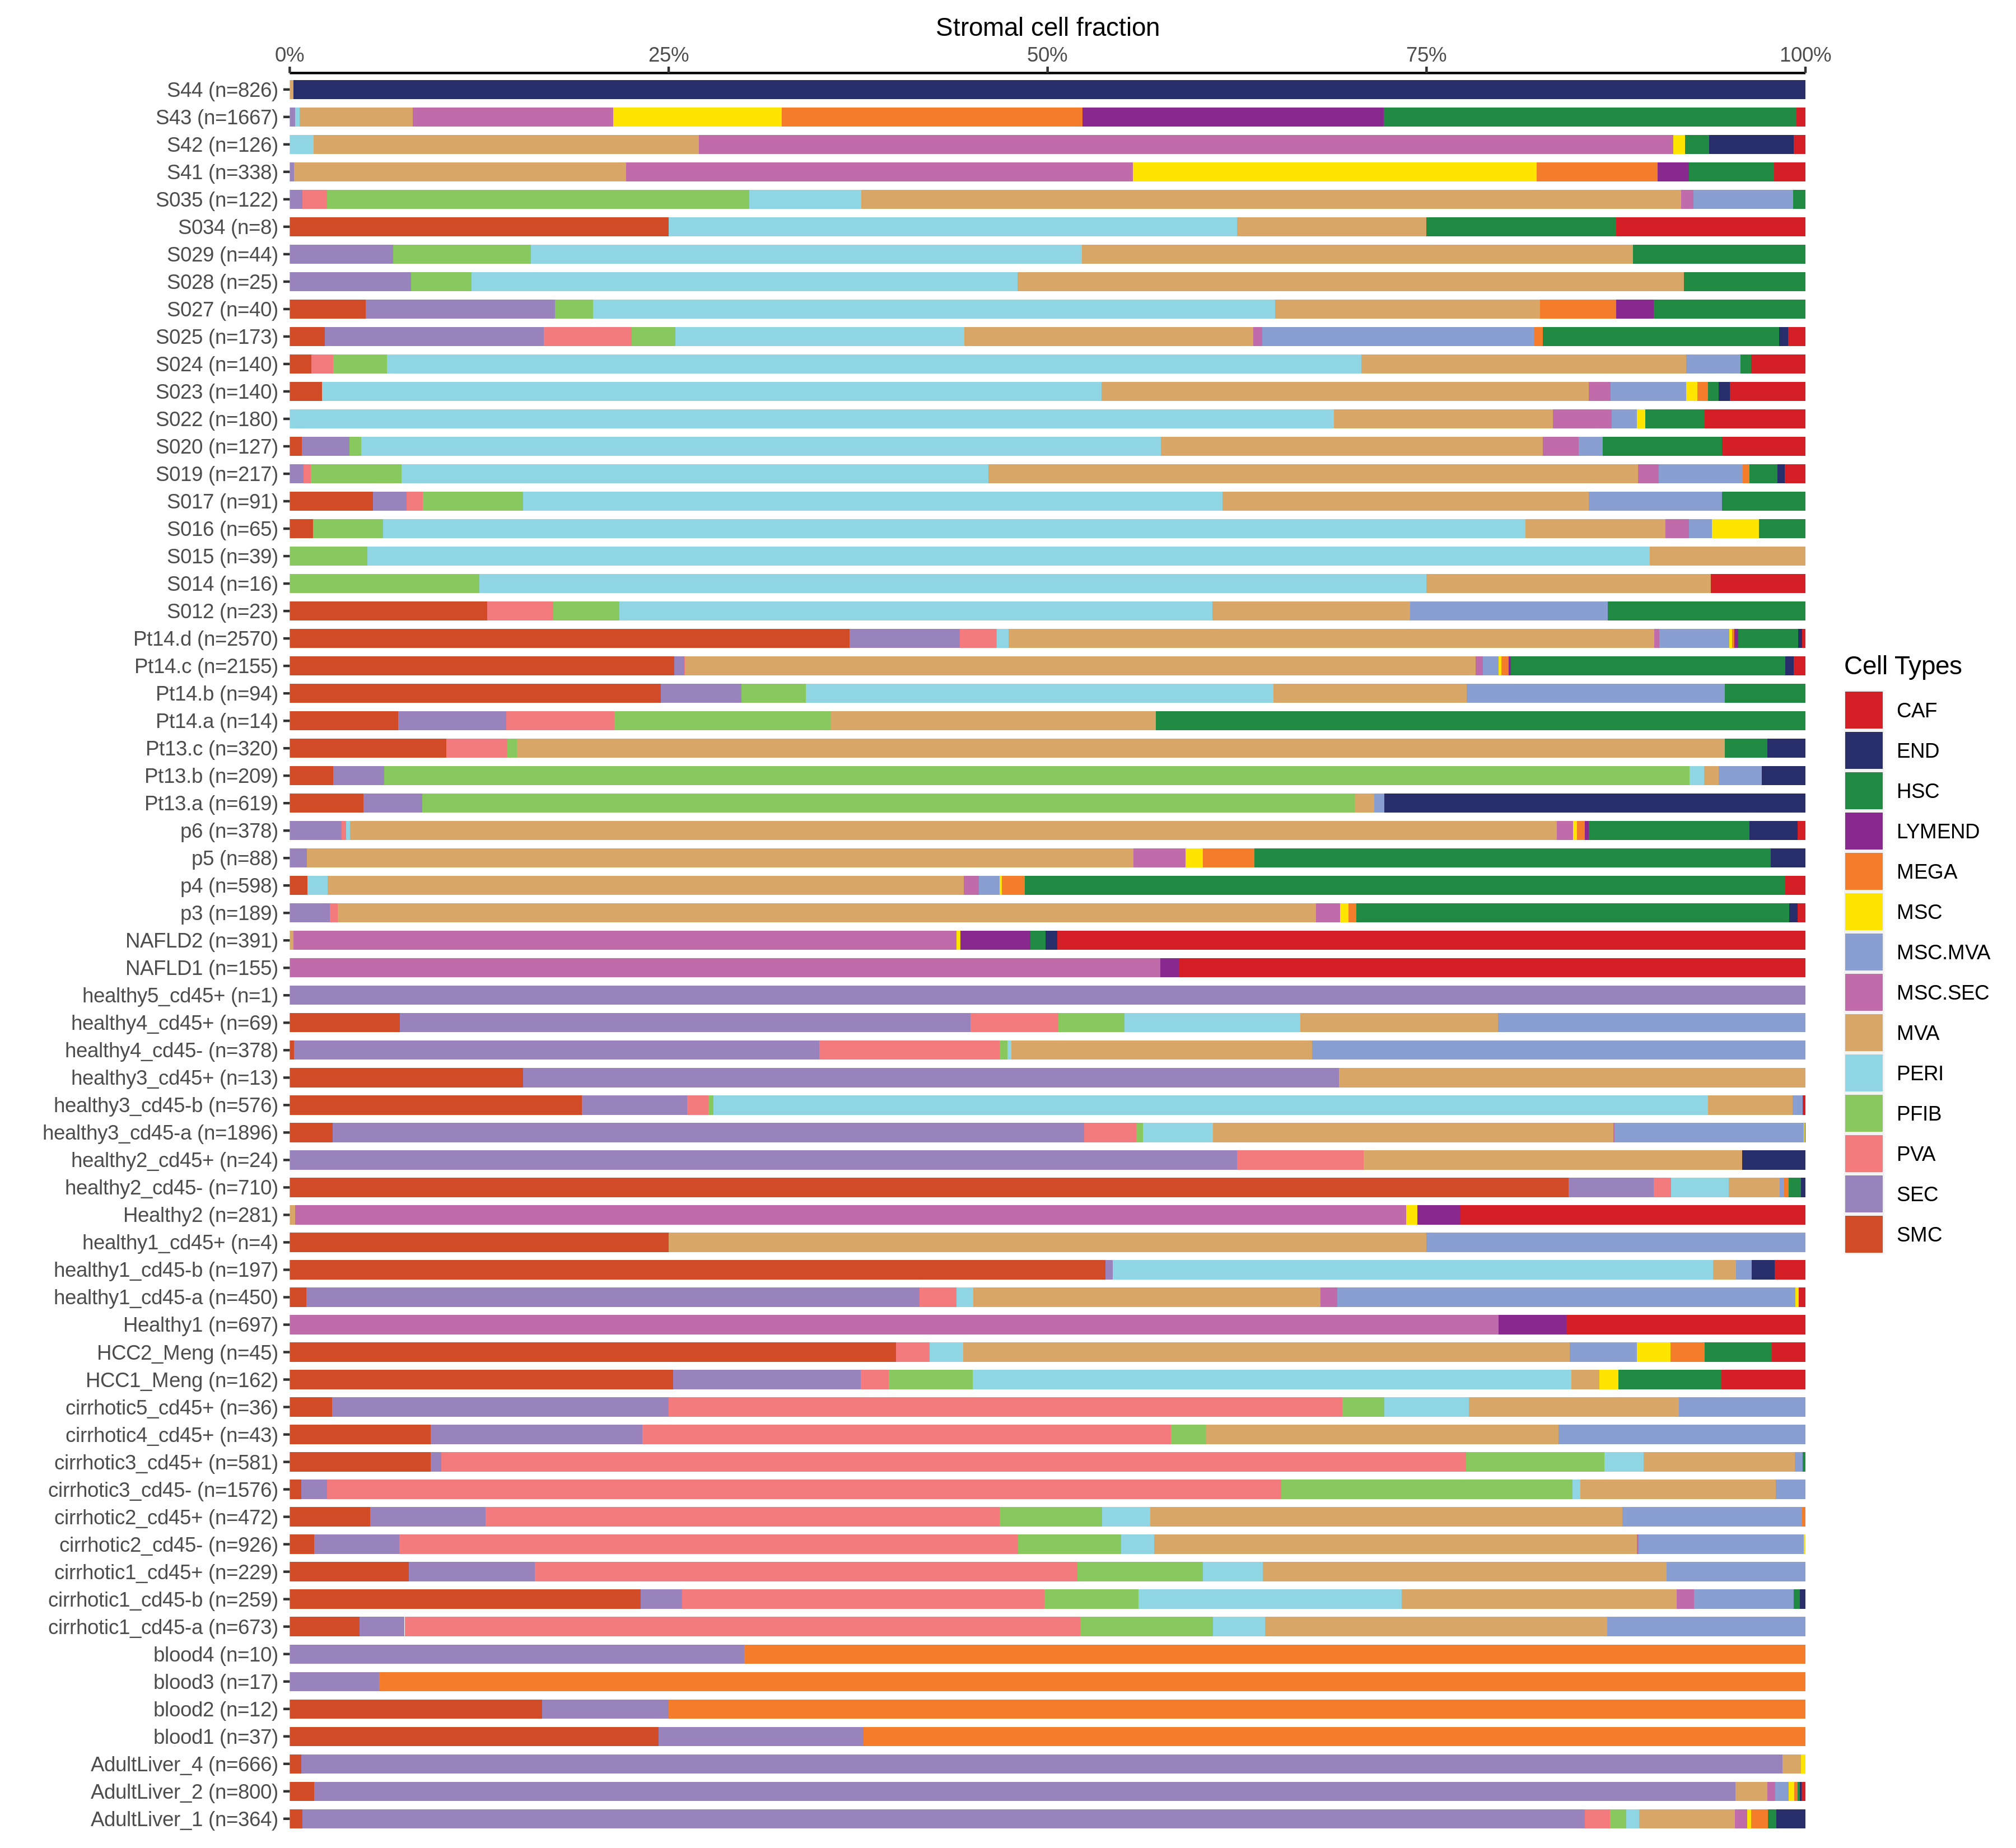
Bar plot representation of the fraction of all Epithelial cells in each sample composed of each cell type for the integrated scRNA-seq datasets of Breast tissues. Each row represents a single sample, with each color representing a different cell type present in the sample.Bar plot representation of the fraction of all Immune cells in each sample composed of each cell type for the integrated scRNA-seq datasets of Breast tissues. Each row represents a single sample, with each color representing a different cell type present in the sample.Bar plot representation of the fraction of all Stromal cells in each sample composed of each cell type for the integrated scRNA-seq datasets of Breast tissues. Each row represents a single sample, with each color representing a different cell type present in the sample.
∗Bar plot representation of the fraction of all Epithelial, Immune and Stromal cells in each sample composed of each cell type for the integrated scRNA-seq datasets of Liver tissue. Each row represents a single sample, with each color representing a different cell type present in the sample.

check button Tissue summary table.
TissueDisease StateReplicatesEpithelia UMAPPMIDSourcePlatform
LiverNAFLDNAFLD1Projection

36198802

GSE174748

10X Genomics
LiverNAFLDNAFLD2Projection

36198802

GSE174748

10X Genomics
LiverCirrhoticS41Projection

36198802

GSE212046

10X Genomics
LiverHCCS42Projection

36198802

GSE212046

10X Genomics
LiverCirrhoticS43Projection

36198802

GSE212046

10X Genomics
LiverHCCS44Projection

36198802

GSE212046

10X Genomics
LiverHCCHCC1_MengProjection

33619115

GSE166635

10X Genomics
LiverHCCHCC2_MengProjection

33619115

GSE166635

10X Genomics
LiverCirrhoticcirrhotic1_cd45+Projection

31597160

GSE136103

10X Genomics
LiverCirrhoticcirrhotic1_cd45-aProjection

31597160

GSE136103

10X Genomics
LiverCirrhoticcirrhotic1_cd45-bProjection

31597160

GSE136103

10X Genomics
LiverCirrhoticcirrhotic2_cd45-Projection

31597160

GSE136103

10X Genomics
LiverCirrhoticcirrhotic2_cd45+Projection

31597160

GSE136103

10X Genomics
LiverCirrhoticcirrhotic3_cd45-Projection

31597160

GSE136103

10X Genomics
LiverCirrhoticcirrhotic3_cd45+Projection

31597160

GSE136103

10X Genomics
LiverCirrhoticcirrhotic4_cd45+Projection

31597160

GSE136103

10X Genomics
LiverCirrhoticcirrhotic5_cd45+Projection

31597160

GSE136103

10X Genomics
LiverCystp6Projection

33332768

GSE146409

MARS-seq
LiverHCCHCC1Projection

33531041

GSE146115

10X Genomics
LiverHCCHCC2Projection

33531041

GSE146115

10X Genomics
∗Projection of epithelial scRNA-seq cells from Liver diseased tissue samples into the manifold of normal tissue epithelial cells. Projected cells are colored by nearest normal cells in the projection and normal epithelial cells are colored gray.
Page: 1 2 3 4 

Top

Annotation details for different cell compartments

check button Single-cell atlas of expresion.
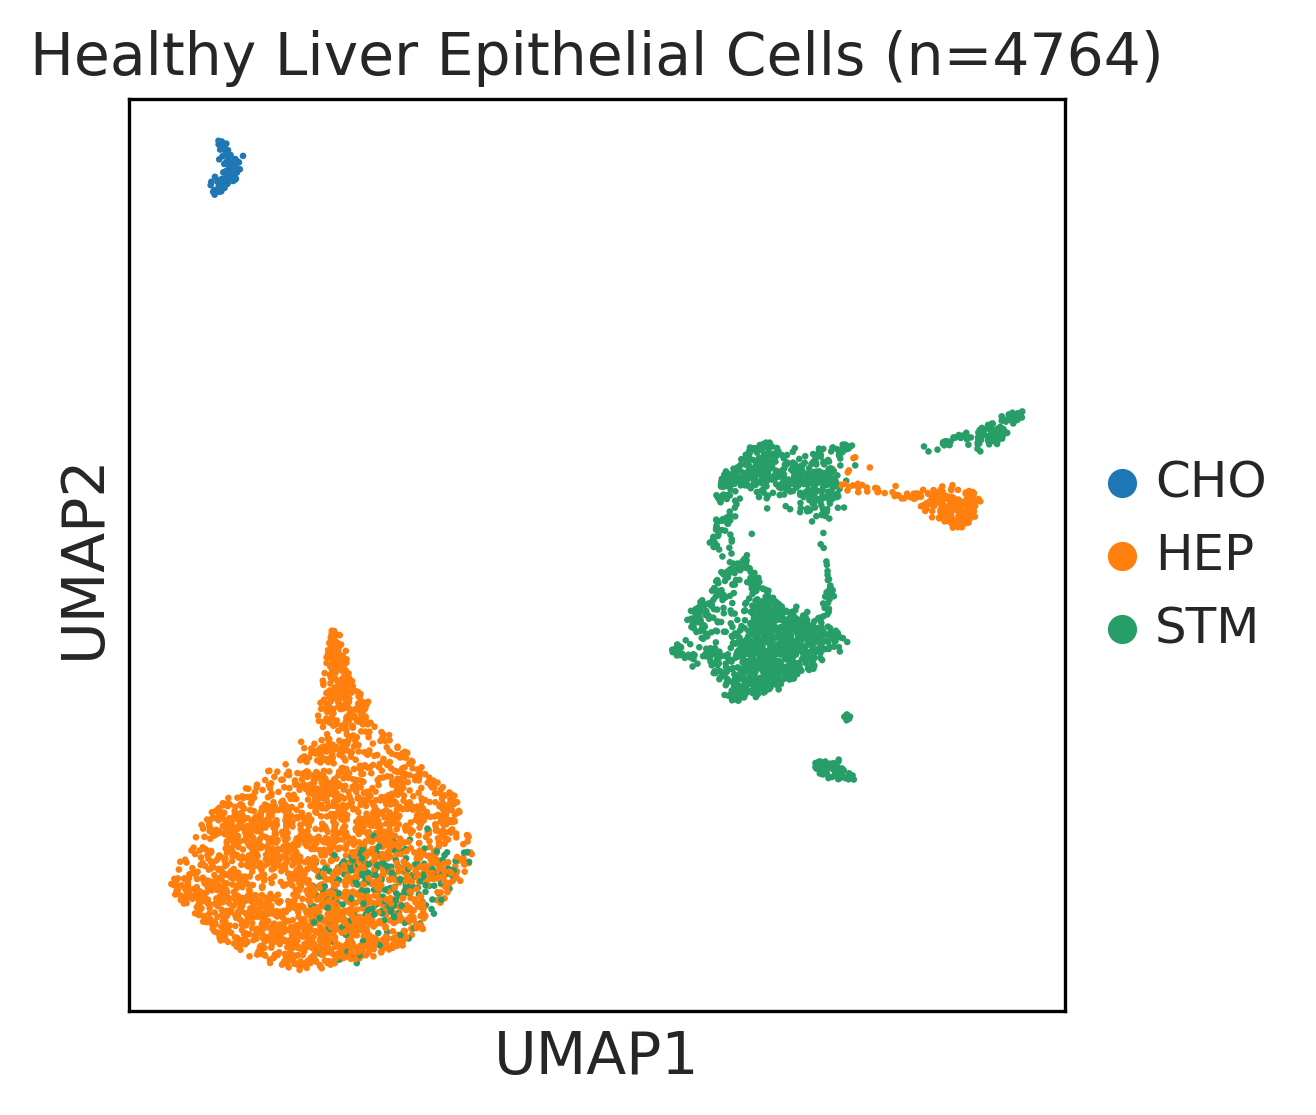
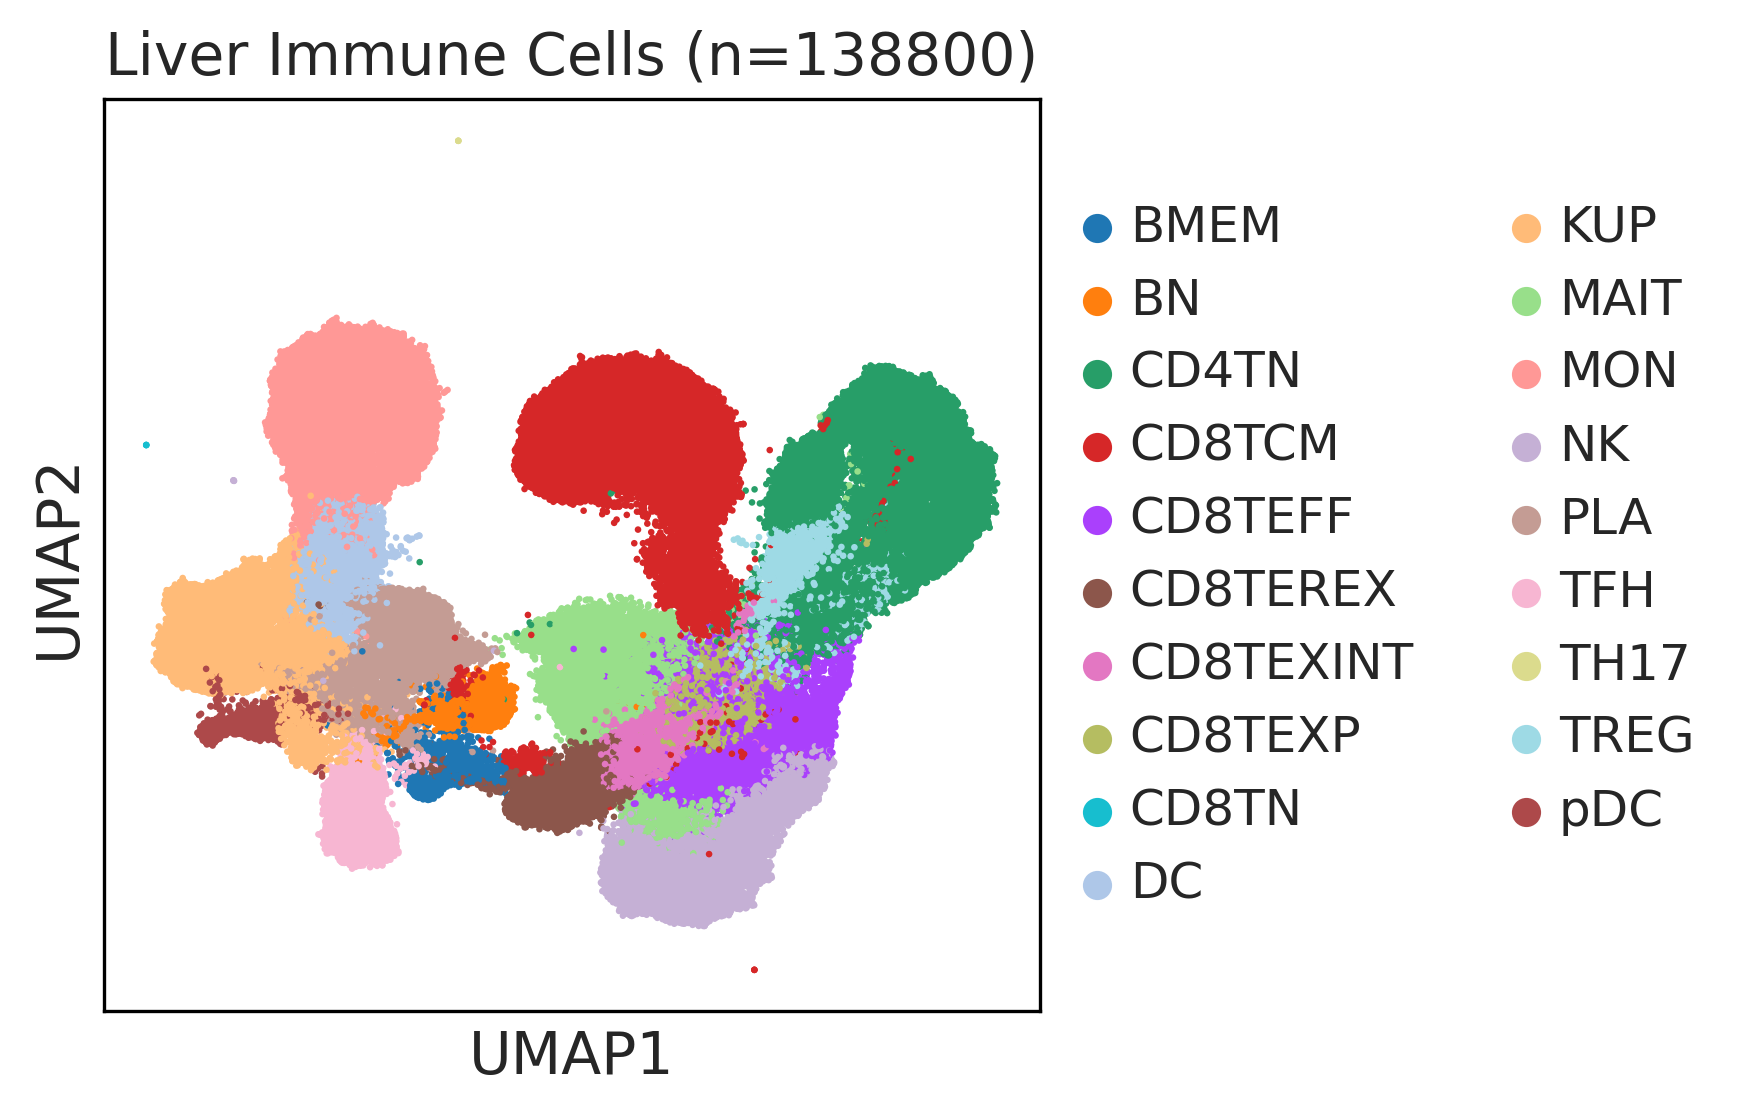
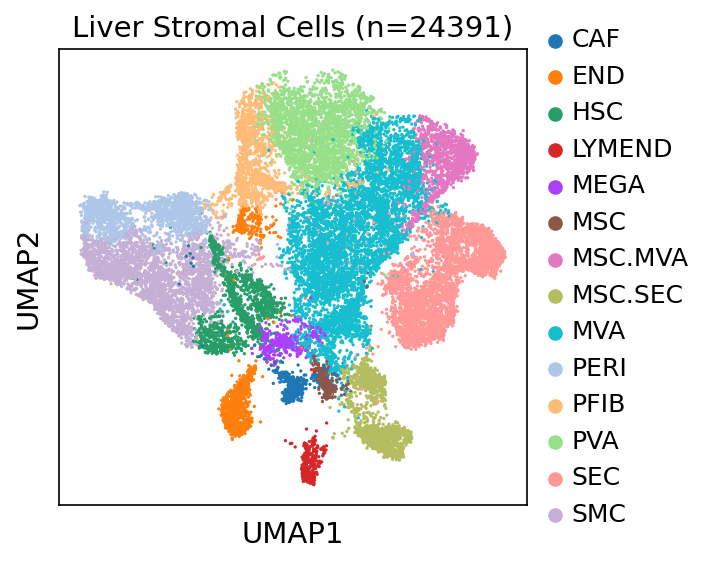
UMAP representations and annotations of Epithelial cells in the integrated scRNA-seq data of the selected tissue.UMAP representations and annotations of Immune cells in the integrated scRNA-seq data of the selected tissue.UMAP representations and annotations of Stromal cells in the integrated scRNA-seq data of the selected tissue.
∗UMAP representations and annotations of Epithelial, Immune, Stromal cells in the integrated scRNA-seq data of Liver tissue. Colors represent cell types of each compartment.

check button Cell markers.
TissueMajor Cell TypeMinor Cell TypeFull NameMarkers
LiverEpiSTMStem-like cellsEPCAM,CD24,ANPEP,SOX9,CD47
LiverEpiCHOCholangiocytesPROM1,HNF1B,ONECUT1,SCTR,CFTR,KRT7
LiverEpiHEPHepatocytesTTR,ALB,APOE,APOA1,CYP3A4,CPS1,G6PC
LiverImmDCDendritic cellsHLA-DQA1,HLA-DQB1,HLA-DRB3,CLEC10A,CLEC9A,FCER1A,CST3,CD1C
LiverImmpDCPlasmacytoid dendritic cellsIL3RA,CLEC4C,NRP1,KLRD1
LiverImmNKNatural killer cellsKLRF1,SH2D1B,NCAM1,FCGR3A,GNLY,NKG7,GZMH,FGFBP2,CX3CR1,NCR1,NCR3,B3GAT1
LiverImmKUPKuppfer cellsCD68,EMR1,CD163,CD14,FCGR3A
LiverImmMONMonocytesCD14,CLEC9A,FCGR1A,LILRB2,CD209,CD1E,FCN1,VCAN
LiverImmBNNaive B cellsCD19,IGHD,IGLL1,CD27,CD38
LiverImmBMEMMemory B cellsPAX5,MS4A1,CD19,IGLL5,VPREB3,CD79A,CD79B,IGKC,CD74,HLA-DRA,CD37,CD22
LiverImmPLAPlasma cellsSSR4,IGLL5,IGLL1,AMPD1,IGHA1,IGHA2,JCHAIN,CD38,TNFRSF17,SDC1,IGHG1,MZB1
LiverImmCD4TNNaive CD4+ T cellsIL7R,SELL,CCR7,S100A4,TCF7
LiverImmTH17T-helper 17IL17A,CTSH,KLRB1,IL26,CCR6
LiverImmTFHT follicular helperCXCR5,BCL6,ICA1,TOX,TOX2,IL6ST,MAGEH1,BTLA,ICOS,PDCD1,CD200
LiverImmTREGRegulatory T cellsBATF,TNFRSF4,FOXP3,CTLA4,LAIR2,IL2RA
LiverImmMAITMucosal-associated invariant T cellsSLC4A10,DPP4,KLRB1,ZBTB16,NCR3,RORC,RORA
LiverImmCD8TEXPProgenitor exhausted CD8+ T cellsPDCD1,IL7R,GPR183,NR4A3,REL,TCF7
LiverImmCD8TNNaive CD8+ T cellsCCR7,CD28,ETS1,LEF1,SELL,TCF7,CD27,CD28,S1PR1
LiverImmCD8TEXINTIntermediate exhausted CD8+ T cellsPDCD1,LAG3,CD101,CD38,CXCR6,TIGIT
LiverImmCD8TEREXTerminally exhausted CD8+ T cellsTOX,GZMB,ENTPD1,ITGAE,HAVCR2,CXCL13,PDCD1,LAYN,TOX,IFNG,GZMB,MIR155HG,TNFRSF9,ITGAE
LiverImmCD8TCMCentral memory CD8+ T cellsCCR7,SELL,IL7R,CD27,CD28,PRF1,GZMA,CCL5,GPR183,S1PR1
LiverImmCD8TEFFEffector CD8+ T cellsCX3CR1,FCGR3A,FGFBP2,PRF1,GZMH,TBX21,EOMES,S1PR1
LiverStrENDEndothelial cellsPECAM1,PLVAP,VWF,CLDN5,FLT1,RAMP2,FAM110D,INHBB,NPR1,NOVA2,GPIHBP1,SOX17
LiverStrLYMENDLymphatic endothelial cellsPROX1,LYVE1,PDPN,PROCR,FLT4
LiverStrSECSinusoidal endothelial cellsSTAB2,CDH5,ENG,VWF,THBD,DES
LiverStrMEGAMegakaryocytesPF4,VWF,MPL,GP9,GP1BA,GP1BB,CD9,CD36,ITGA2B
LiverStrMSCMesenchymal stem cellsNT5E,THY1,ENG,CD44,ITGB1,MCAM,ENDOD1
LiverStrPFIBPortal fibroblastsFBLN2,VIM,S100A4,PDGFRA,THY1,COL1A2,BMP7,MAP3K2,COL6A1,CD36,CD44,CBLN2,SPOCK1,ACSS3,FN1,COL3A1,BGN,DCN,POSTN,C1R,MMP2,FGF7,MME,CD47
LiverStrSMCSmooth muscle cellsACTA2,CNN1,MYH11,TAGLN,CALD1,TAGLN2
LiverStrHSCHepatic stellate cells DES,ACTA2,GFAP,LPL,PDGFRB,RBP1,FAP,TIMP1,COL1A1,TGFB1
LiverStrPERIPericytesPDGFRA,CSPG4,RGS5,MCAM,COX4I2,KCNJ8,HIGD1B,NOTCH3,HEYL,FAM162B
LiverStrPVAPost capillary venulesSELP,ZNF385D,FAM155A,GALNT15,MADCAM1,CORT
LiverStrMVAMicrovascular cellsPLVAP,CD36,DYSF,NRP1,SH3BP5,EXOC3L2,FABP5,VWA1,BAALC,PRSS23,RAPGEF4,APLN,HTRA1
LiverStrCAFCancer-associated fibroblastsTWIST1,WNT2,FAP,CXCL1,CXCL2,CYR61,IL1B,IL6,HGF

Top

Cell type statistics by disease state

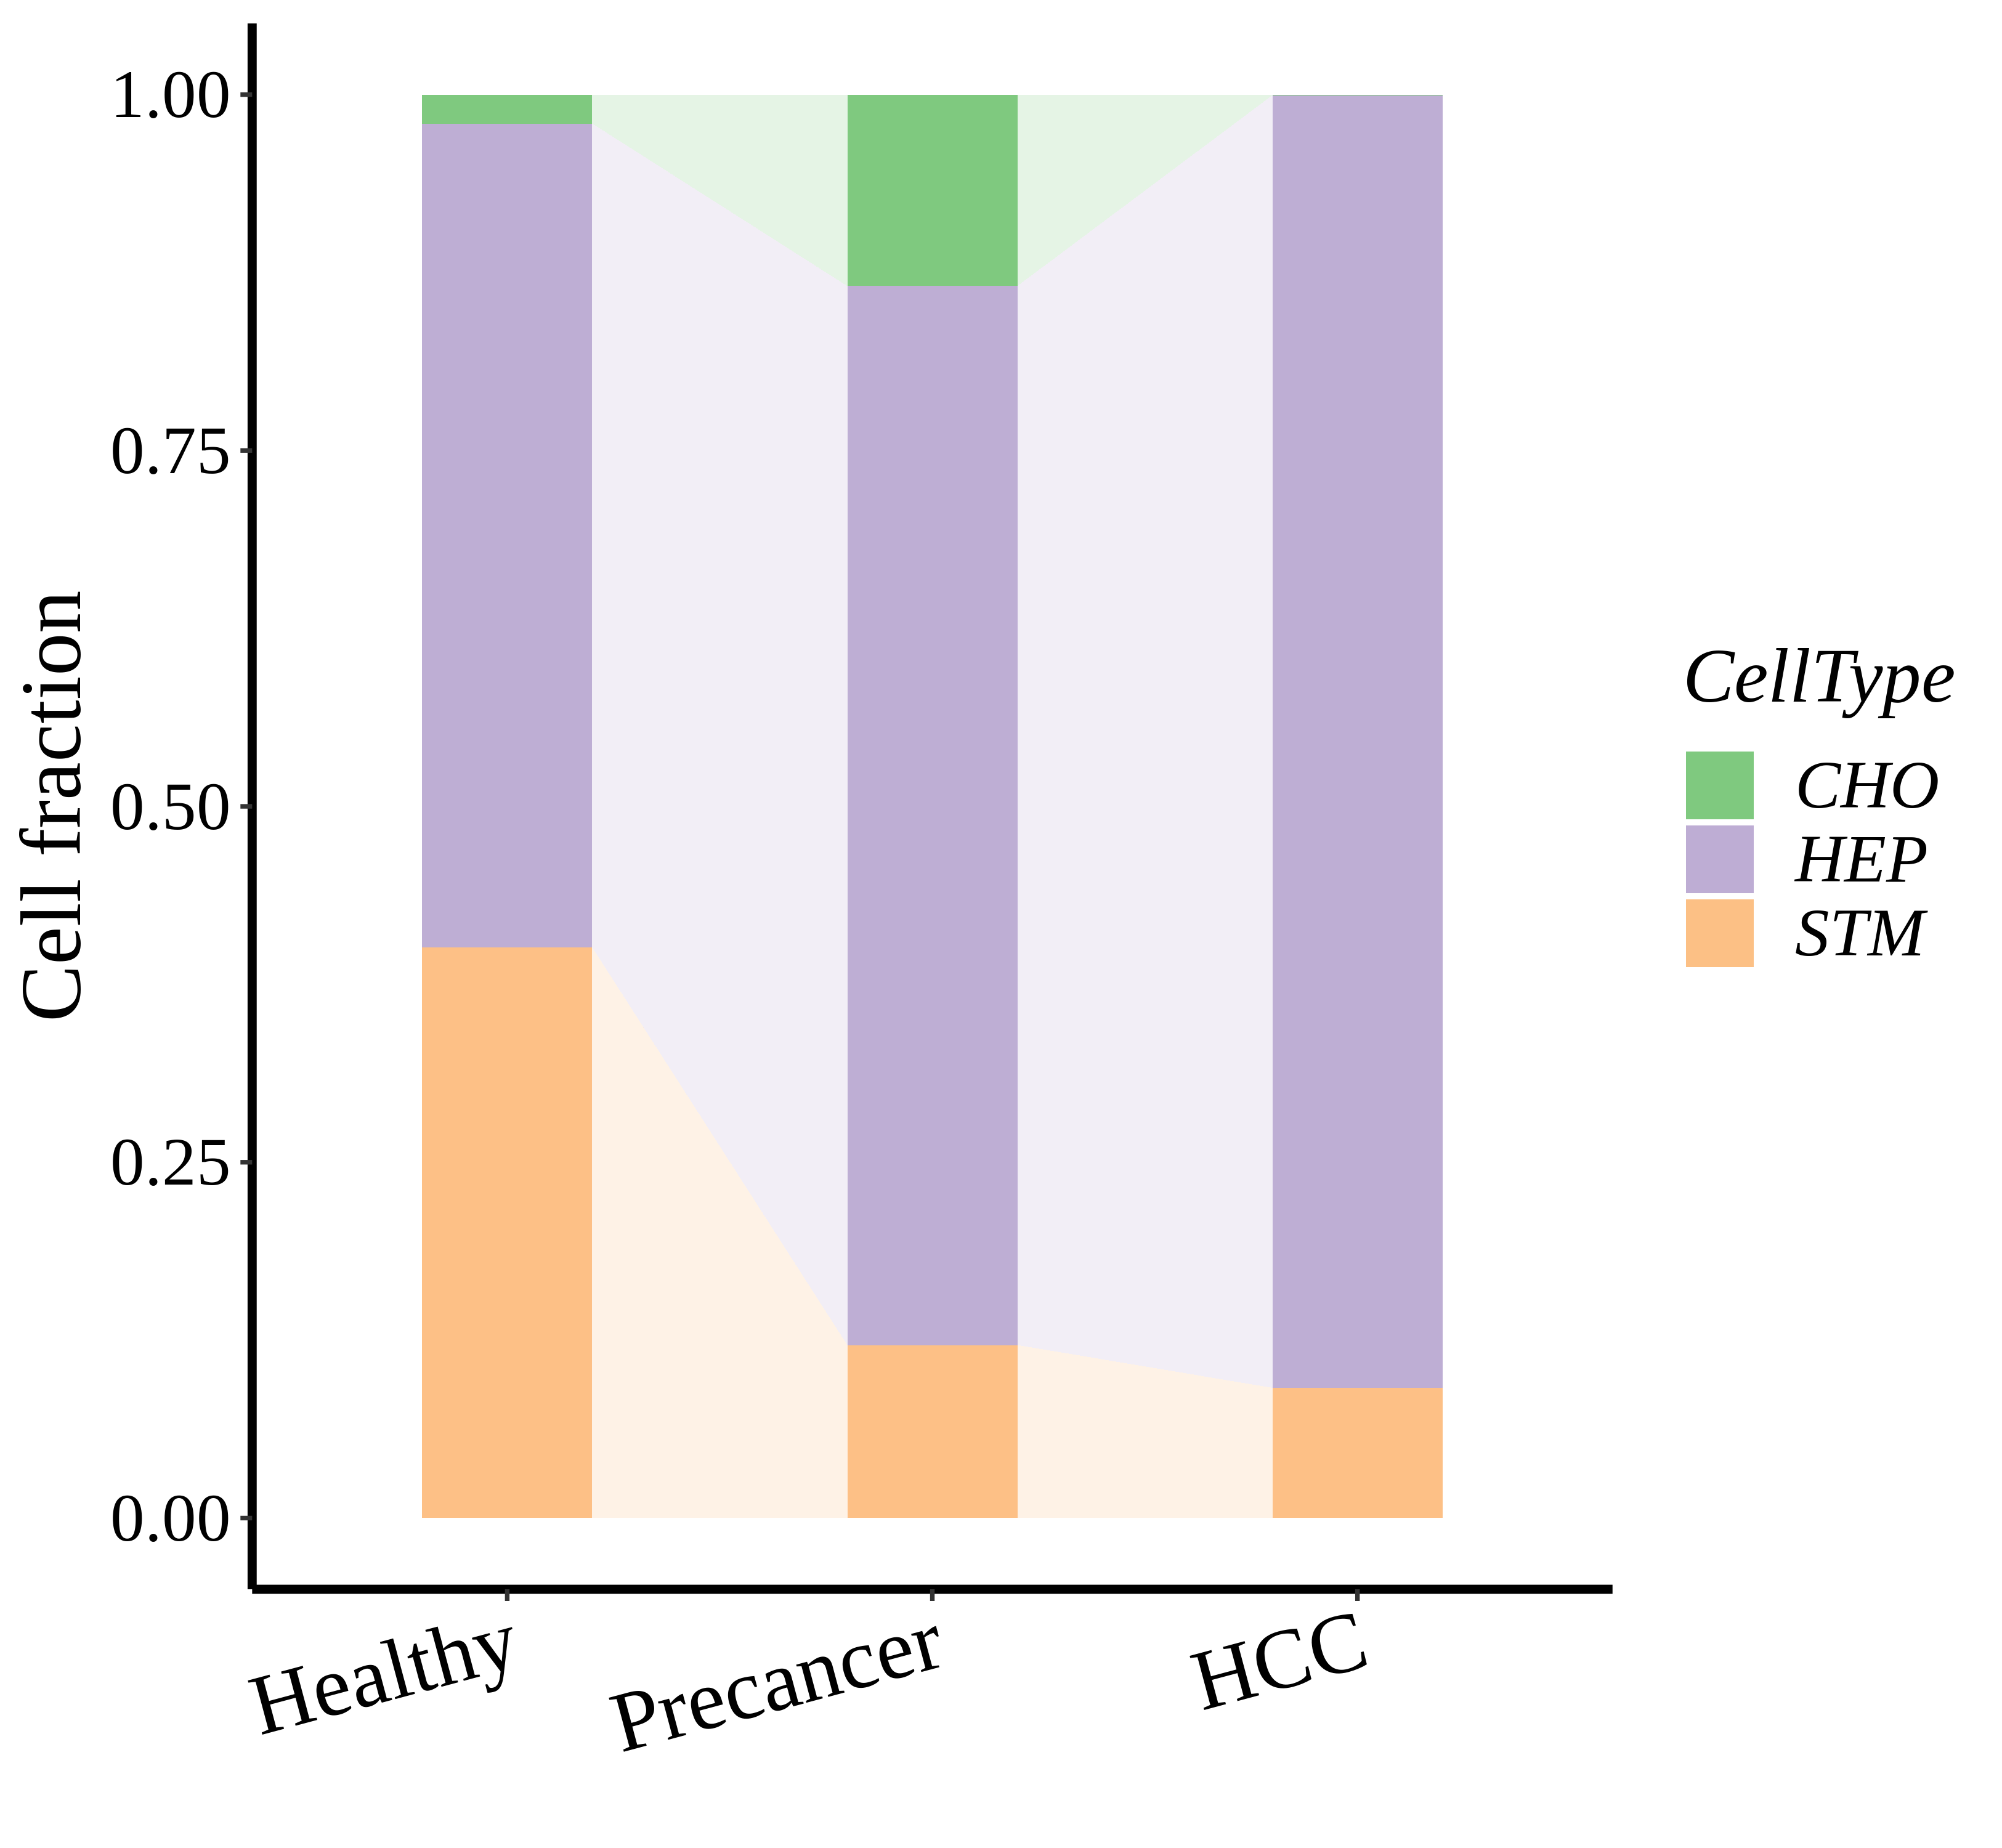
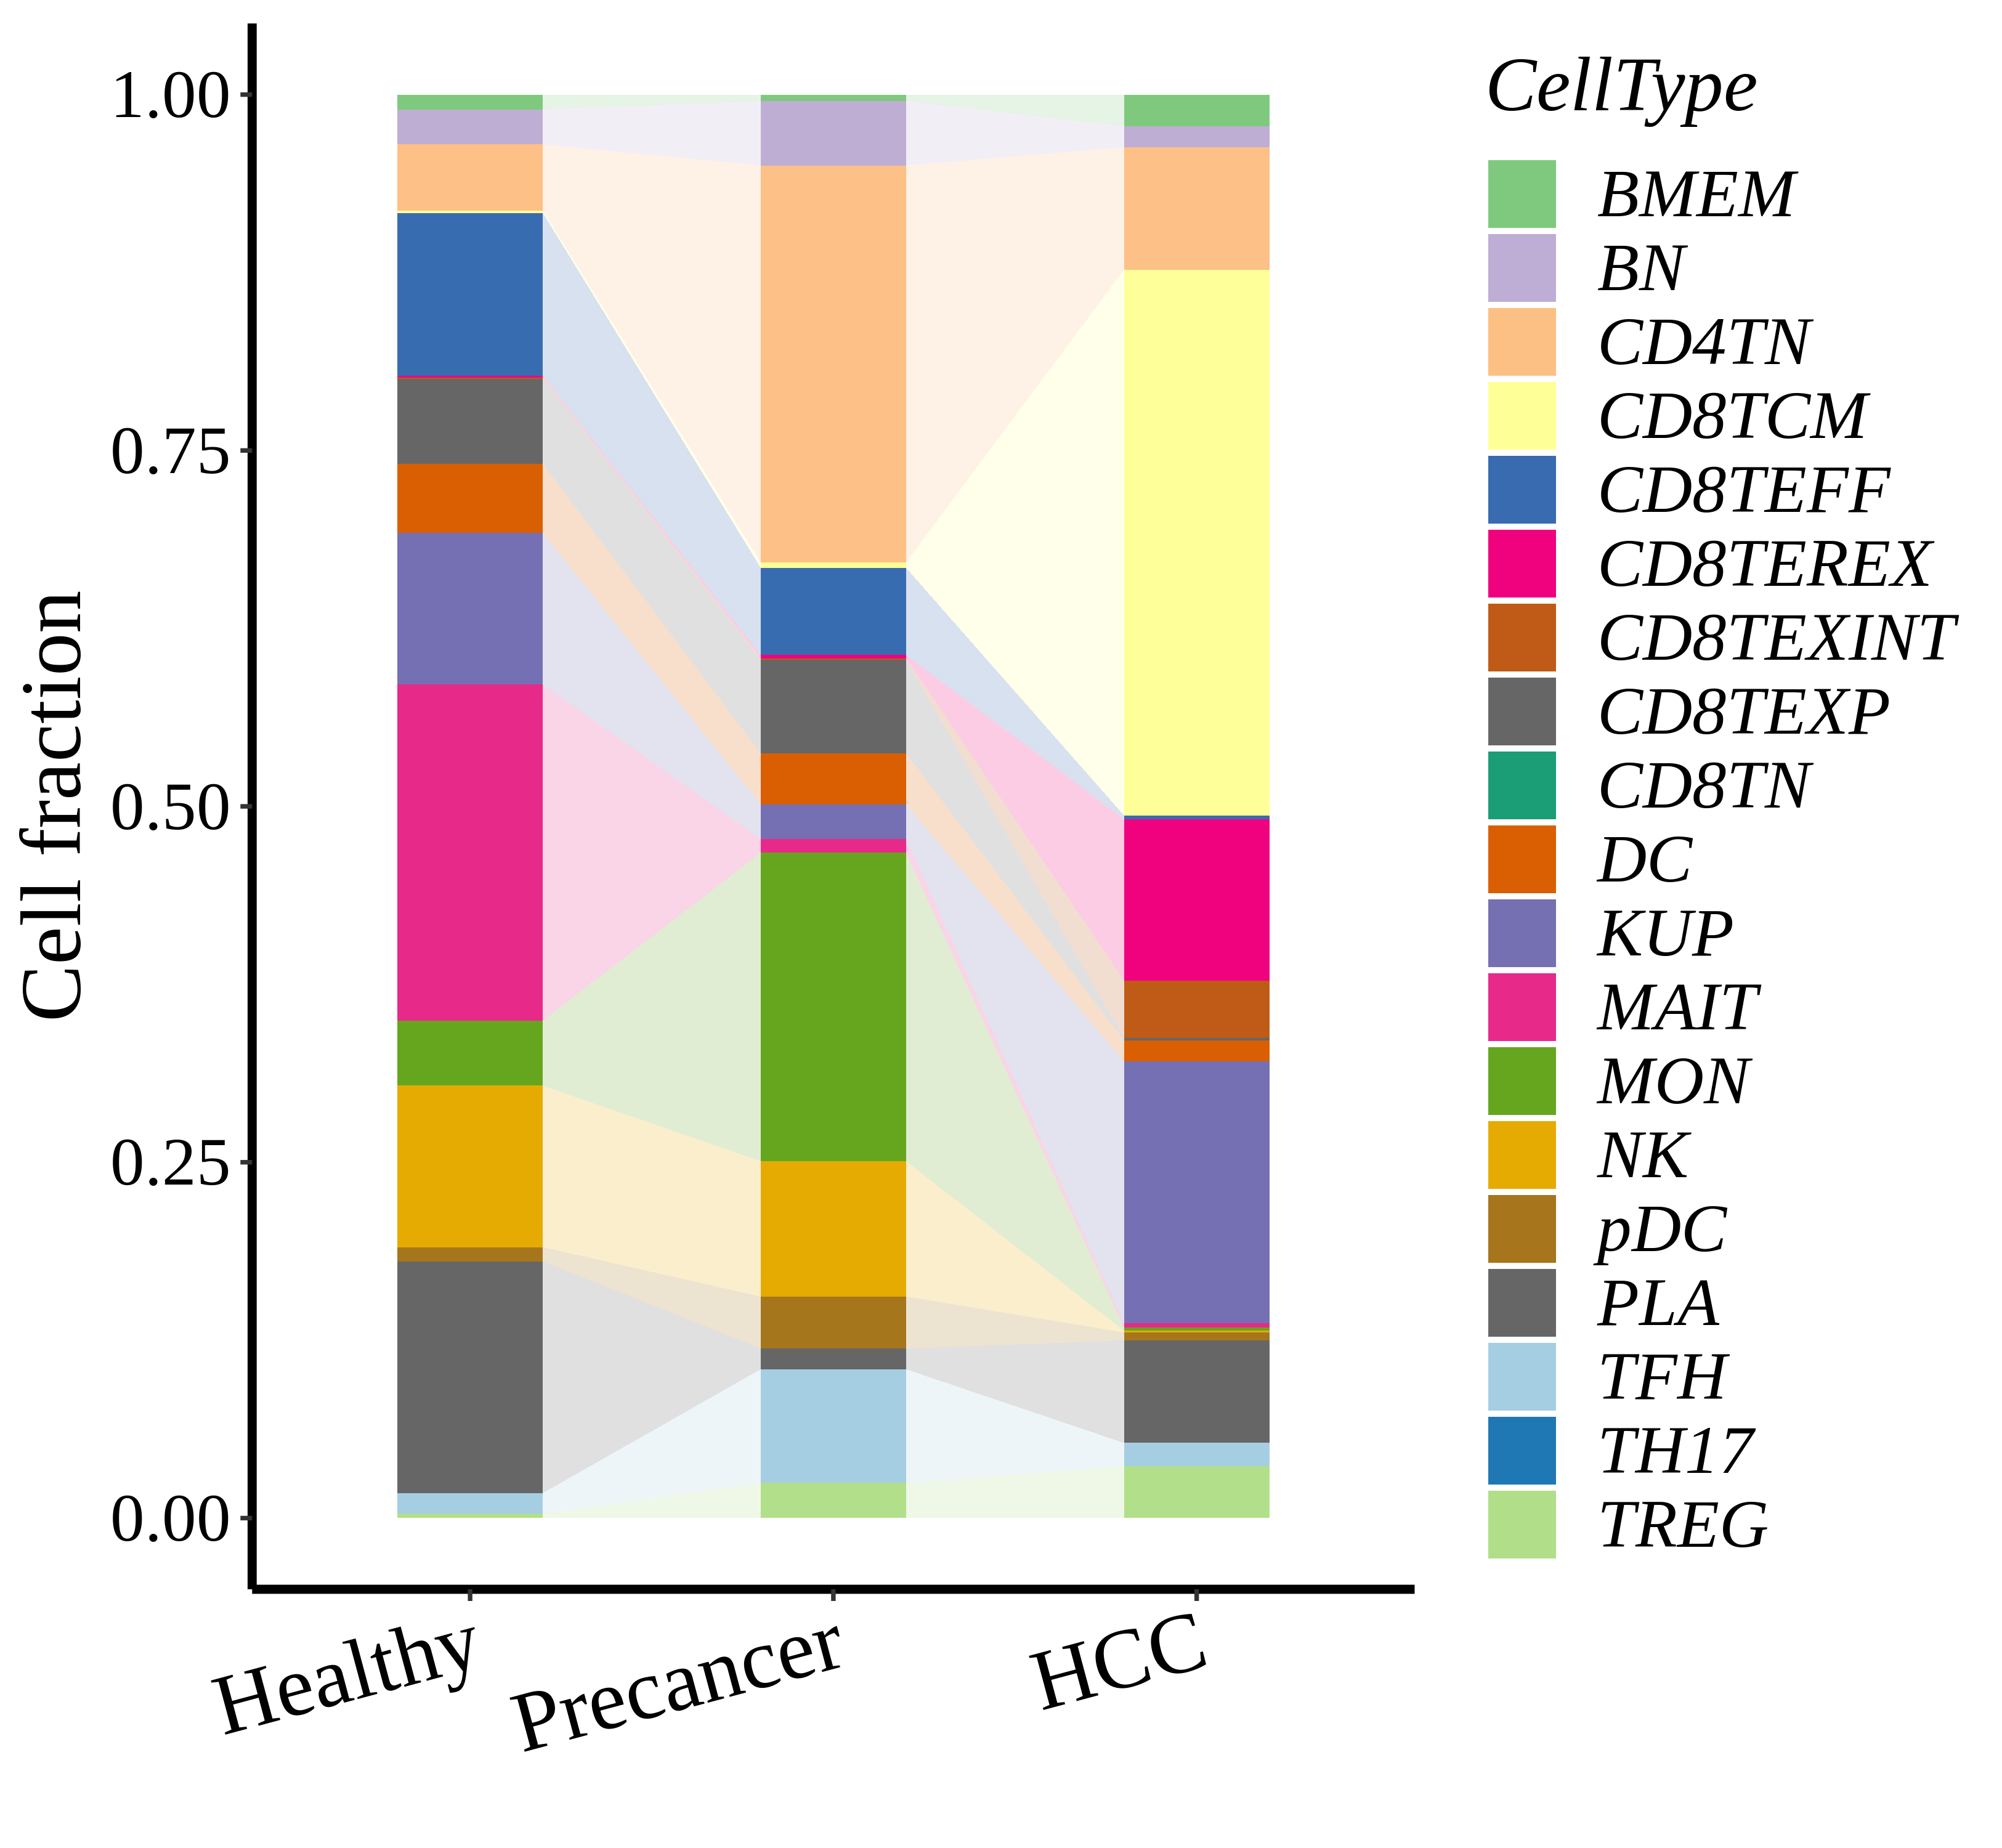
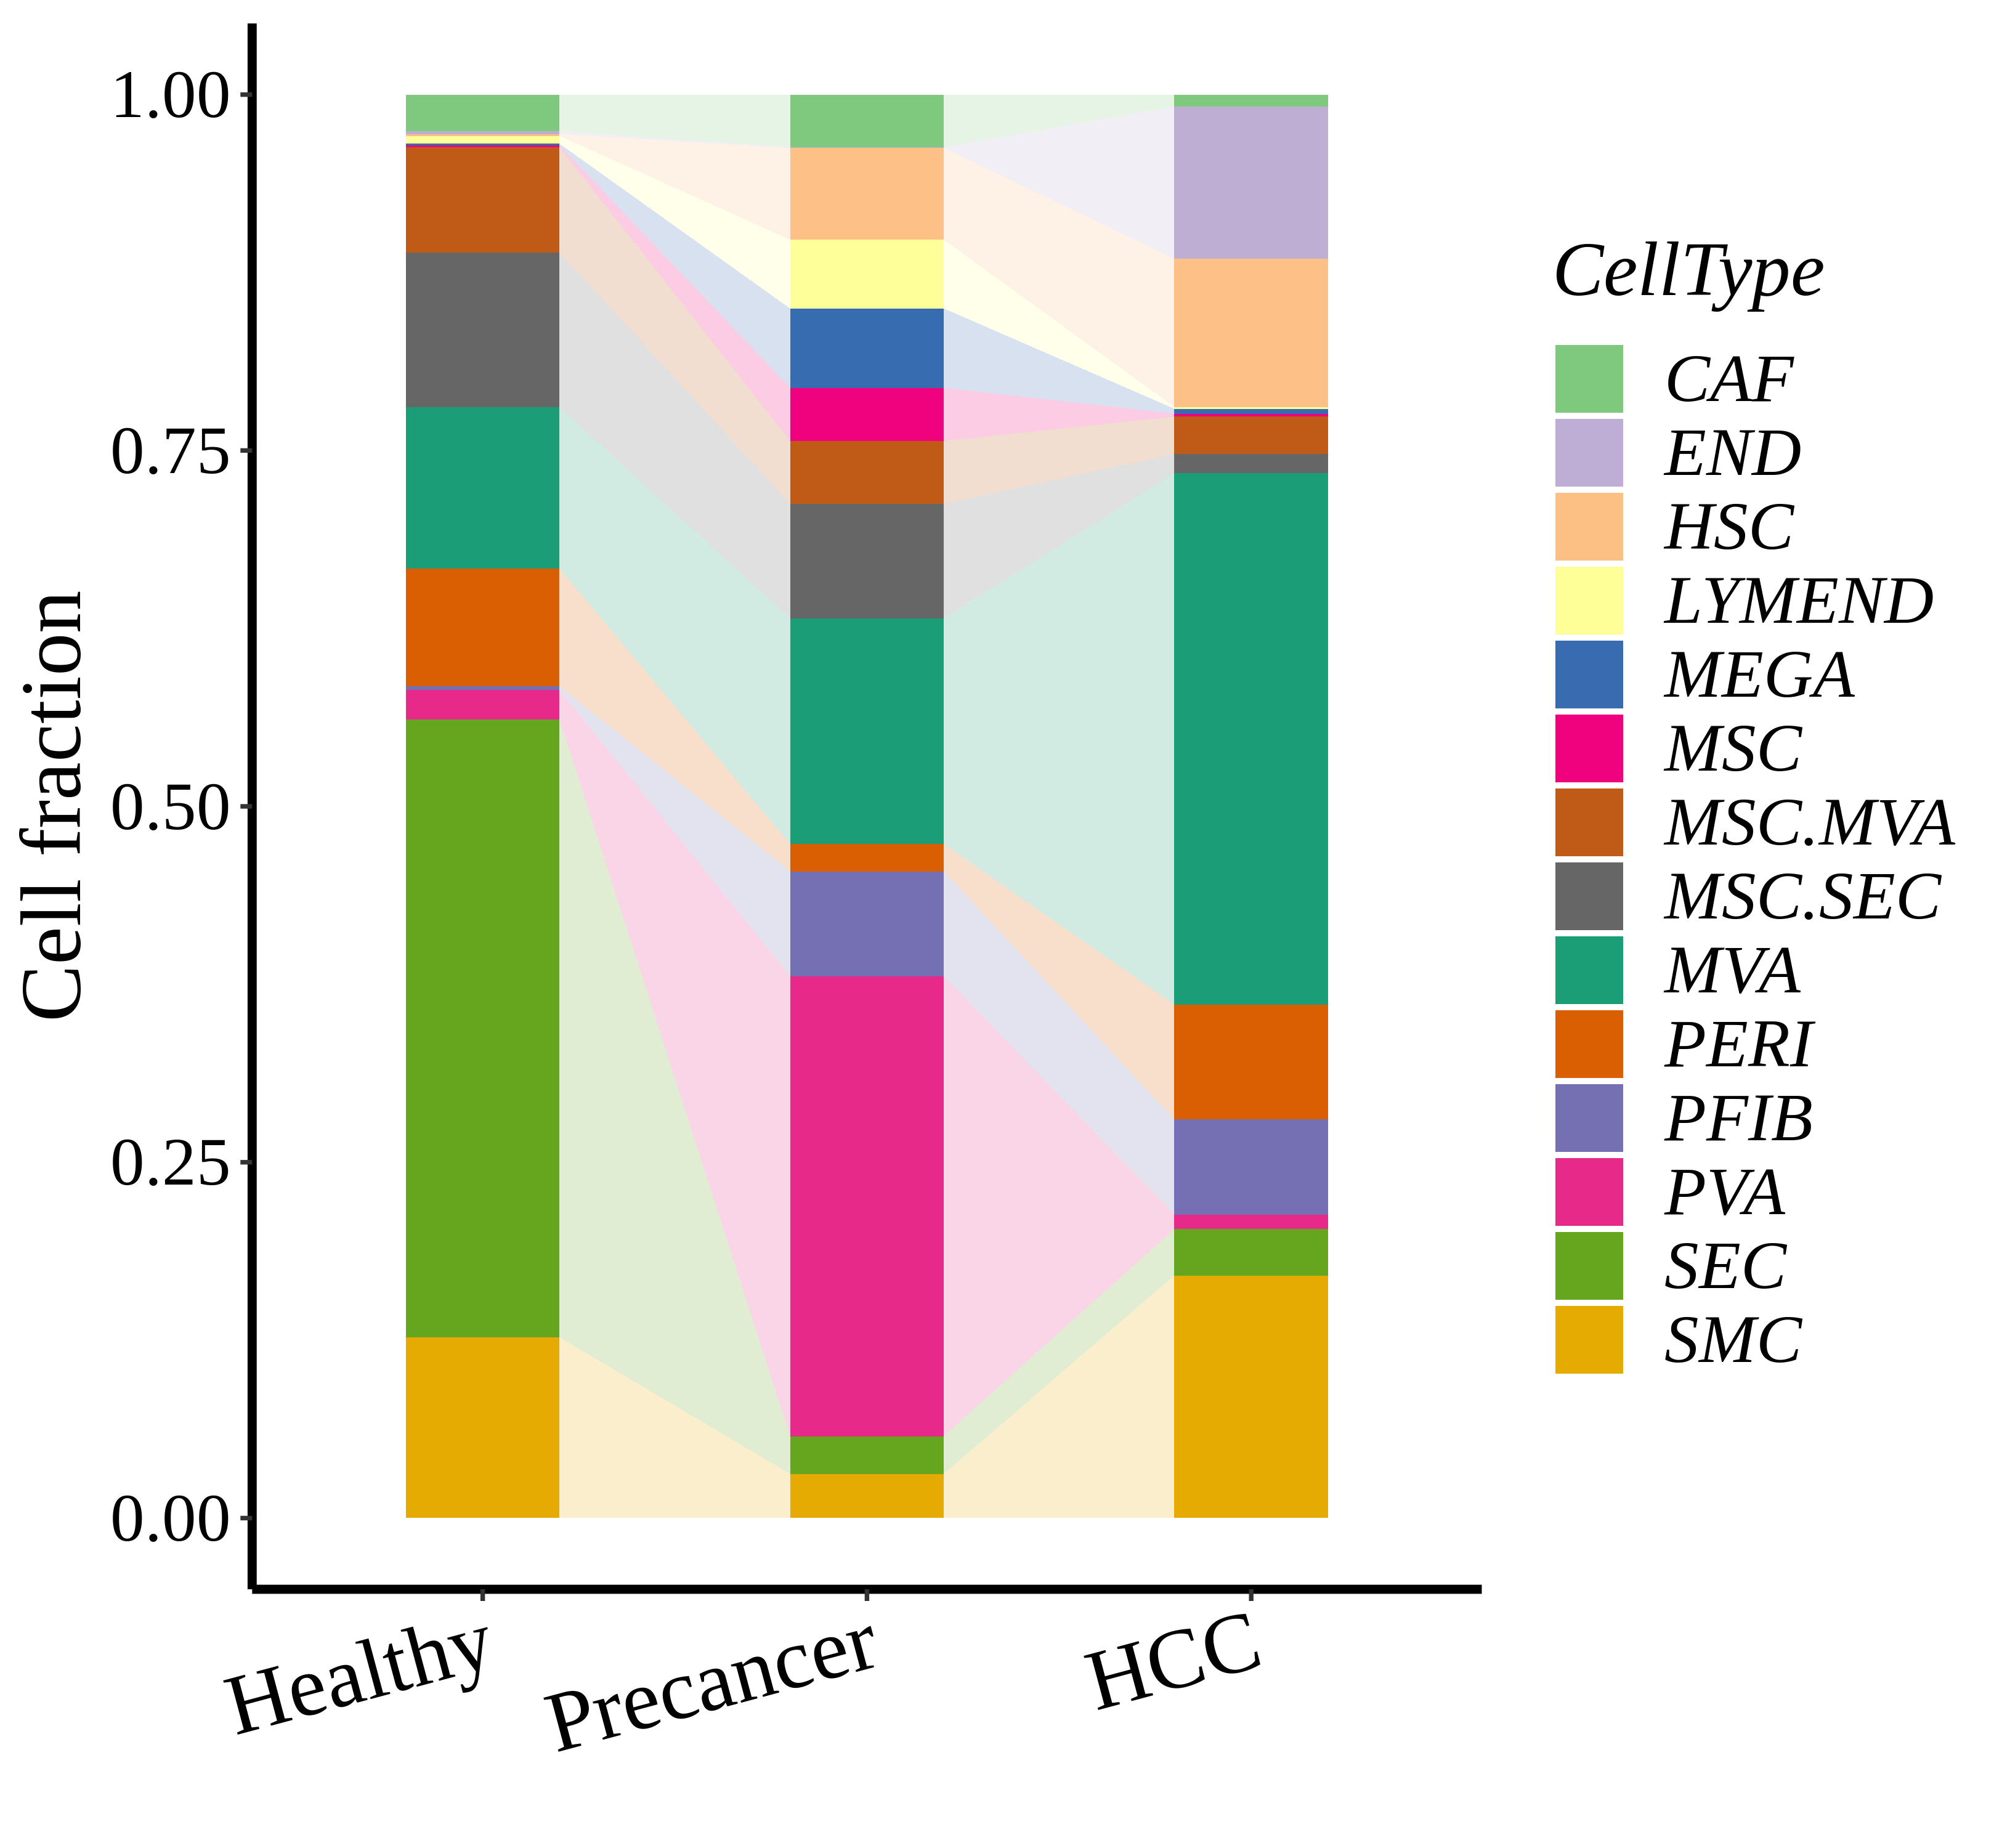
Stacked bar graph representation of the fraction of each epithelial cell type derived from samples with different Disease States in the integrated dataset of the selected tissue. Cells from each Disease State sample have a different color.Stacked bar graph representation of the fraction of each immune cell type derived from samples with different Disease States in the integrated dataset of the selected tissue. Cells from each Disease State sample have a different color.Stacked bar graph representation of the fraction of each stromal cell type derived from samples with different Disease States in the integrated dataset of the selected tissue. Cells from each Disease State sample have a different color.
∗Stacked bar graph representation of the fraction of each epithelial cell type derived from samples with different Disease States in the integrated dataset of Liver tissue. Cells from each Disease State sample have a different color.

Top

Cell type dynamics in malignant transformation

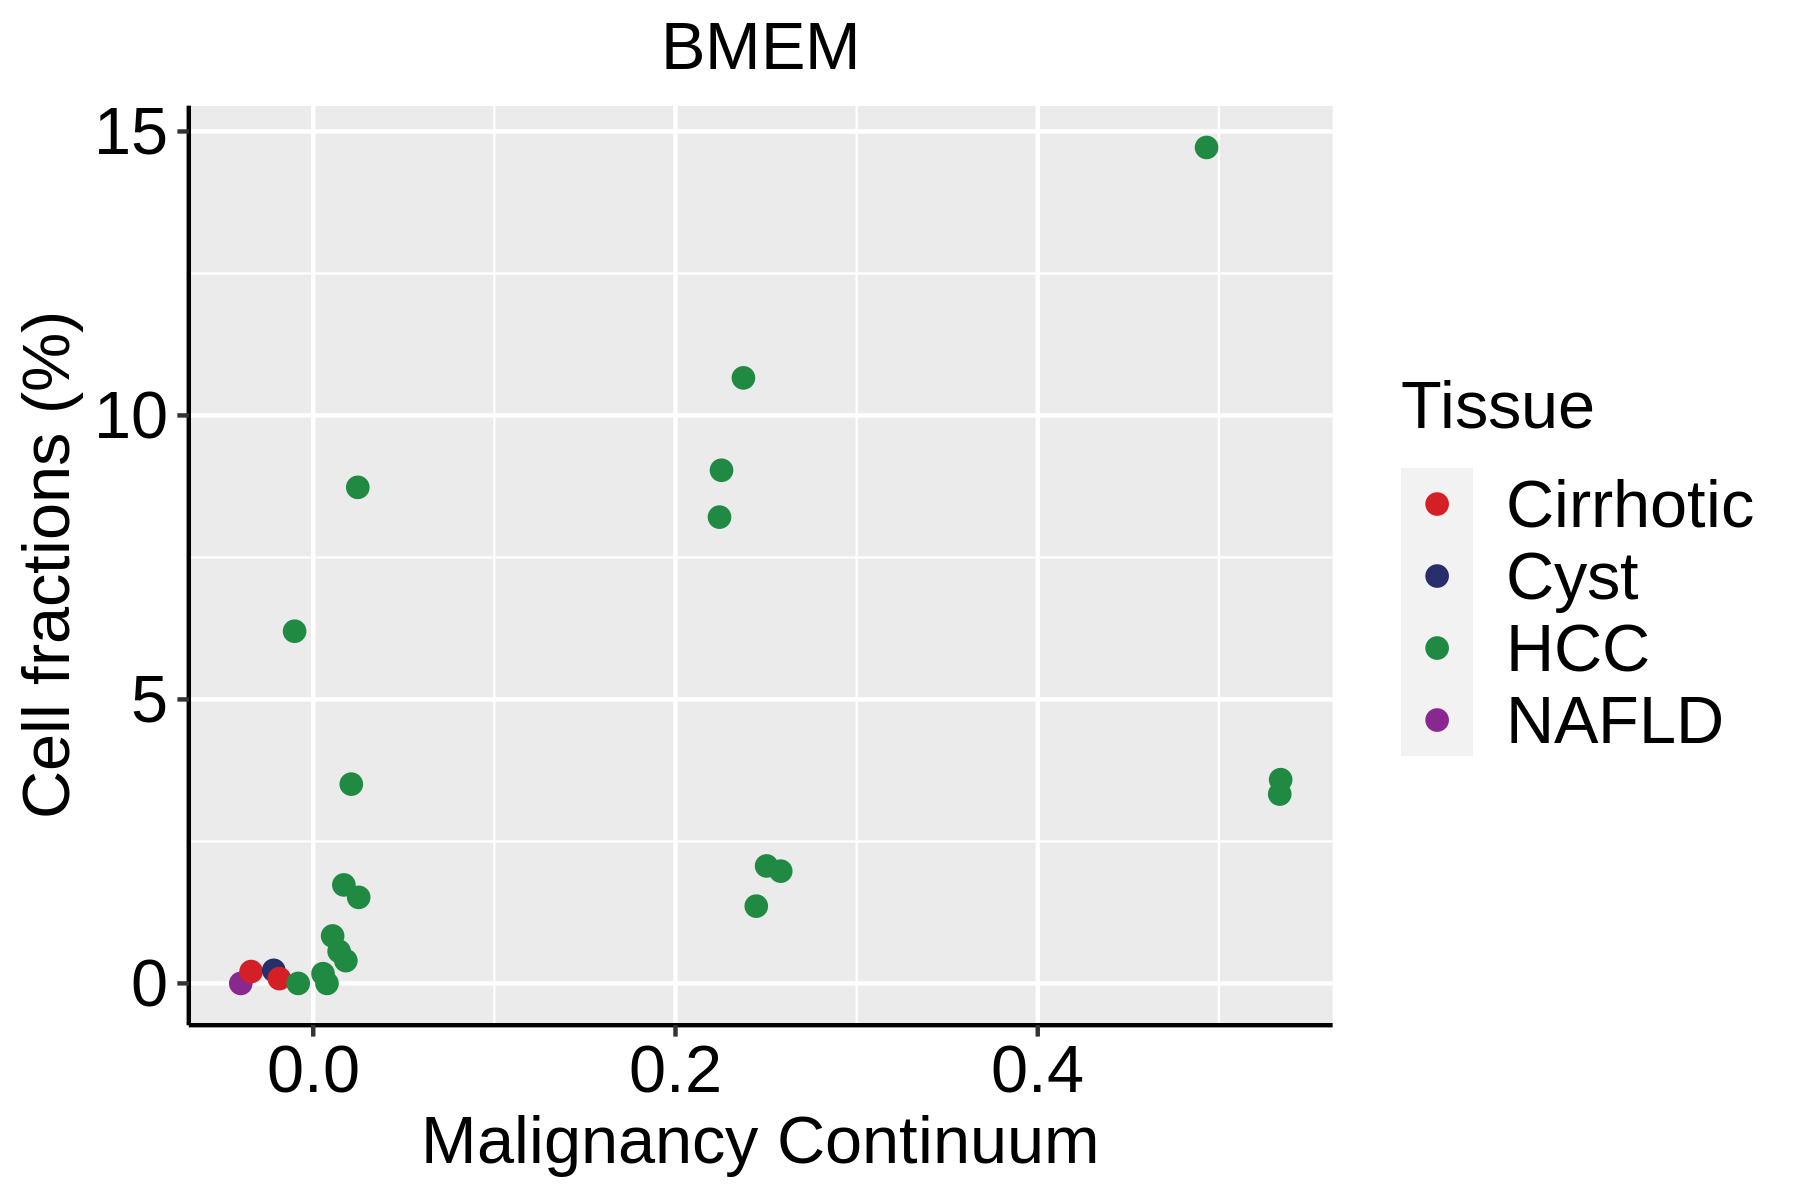
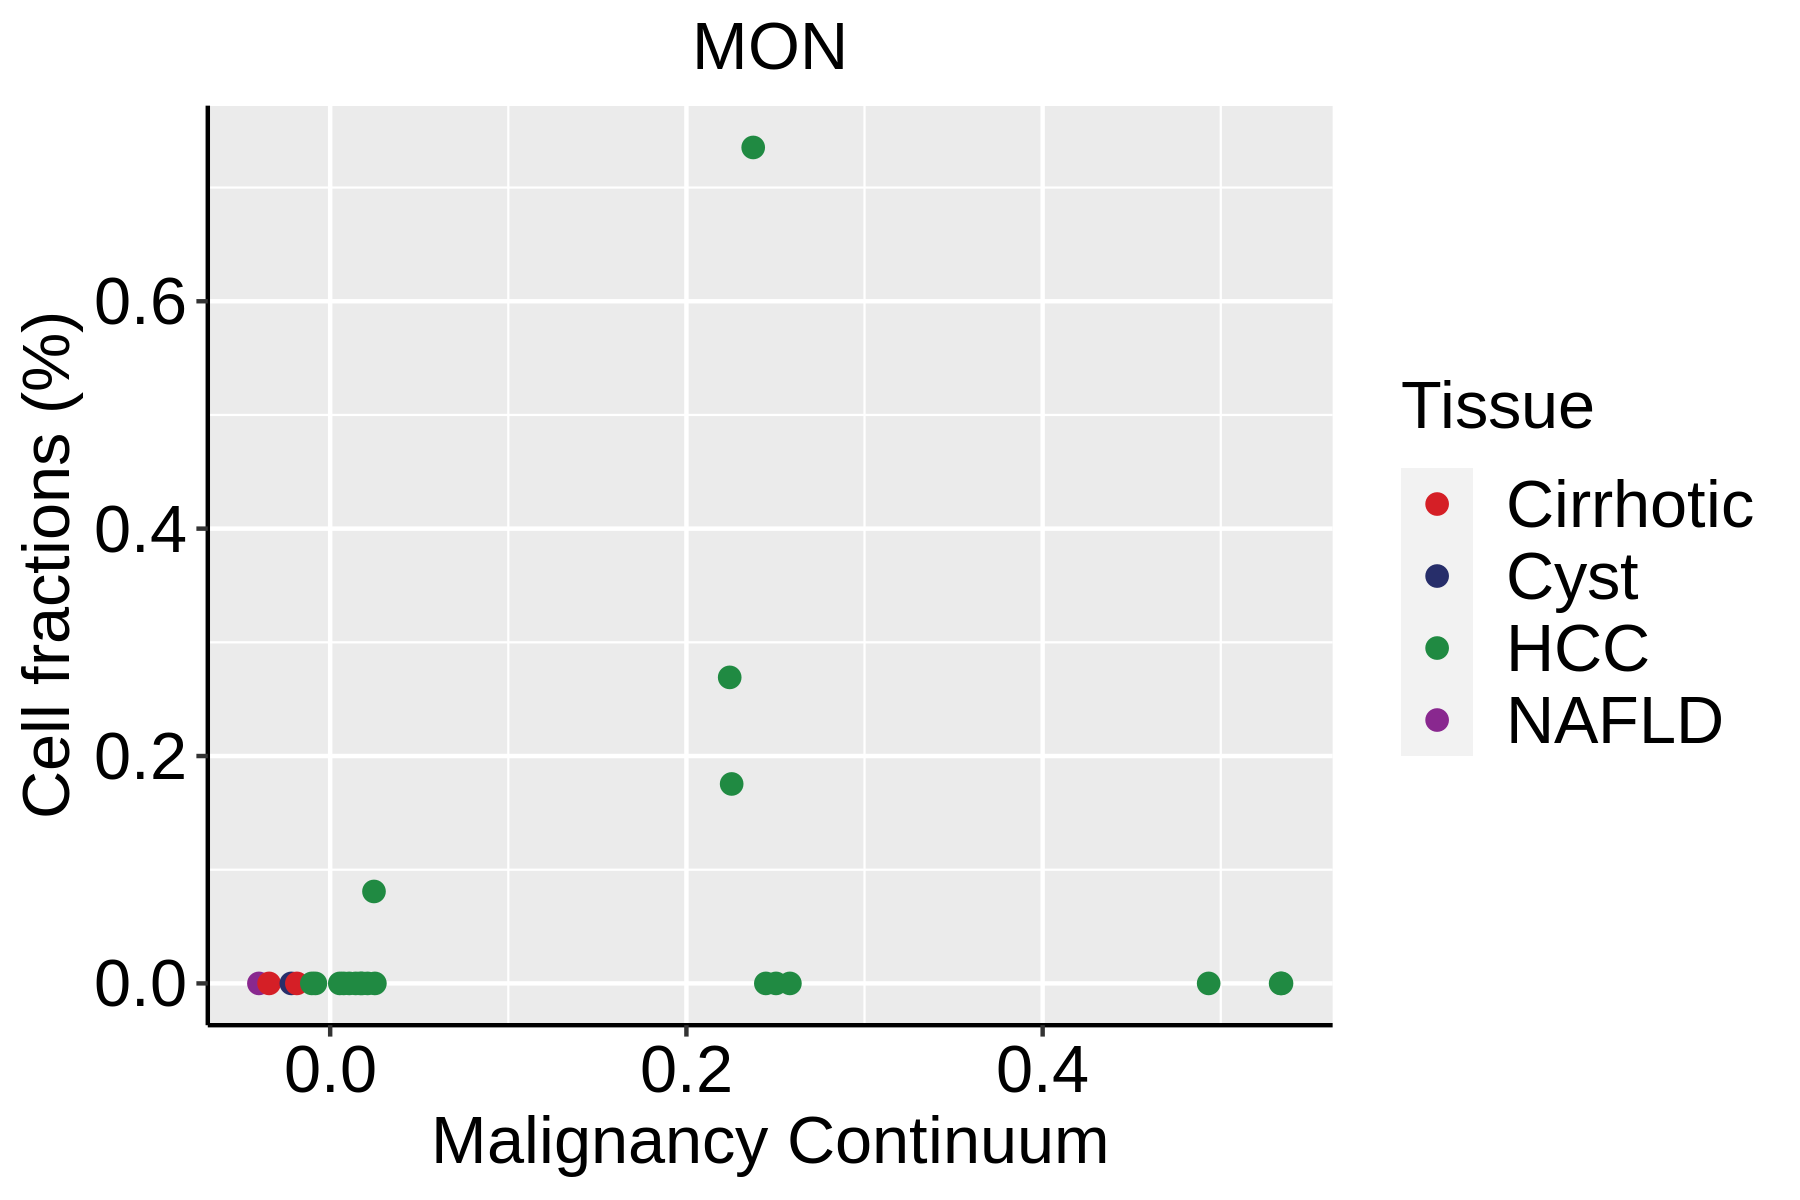
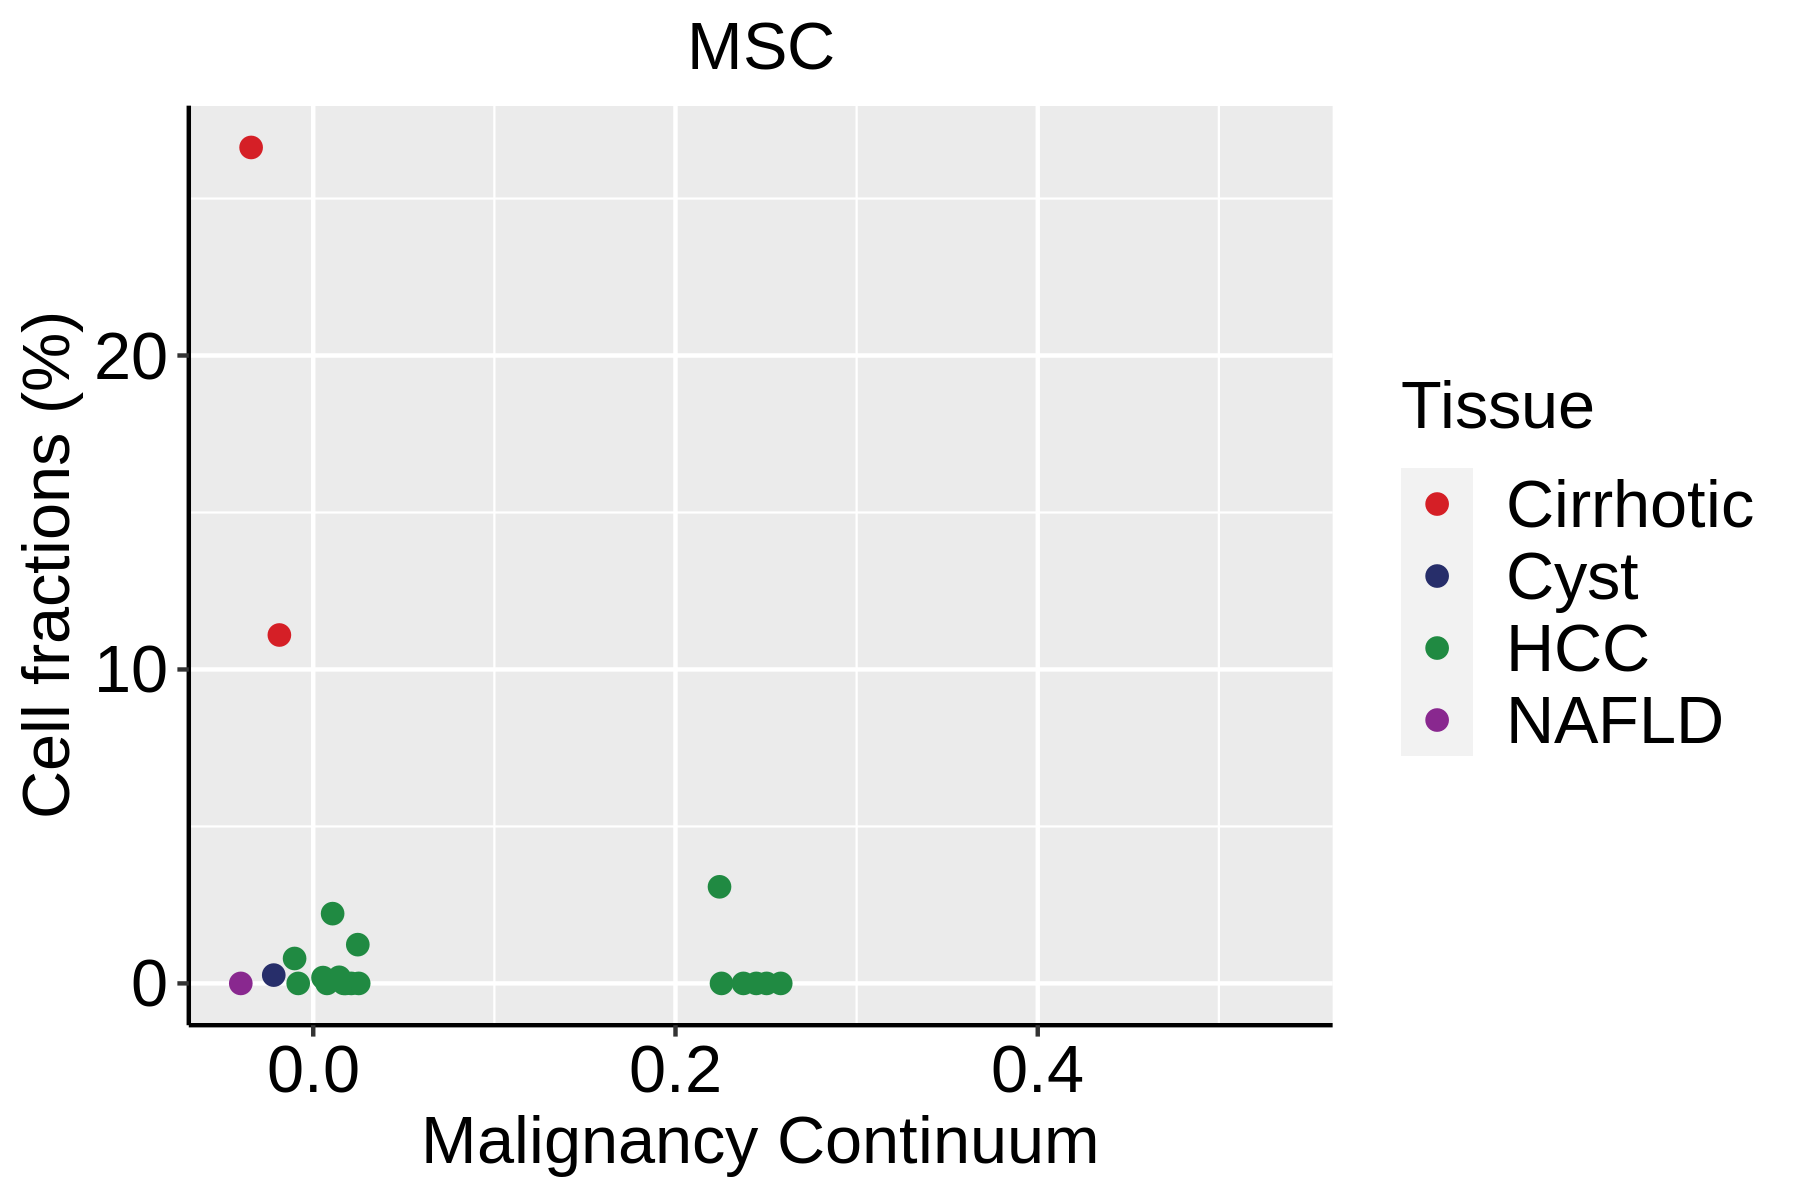
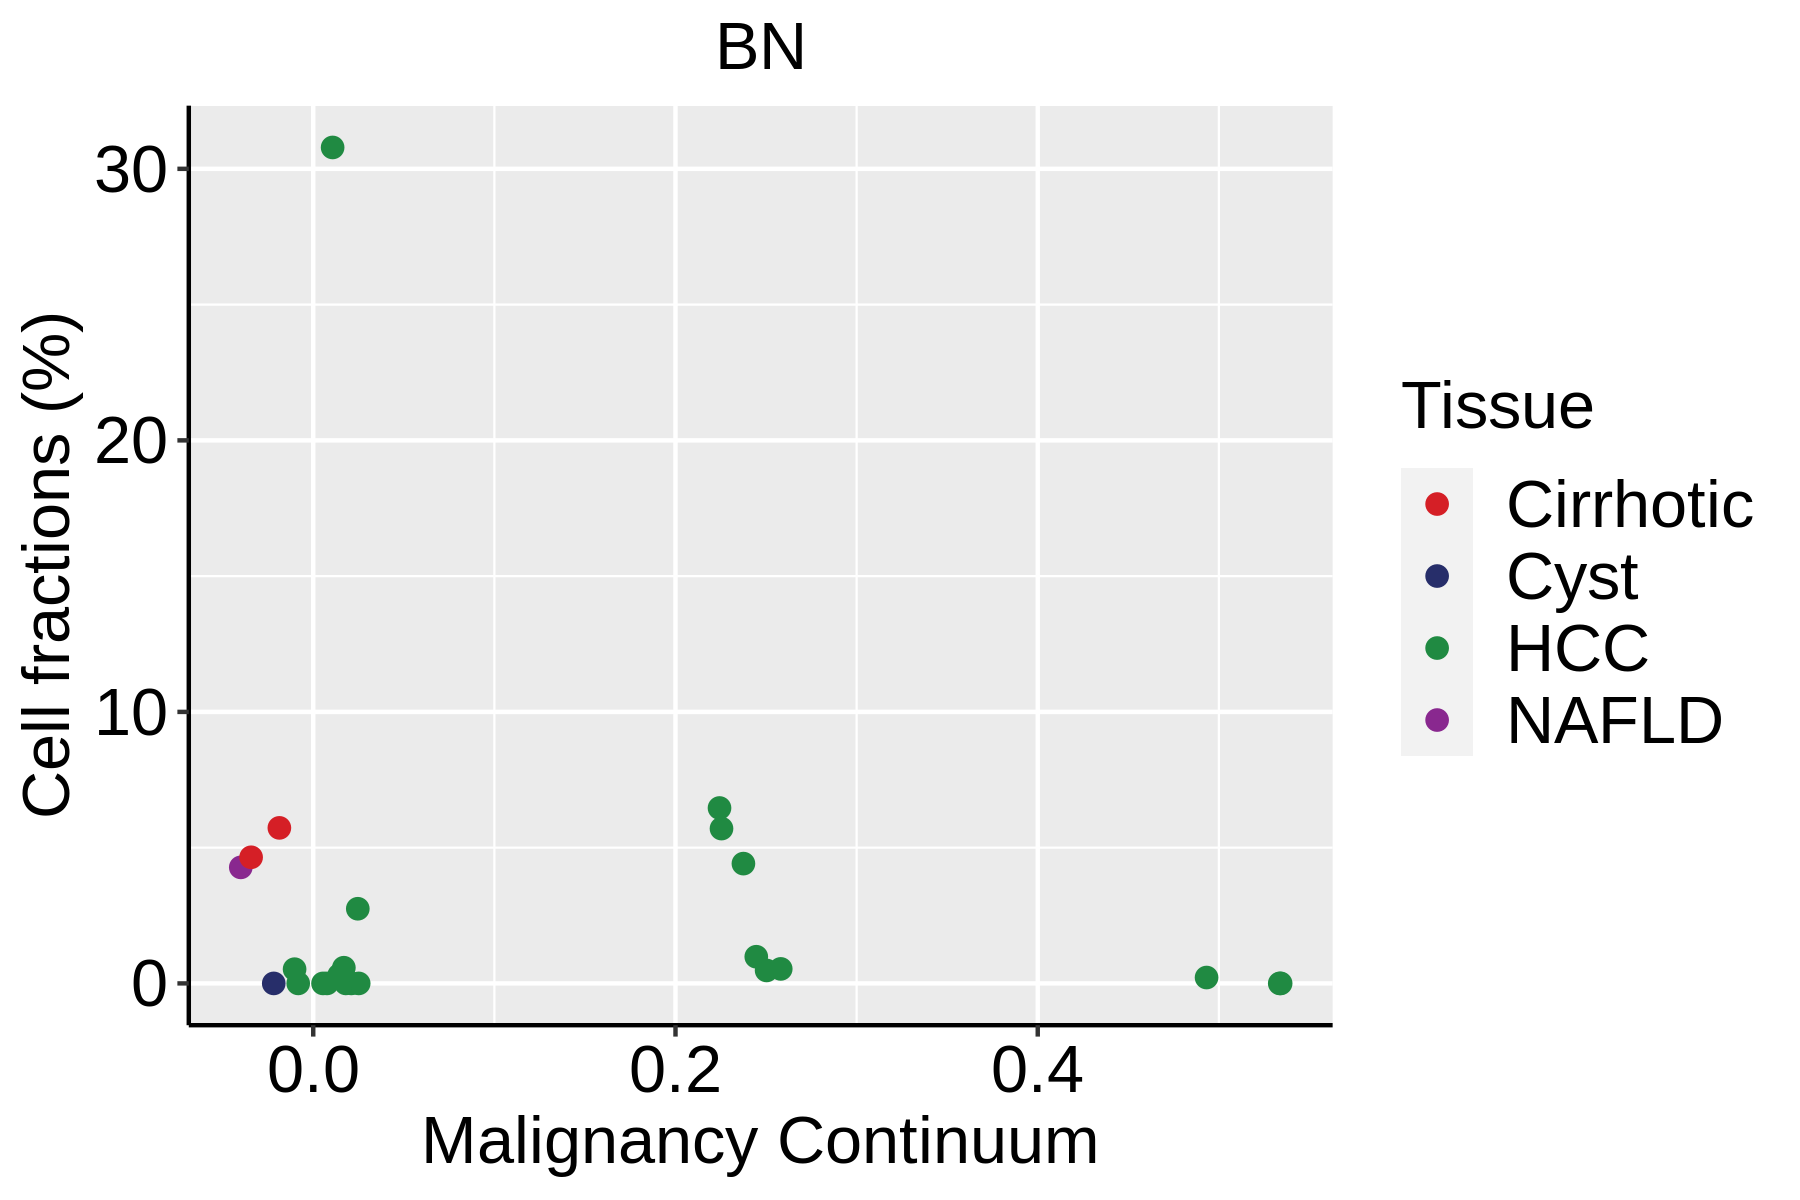
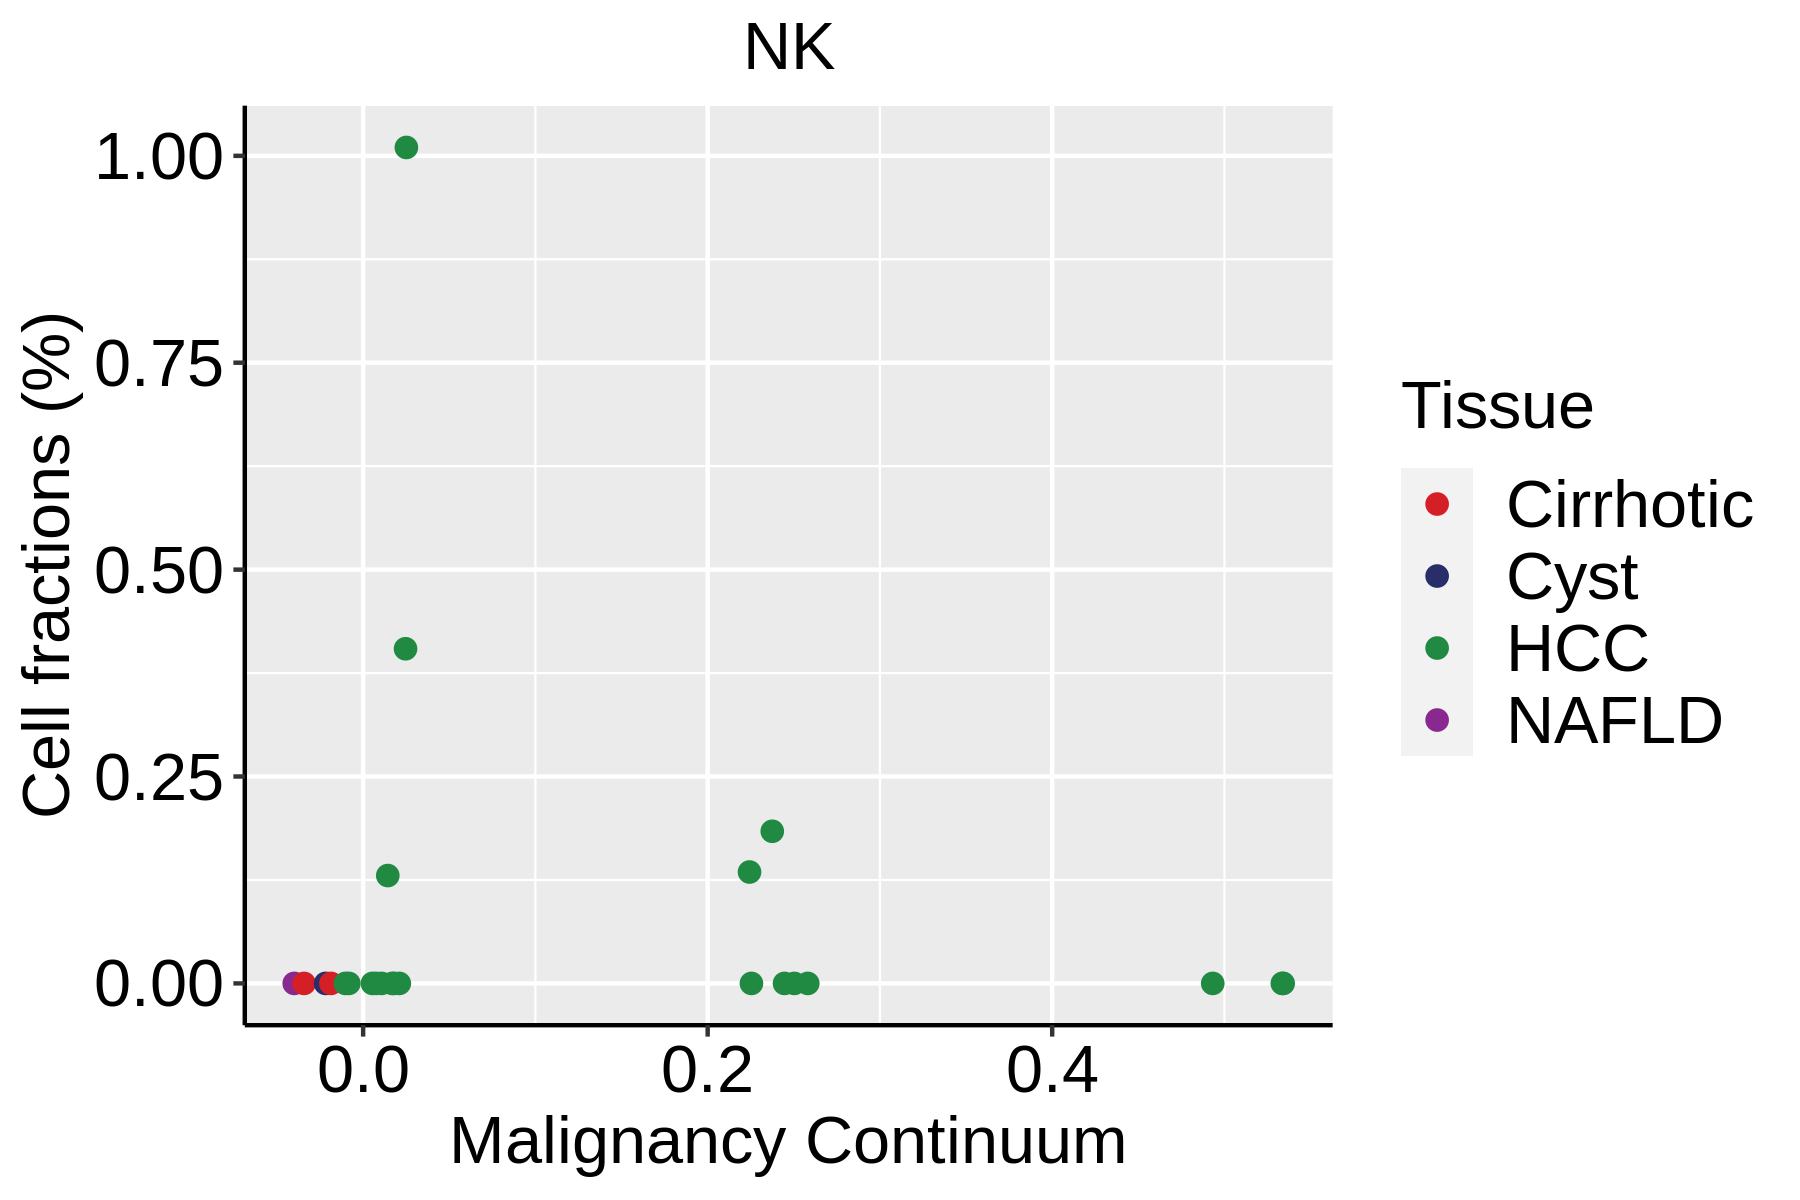
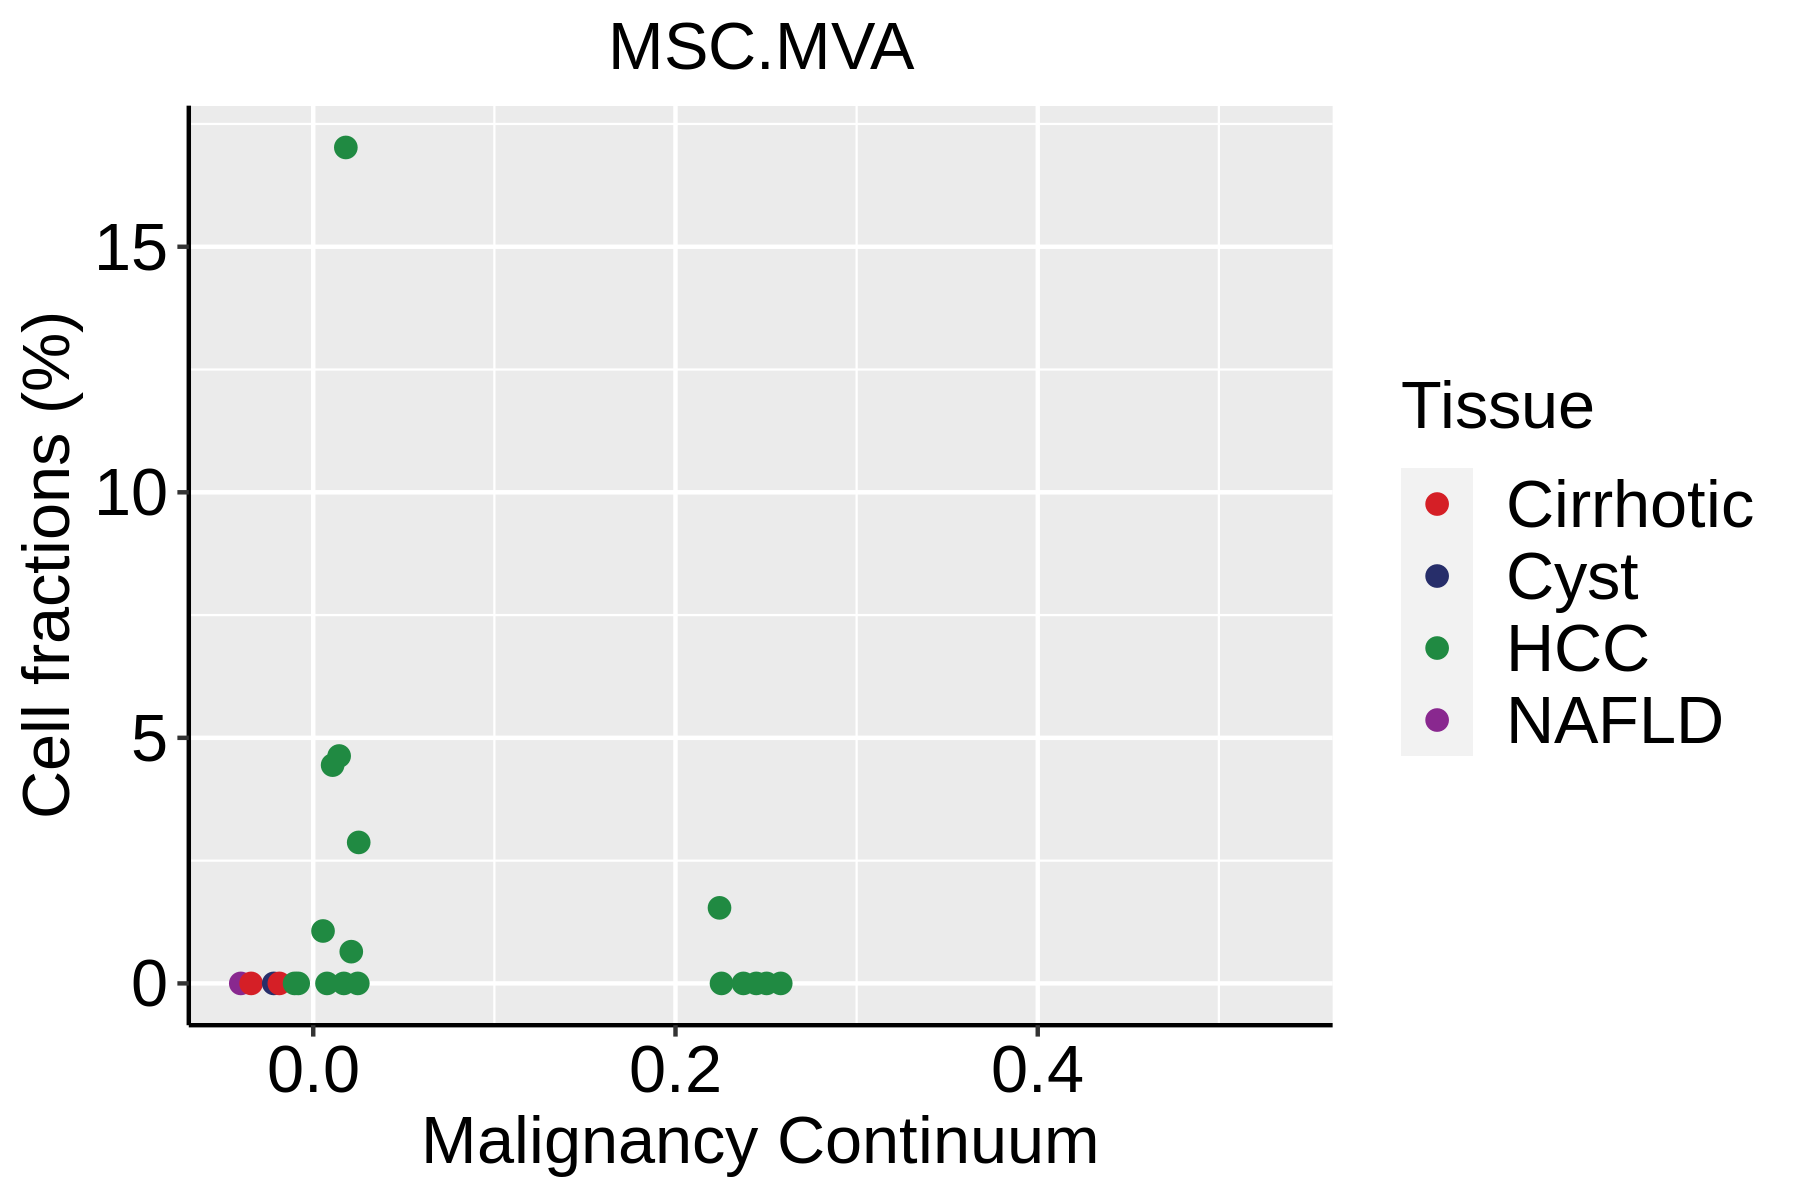
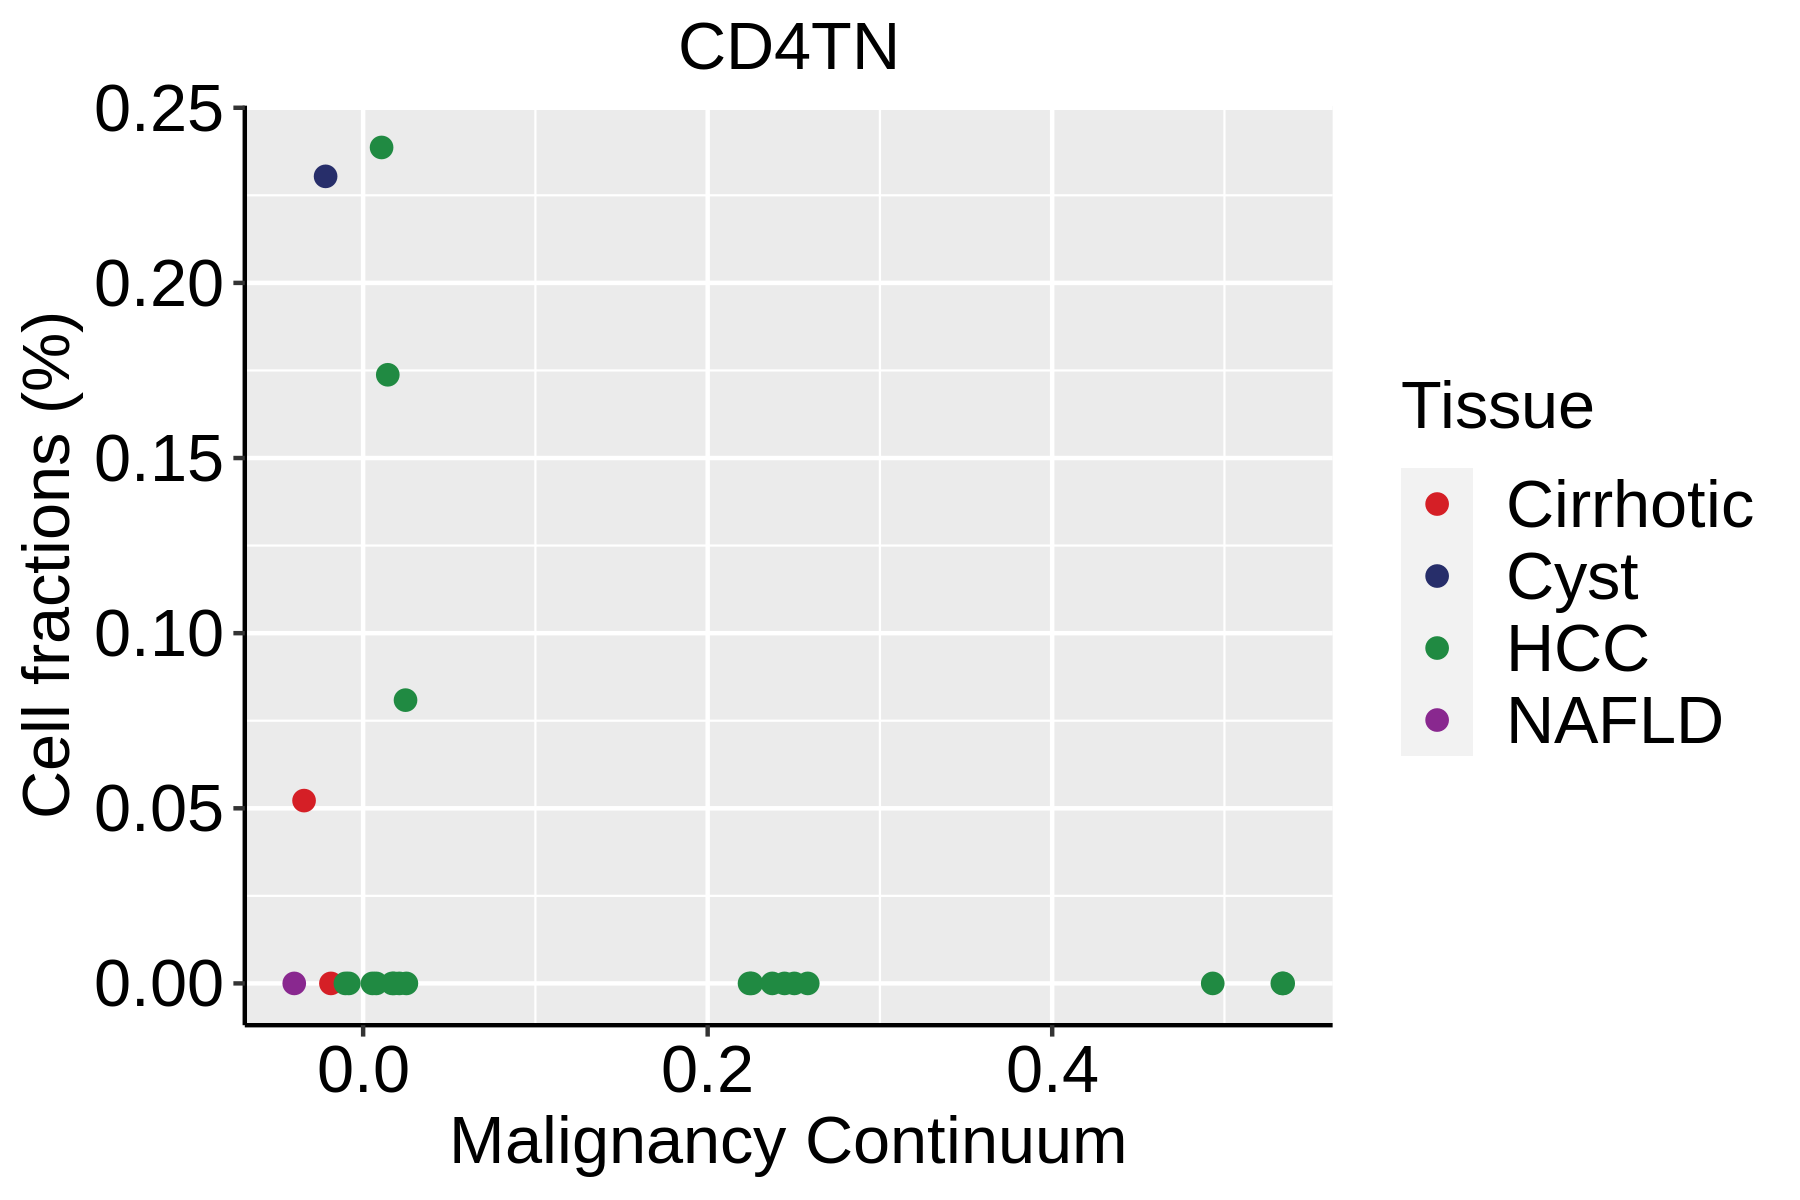
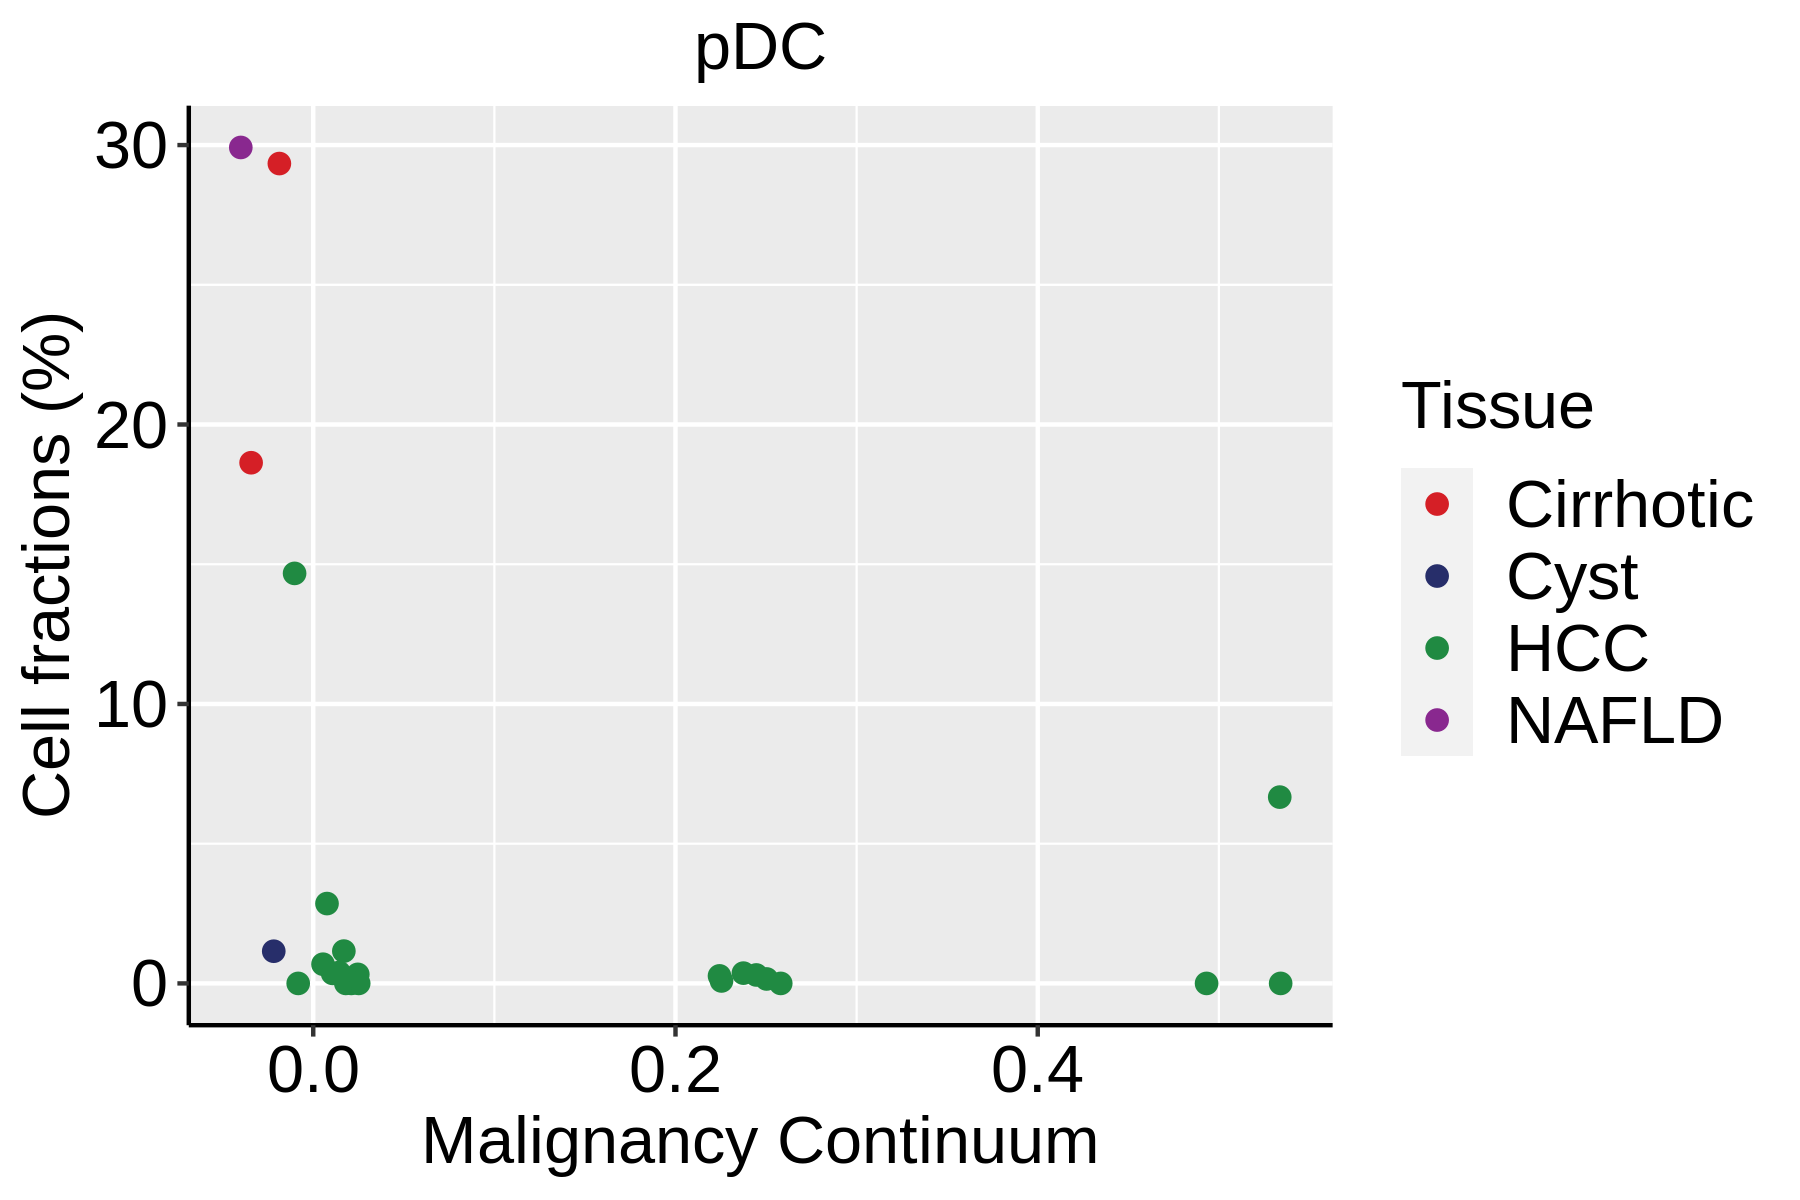
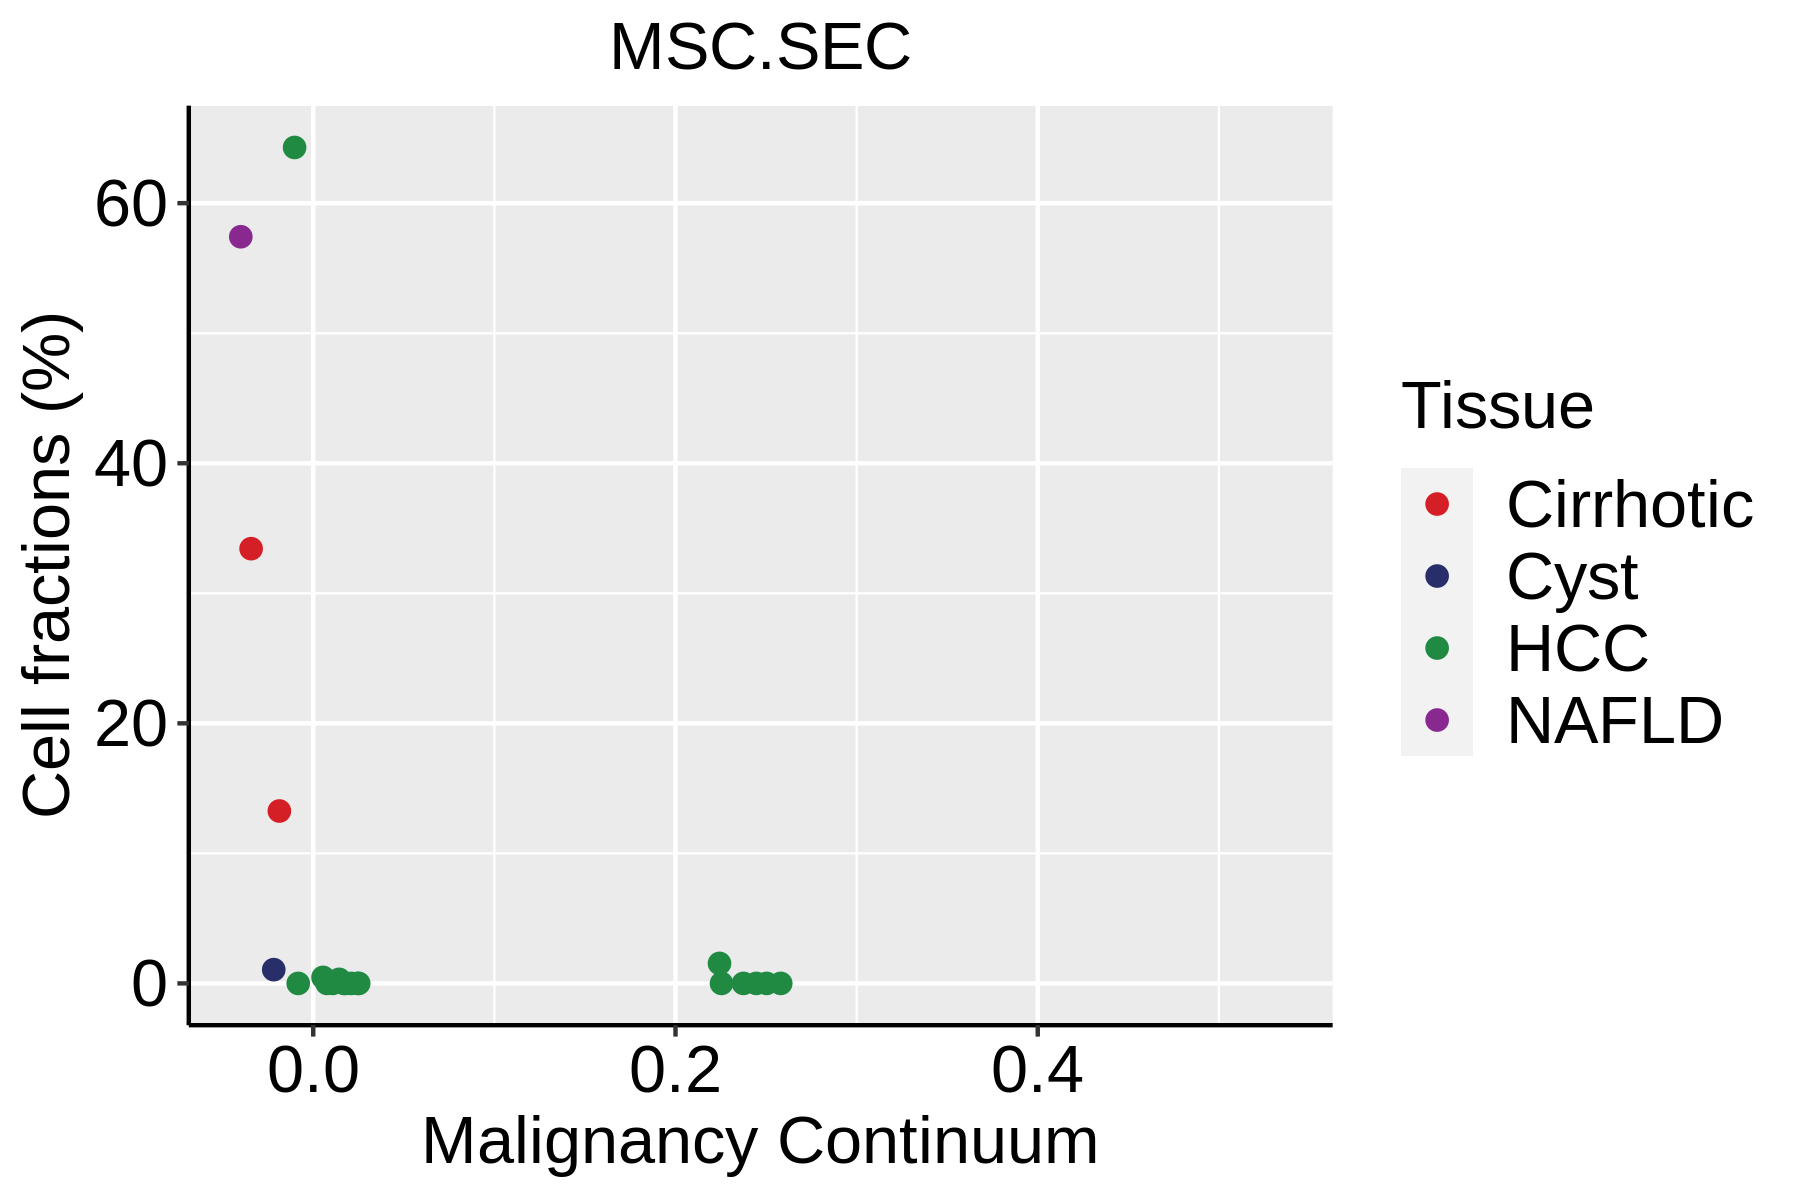
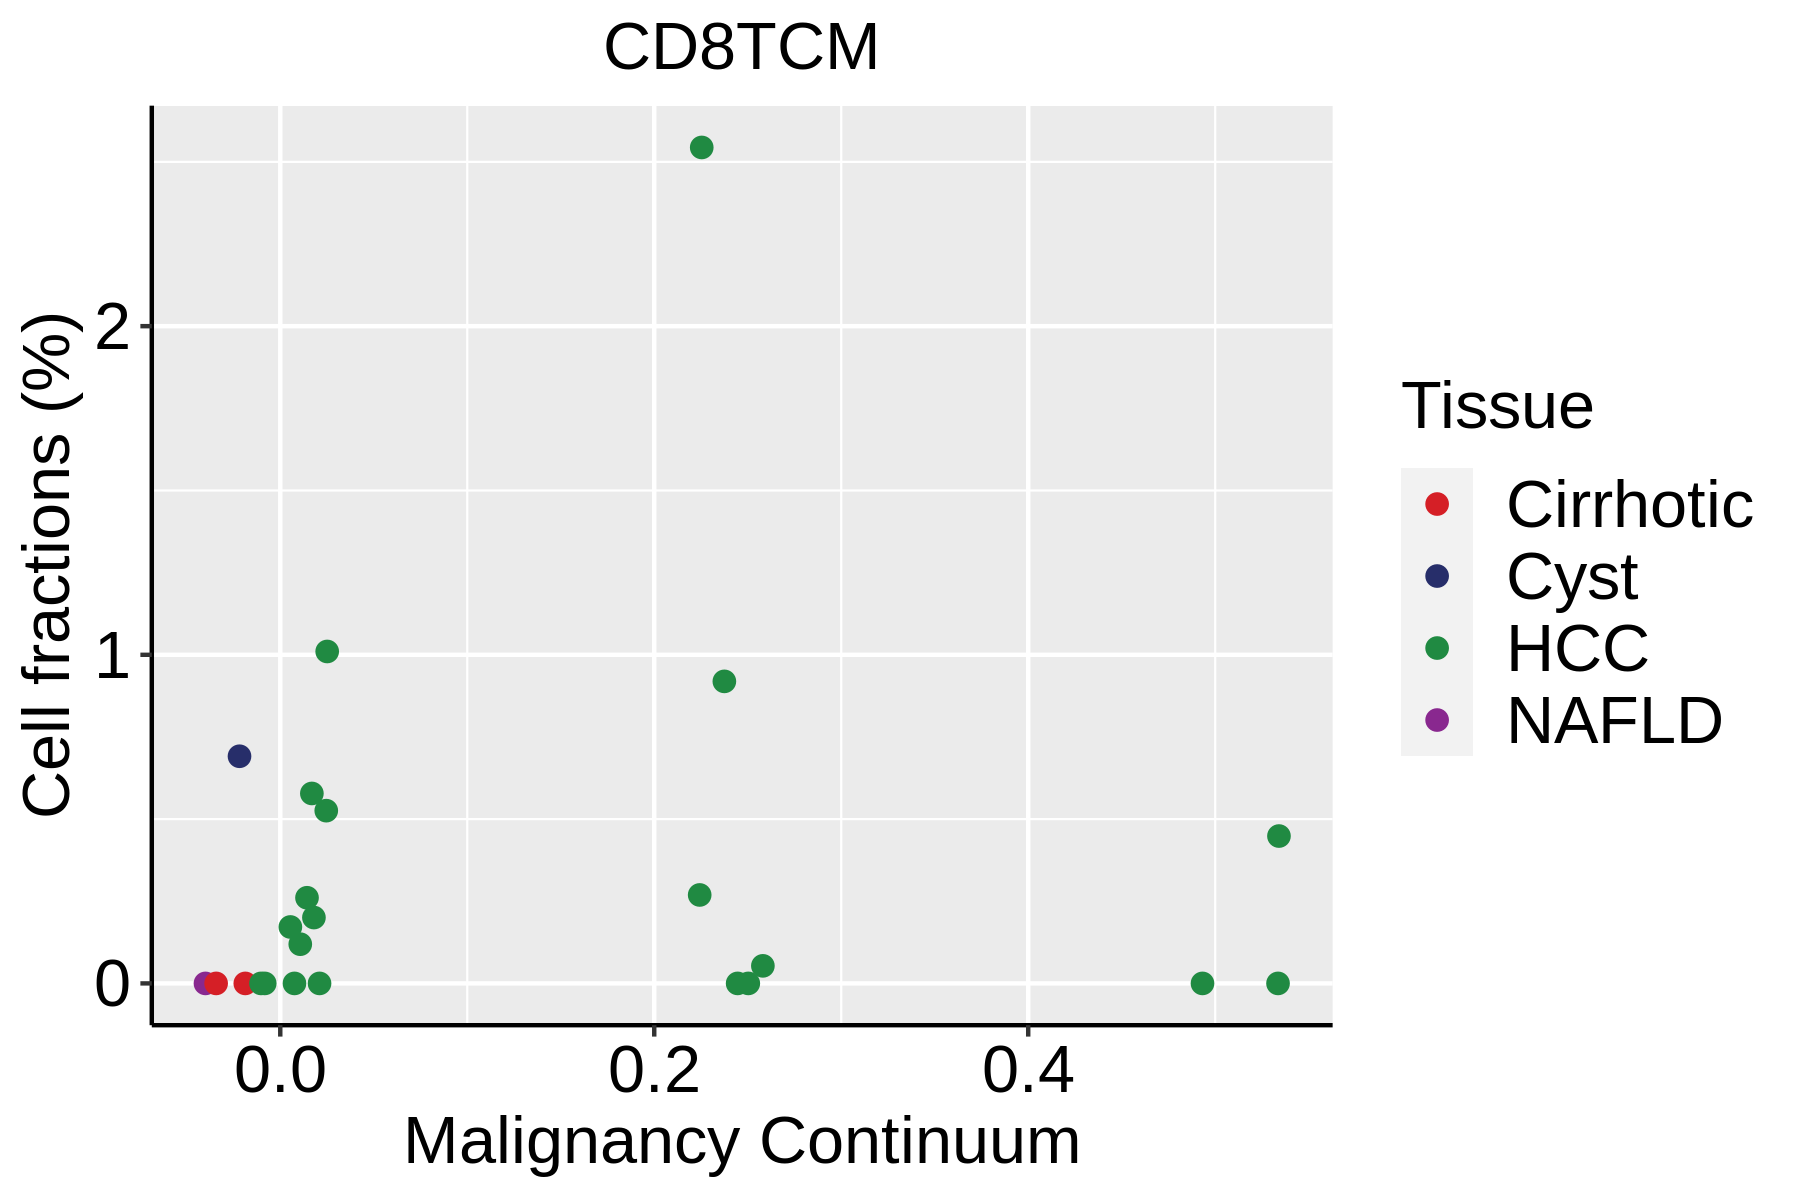
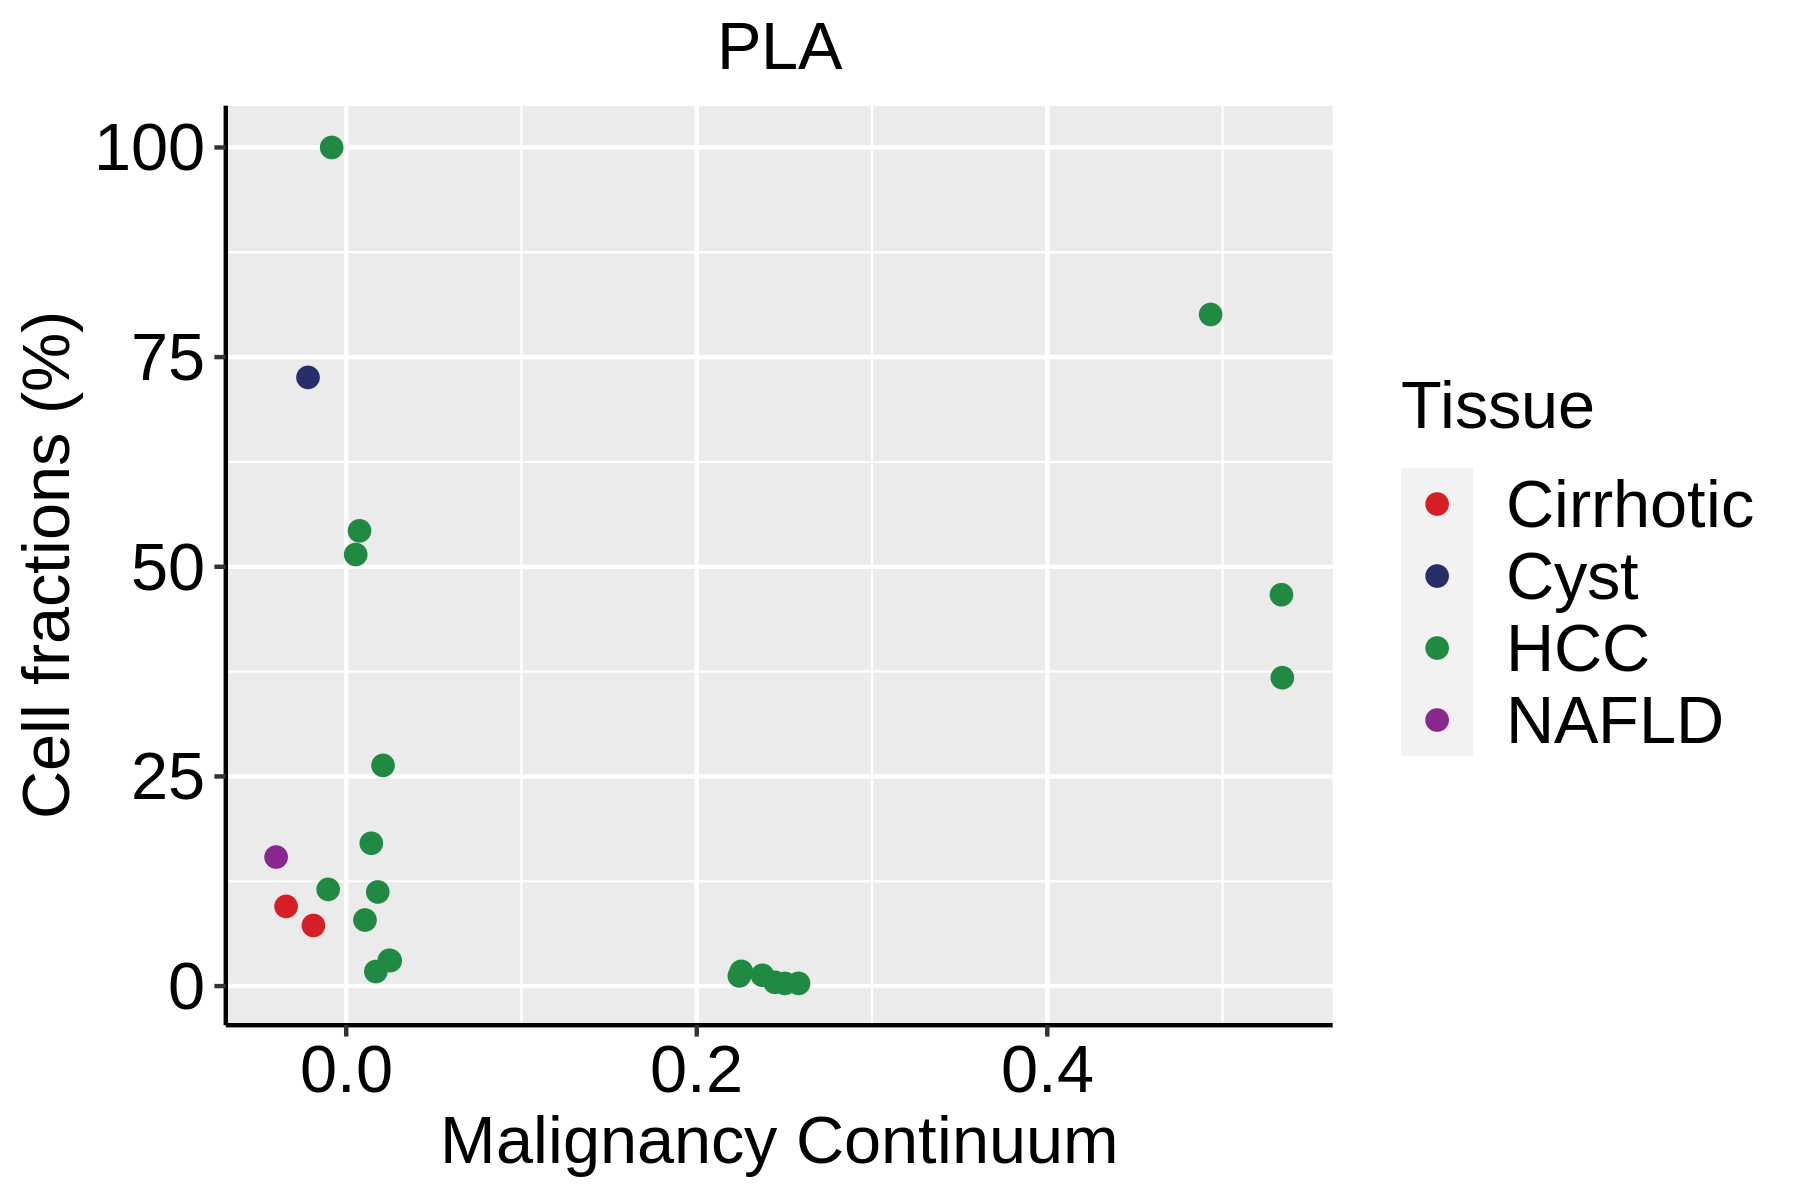
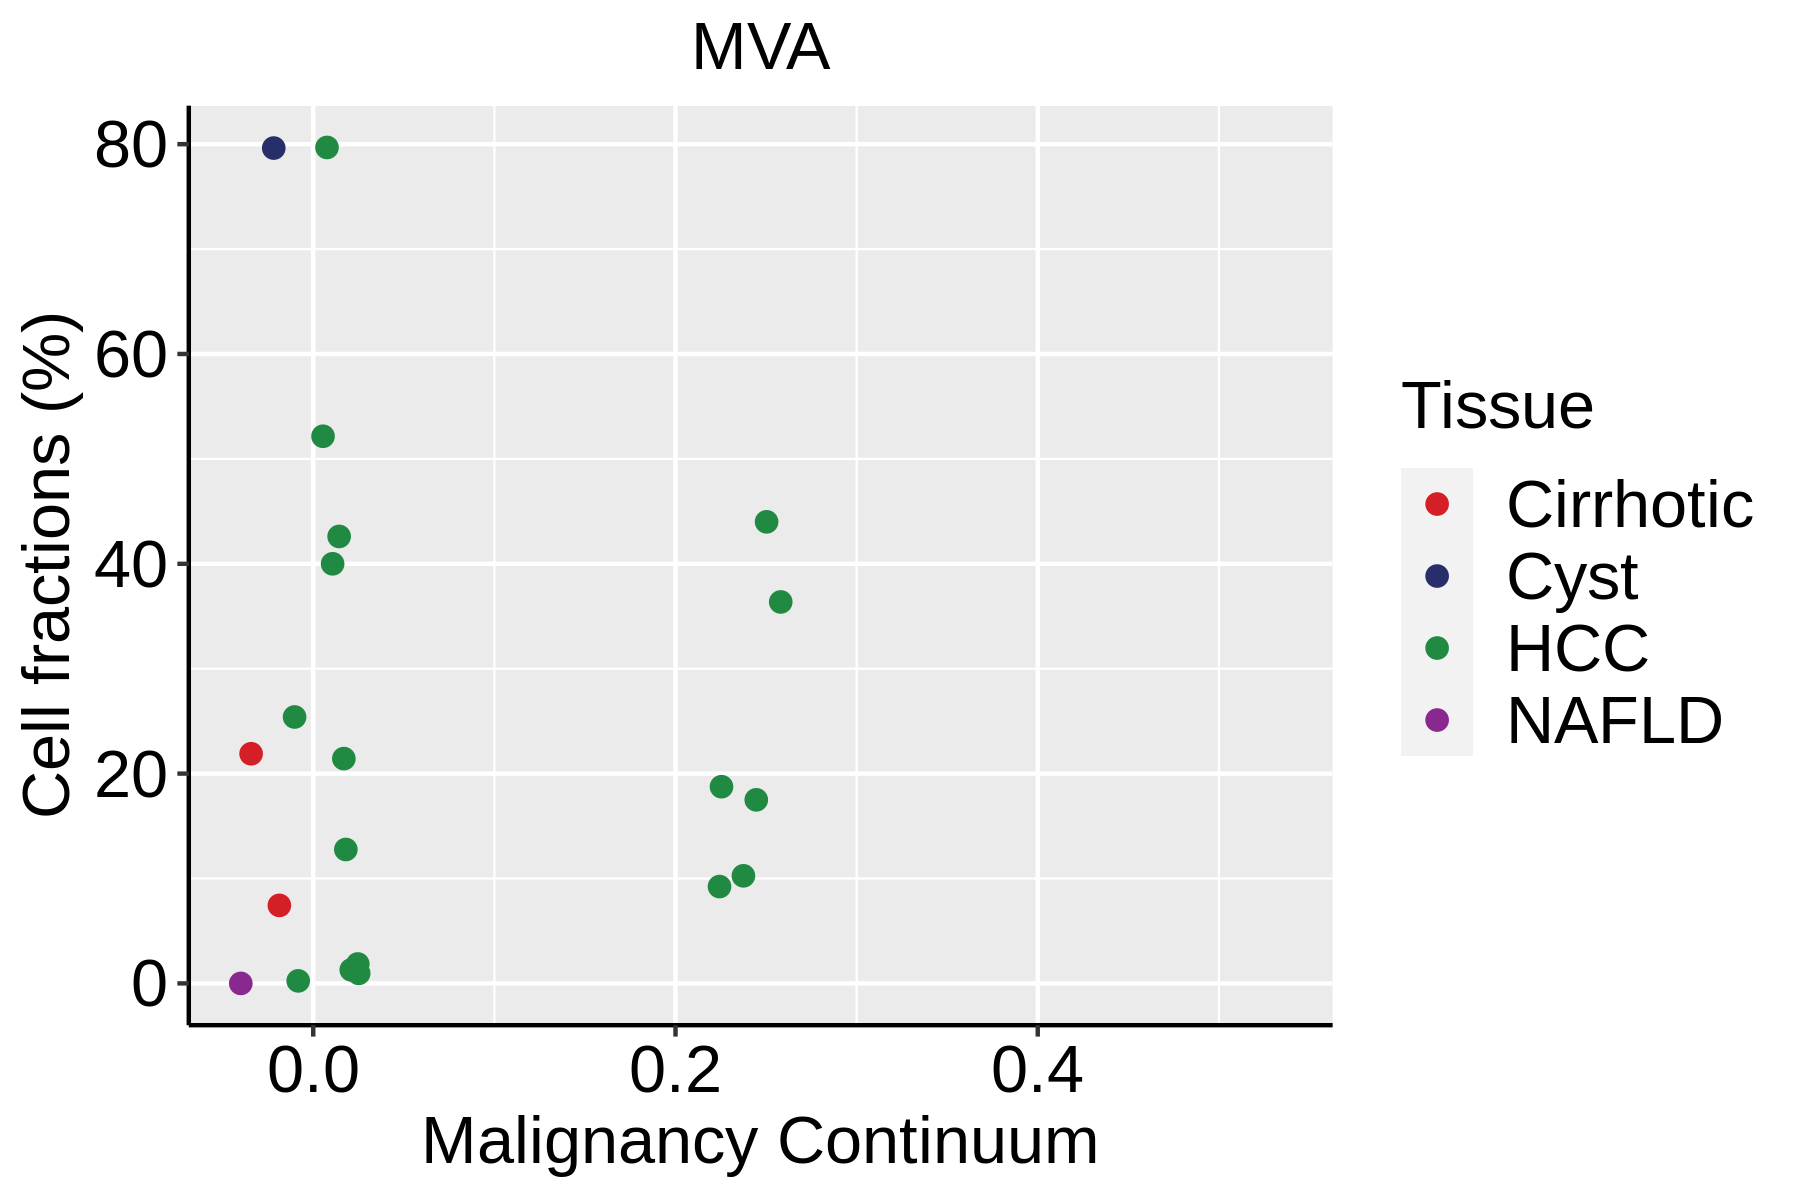
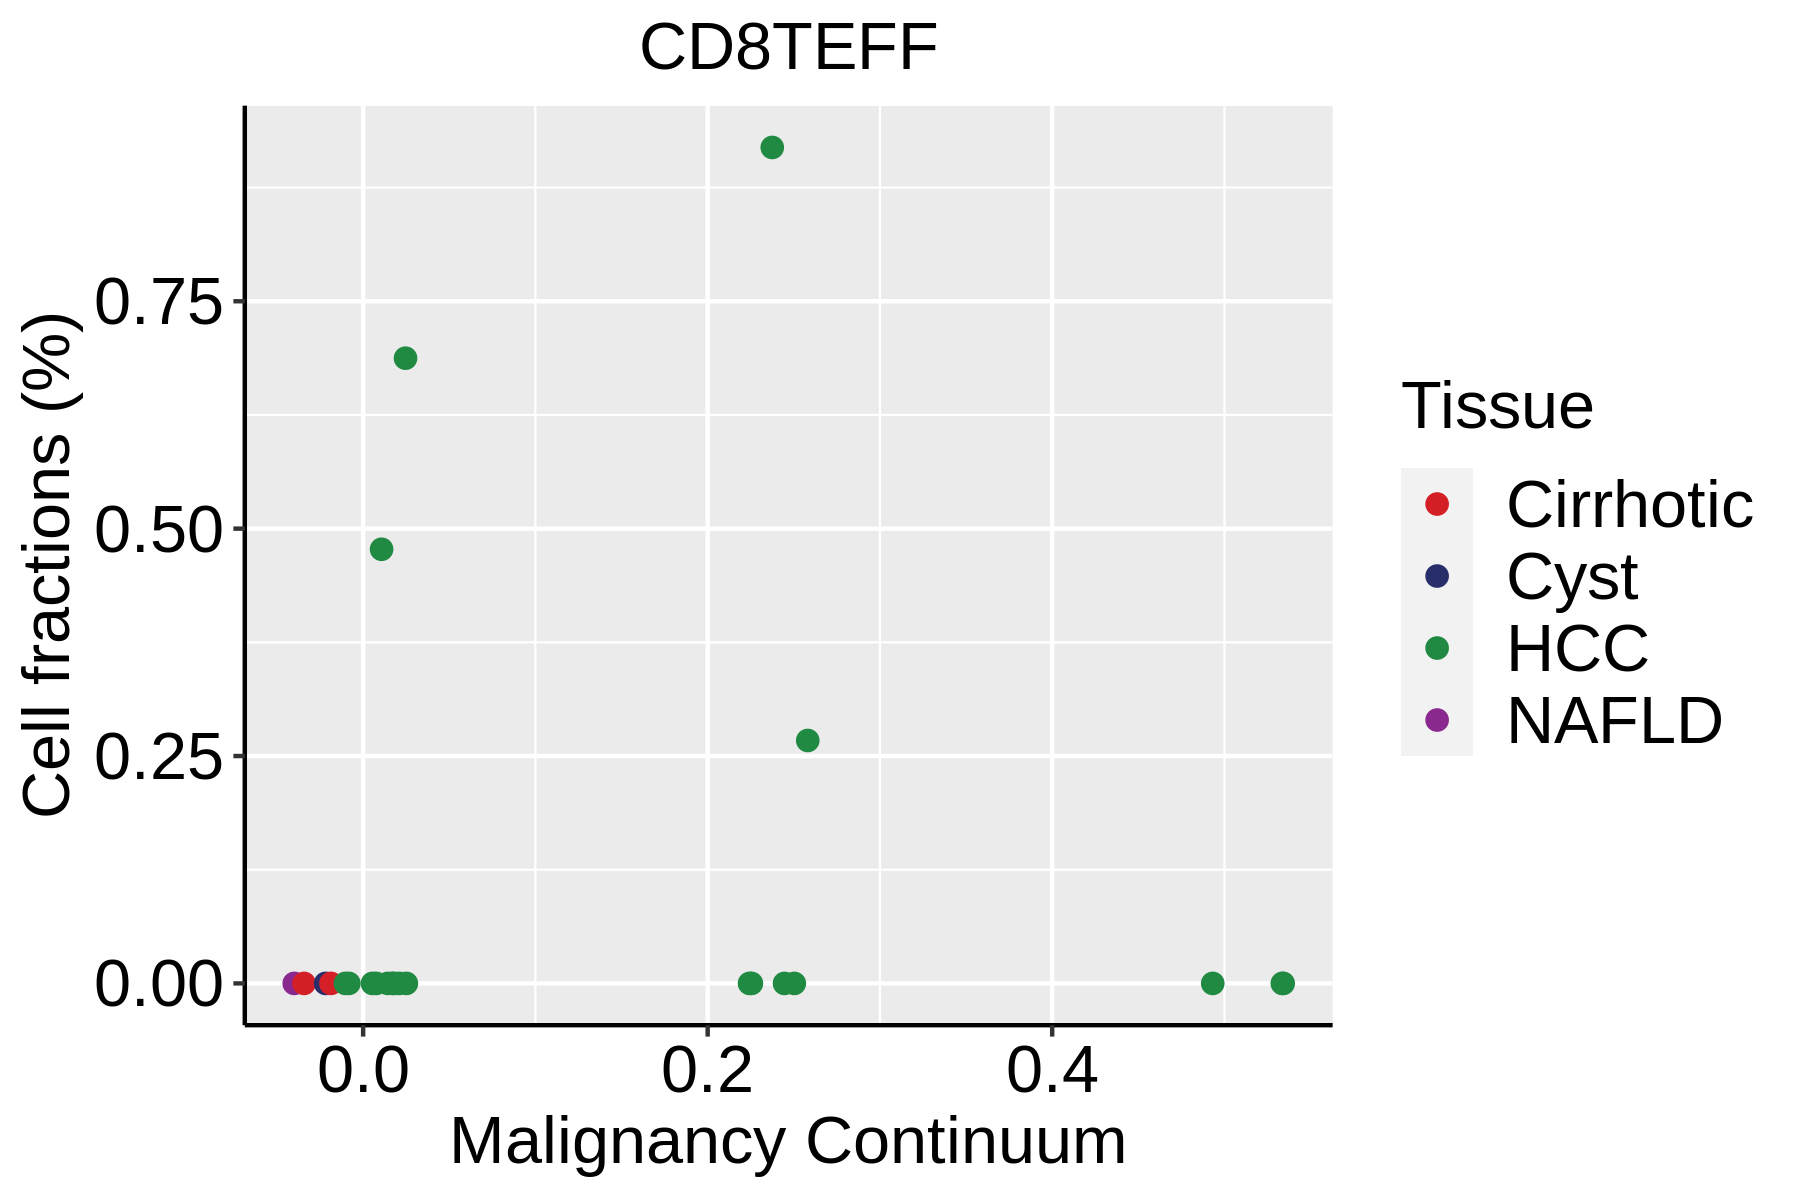
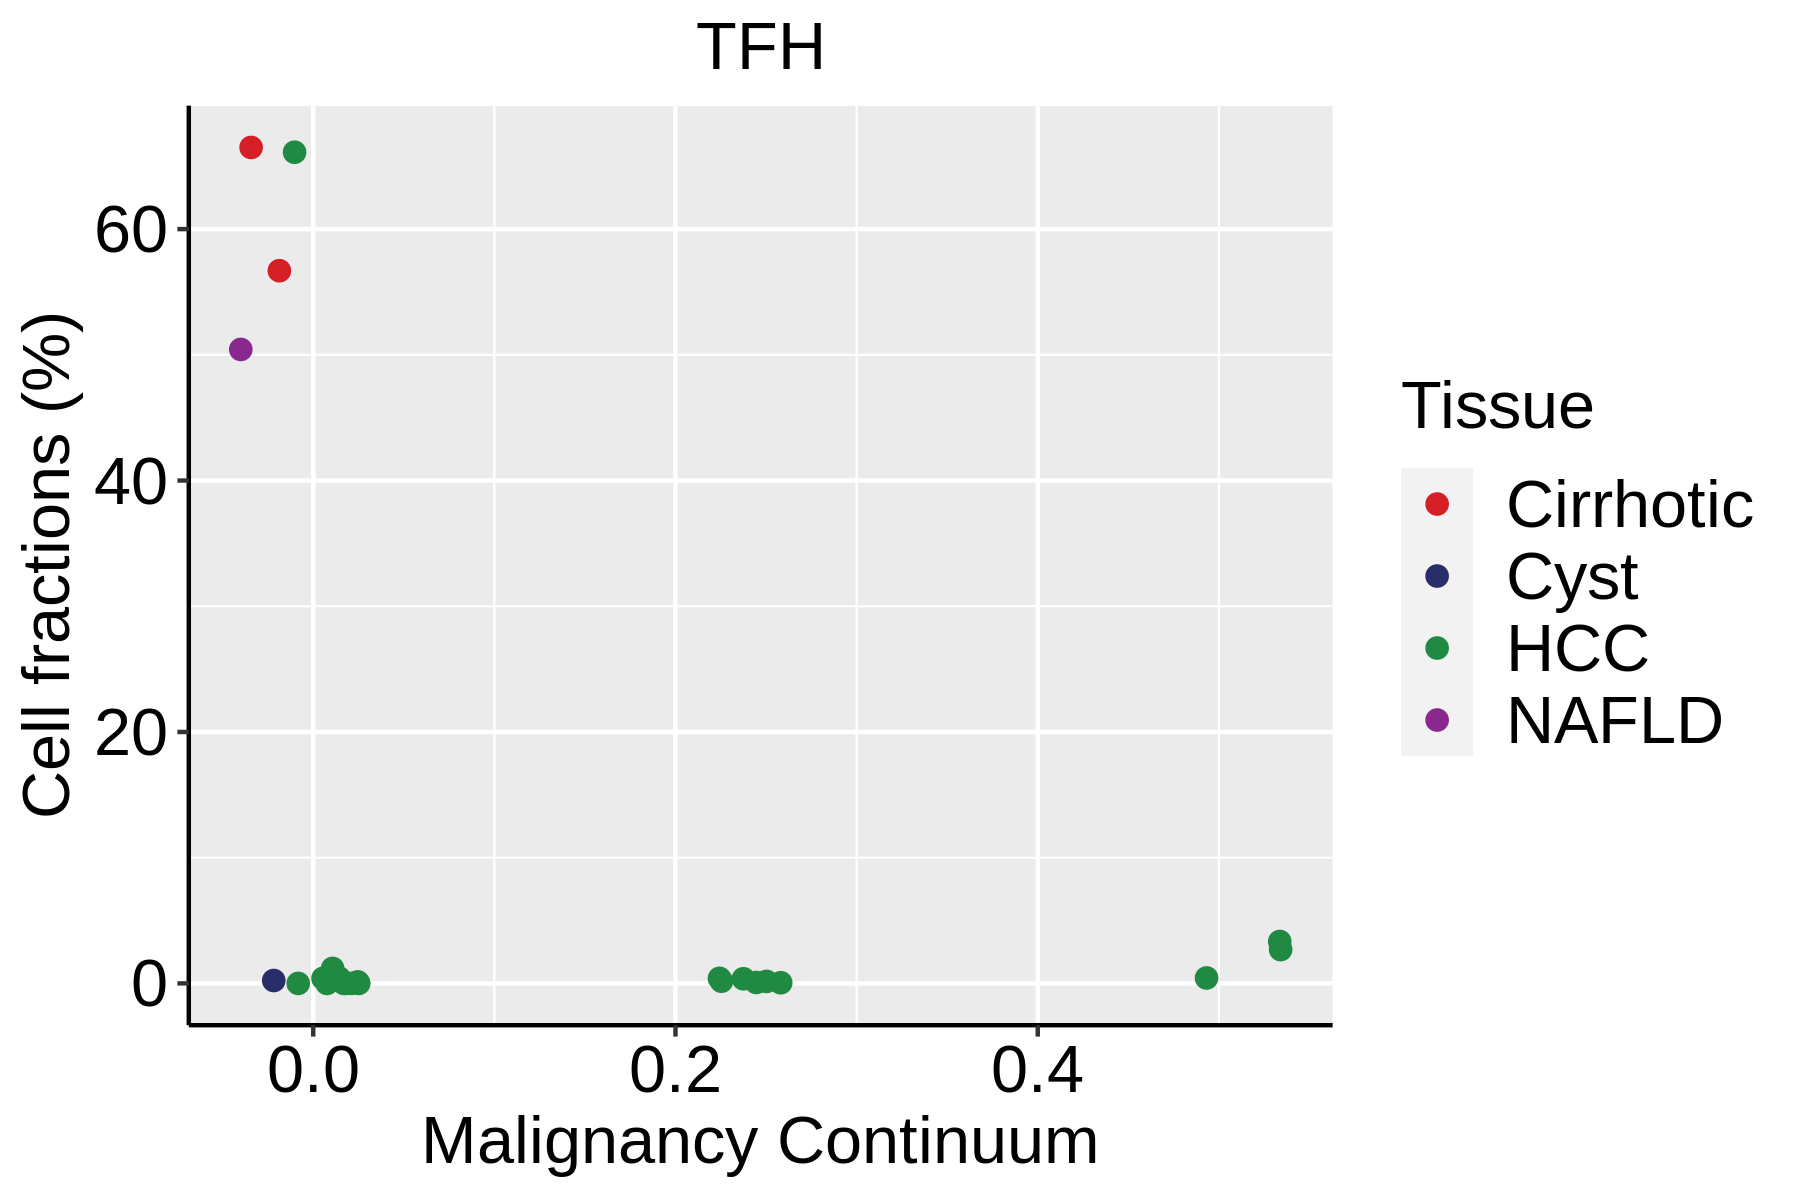
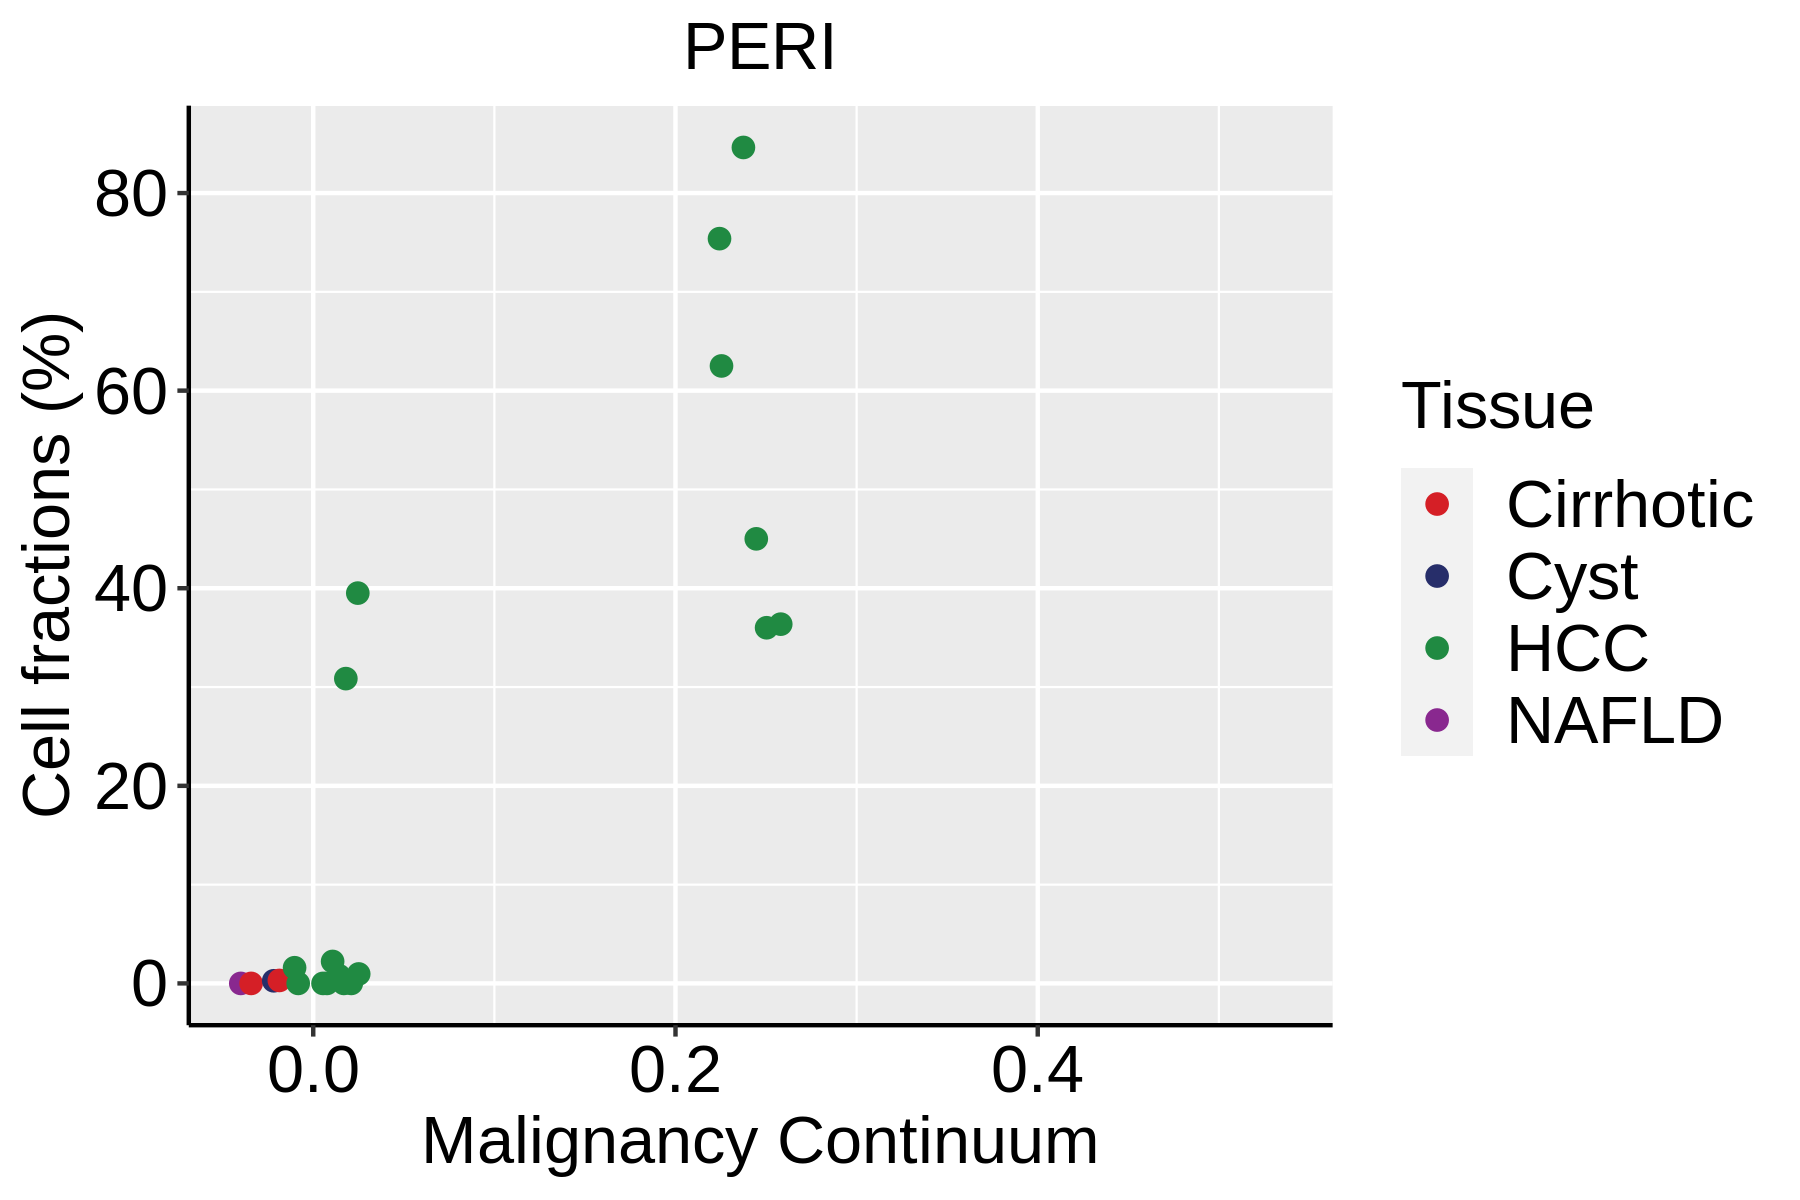
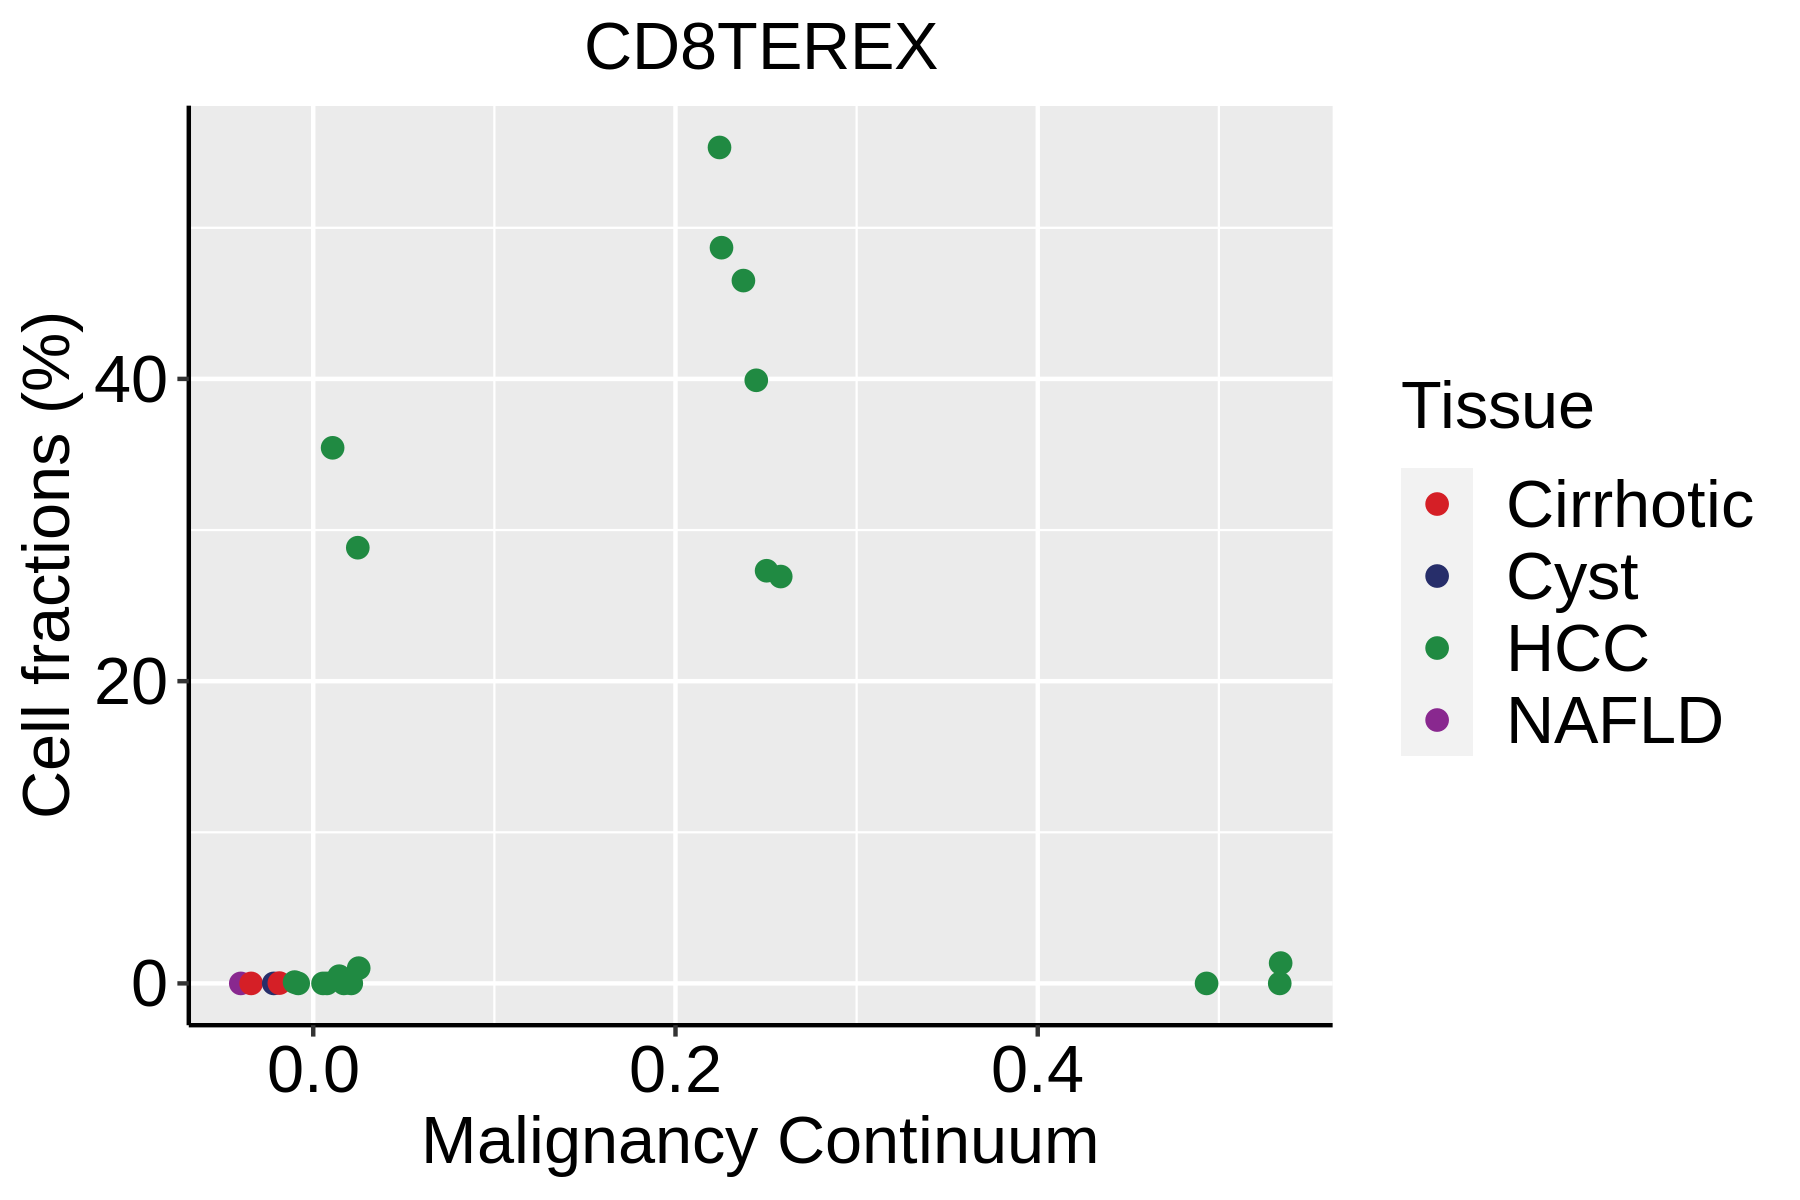
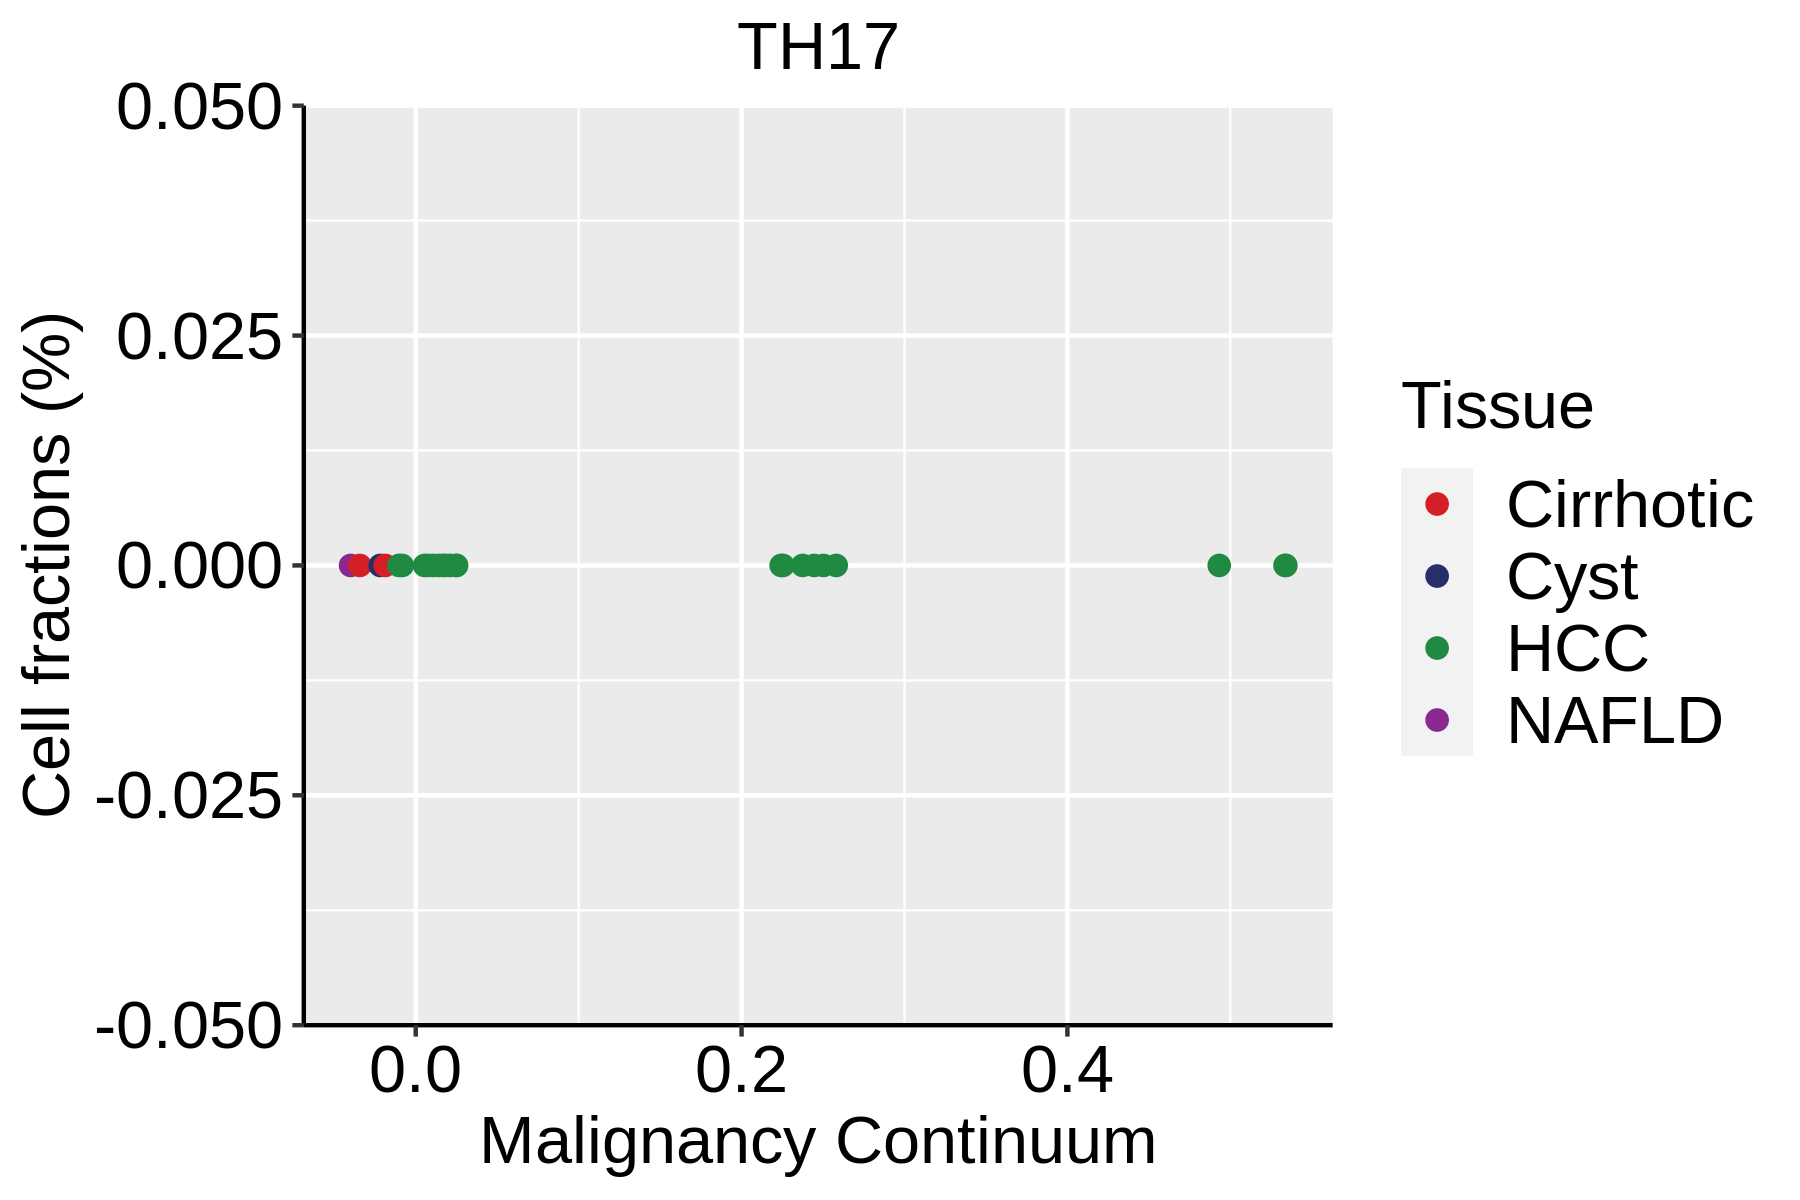
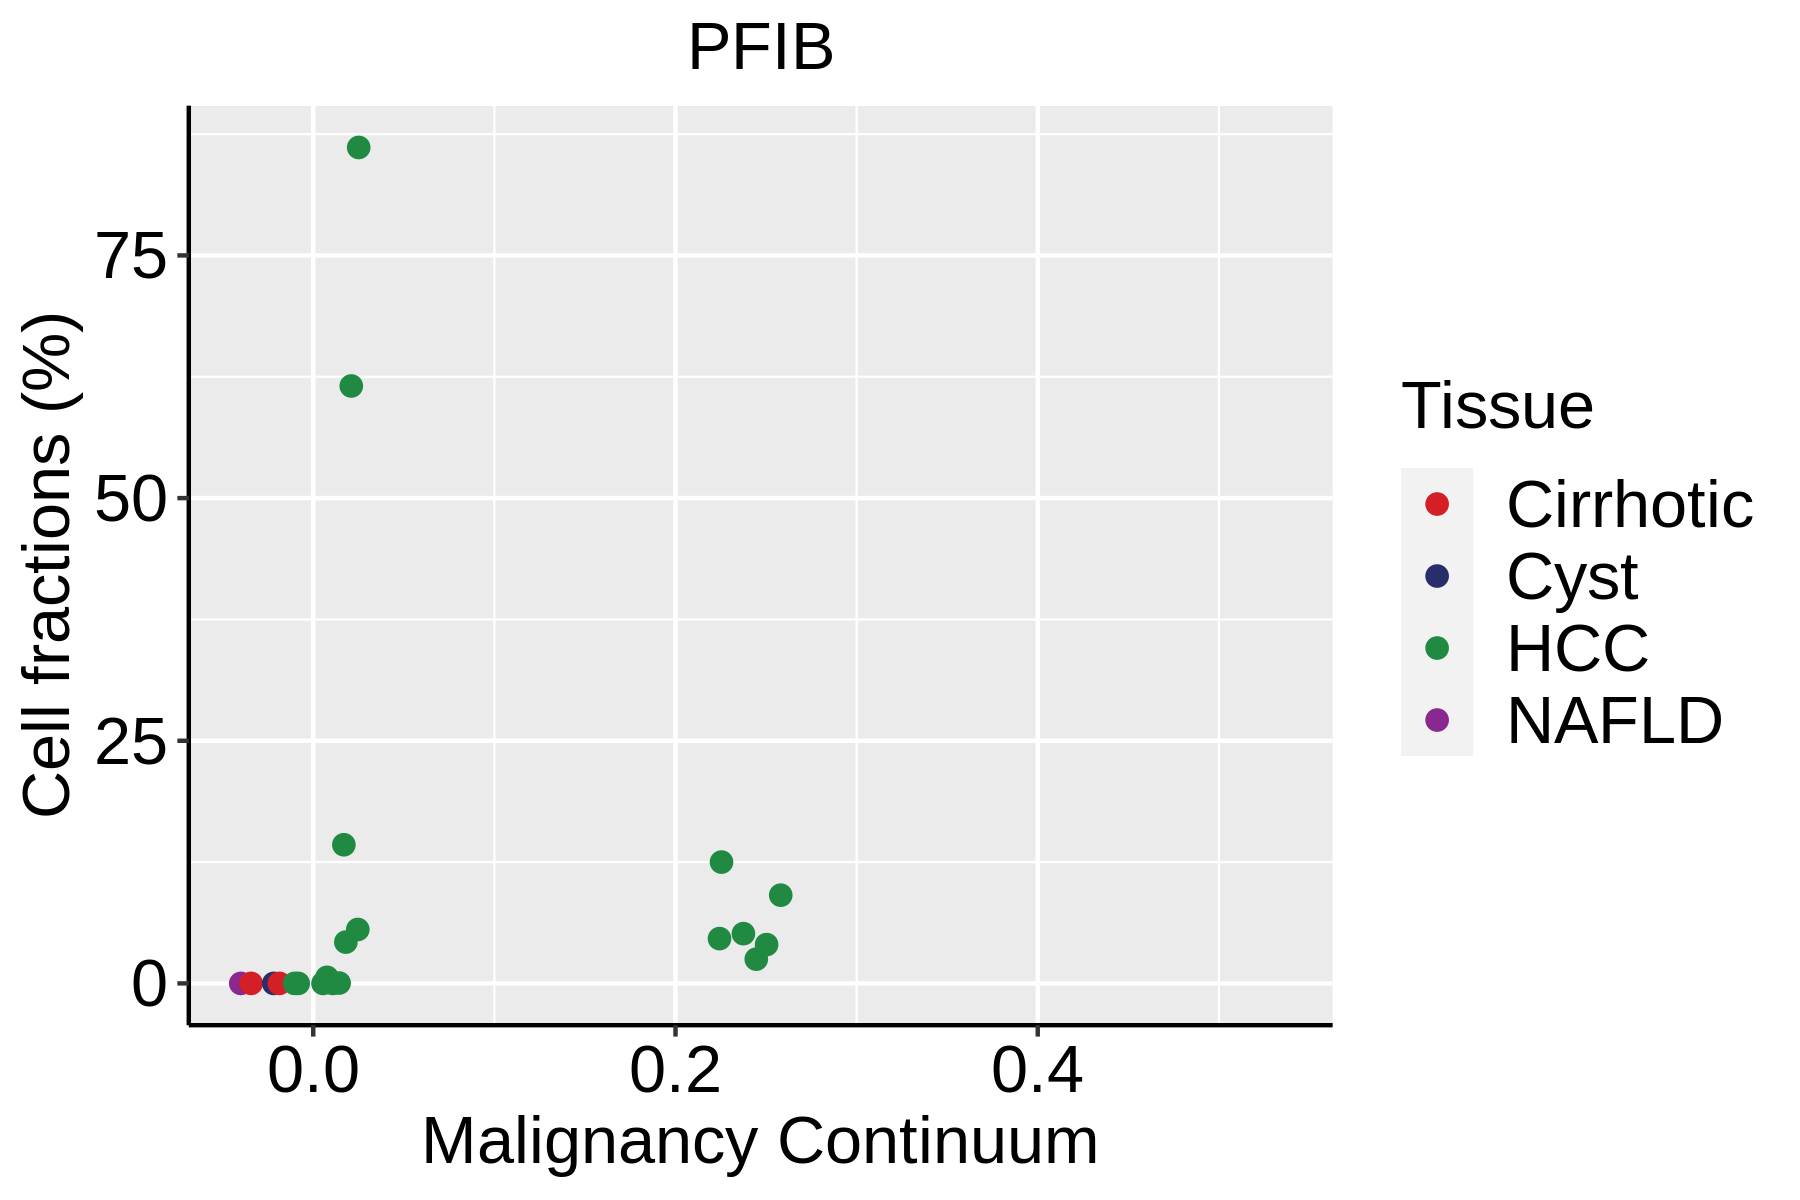
Fraction of cell type in each scRNA-seq sample plotted against position of the sample in the malignancy continuum for all cell types in the selected tissue. Samples are colored based on if they are derived from different Disease States.Fraction of cell type in each scRNA-seq sample plotted against position of the sample in the malignancy continuum for all cell types in the selected tissue. Samples are colored based on if they are derived from different Disease States.Fraction of cell type in each scRNA-seq sample plotted against position of the sample in the malignancy continuum for all cell types in the selected tissue. Samples are colored based on if they are derived from different Disease States.
∗Fraction of cell type in each scRNA-seq sample plotted against position of the sample in the malignancy continuum for all cell types in Liver tissue. Samples are colored based on if they are derived from different Disease States. Cell fractions are computed by dividing the number of cells of a given cell type by the total number of cells in the compartment (epithelial versus immune versus stromal).
Page: 1 2 

Top

Cell lineage trajectory inference

Disease StateEpitheliaImmuneStromal
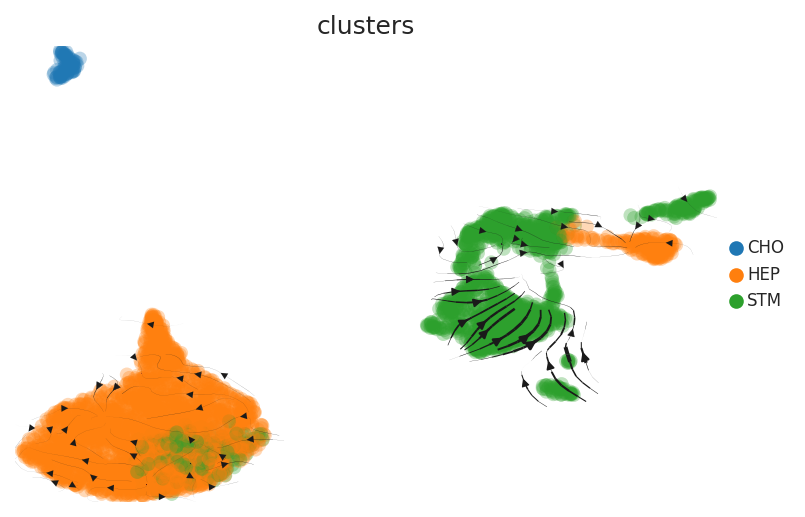
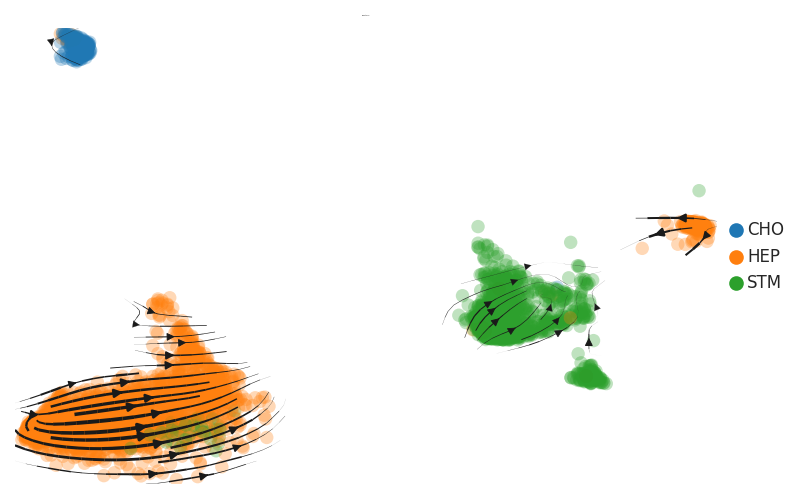
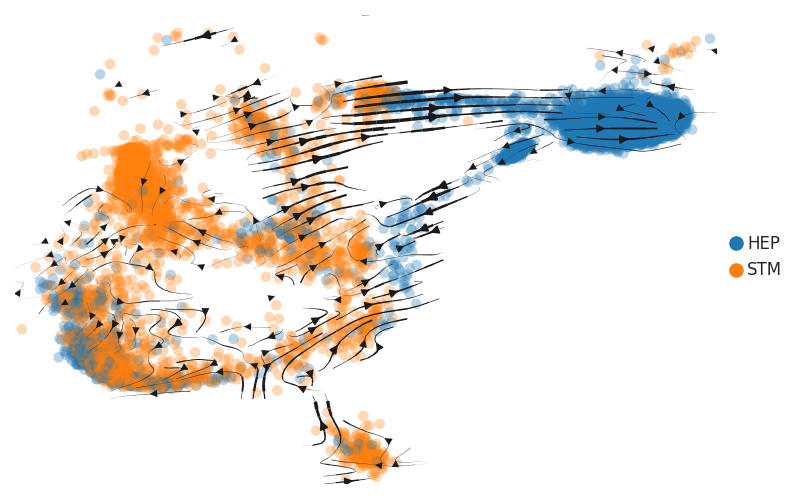
HealthyTrajectory analysis of cells of epithelial compartment in Healthy-derived samples of Liver tissue by using scvelo package in Python.Trajectory analysis of cells of immune compartment in Healthy-derived samples of Liver tissue by using scvelo package in Python.Trajectory analysis of cells of stromal compartment in Healthy-derived samples of Liver tissue by using scvelo package in Python.
PrecancerTrajectory analysis of cells of epithelial compartment in Precancer-derived samples of Liver tissue by using scvelo package in Python.Trajectory analysis of cells of immune compartment in Precancer-derived samples of Liver tissue by using scvelo package in Python.Trajectory analysis of cells of stromal compartment in Precancer-derived samples of Liver tissue by using scvelo package in Python.
HCCTrajectory analysis of cells of epithelial compartment in HCC-derived samples of Liver tissue by using scvelo package in Python.Trajectory analysis of cells of immune compartment in HCC-derived samples of Liver tissue by using scvelo package in Python.Trajectory analysis of cells of stromal compartment in HCC-derived samples of Liver tissue by using scvelo package in Python.
∗RNA velocity maps for epithelial, immune and stromal compartments of Liver tissue with different disease states.

Top

TF regulatory network analysis

Disease StateEpitheliaImmuneStromal
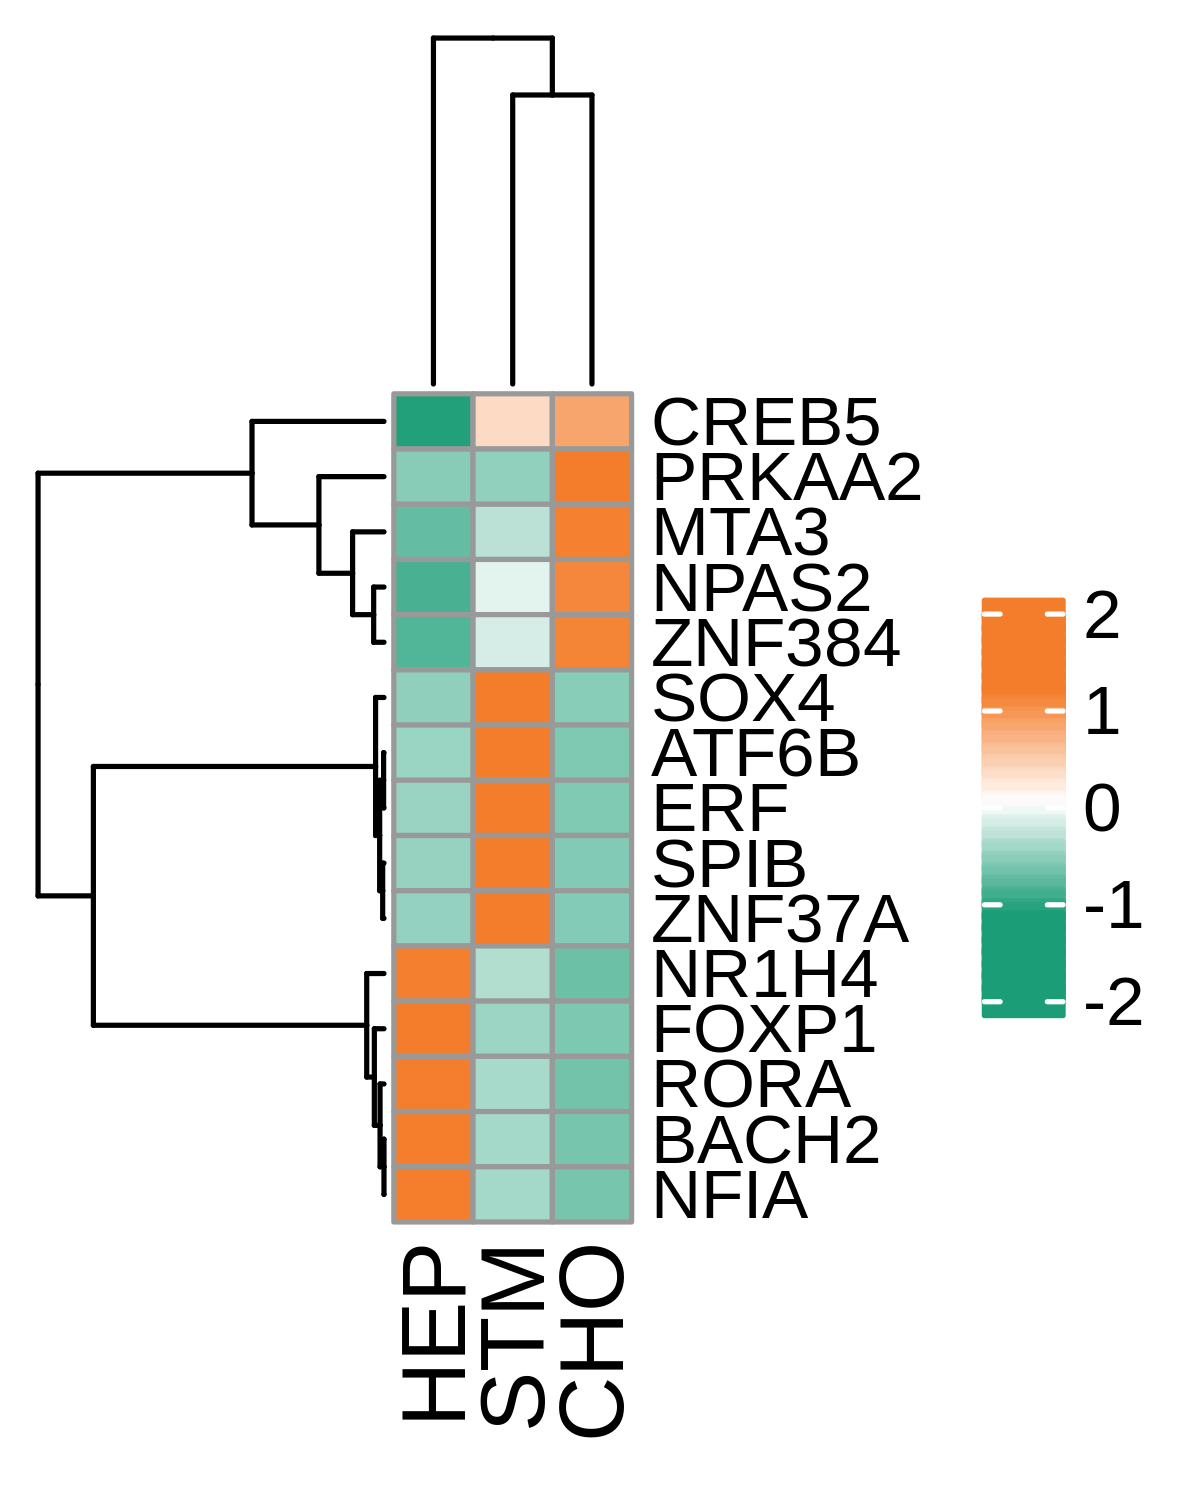
HealthyHeatmap representation of significantly different TFs among all cell types of epithelial compartment in Healthy-derived samples of Liver tissue by comparing their average AUC by using pySCENIC in Python.Heatmap representation of significantly different TFs among all cell types of immune compartment in Healthy-derived samples of Liver tissue by comparing their average AUC by using pySCENIC in Python.Heatmap representation of significantly different TFs among all cell types of stromal compartment in Healthy-derived samples of Liver tissue by comparing their average AUC by using pySCENIC in Python.
TF target networkTF target networkTF target network
PrecancerHeatmap representation of significantly different TFs among all cell types of epithelial compartment in Precancer-derived samples of Liver tissue by comparing their average AUC by using pySCENIC in Python.Heatmap representation of significantly different TFs among all cell types of immune compartment in Precancer-derived samples of Liver tissue by comparing their average AUC by using pySCENIC in Python.Heatmap representation of significantly different TFs among all cell types of stromal compartment in Precancer-derived samples of Liver tissue by comparing their average AUC by using pySCENIC in Python.
TF target networkTF target networkTF target network
HCCHeatmap representation of significantly different TFs among all cell types of epithelial compartment in HCC-derived samples of Liver tissue by comparing their average AUC by using pySCENIC in Python.Heatmap representation of significantly different TFs among all cell types of immune compartment in HCC-derived samples of Liver tissue by comparing their average AUC by using pySCENIC in Python.Heatmap representation of significantly different TFs among all cell types of stromal compartment in HCC-derived samples of Liver tissue by comparing their average AUC by using pySCENIC in Python.
TF target networkTF target networkTF target network
∗Heatmap: Heatmap representation of significantly different TFs among all cell types of epithelial compartment in Healthy-derived samples of Liver tissue by comparing their average AUC by using pySCENIC in Python. Regulon specific score for each cell type is colored.
∗Network: TF target network created from Healthy-derived samples of Liver tissue using Top 50 predicted target genes of each regulon. Edge lengths are the inferred TF-target weightings.

Top

Cell-cell interaction analysis

Disease StateCell TypeCircleSourceTarget
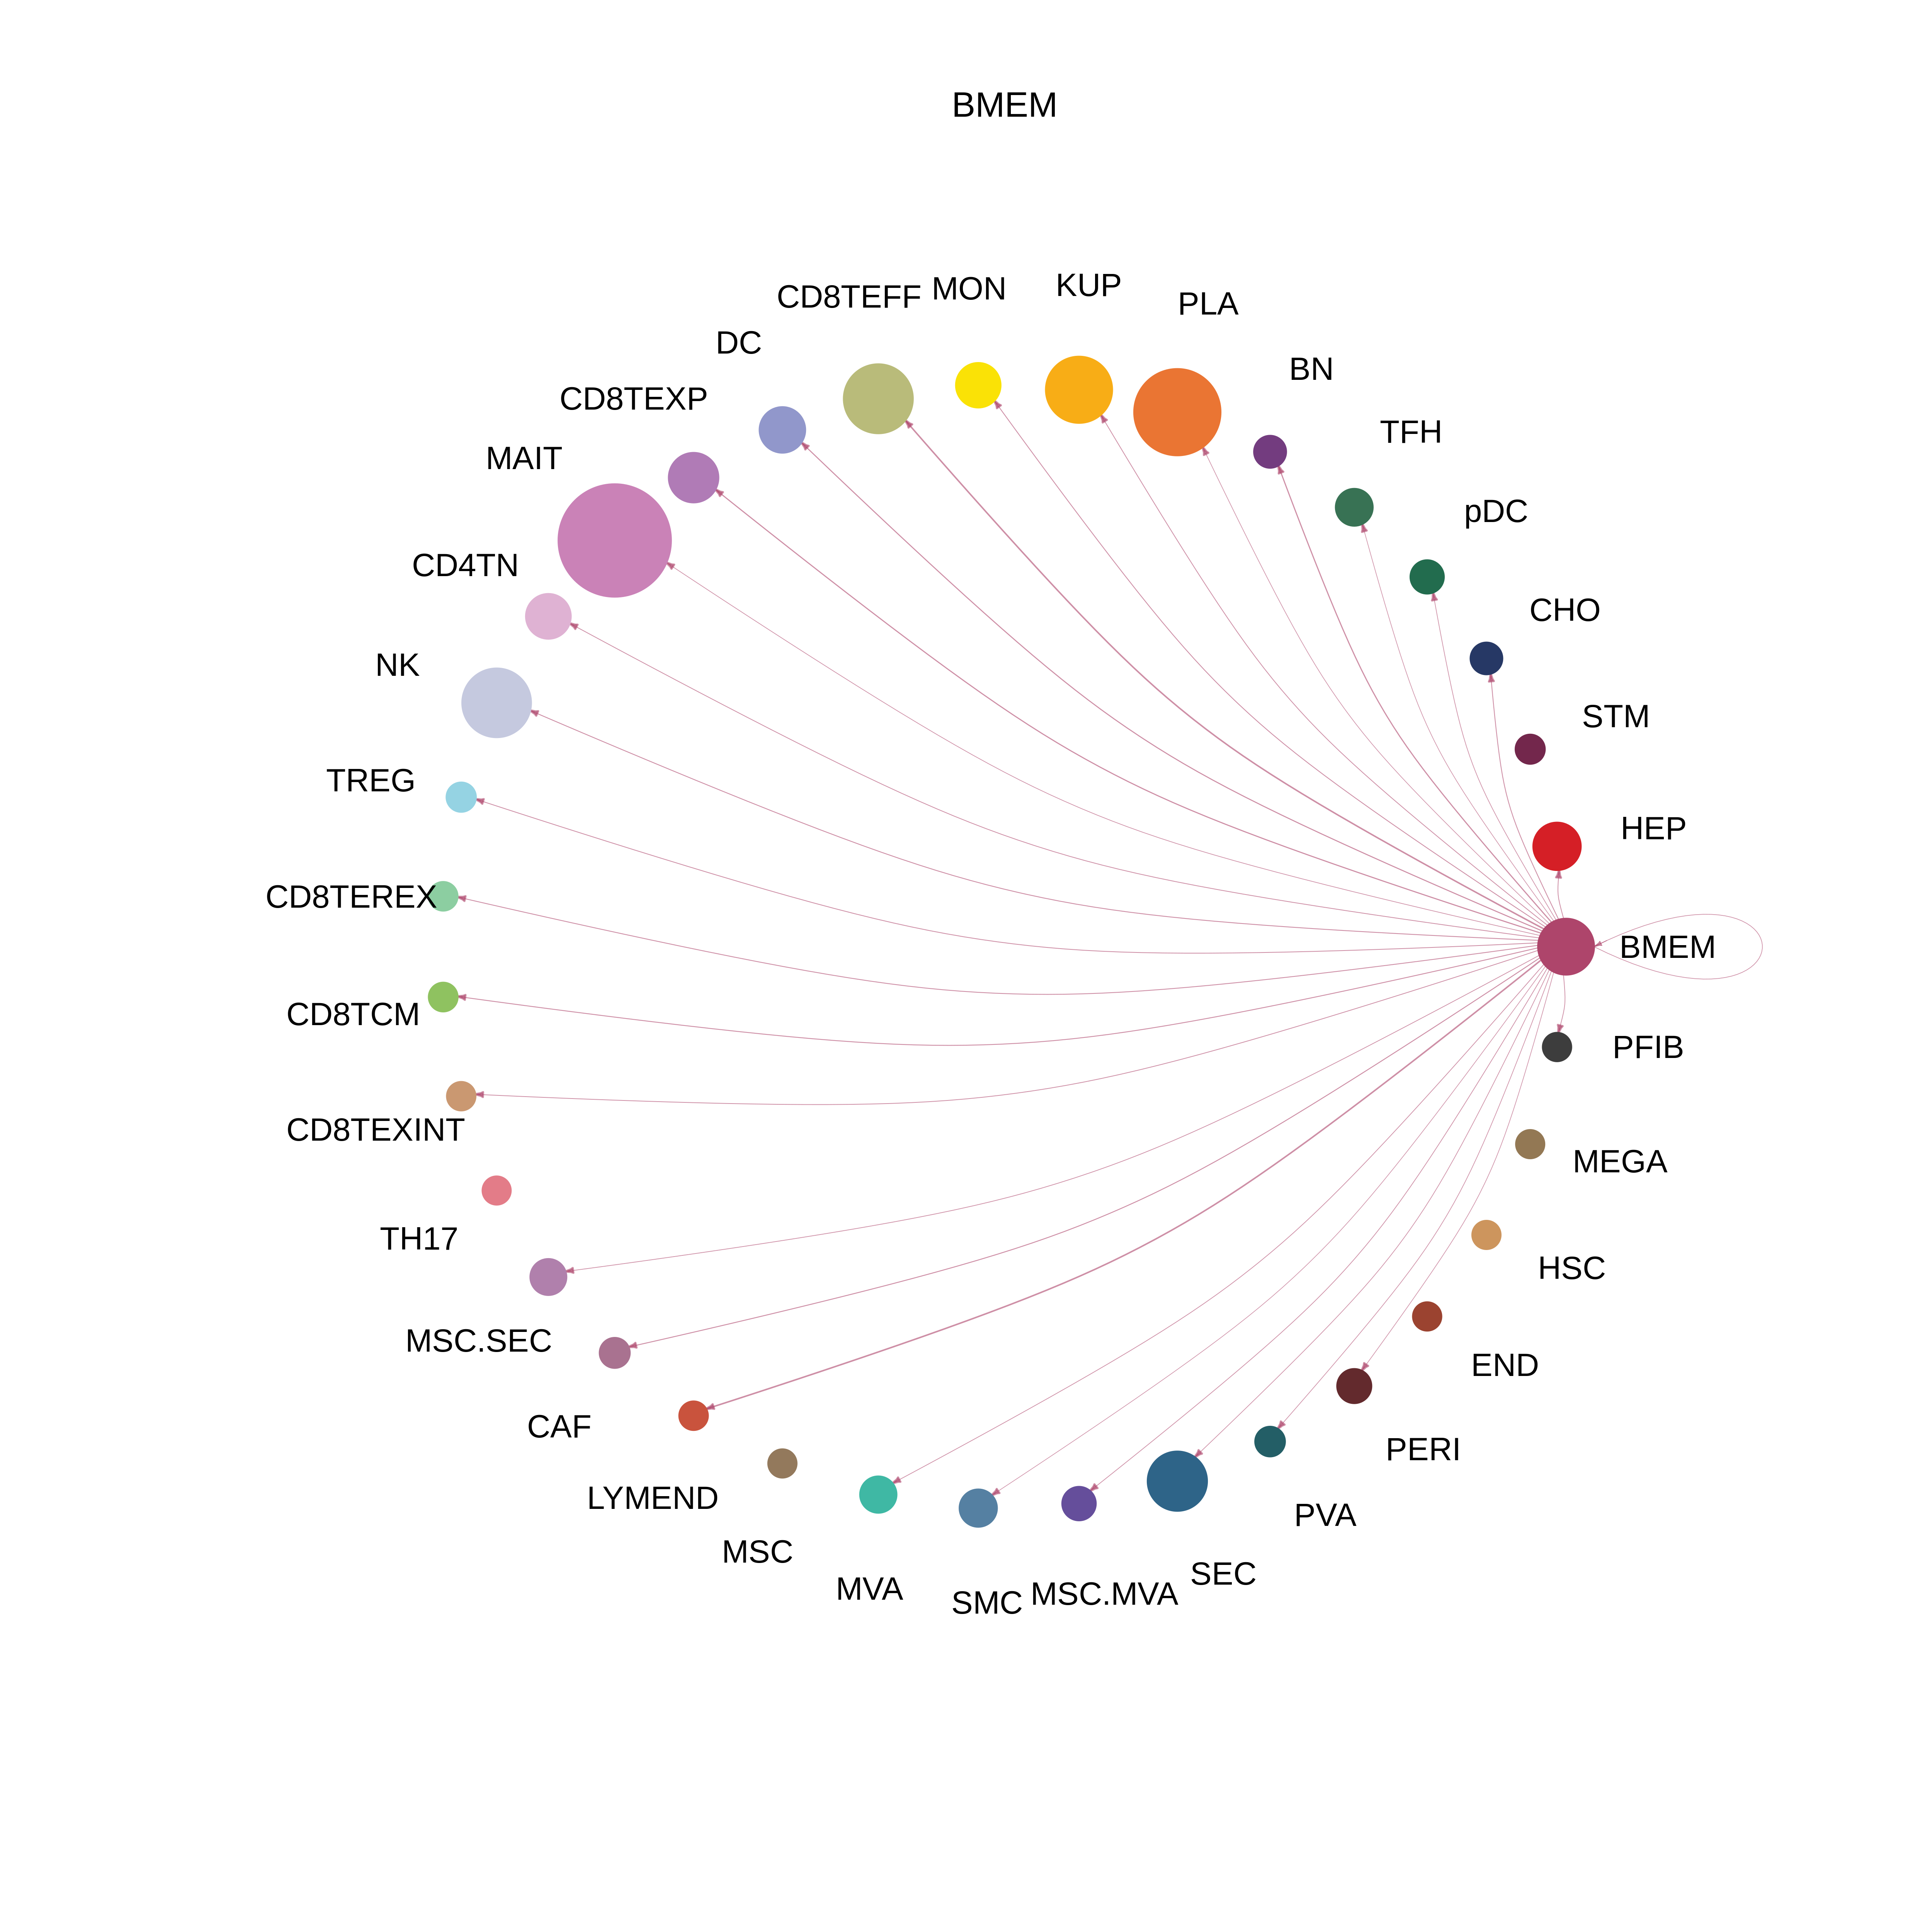
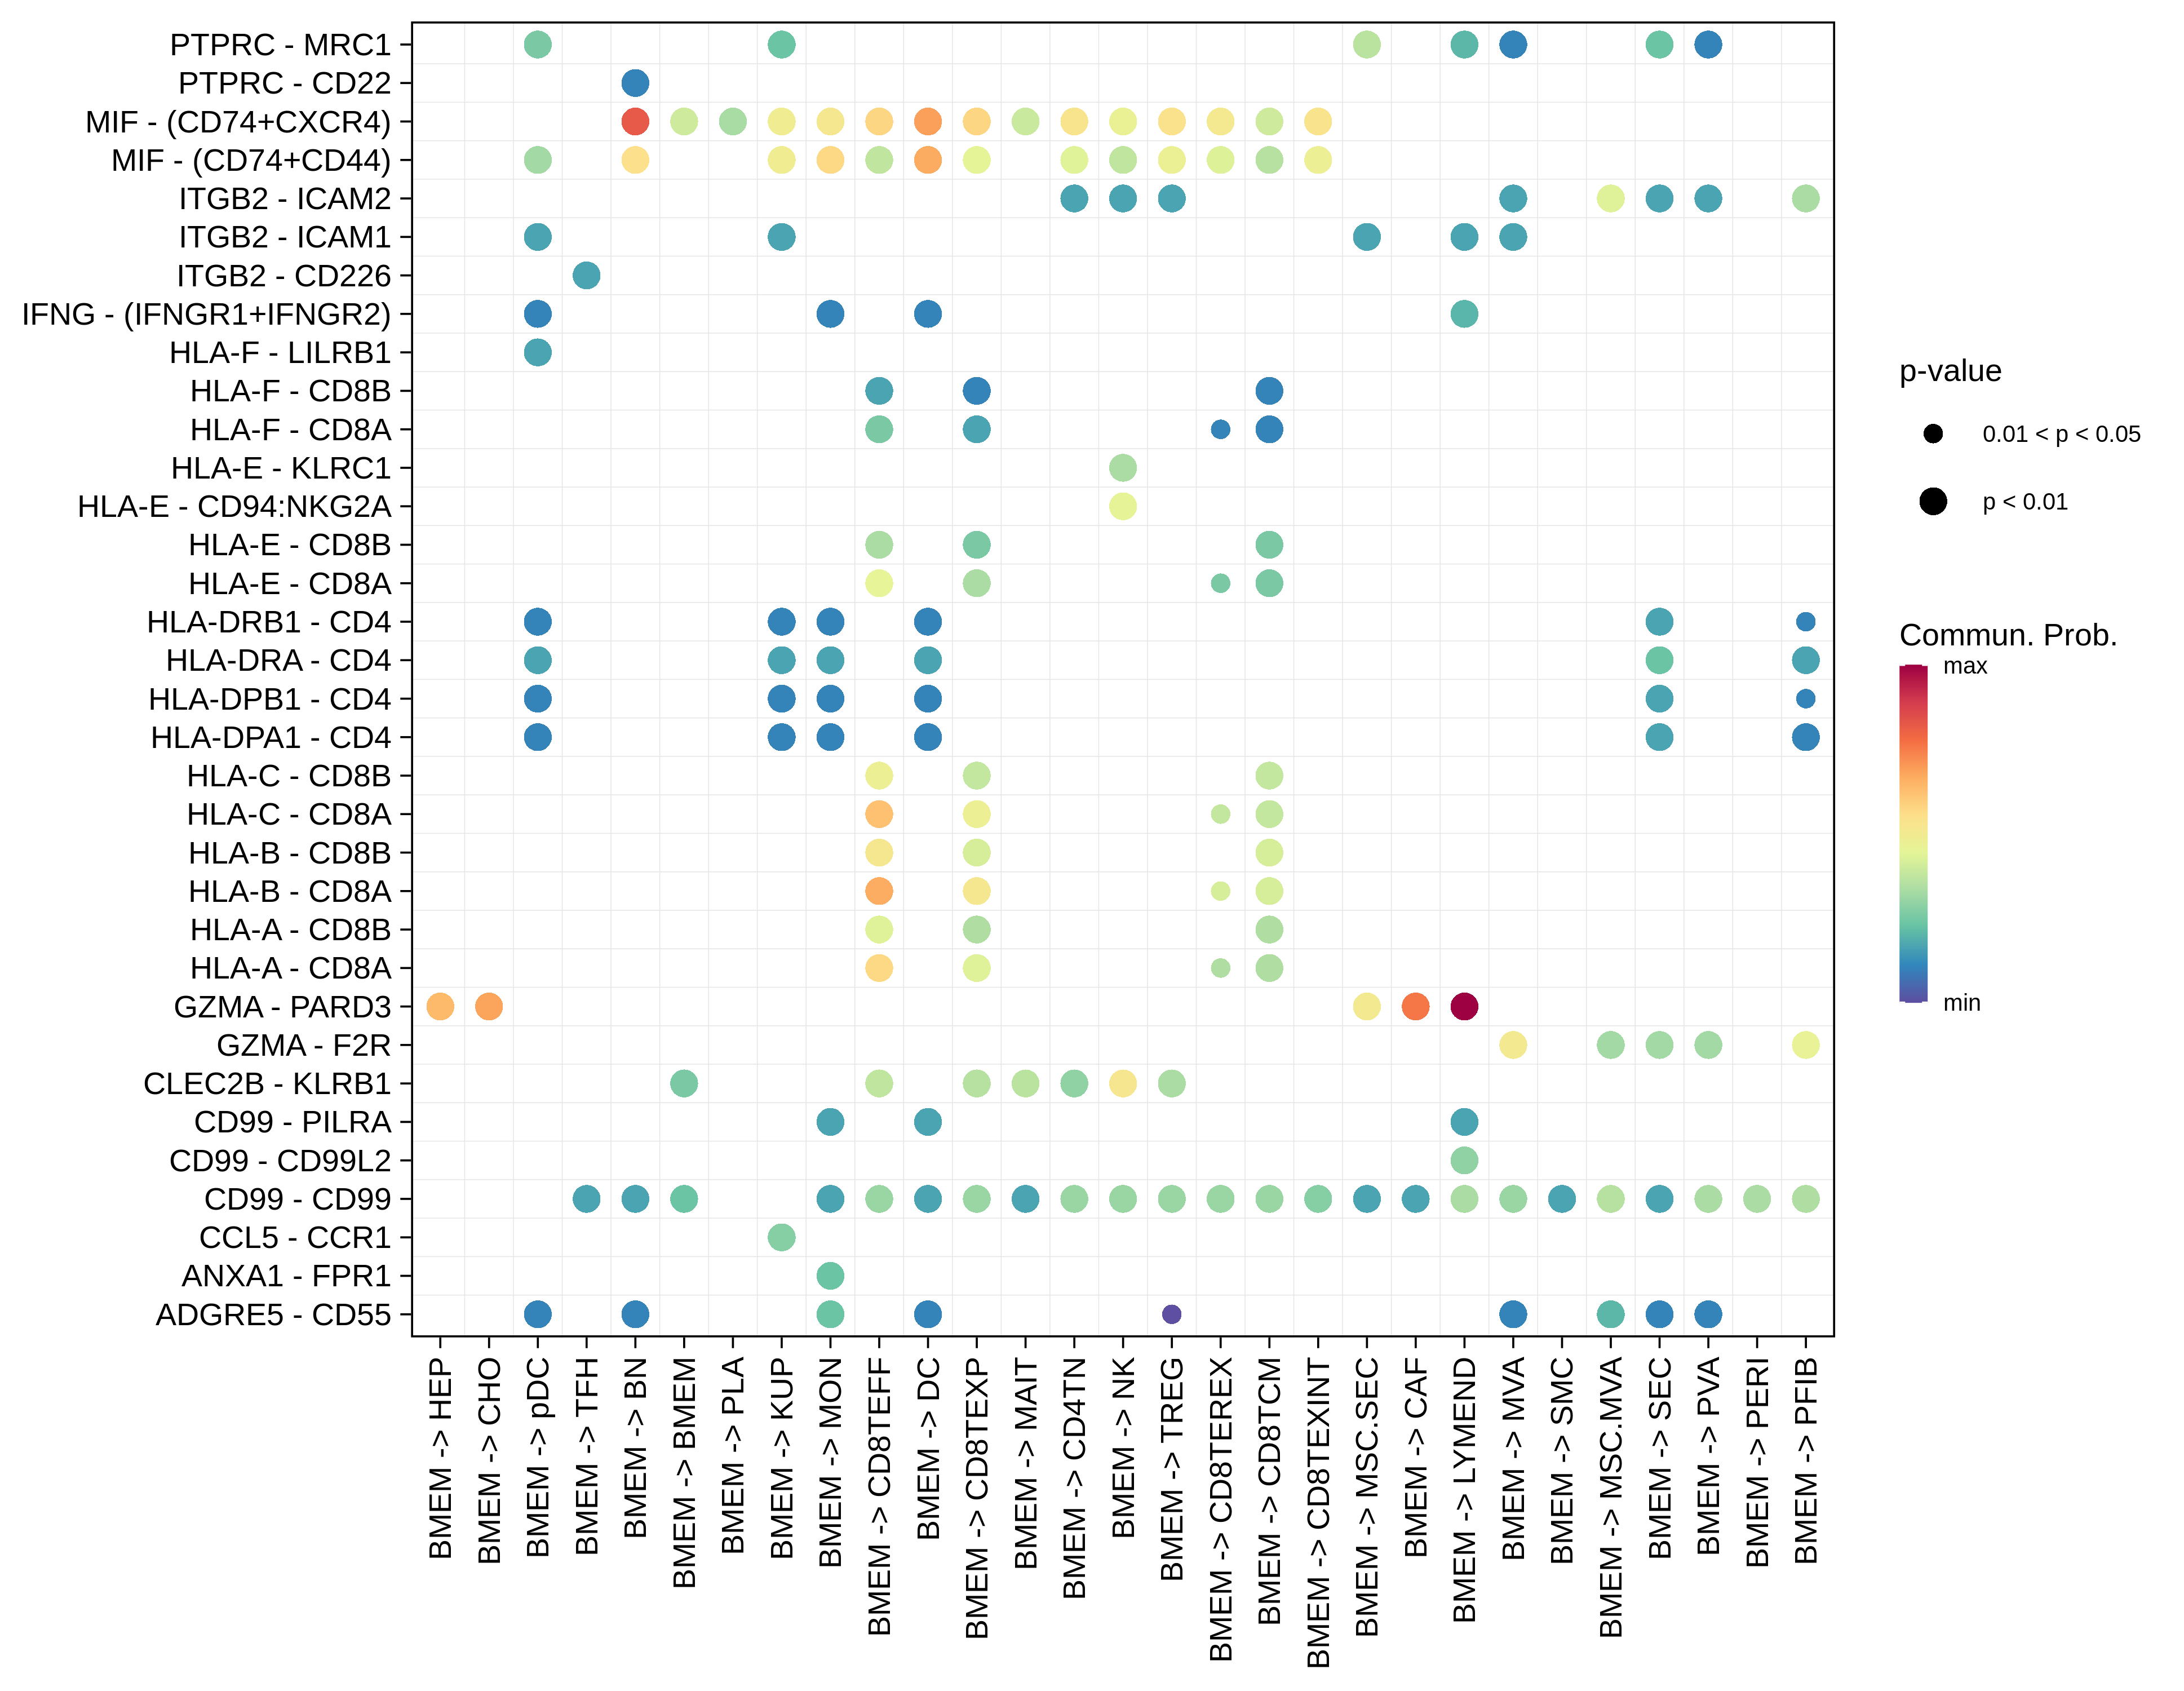
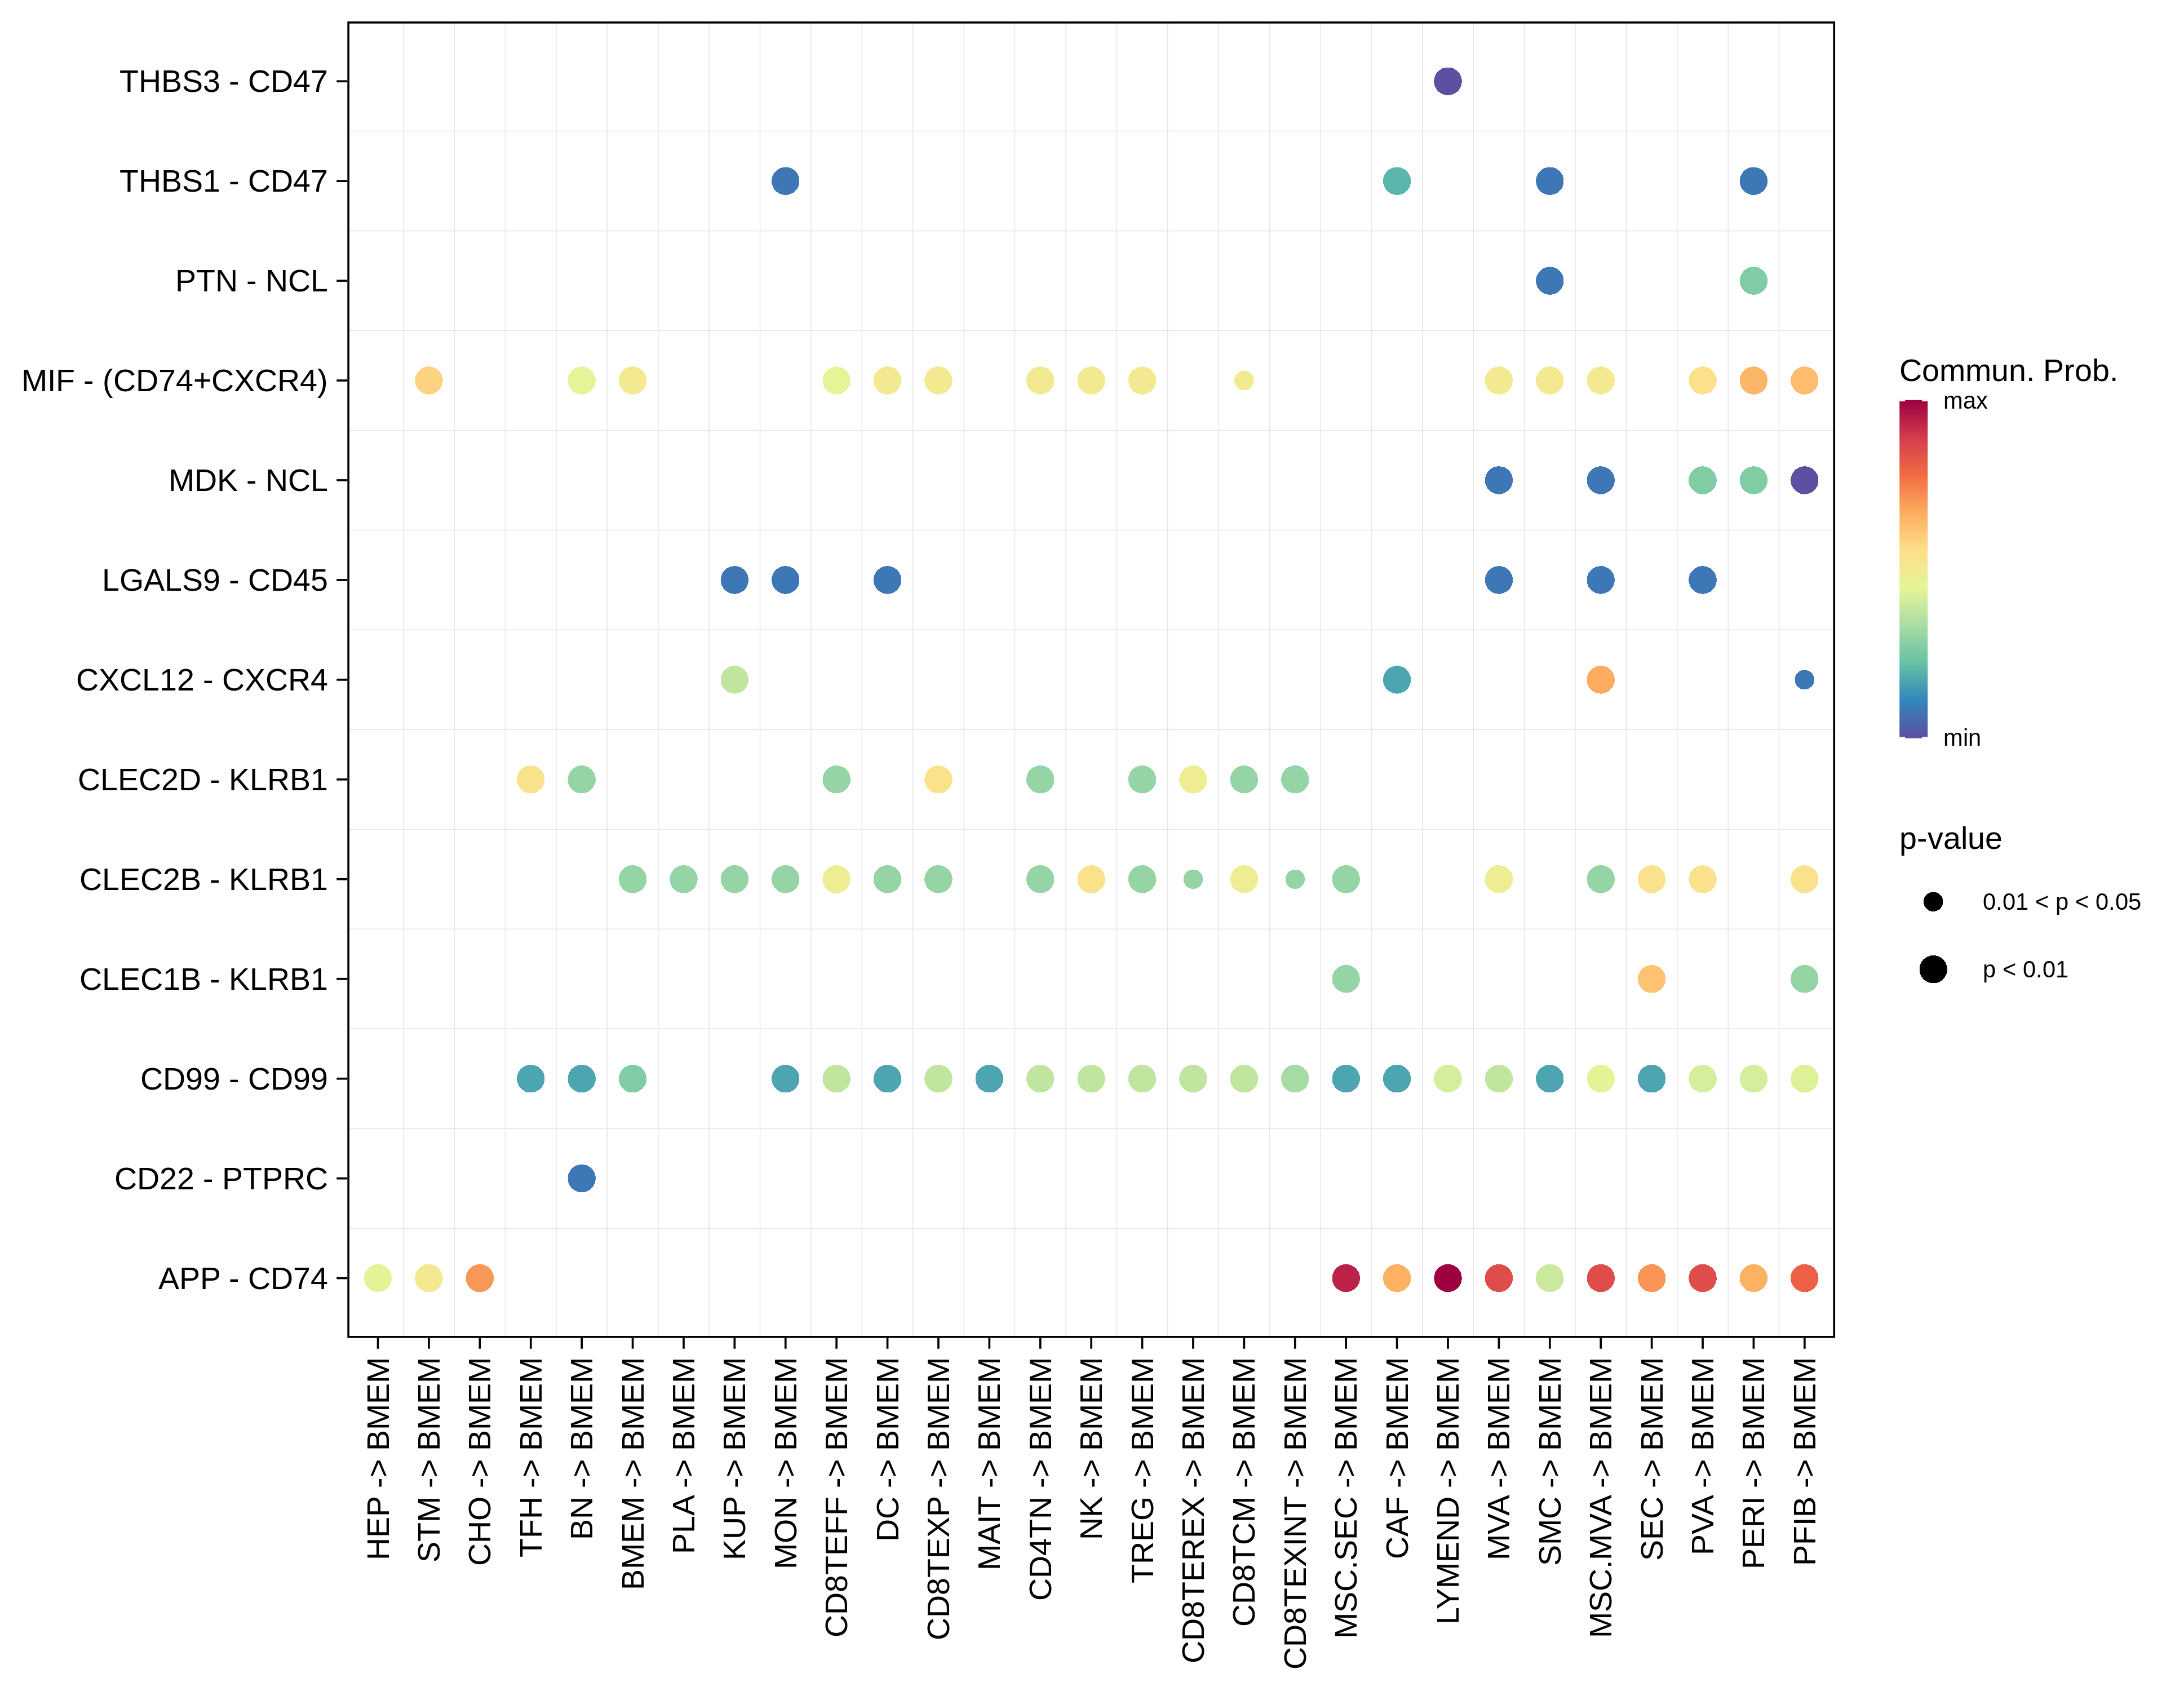
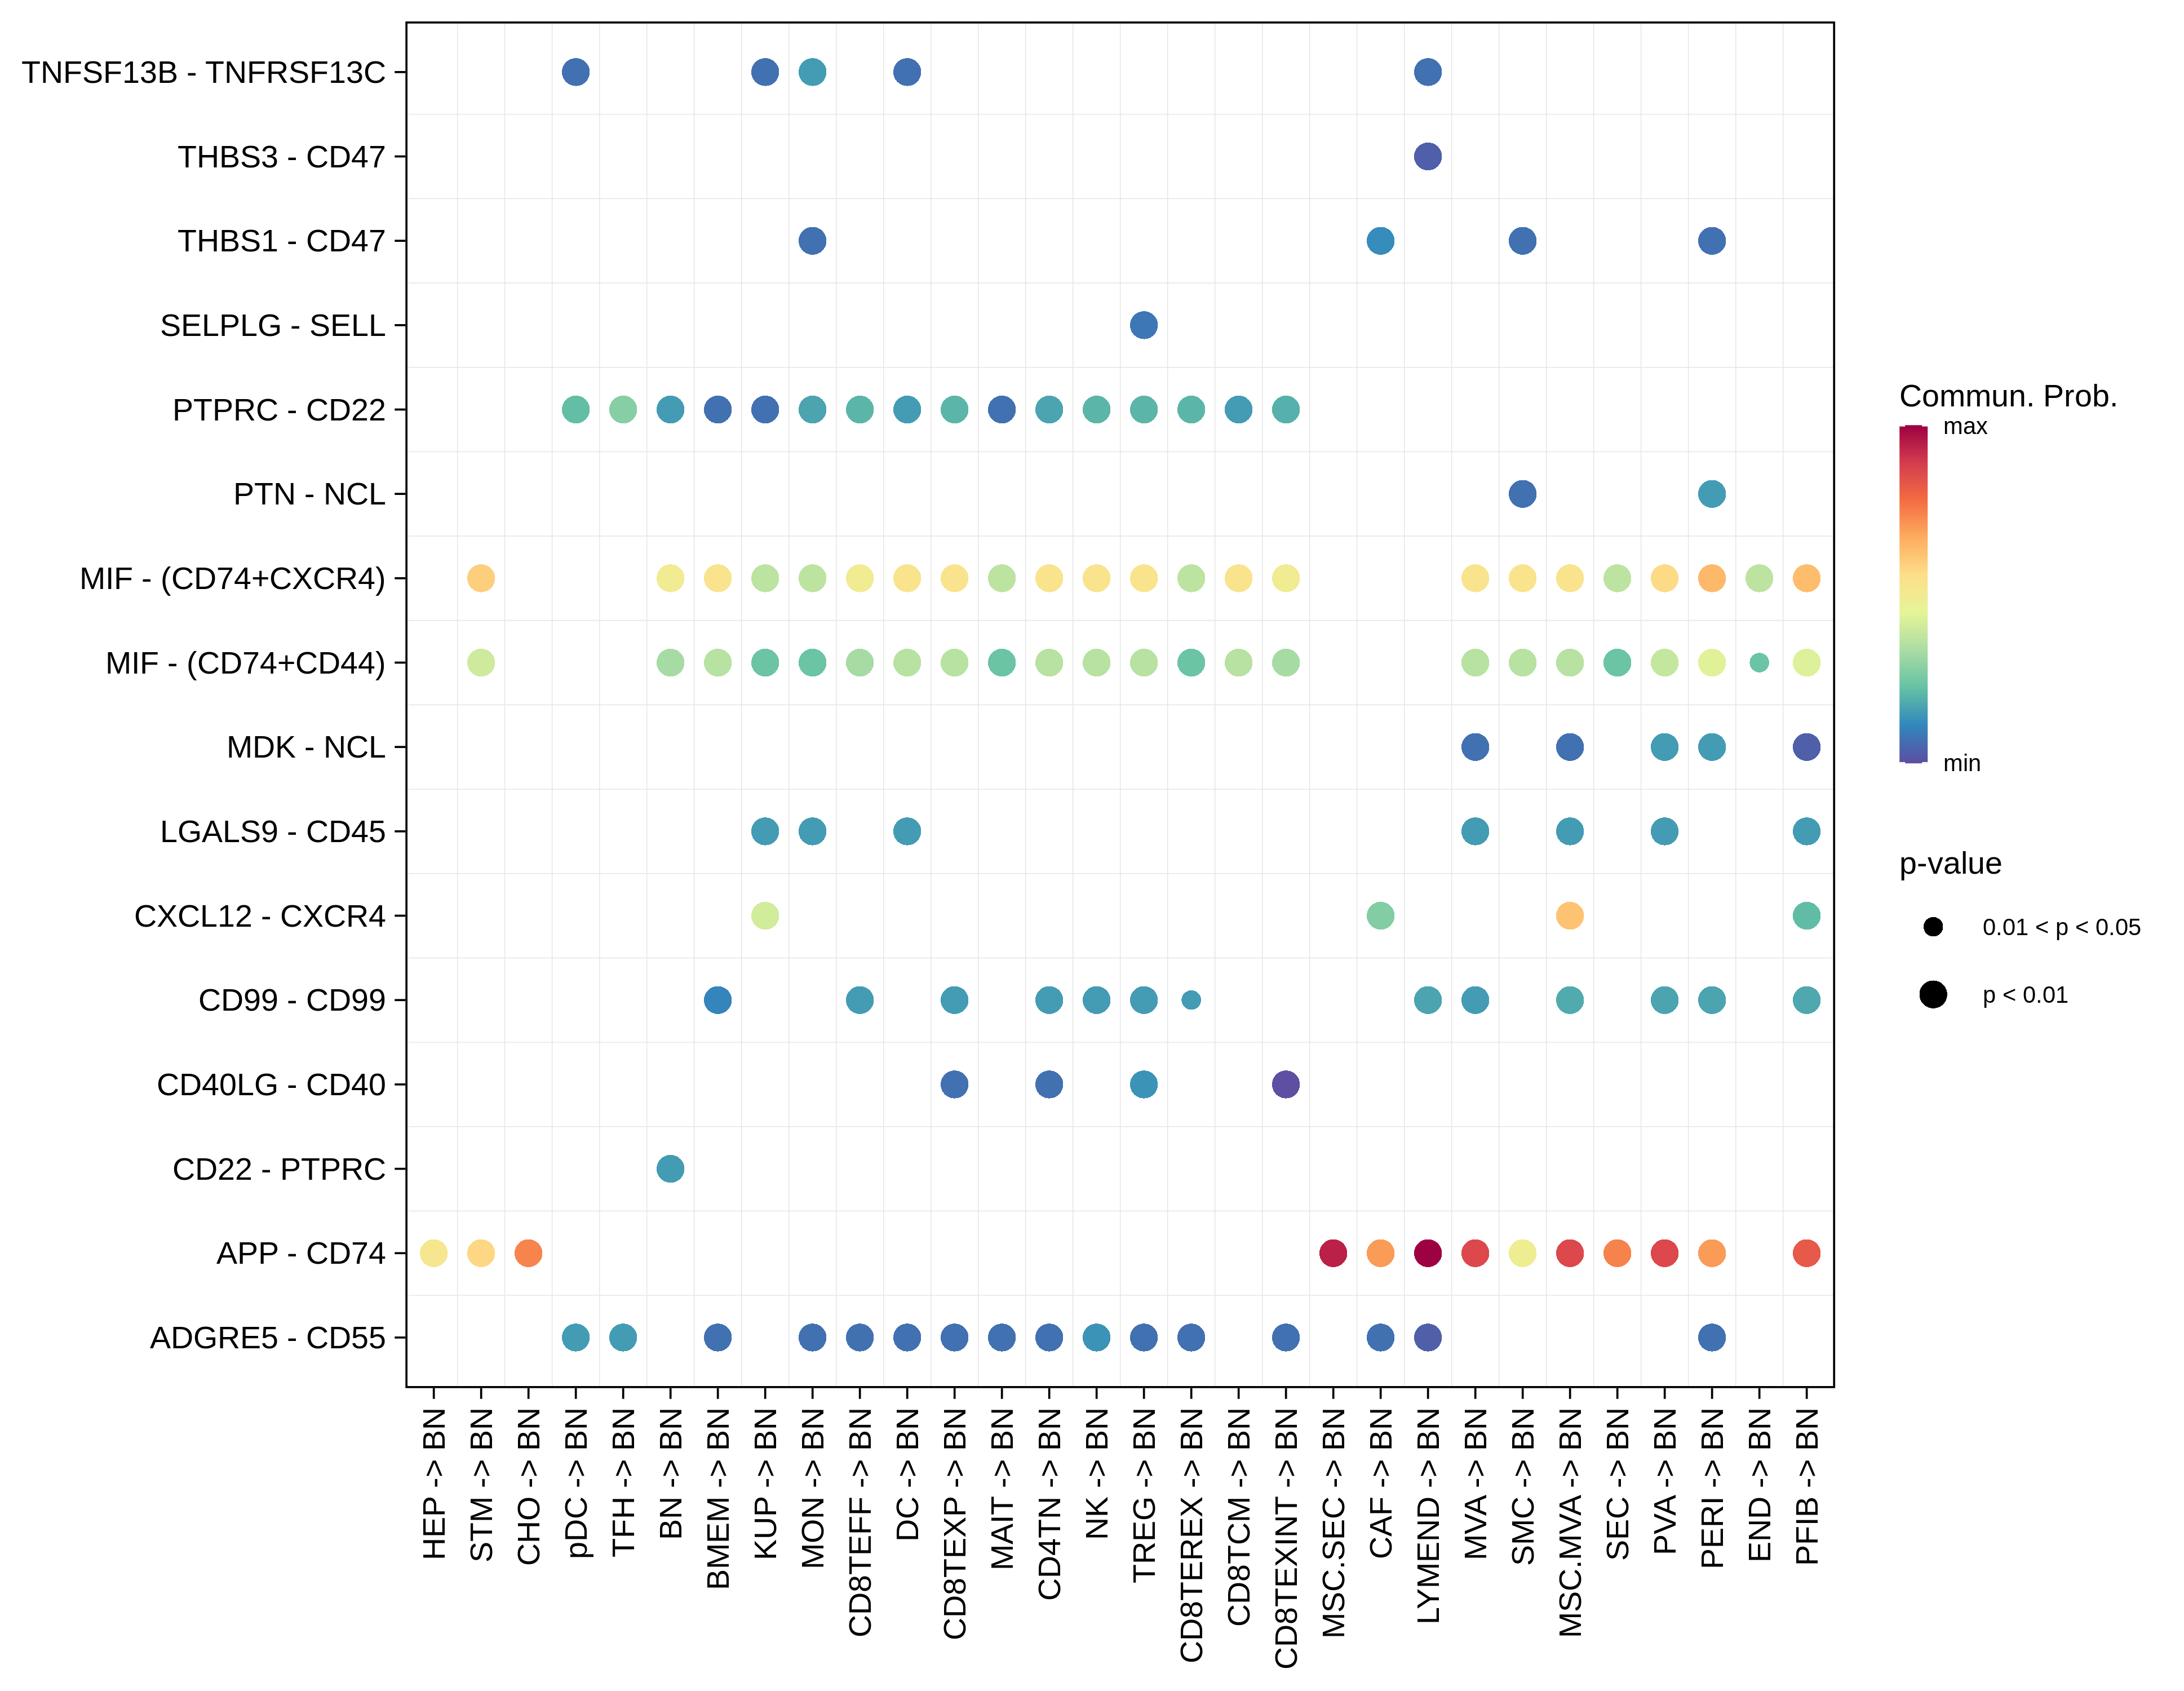
HealthyBMEMThe cell-cell communications between each two interacting cell types in Healthy-derived samples of the selected tissue. Different colors in the circle plot represent different cell groups and the edge width is proportional to the indicated number of ligand-receptor pairs.Bubble plot of proportion to the communication probability in significant signaling pathways between this cell type and its source cell population in Healthy-derived samples of the selected tissue. Each row represents the significant ligand and receptor gene pairs.Bubble plot of proportion to the communication probability in significant signaling pathways between this cell type and its target cell population in Healthy-derived samples of the selected tissue. Each row represents the significant ligand and receptor gene pairs.
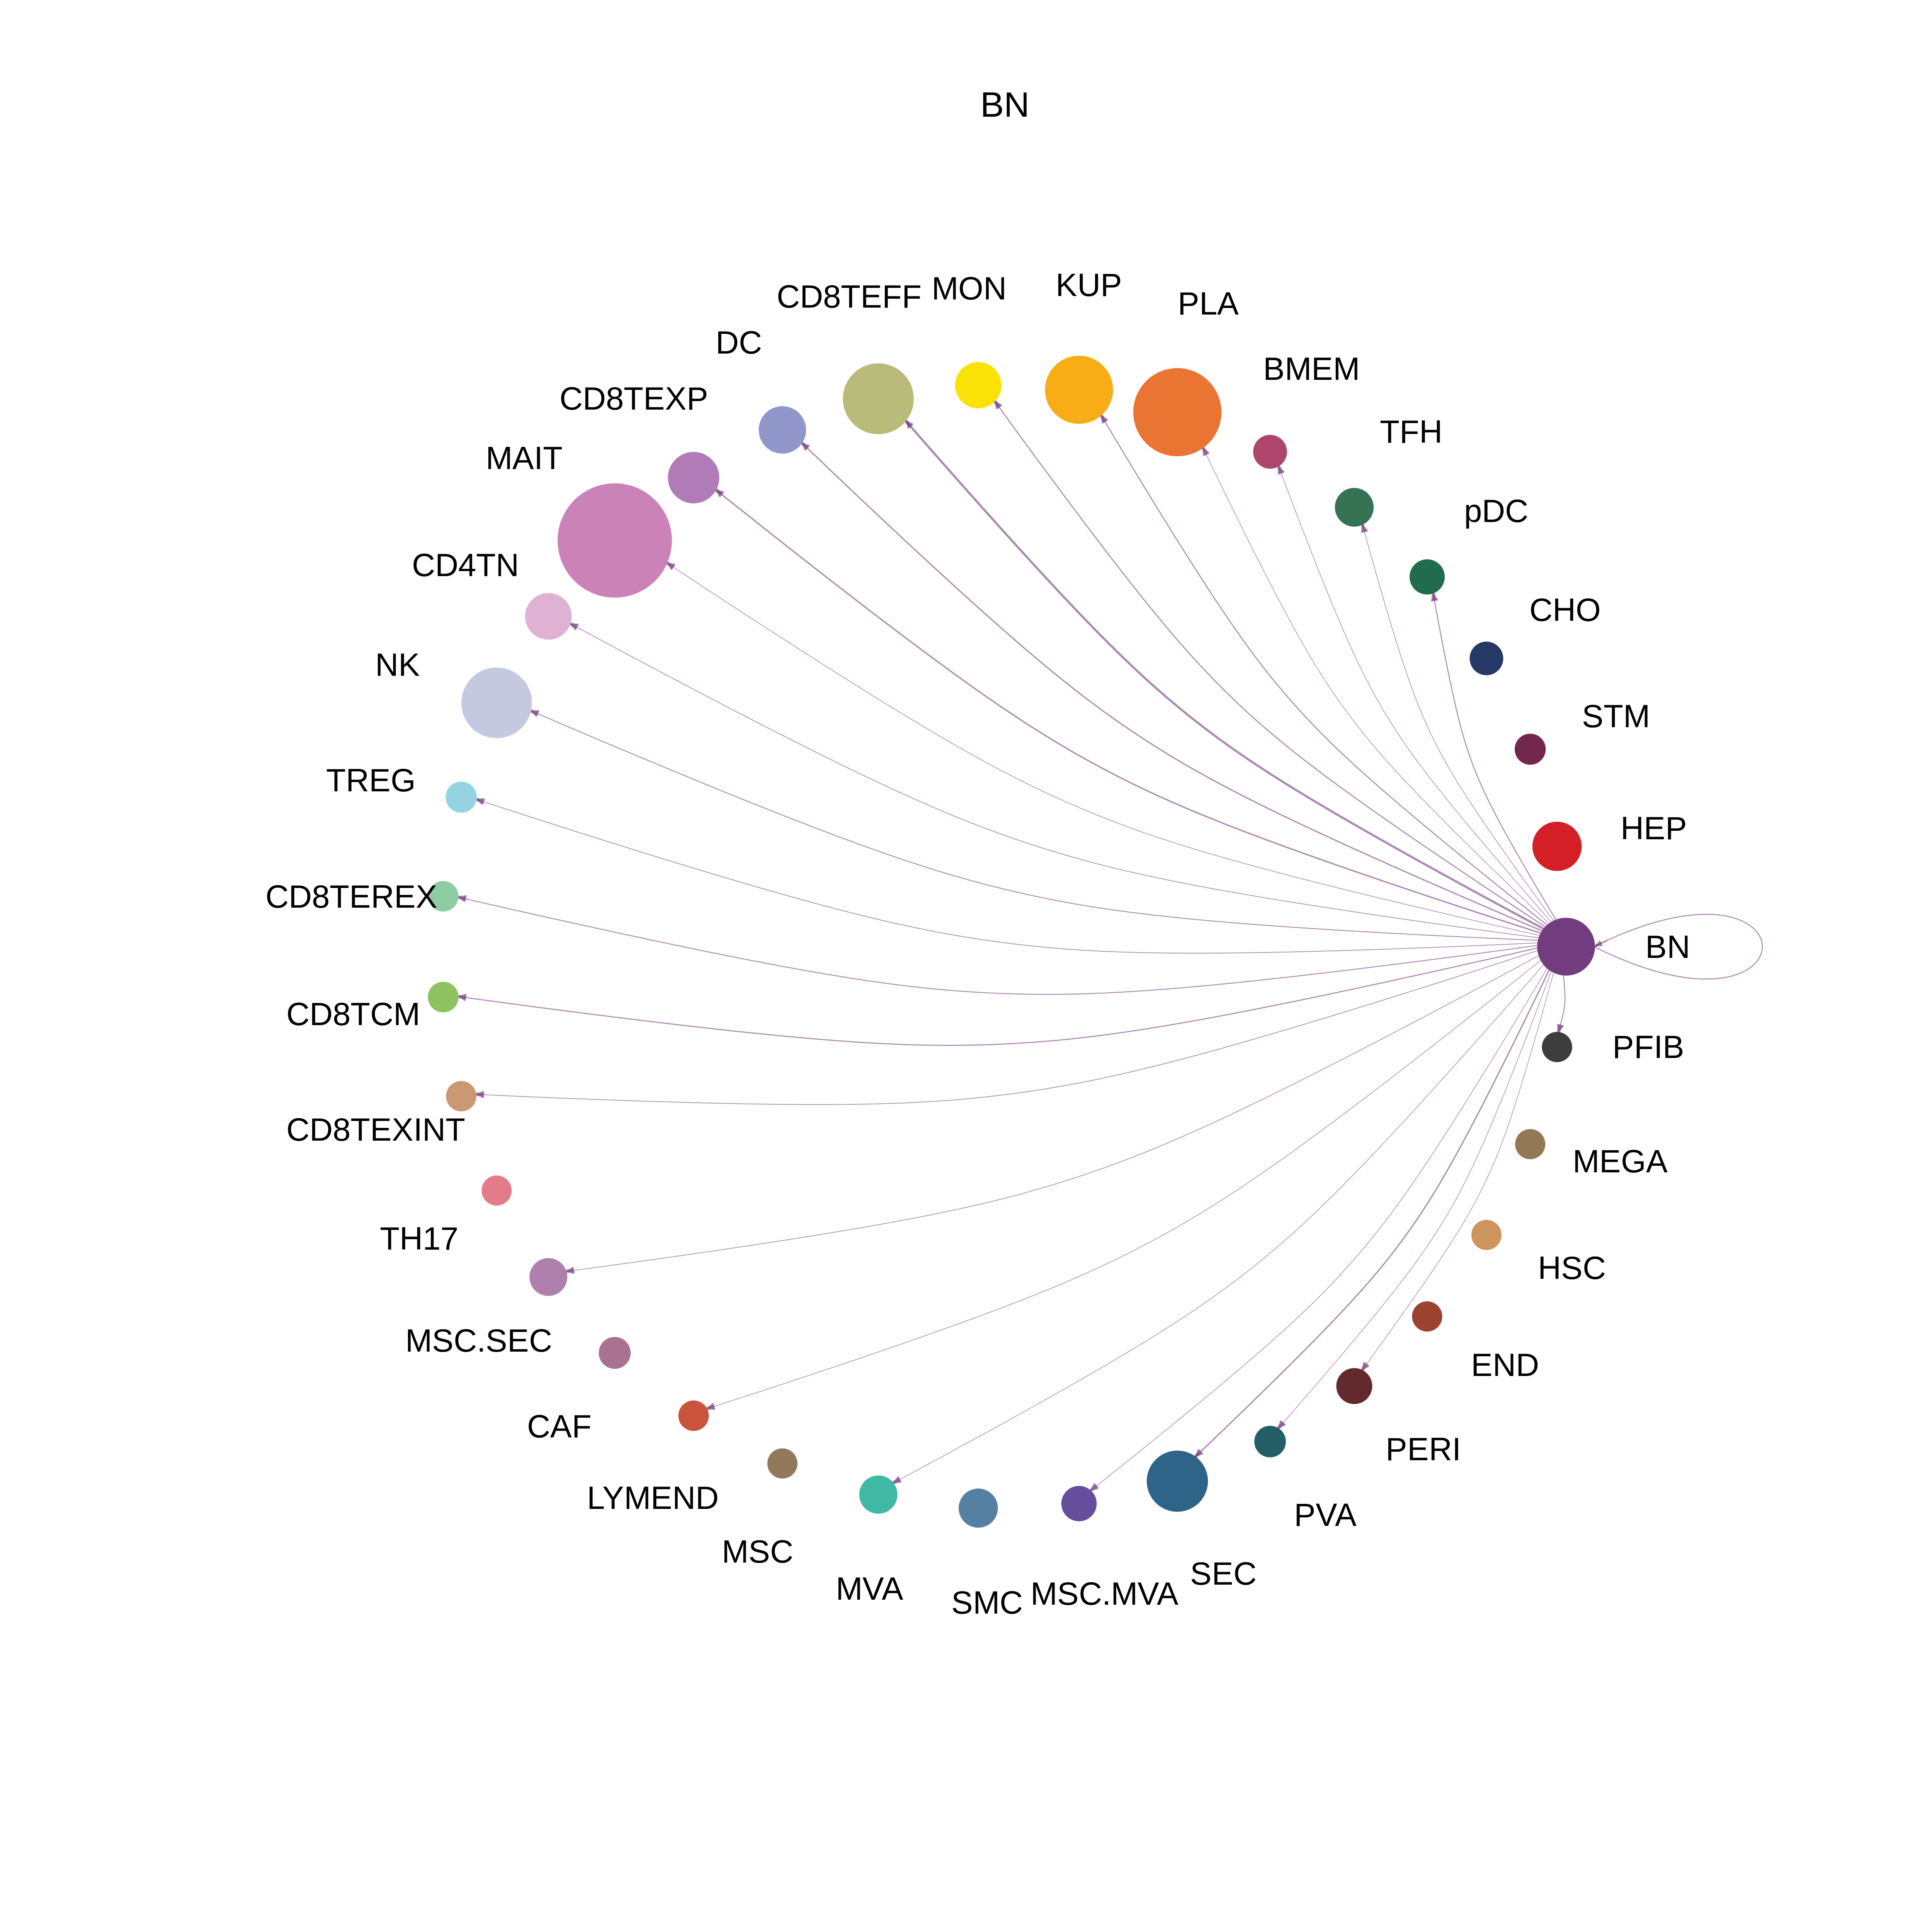
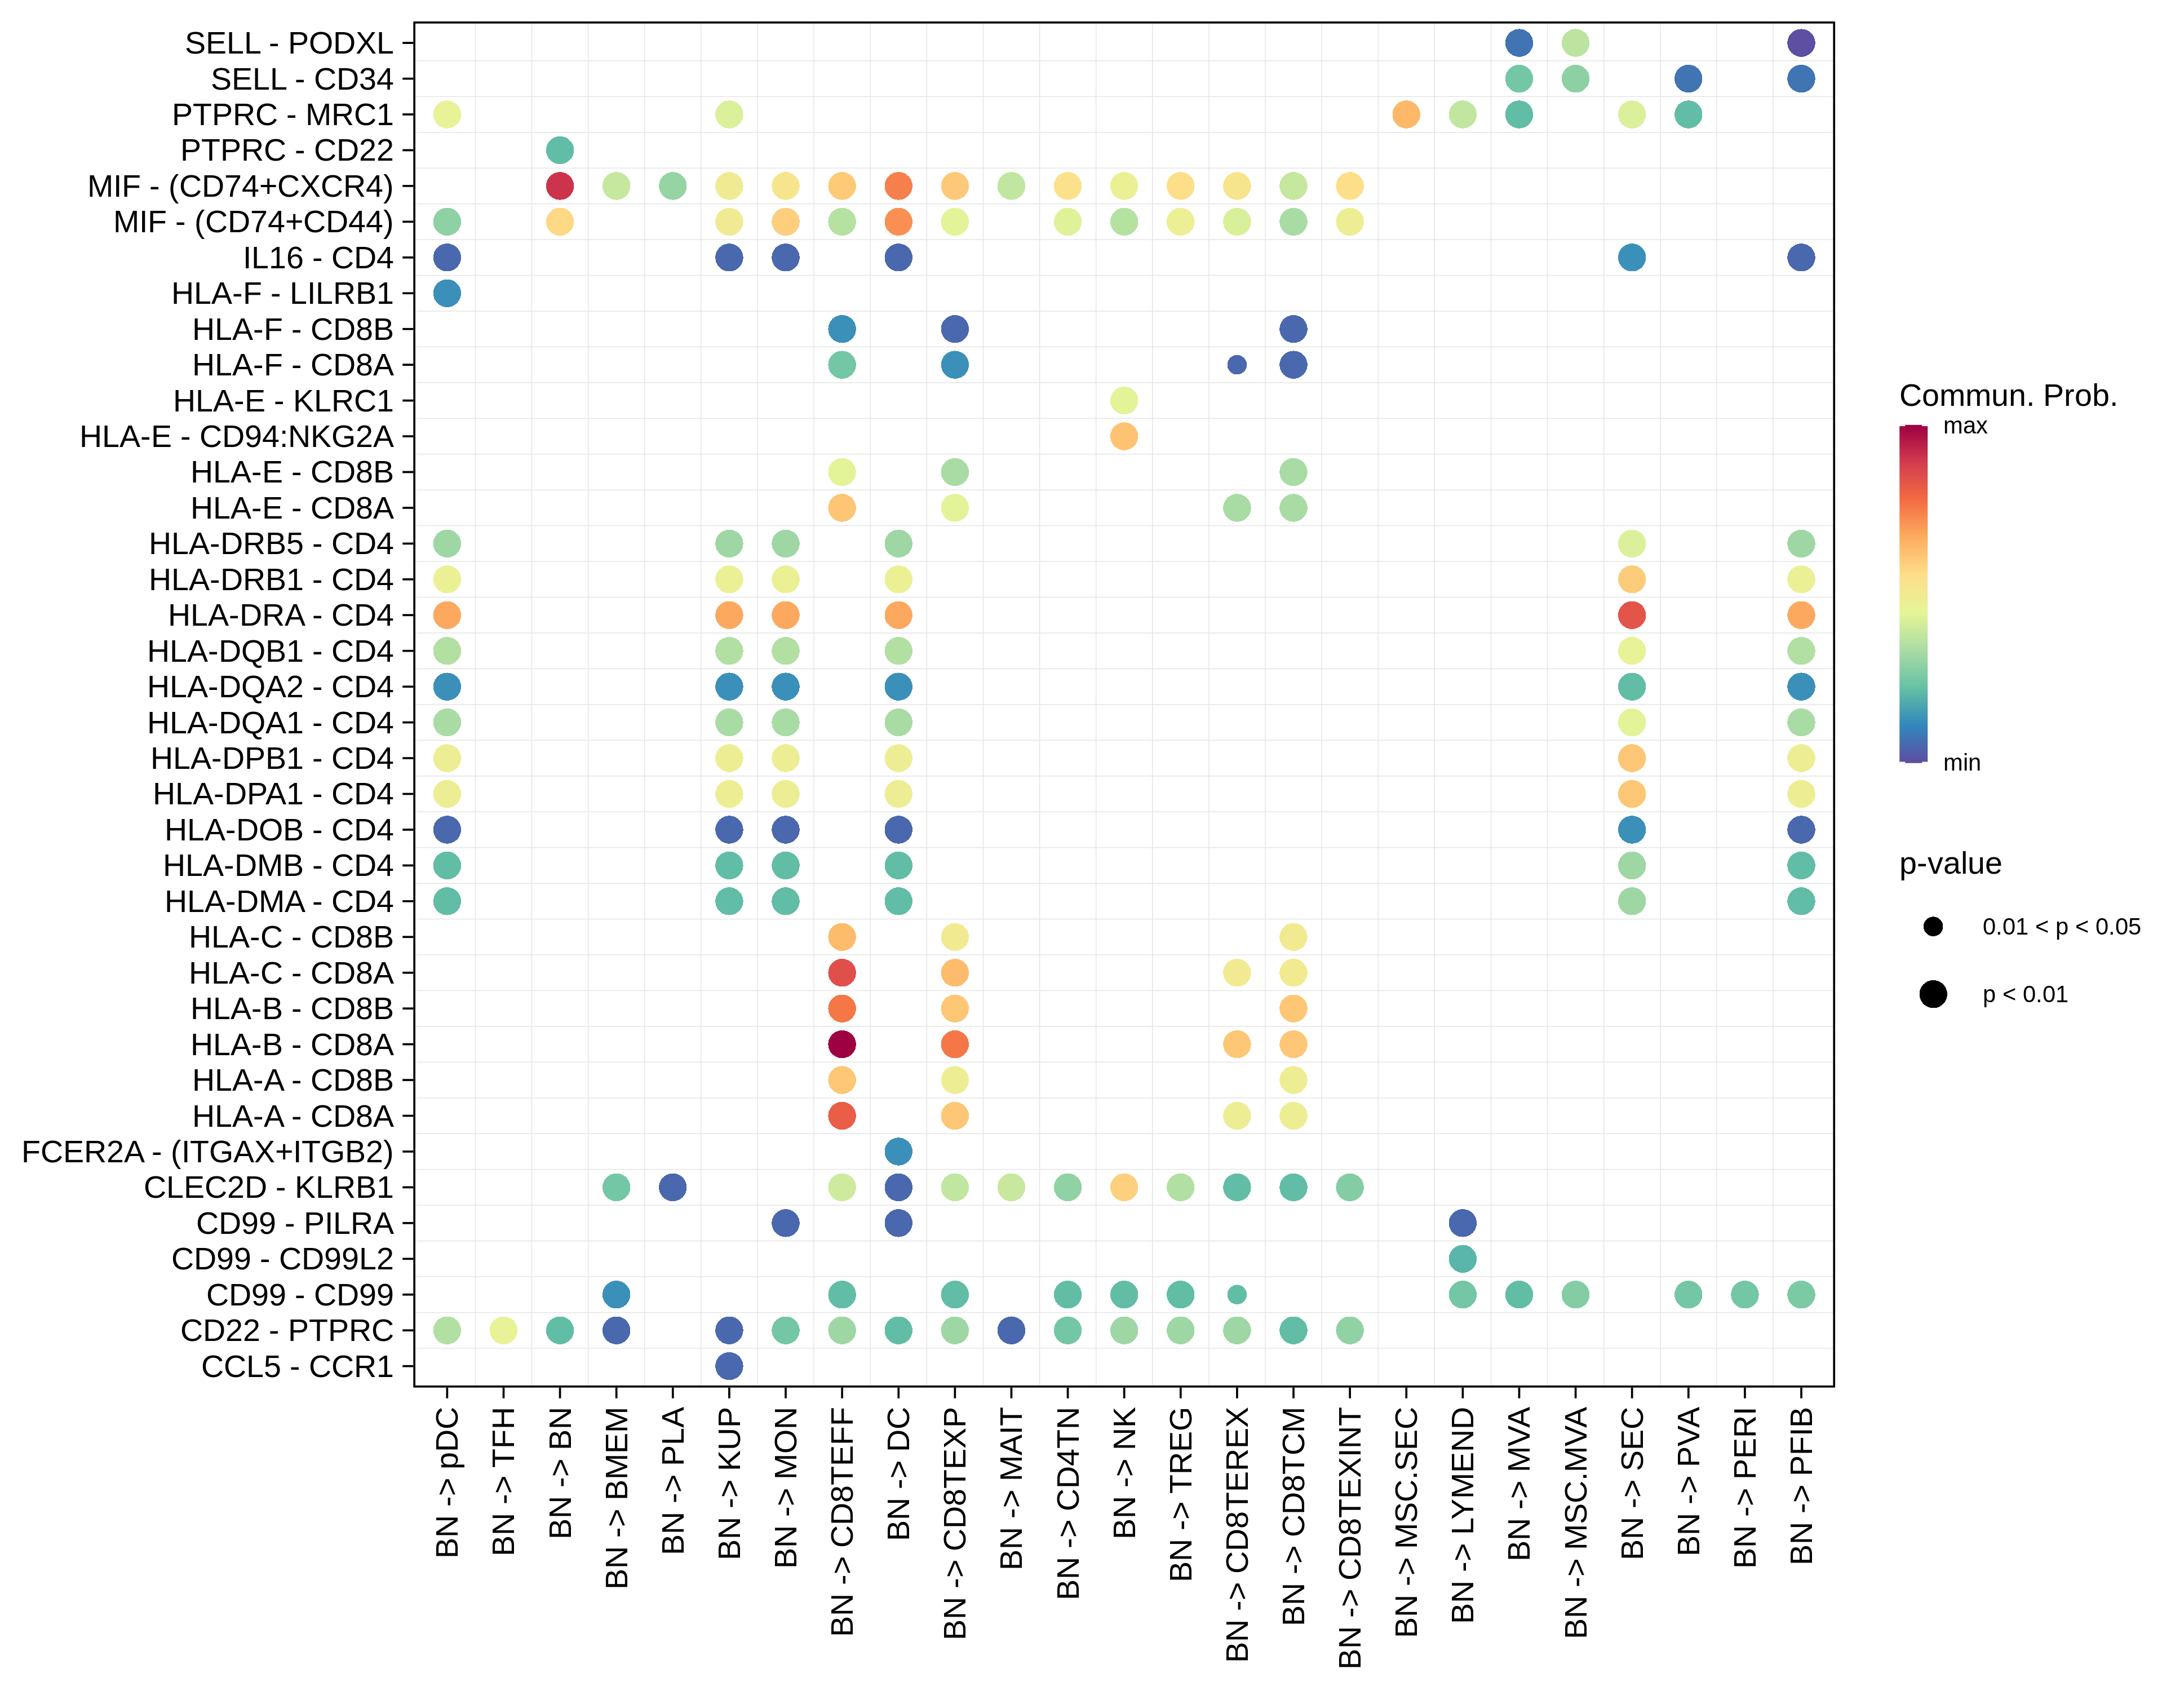
BNThe cell-cell communications between each two interacting cell types in Healthy-derived samples of the selected tissue. Different colors in the circle plot represent different cell groups and the edge width is proportional to the indicated number of ligand-receptor pairs.Bubble plot of proportion to the communication probability in significant signaling pathways between this cell type and its source cell population in Healthy-derived samples of the selected tissue. Each row represents the significant ligand and receptor gene pairs.Bubble plot of proportion to the communication probability in significant signaling pathways between this cell type and its target cell population in Healthy-derived samples of the selected tissue. Each row represents the significant ligand and receptor gene pairs.
Page: 1 2 3 4 5 6 7 8 9 10 11 12 13 14 15 16 

Disease StateCell TypeCircleSourceTarget
PrecancerBMEMThe cell-cell communications between each two interacting cell types in Precancer-derived samples of the selected tissue. Different colors in the circle plot represent different cell groups and the edge width is proportional to the indicated number of ligand-receptor pairs. Bubble plot of proportion to the communication probability in significant signaling pathways between this cell type and its source cell population in Precancer-derived samples of the selected tissue. Each row represents the significant ligand and receptor gene pairs.Bubble plot of proportion to the communication probability in significant signaling pathways between this cell type and its target cell population in Precancer-derived samples of the selected tissue. Each row represents the significant ligand and receptor gene pairs.
BNThe cell-cell communications between each two interacting cell types in Precancer-derived samples of the selected tissue. Different colors in the circle plot represent different cell groups and the edge width is proportional to the indicated number of ligand-receptor pairs. Bubble plot of proportion to the communication probability in significant signaling pathways between this cell type and its source cell population in Precancer-derived samples of the selected tissue. Each row represents the significant ligand and receptor gene pairs.Bubble plot of proportion to the communication probability in significant signaling pathways between this cell type and its target cell population in Precancer-derived samples of the selected tissue. Each row represents the significant ligand and receptor gene pairs.
Page: 1 2 3 4 5 6 7 8 9 10 11 12 13 14 15 16 17 

Disease StateCell TypeCircleSourceTarget
HCCBMEMThe cell-cell communications between each two interacting cell types in HCC-derived samples of Liver tissue. Different colors in the circle plot represent different cell groups and the edge width is proportional to the indicated number of ligand-receptor pairs.Bubble plot of proportion to the communication probability in significant signaling pathways between this cell type and its source cell population in HCC-derived samples of Liver tissue. Each row represents the significant ligand and receptor gene pairs.Bubble plot of proportion to the communication probability in significant signaling pathways between this cell type and its target cell population in HCC-derived samples of Liver tissue. Each row represents the significant ligand and receptor gene pairs.
BNThe cell-cell communications between each two interacting cell types in HCC-derived samples of Liver tissue. Different colors in the circle plot represent different cell groups and the edge width is proportional to the indicated number of ligand-receptor pairs.Bubble plot of proportion to the communication probability in significant signaling pathways between this cell type and its source cell population in HCC-derived samples of Liver tissue. Each row represents the significant ligand and receptor gene pairs.Bubble plot of proportion to the communication probability in significant signaling pathways between this cell type and its target cell population in HCC-derived samples of Liver tissue. Each row represents the significant ligand and receptor gene pairs.
∗The cell-cell communications between each two interacting cell types in different states-derived samples of Liver tissue. Different colors in the circle plot represent different cell groups and the edge width is proportional to the indicated number of ligand-receptor pairs.
∗Bubble plot of proportion to the communication probability in significant signaling pathways between this cell type and its source and target cell population. Each row represents the significant ligand and receptor gene pairs.
Page: 1 2 3 4 5 6 7 8 9 10 11 12 13 14 15 16 17 

Top

Stemness, Senescence, Metaplasia and NeoTCR signature analysis

check button Developmental potential inference using CytoTRACE.
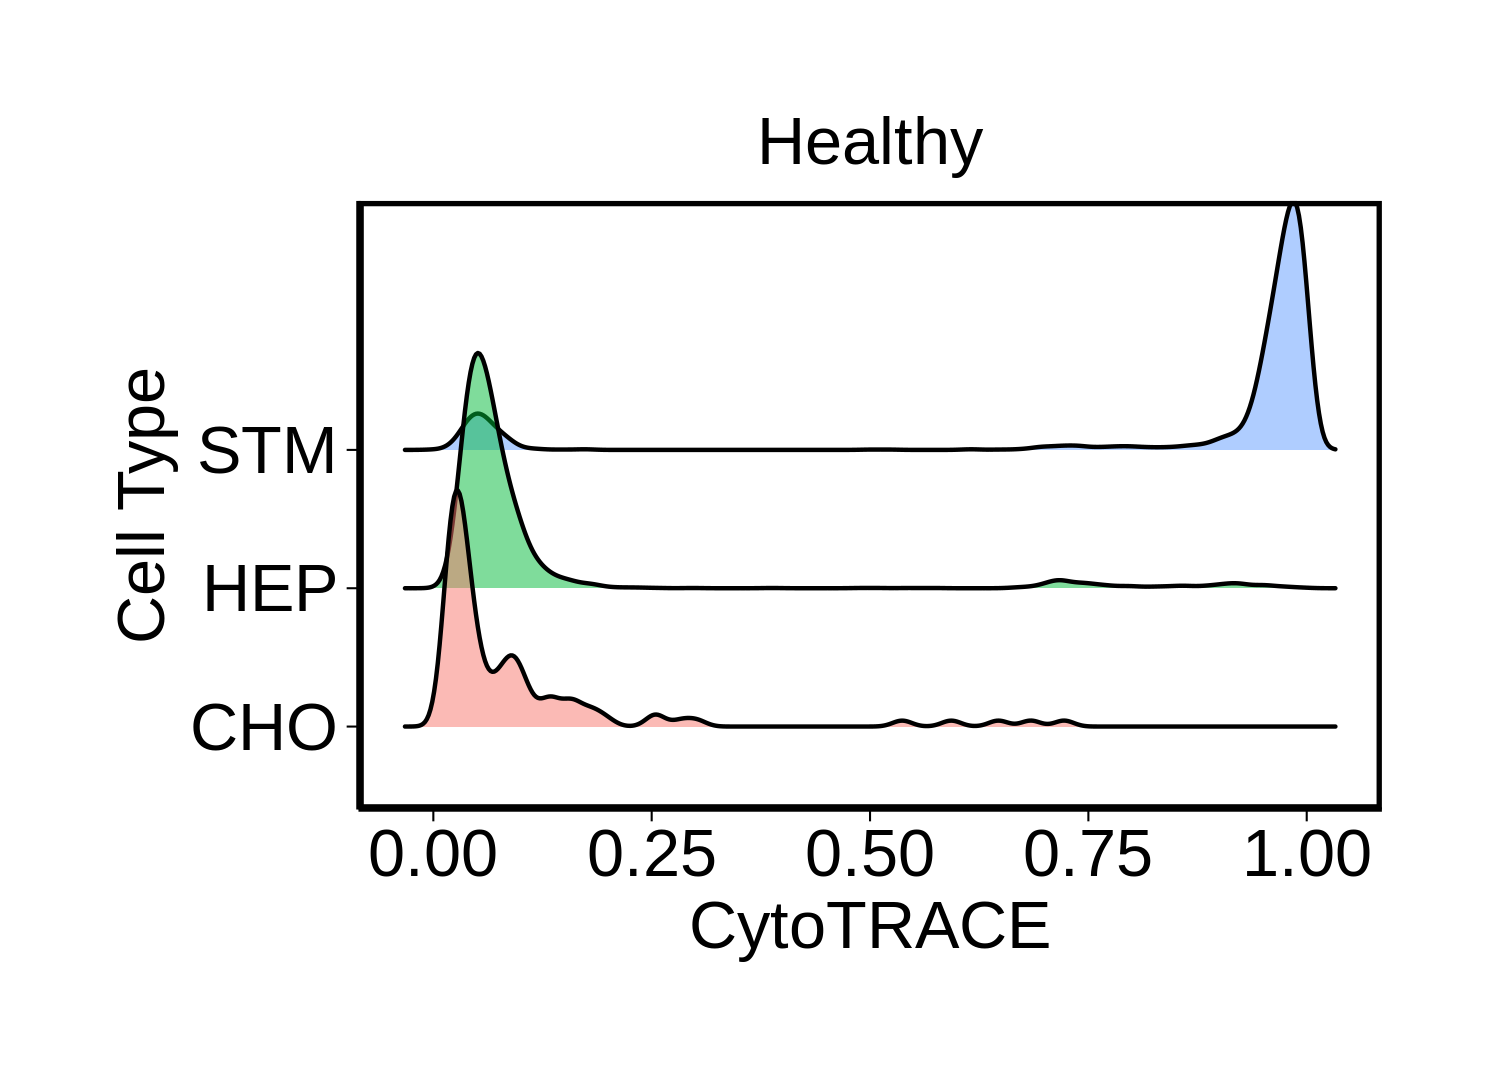
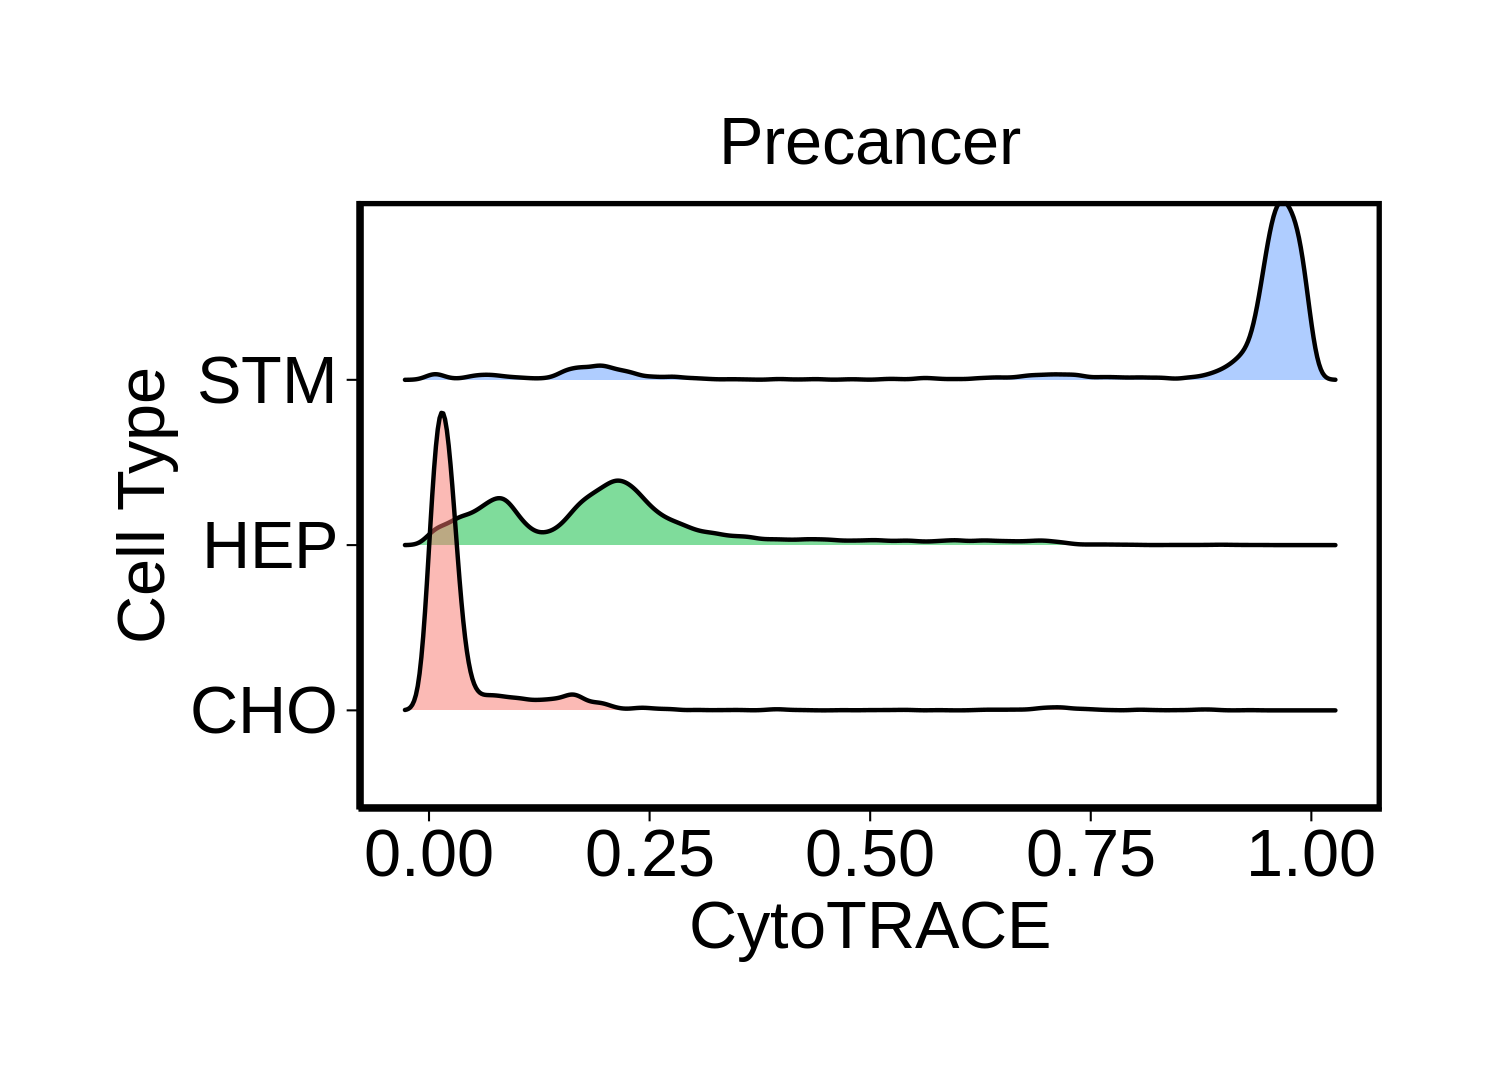
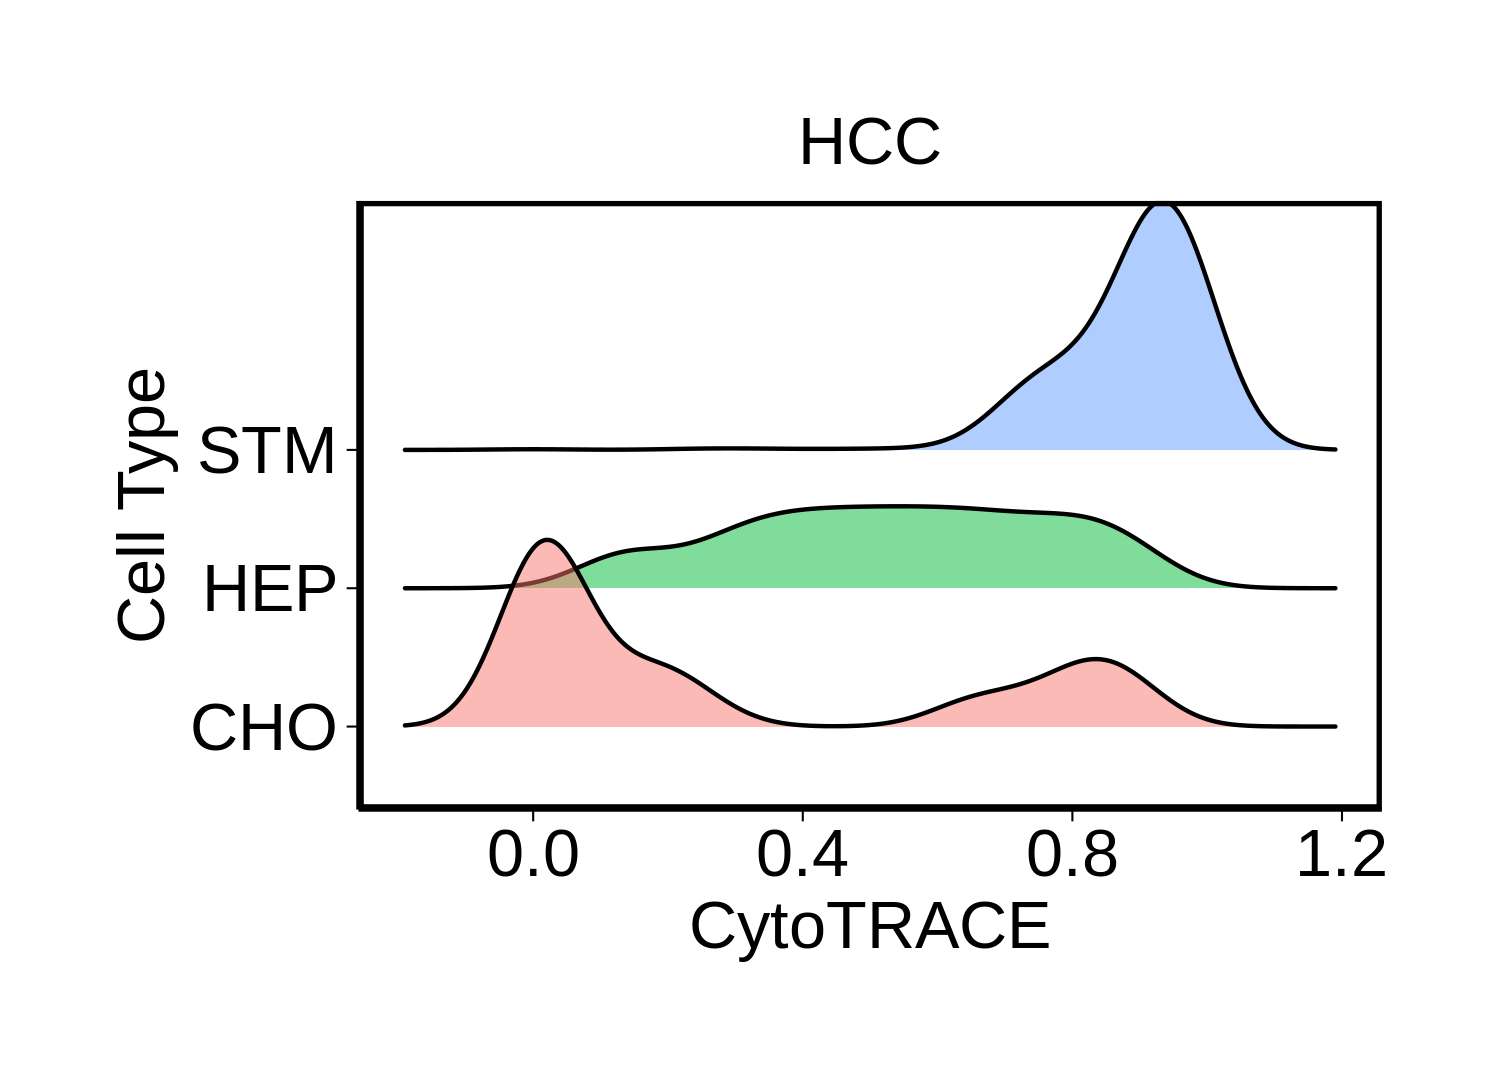
1_developmental_potential_in_Healthy.png shows the analysis results of stemness, senescence, and metaplasia signatures2_developmental_potential_in_Precancer.png shows the analysis results of stemness, senescence, and metaplasia signatures3_developmental_potential_in_HCC.png shows the analysis results of stemness, senescence, and metaplasia signatures
∗Ridge plots of CytoTRACE score distributions for epithelial cells.

check button Cellular senescence signature (for three compartments).
Disease StateEpitheliaImmuneStromal
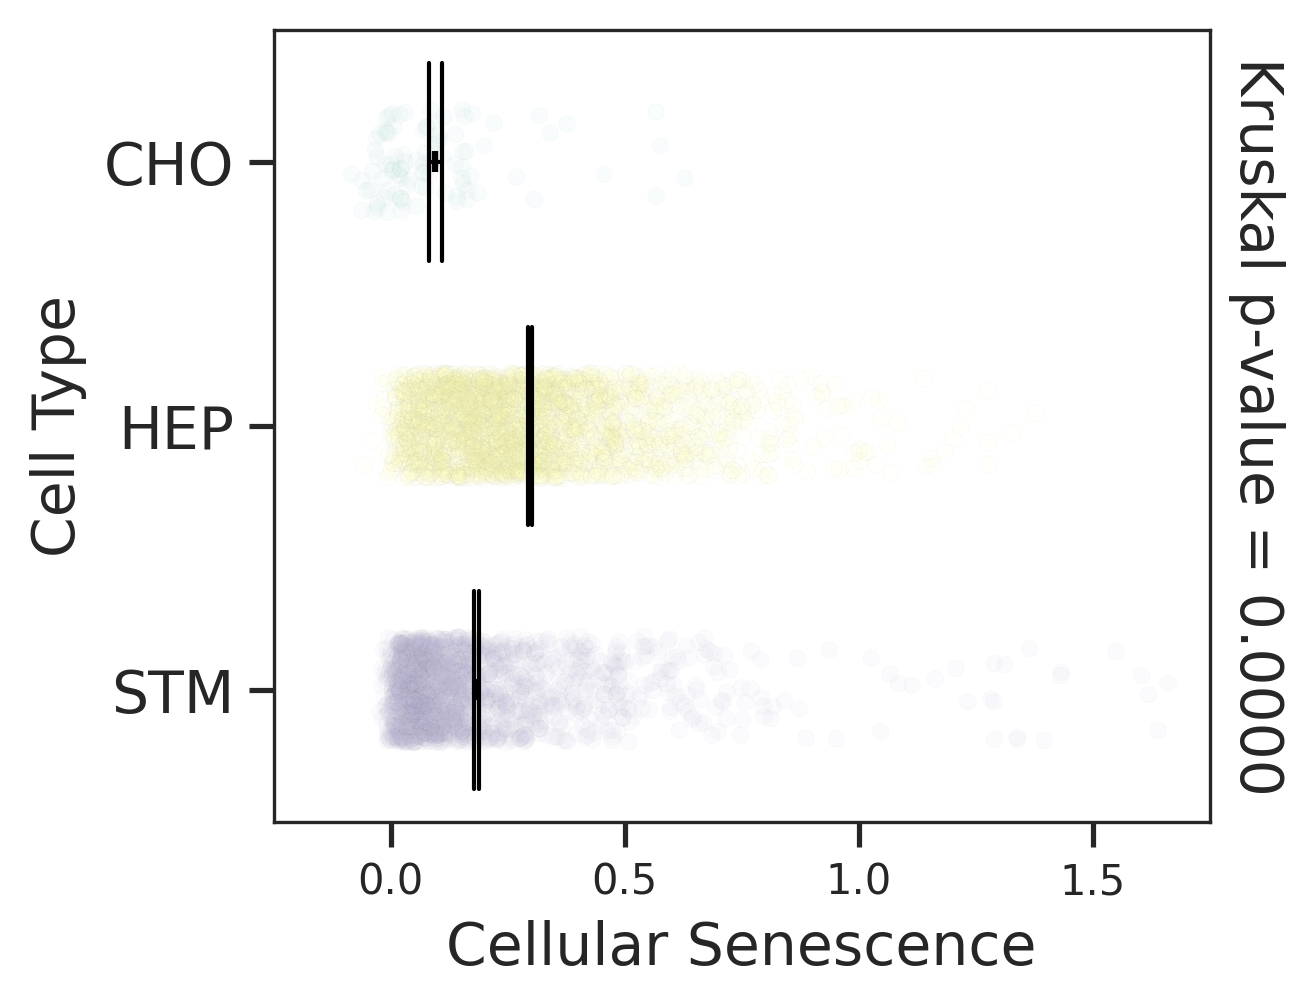
HealthyComparisons for degree of cellular senescence of epithelial compartment in Healthy-derived samples of Liver tissue.Comparisons for degree of cellular senescence of immune compartment in Healthy-derived samples of Liver tissue.Comparisons for degree of cellular senescence of stromal compartment in Healthy-derived samples of Liver tissue.
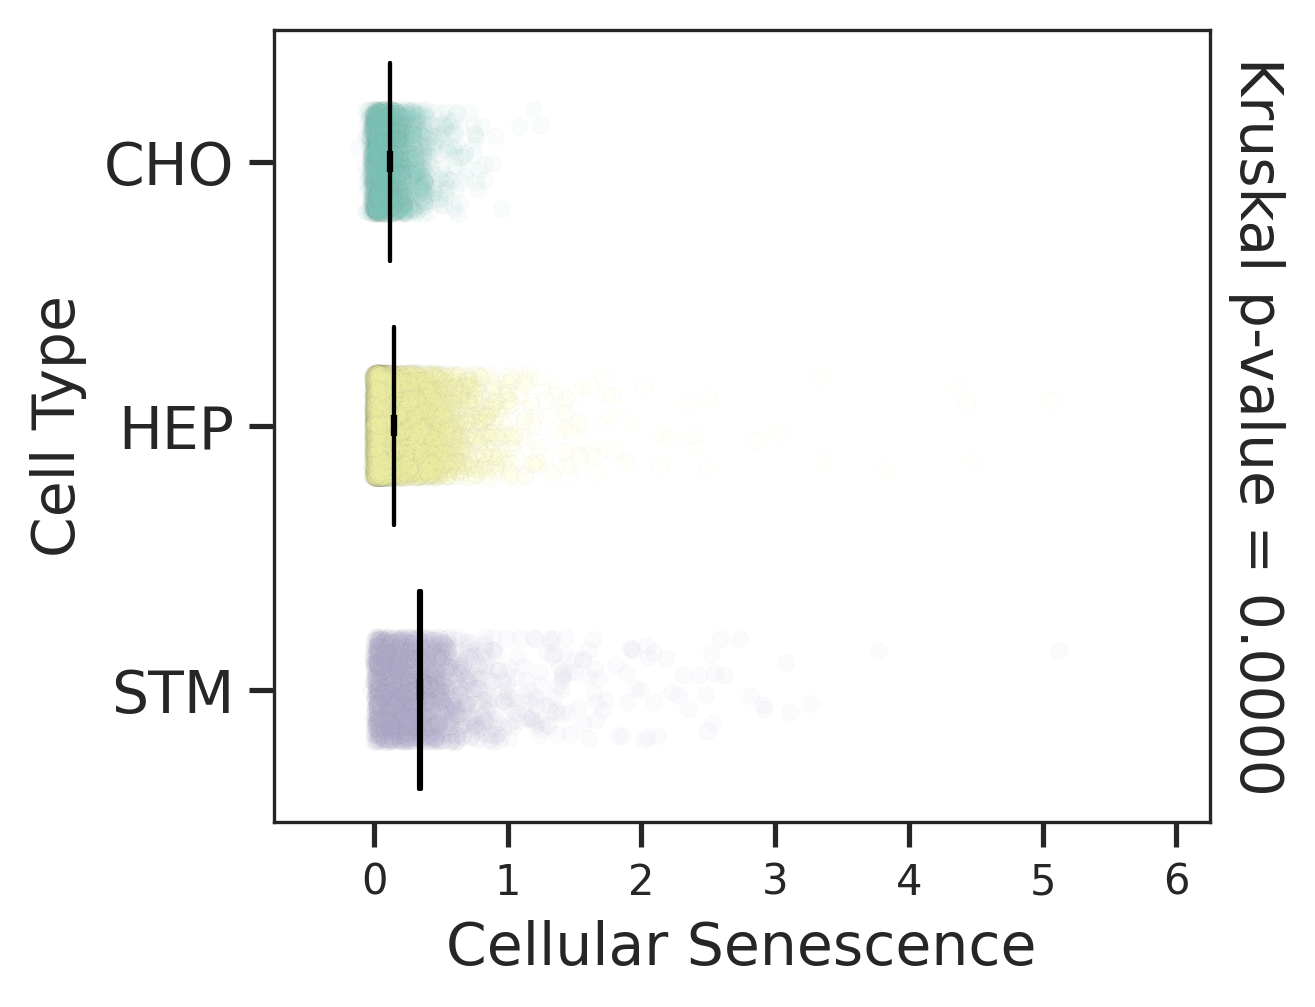
PrecancerComparisons for degree of cellular senescence of epithelial compartment in Precancer-derived samples of Liver tissue.Comparisons for degree of cellular senescence of immune compartment in Precancer-derived samples of Liver tissue.Comparisons for degree of cellular senescence of stromal compartment in Precancer-derived samples of Liver tissue.
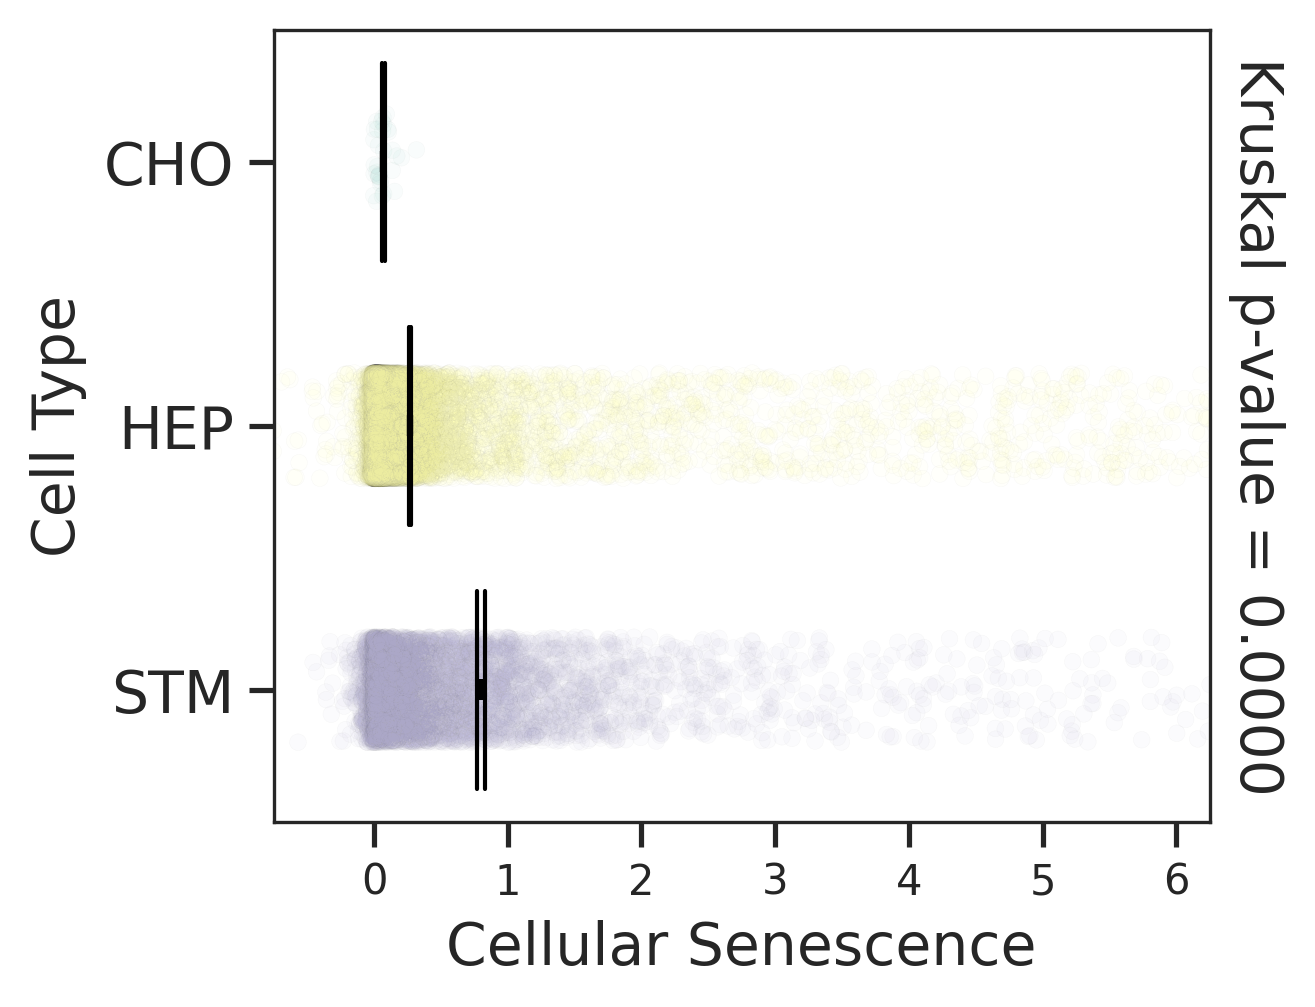
HCCComparisons for degree of cellular senescence of epithelial compartment in HCC-derived samples of Liver tissue.Comparisons for degree of cellular senescence of immune compartment in HCC-derived samples of Liver tissue.Comparisons for degree of cellular senescence of stromal compartment in HCC-derived samples of Liver tissue.
∗Comparisons for degree of cellular senescence among epithelial, immune and stromal cell populations of Liver tissue with different disease states.

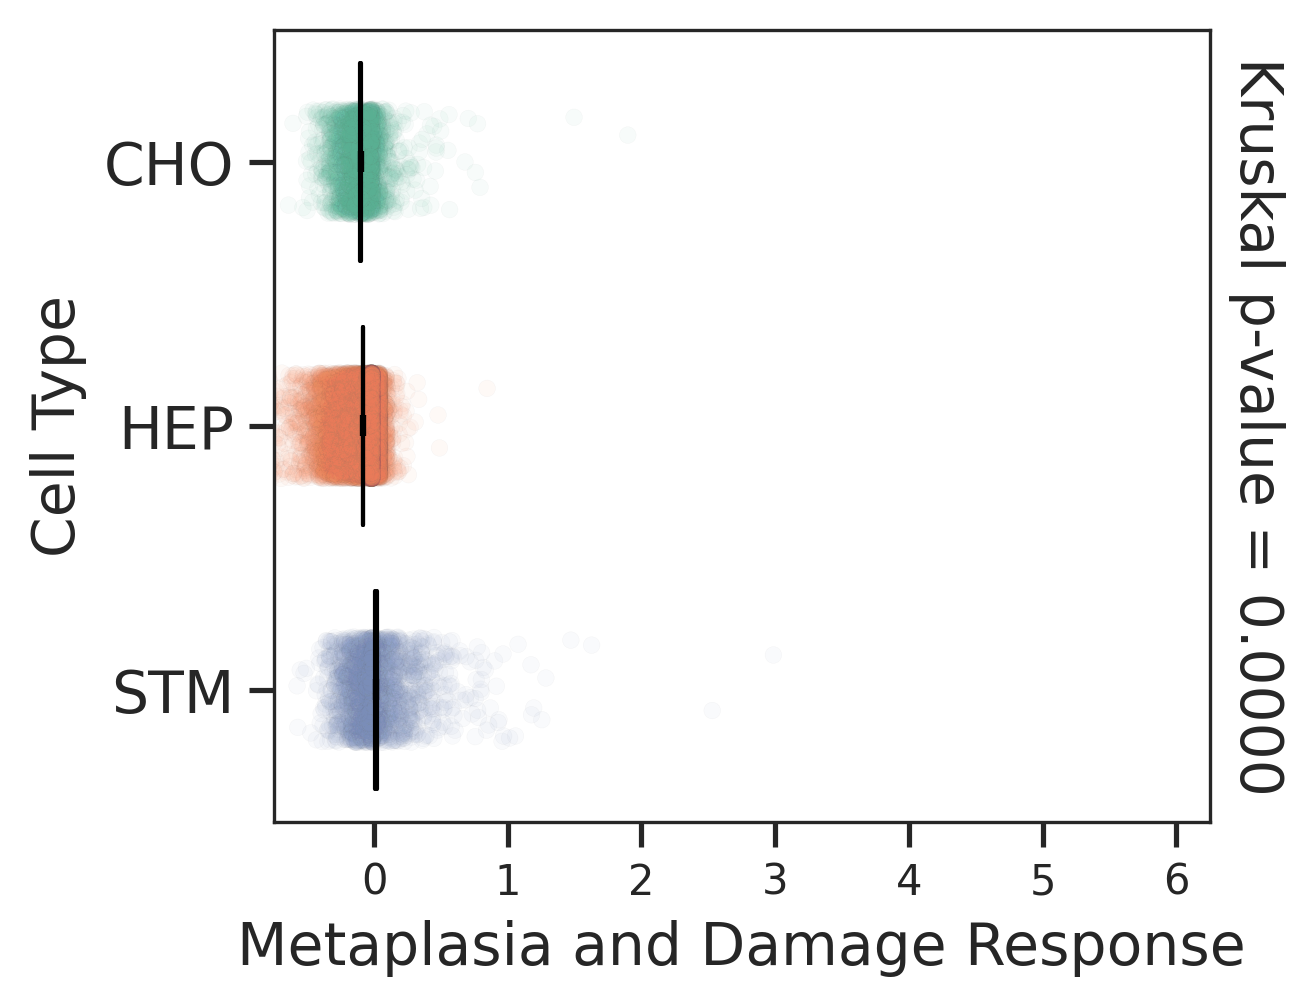
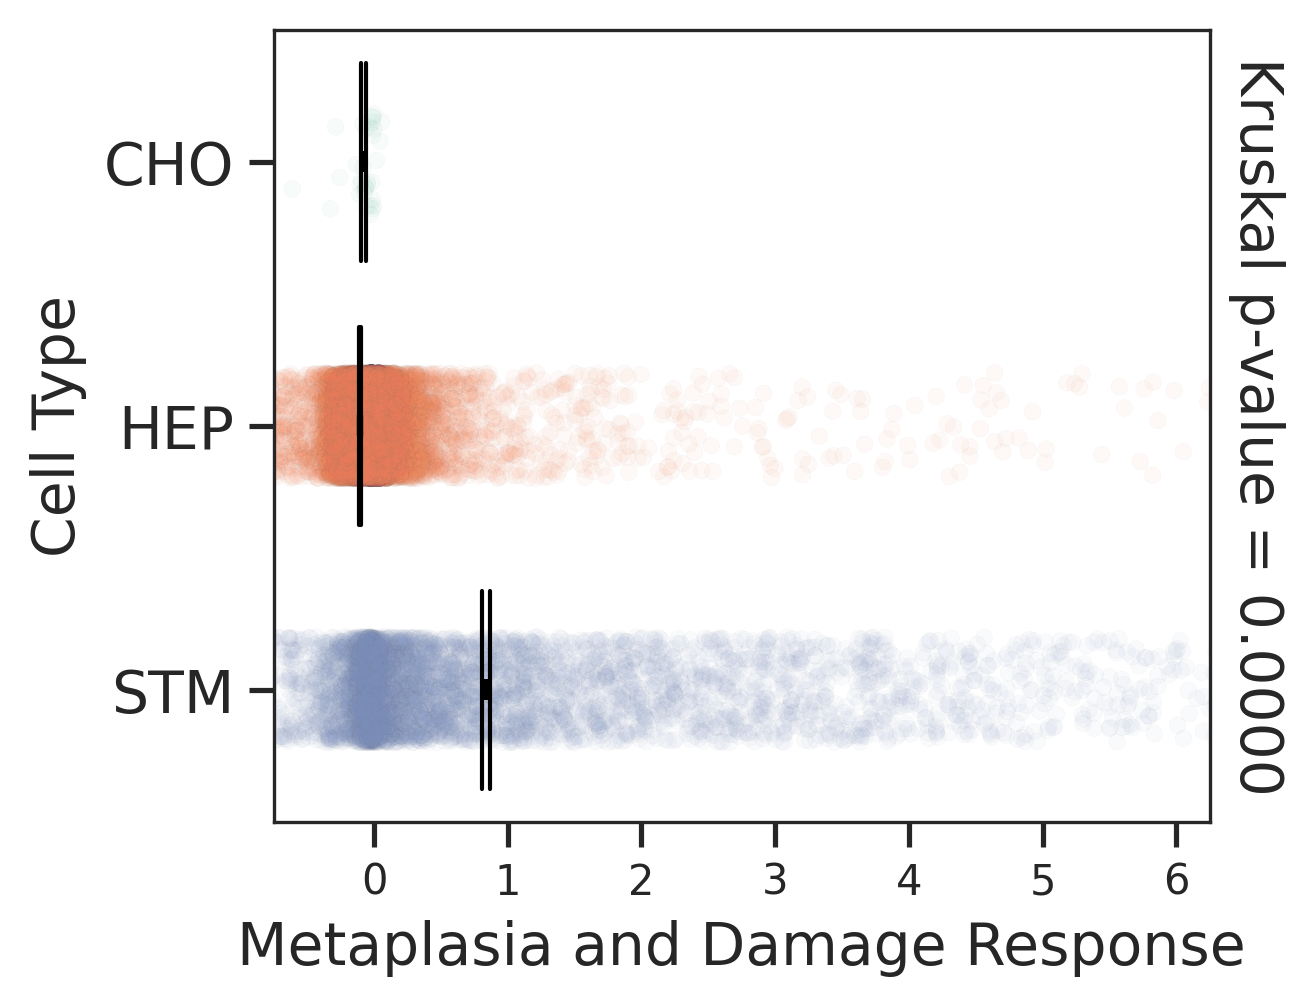
check button Metaplasia and damage response signature (for epithelial cells).
HealthyPrecancerHCC
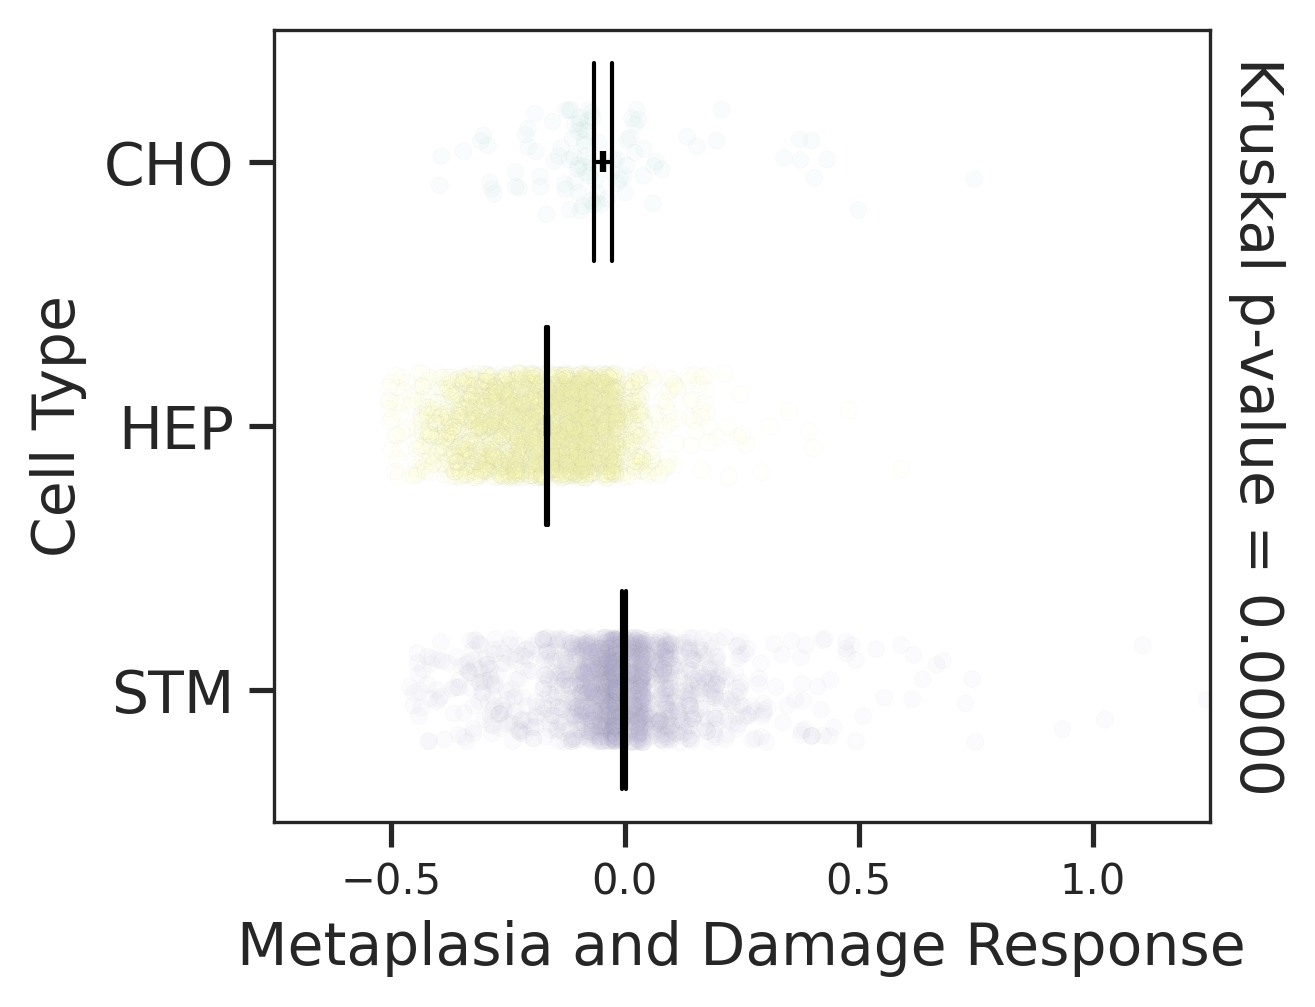
Comparisons of Metaplasia-associated damage scores among epithelial cell subpopulations.Comparisons of Metaplasia-associated damage scores among epithelial cell subpopulations.Comparisons of Metaplasia-associated damage scores among epithelial cell subpopulations.
∗Comparisons of Metaplasia-associated damage scores among epithelial cell subpopulations.

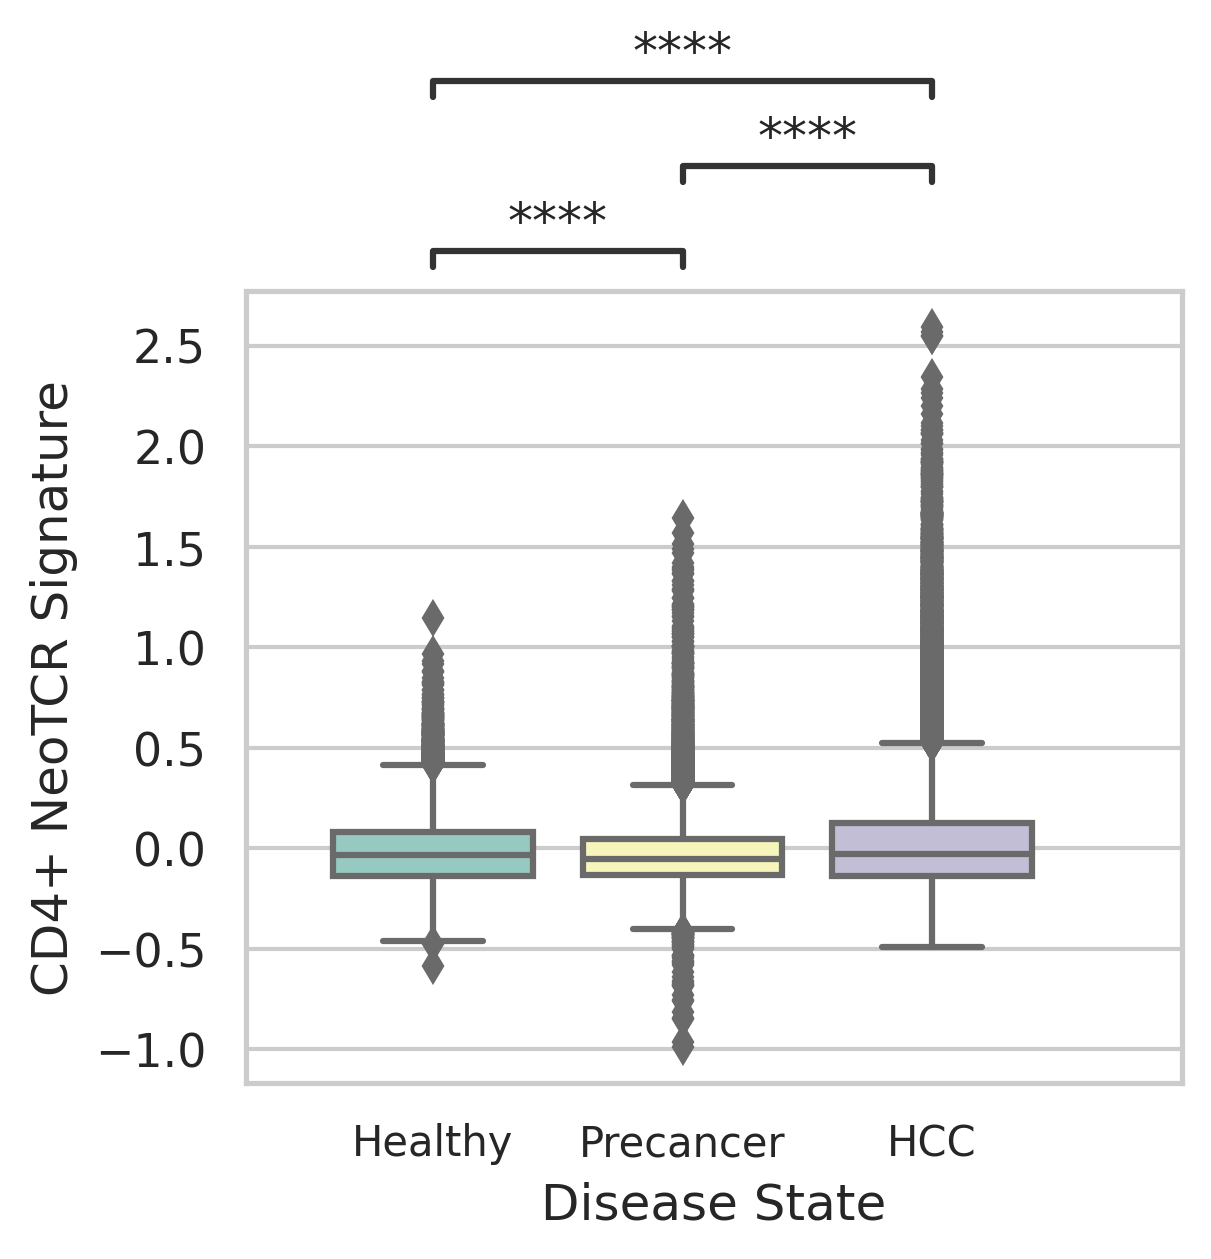
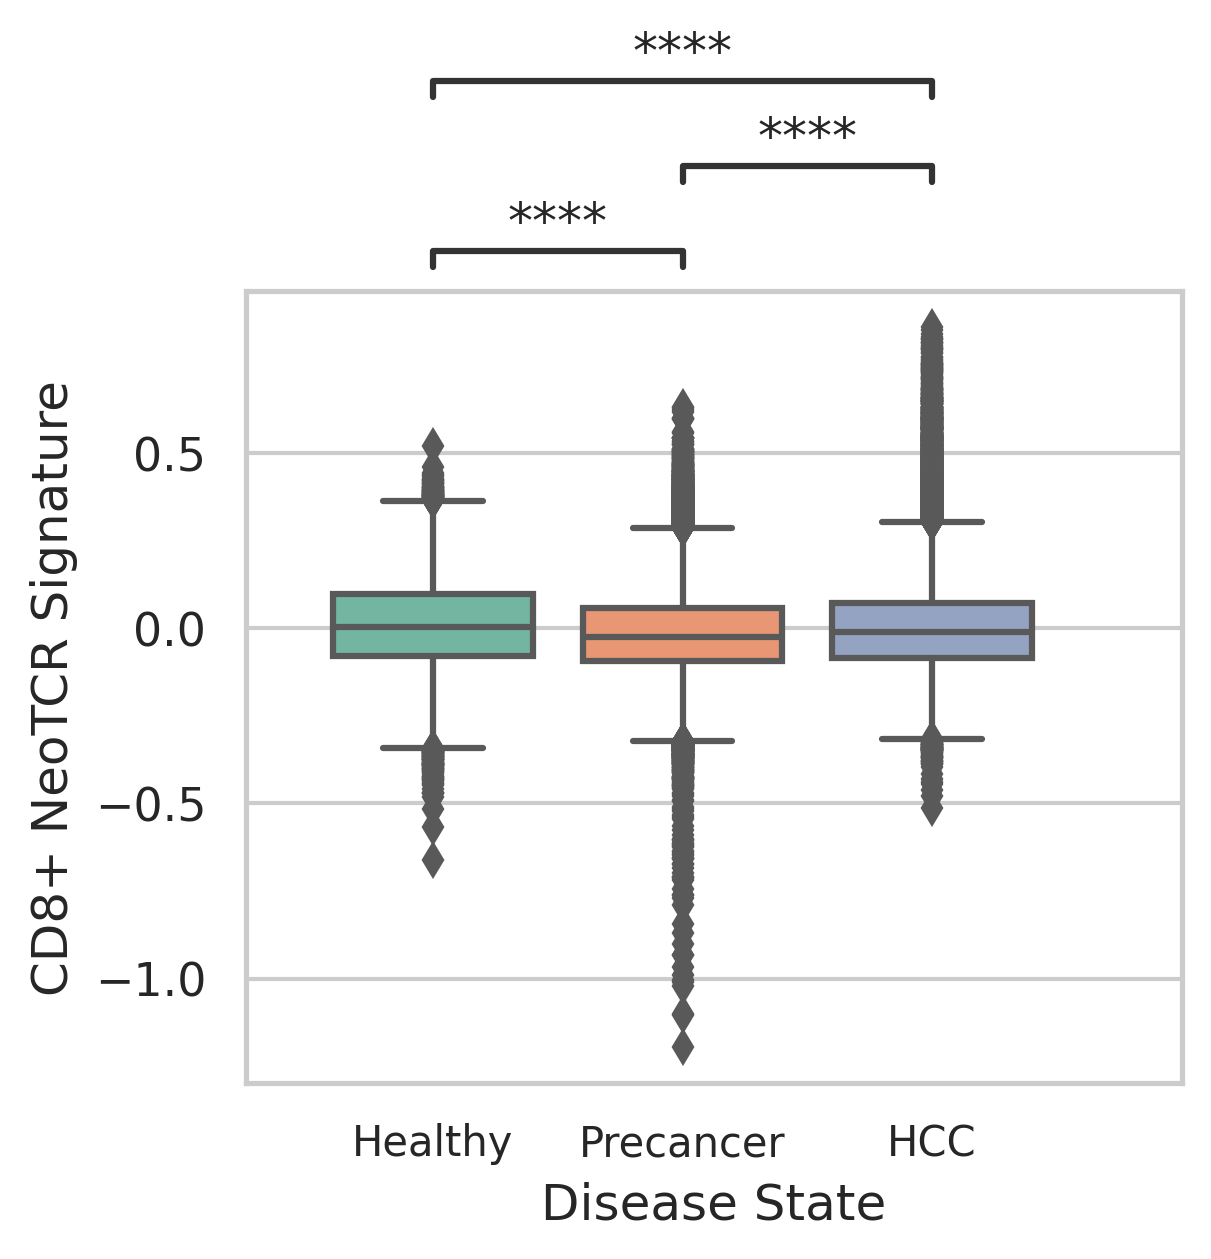
check button Neoantigen-specific TCR clonotypes (NeoTCR) signature.
Comparisons of CD4+ and CD8+ NeoTCR signature scores among different disease states.Comparisons of CD4+ and CD8+ NeoTCR signature scores among different disease states.
∗Comparisons of CD4+ and CD8+ NeoTCR signature scores among different disease states.