| Tissue | Major Cell Type | Minor Cell Type | Full Name | Markers |
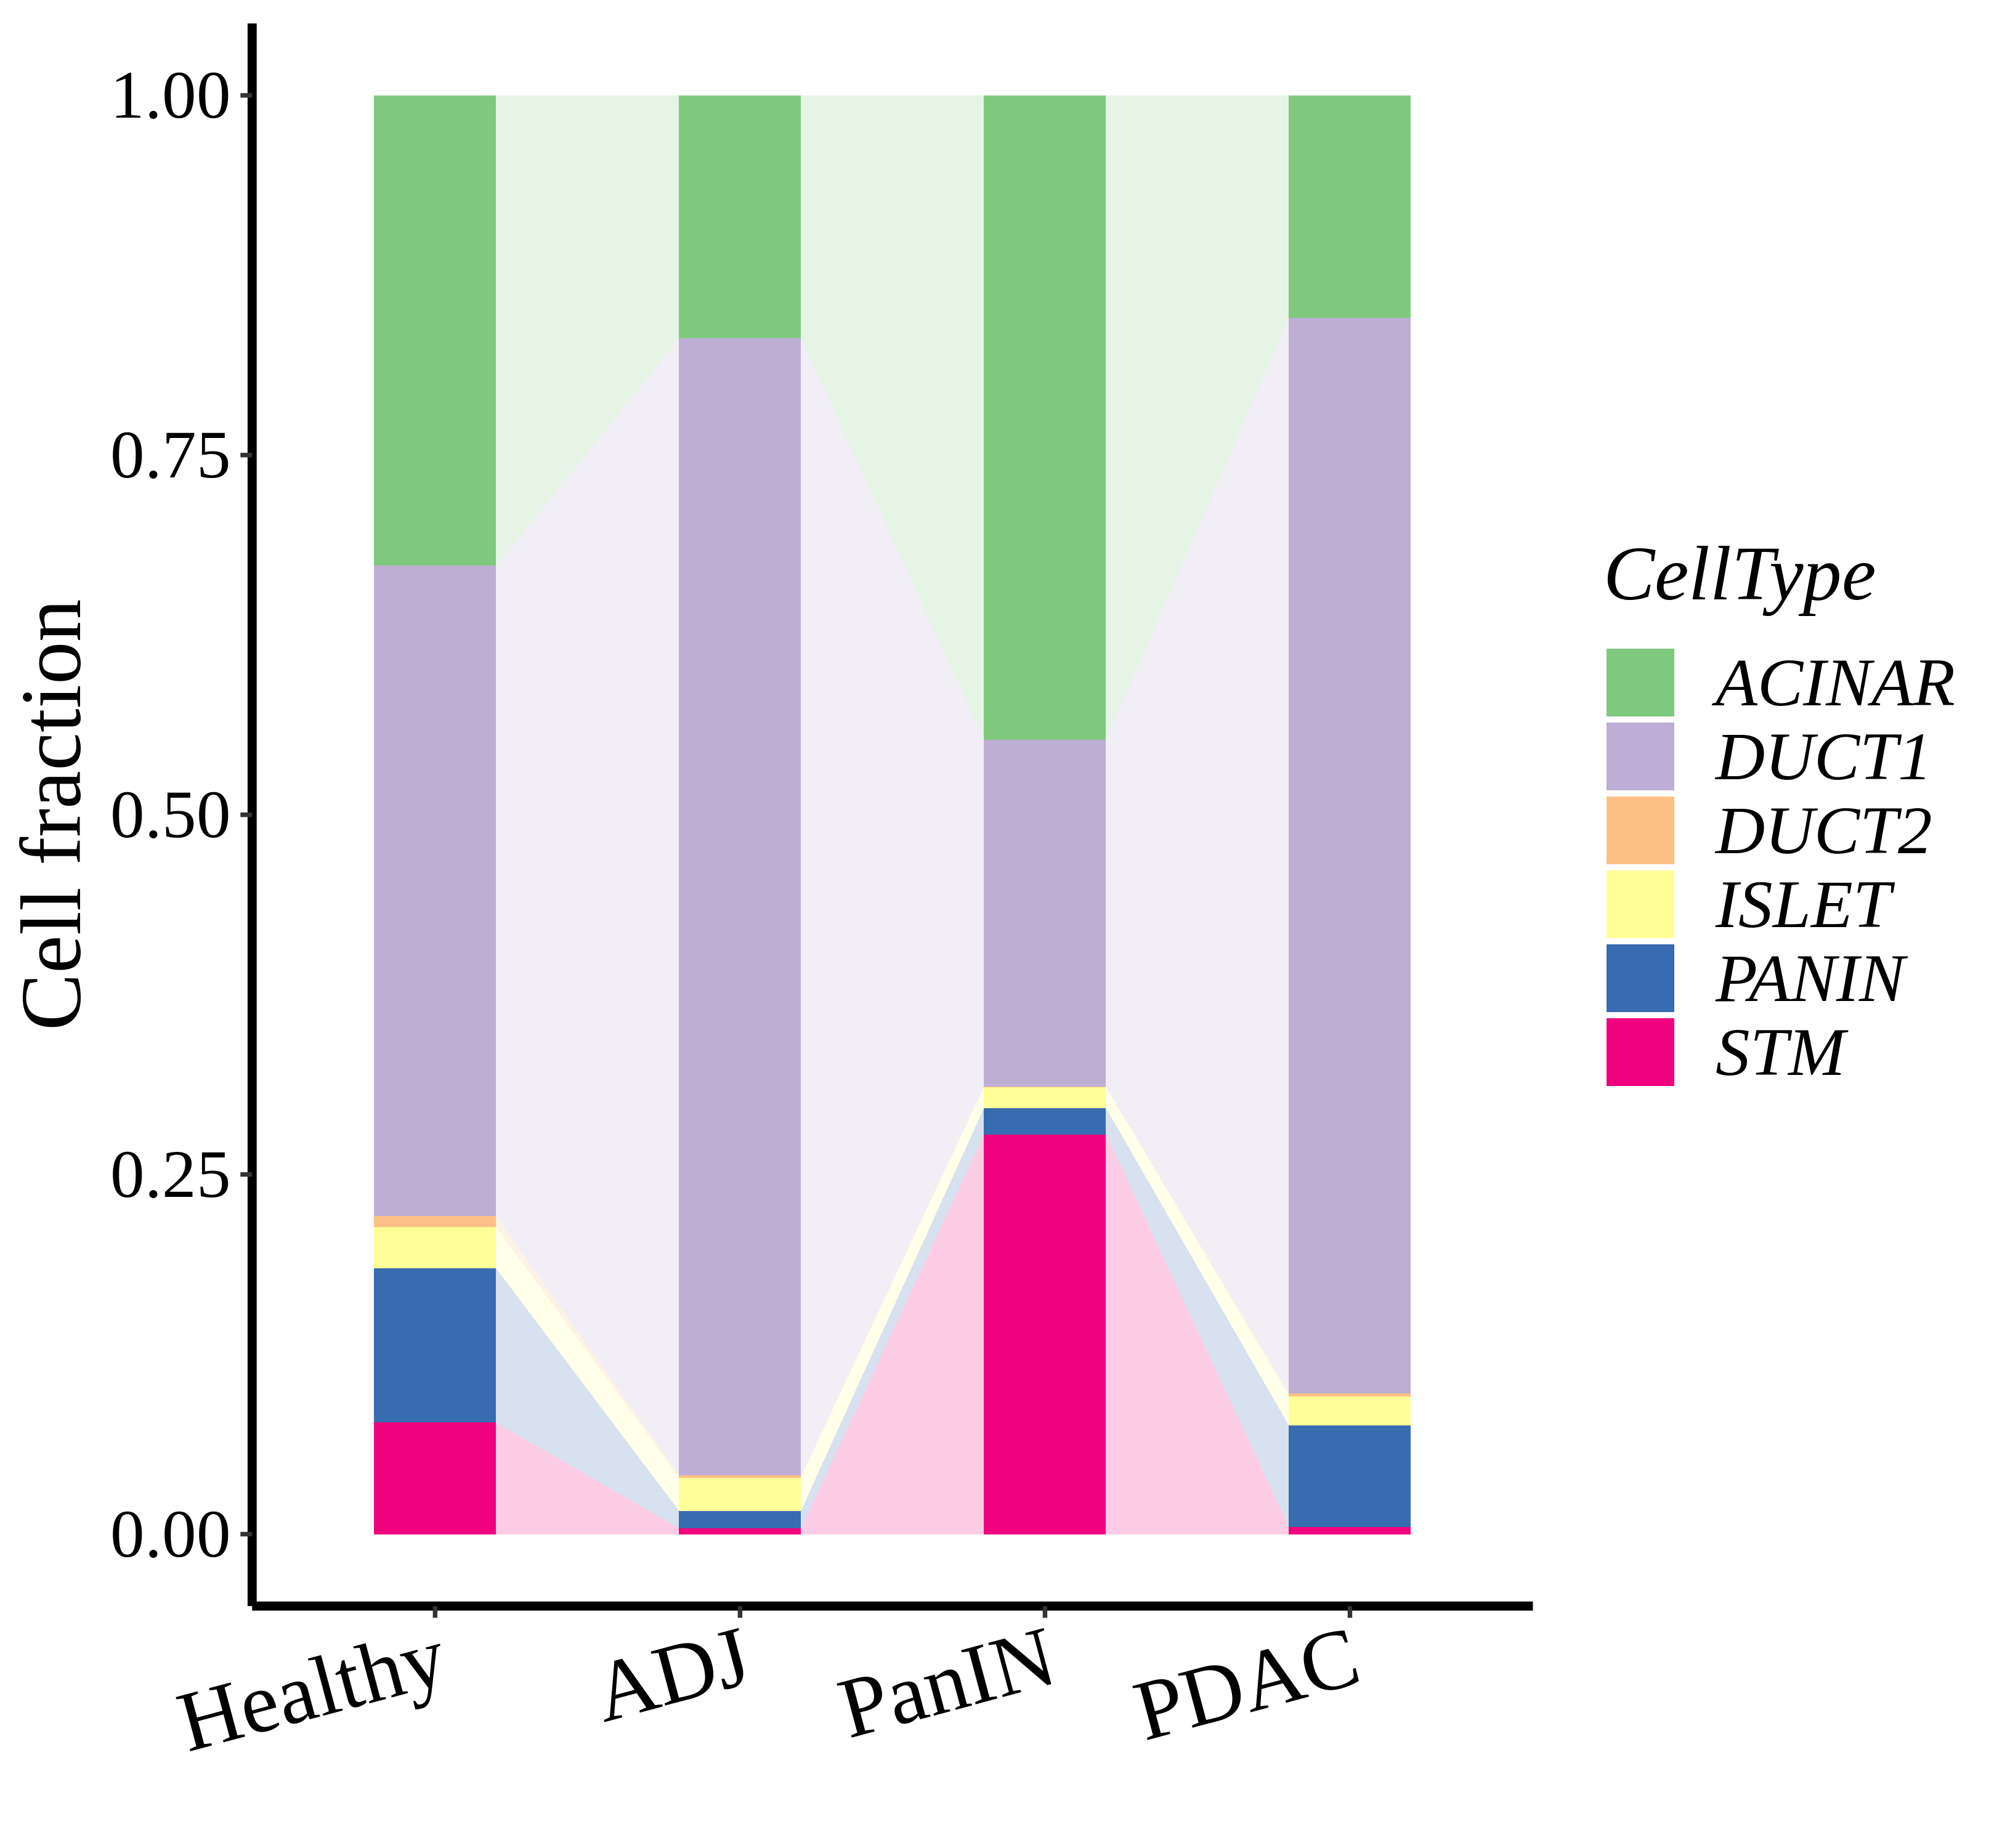
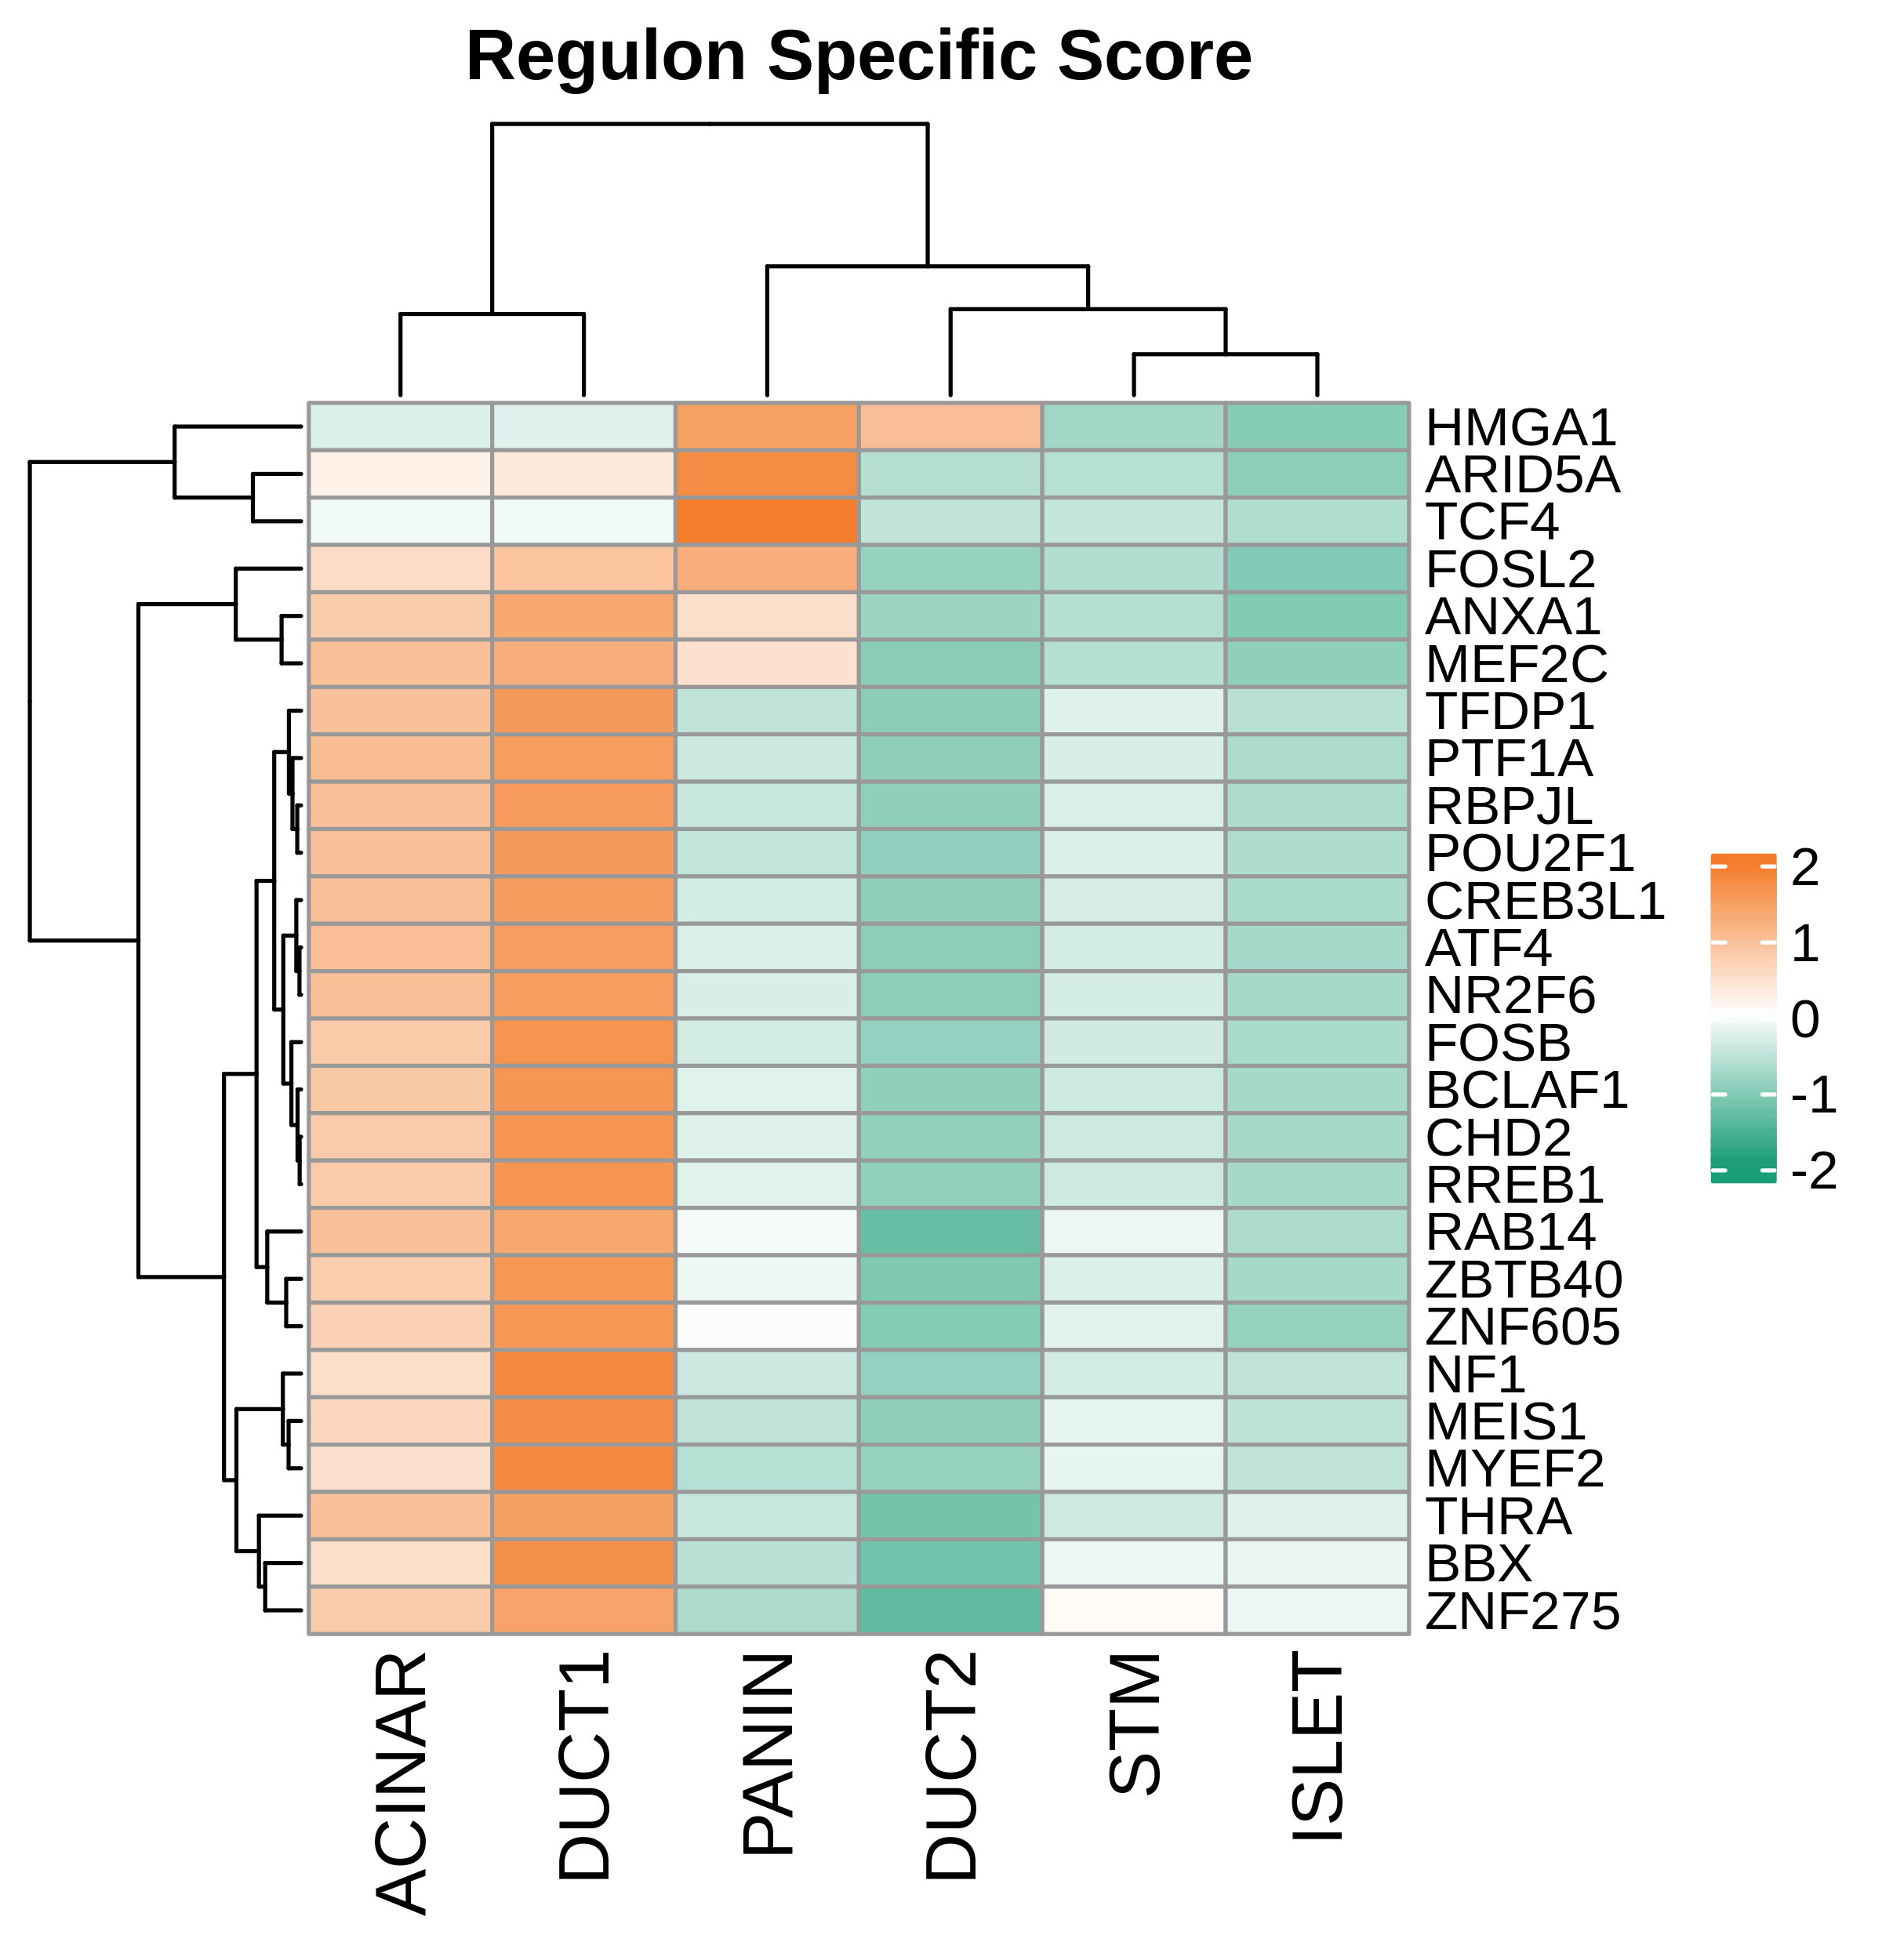
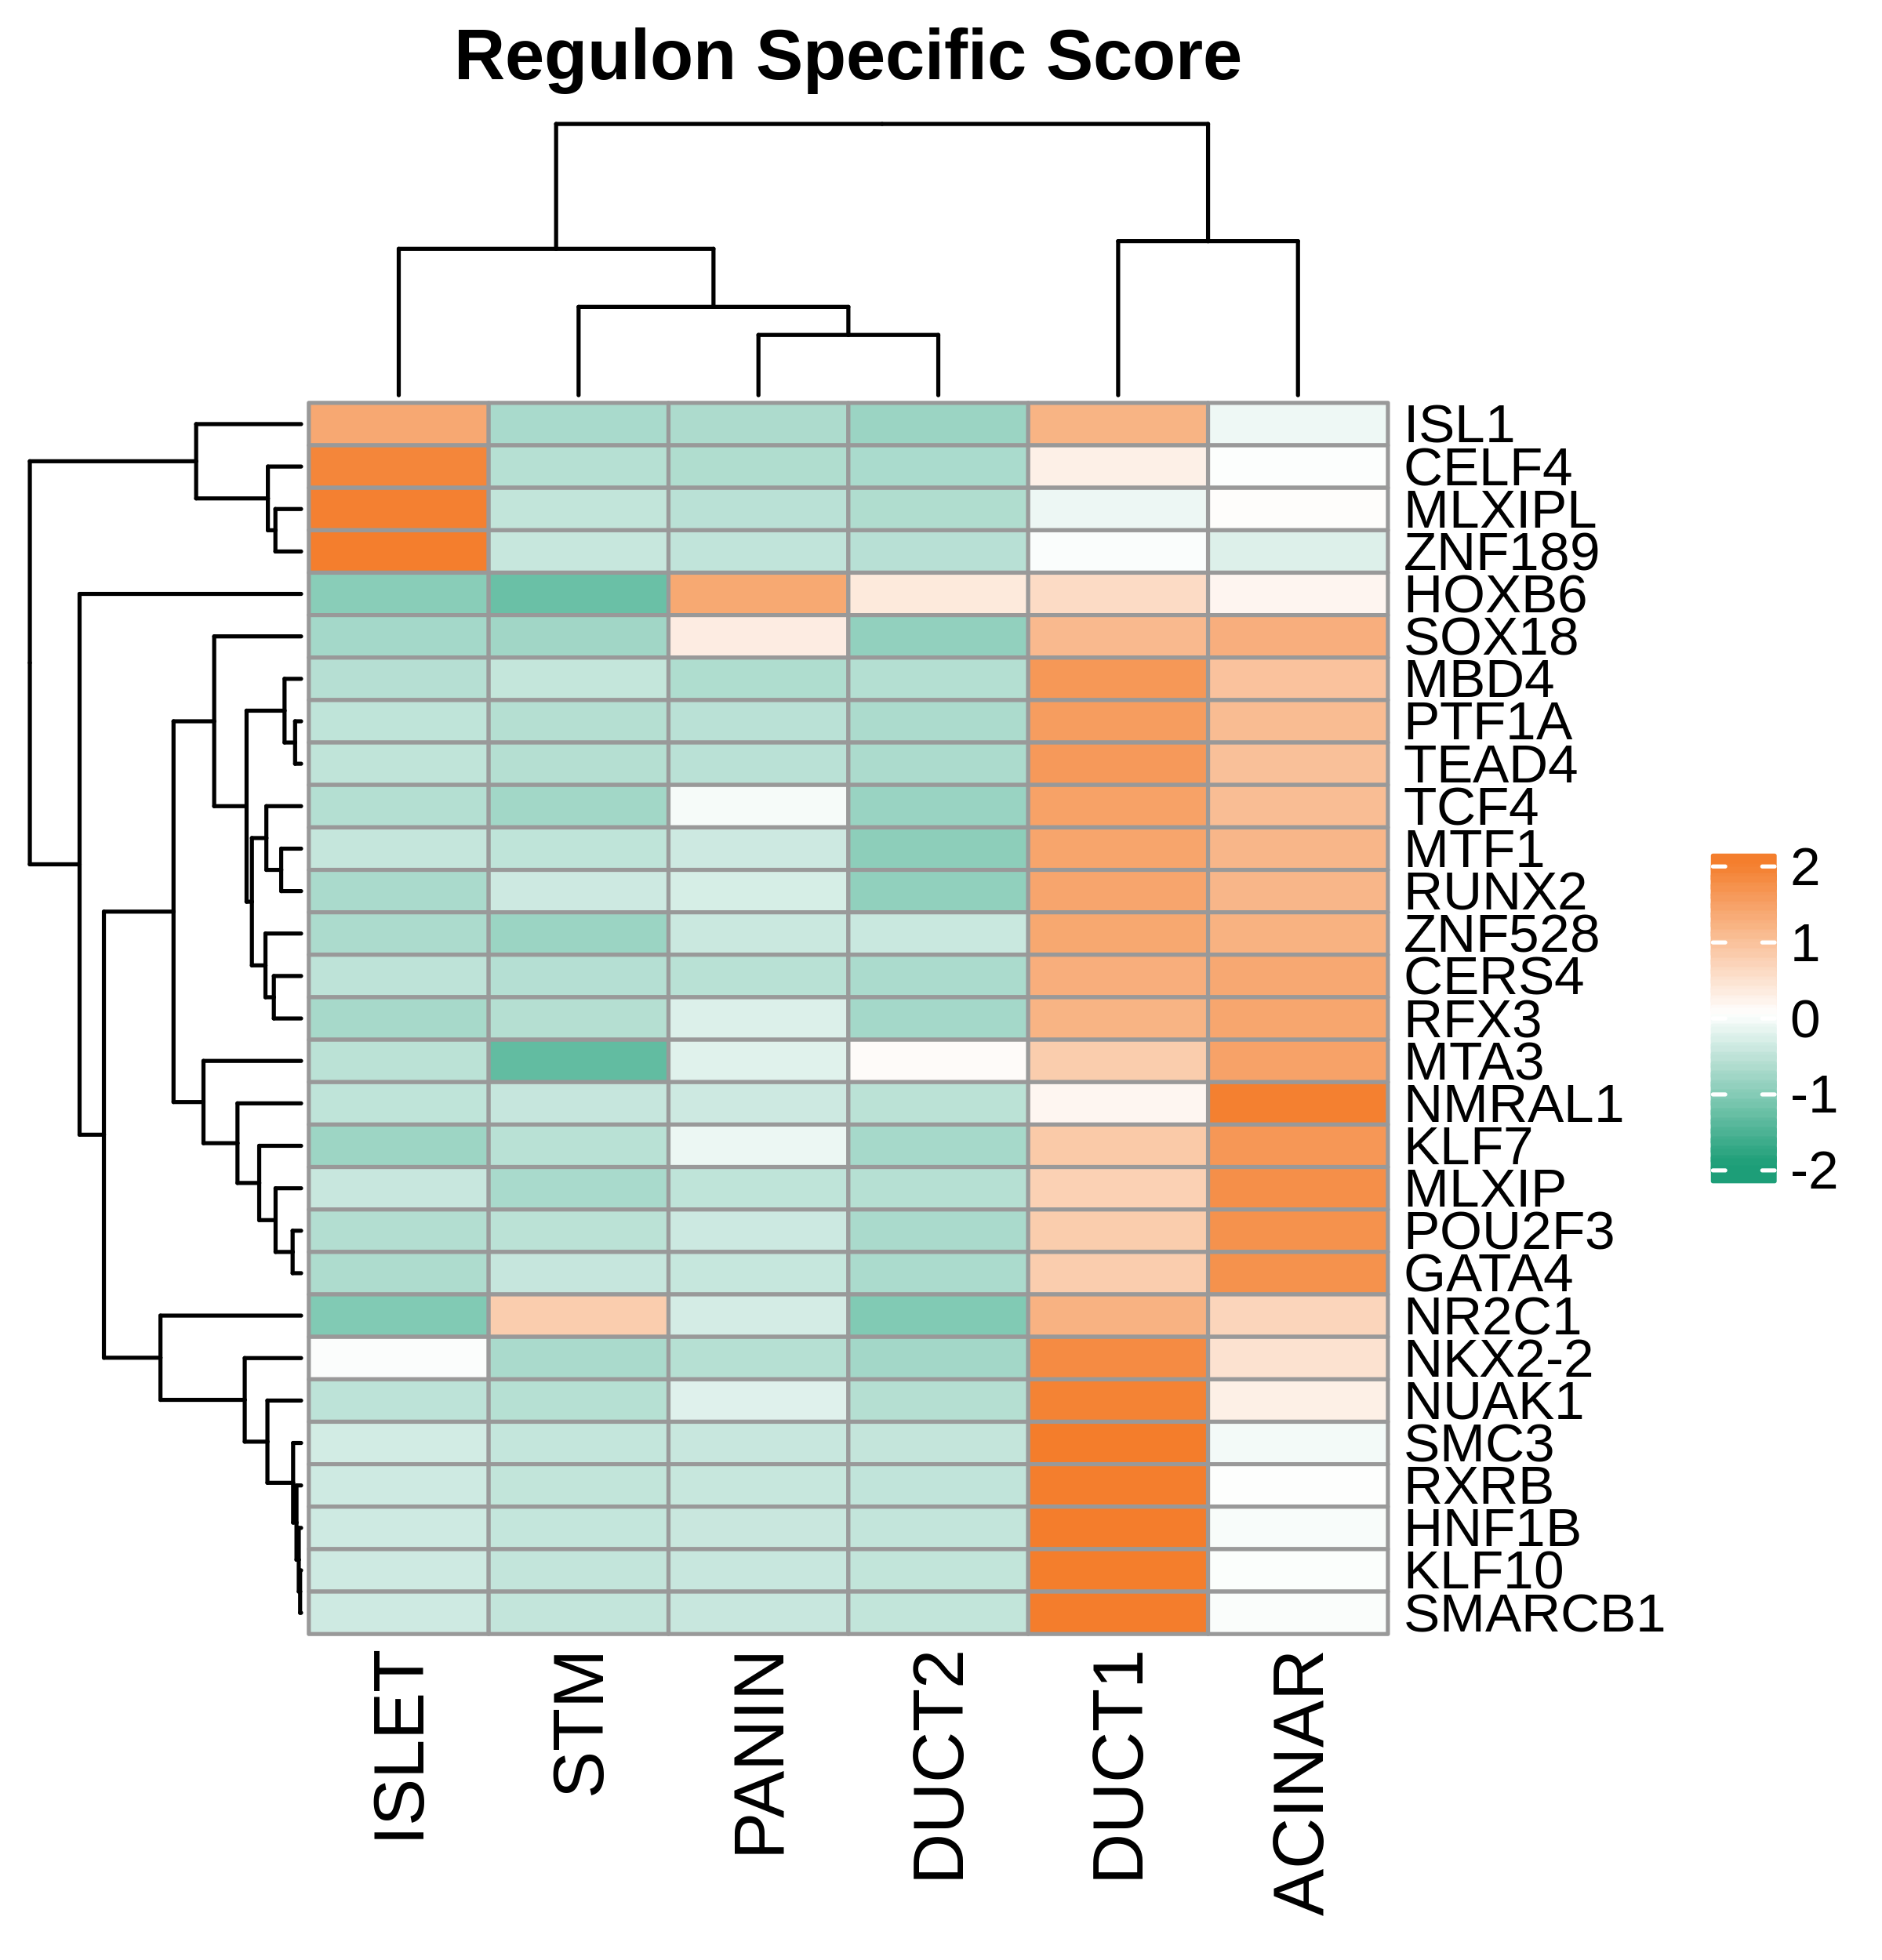
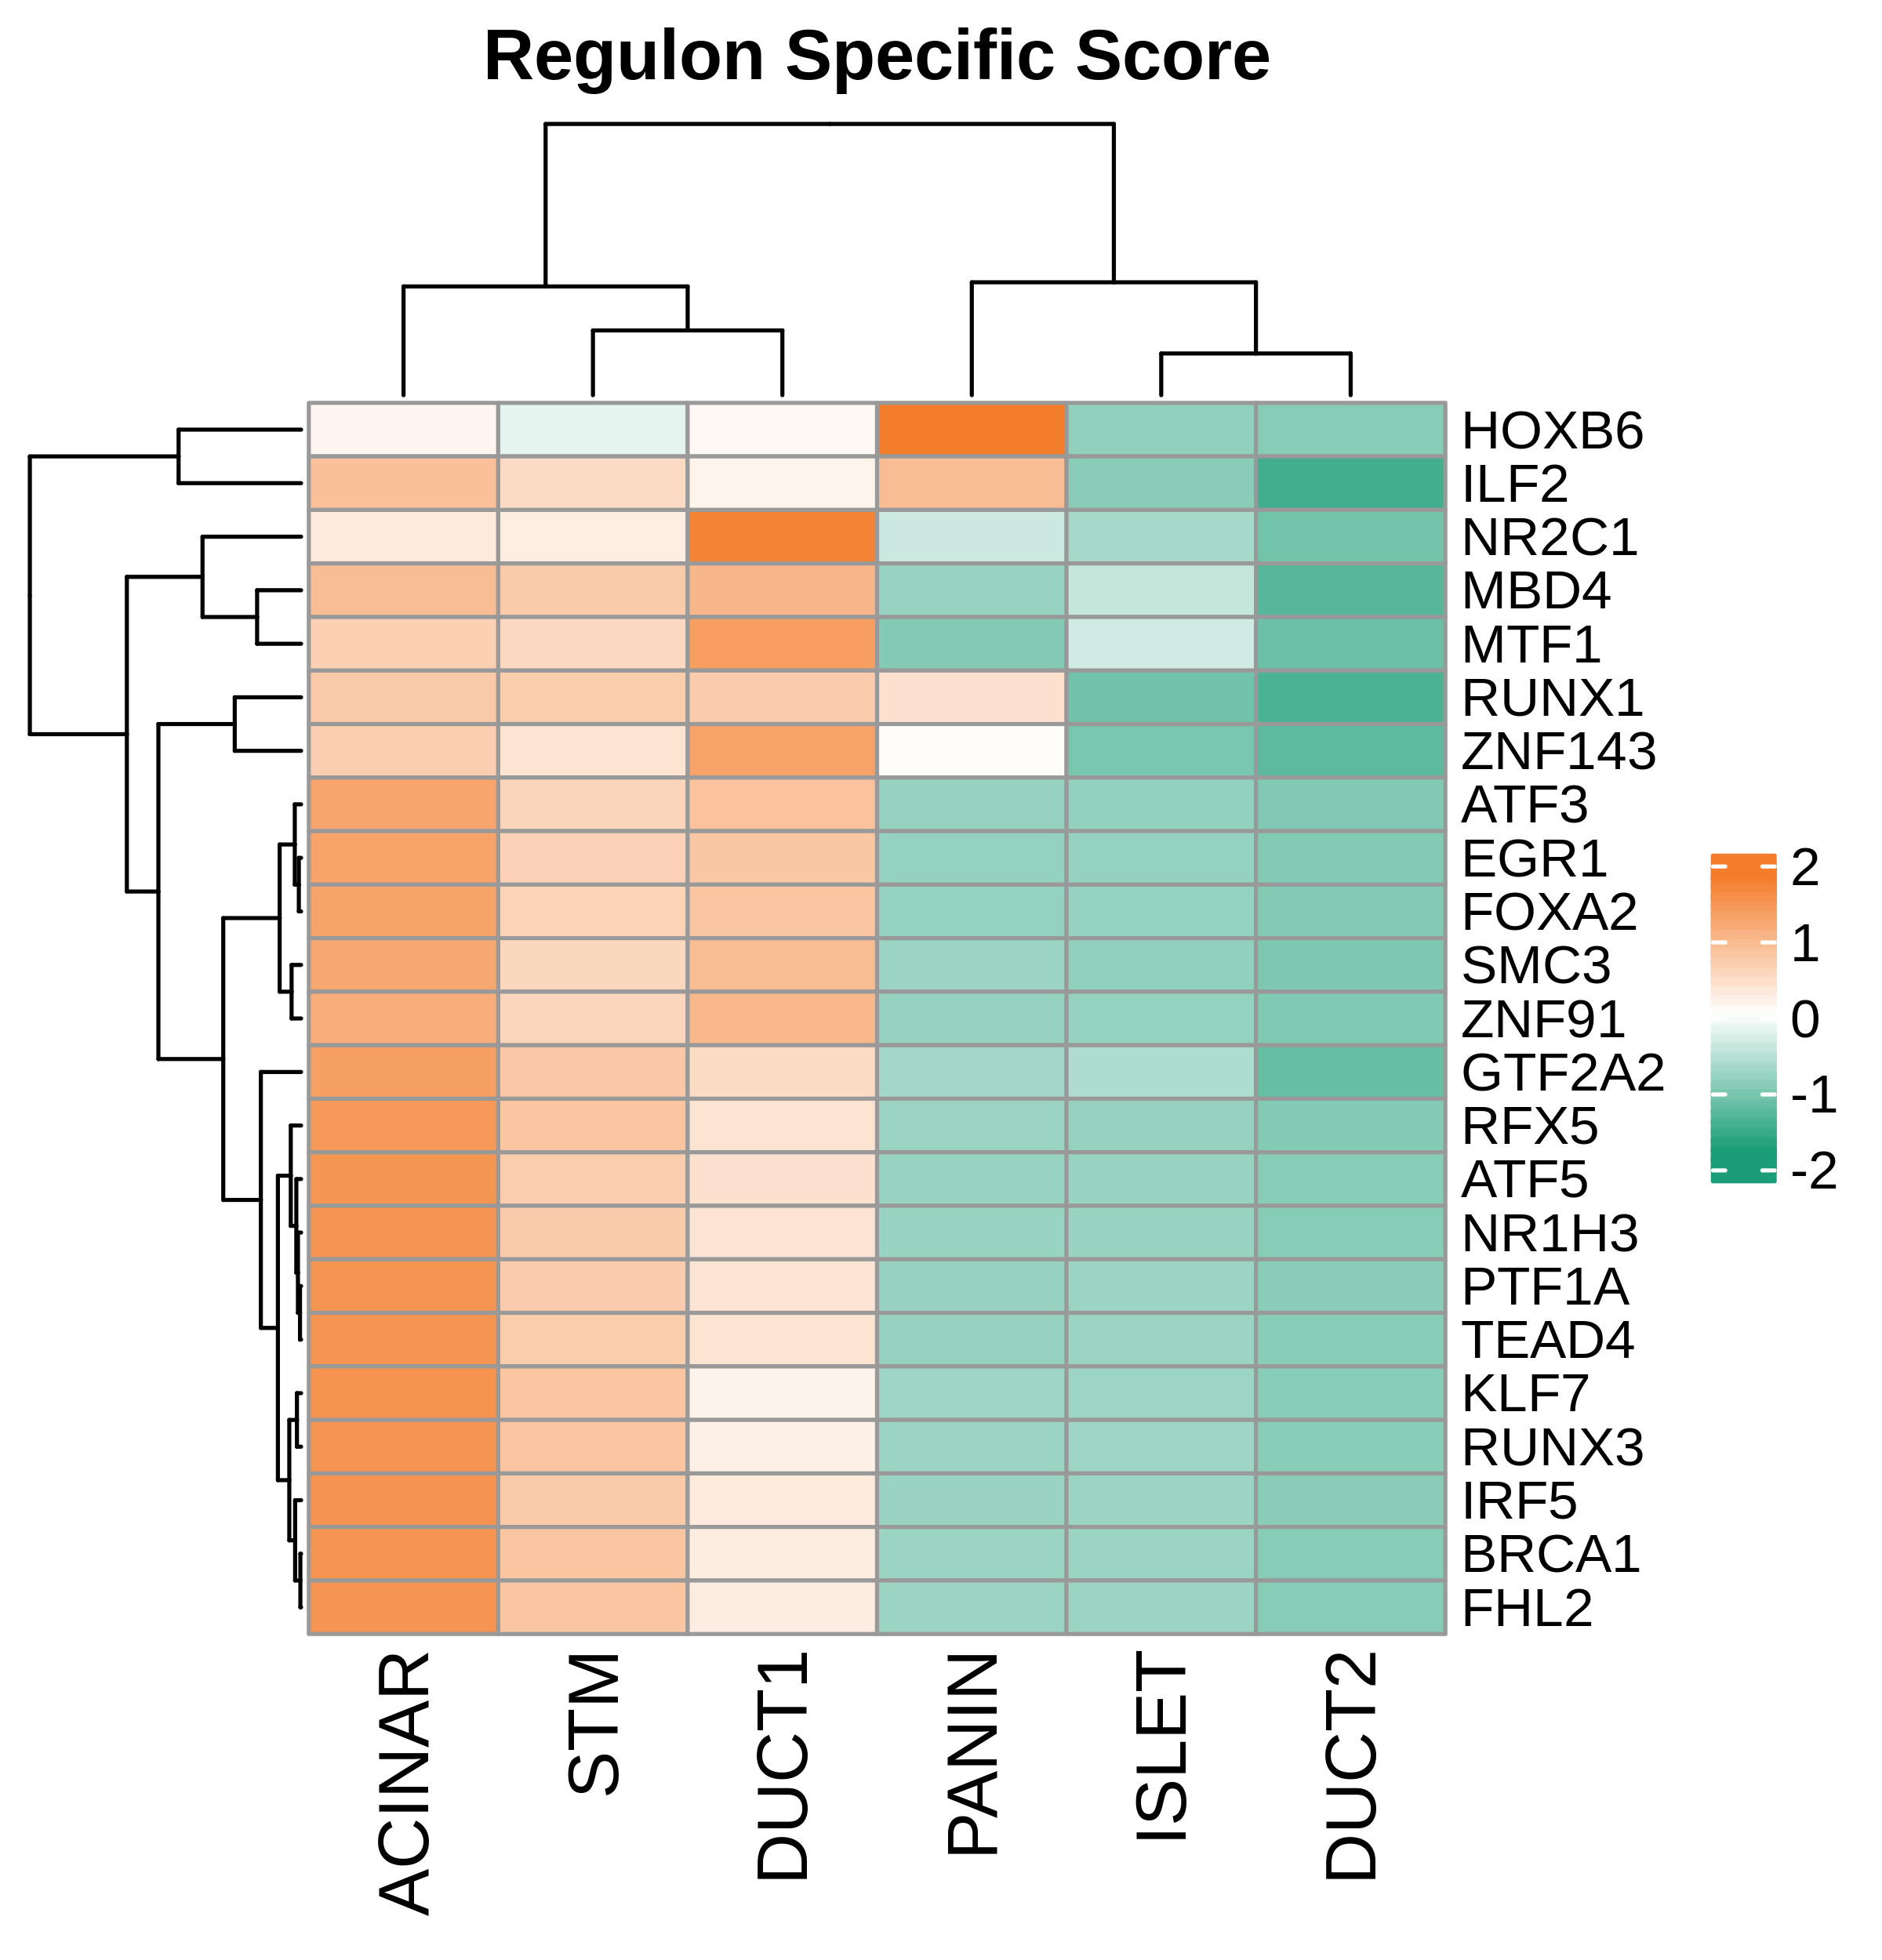
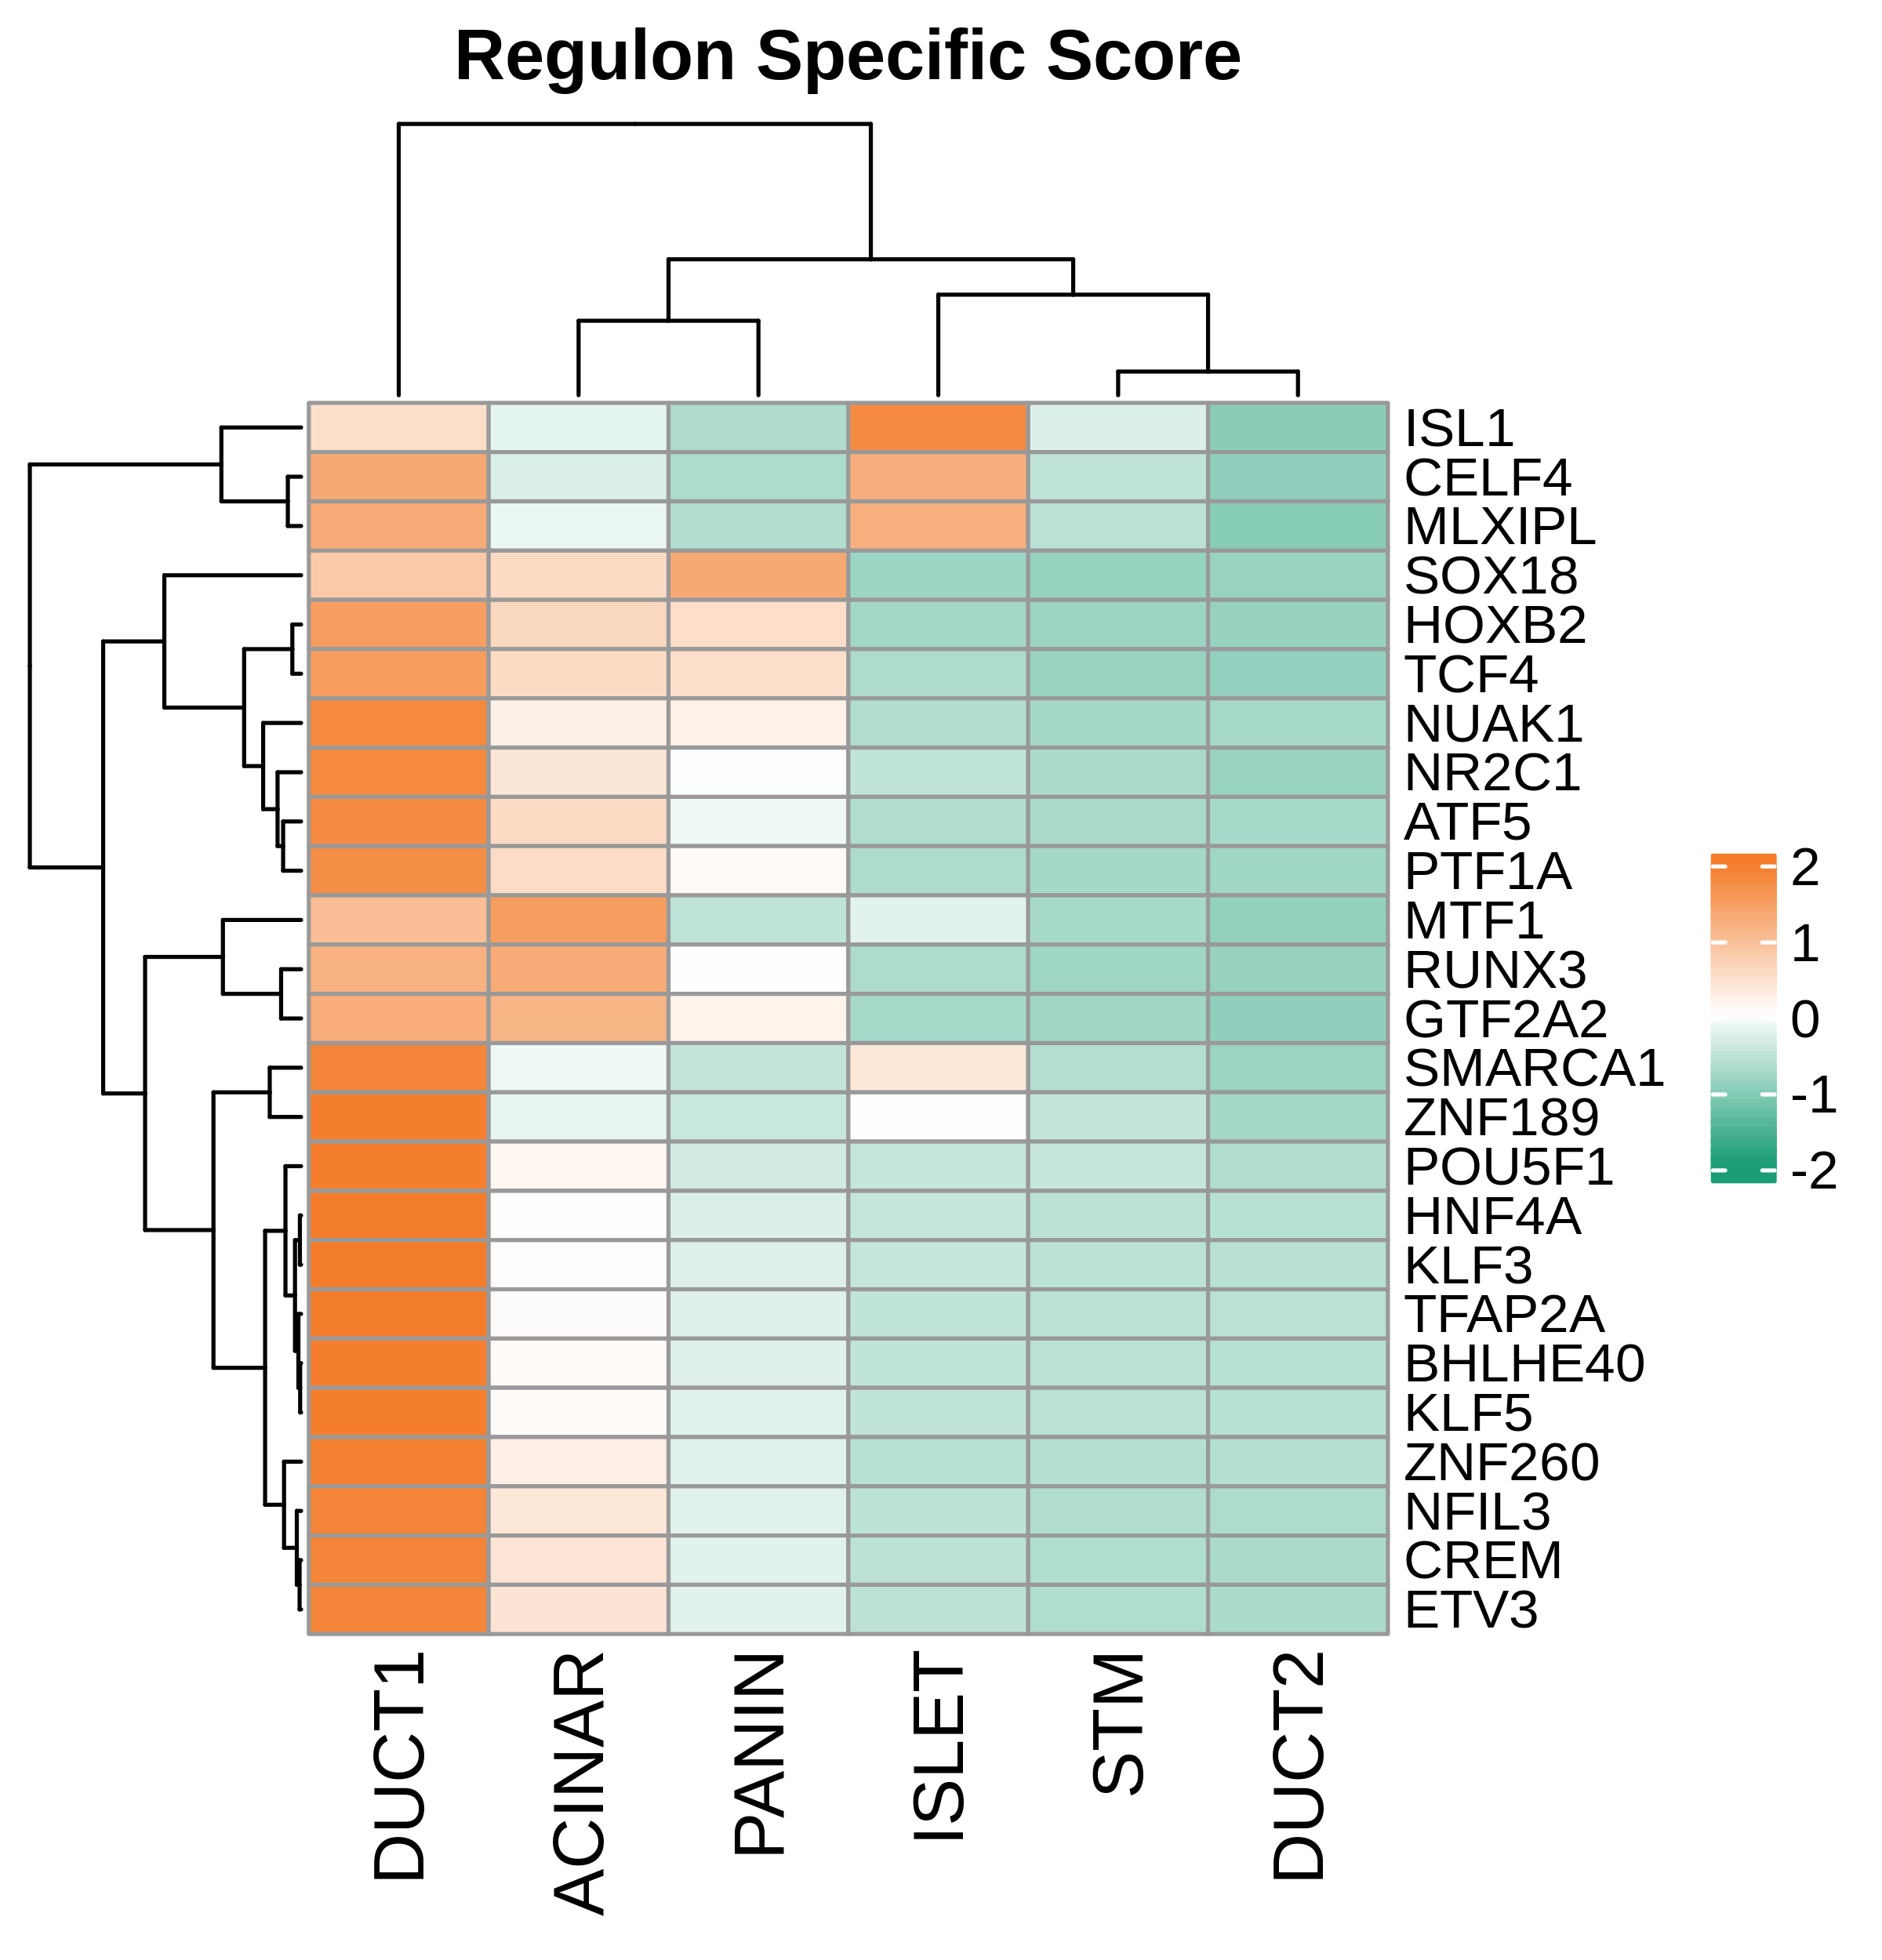
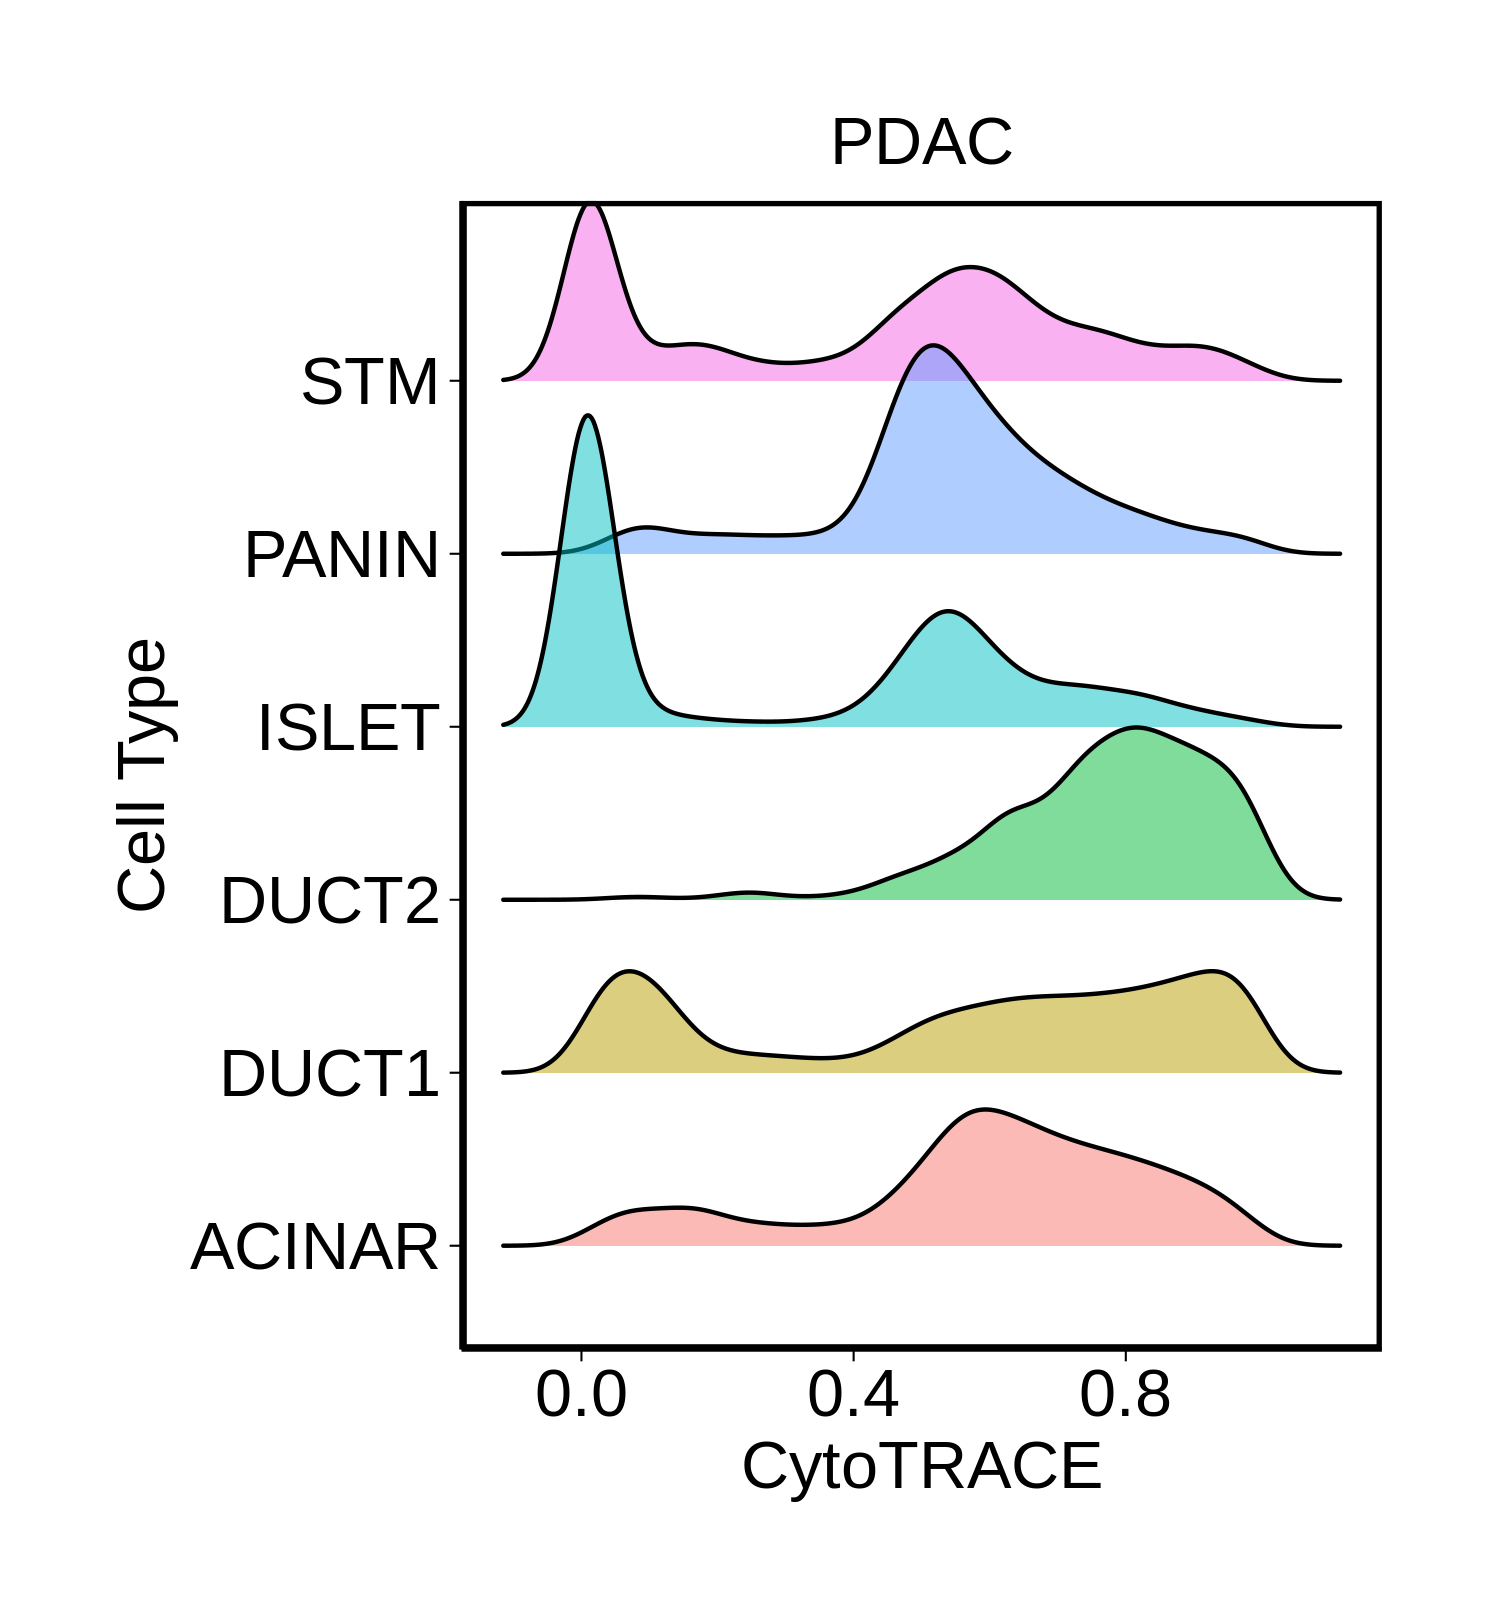
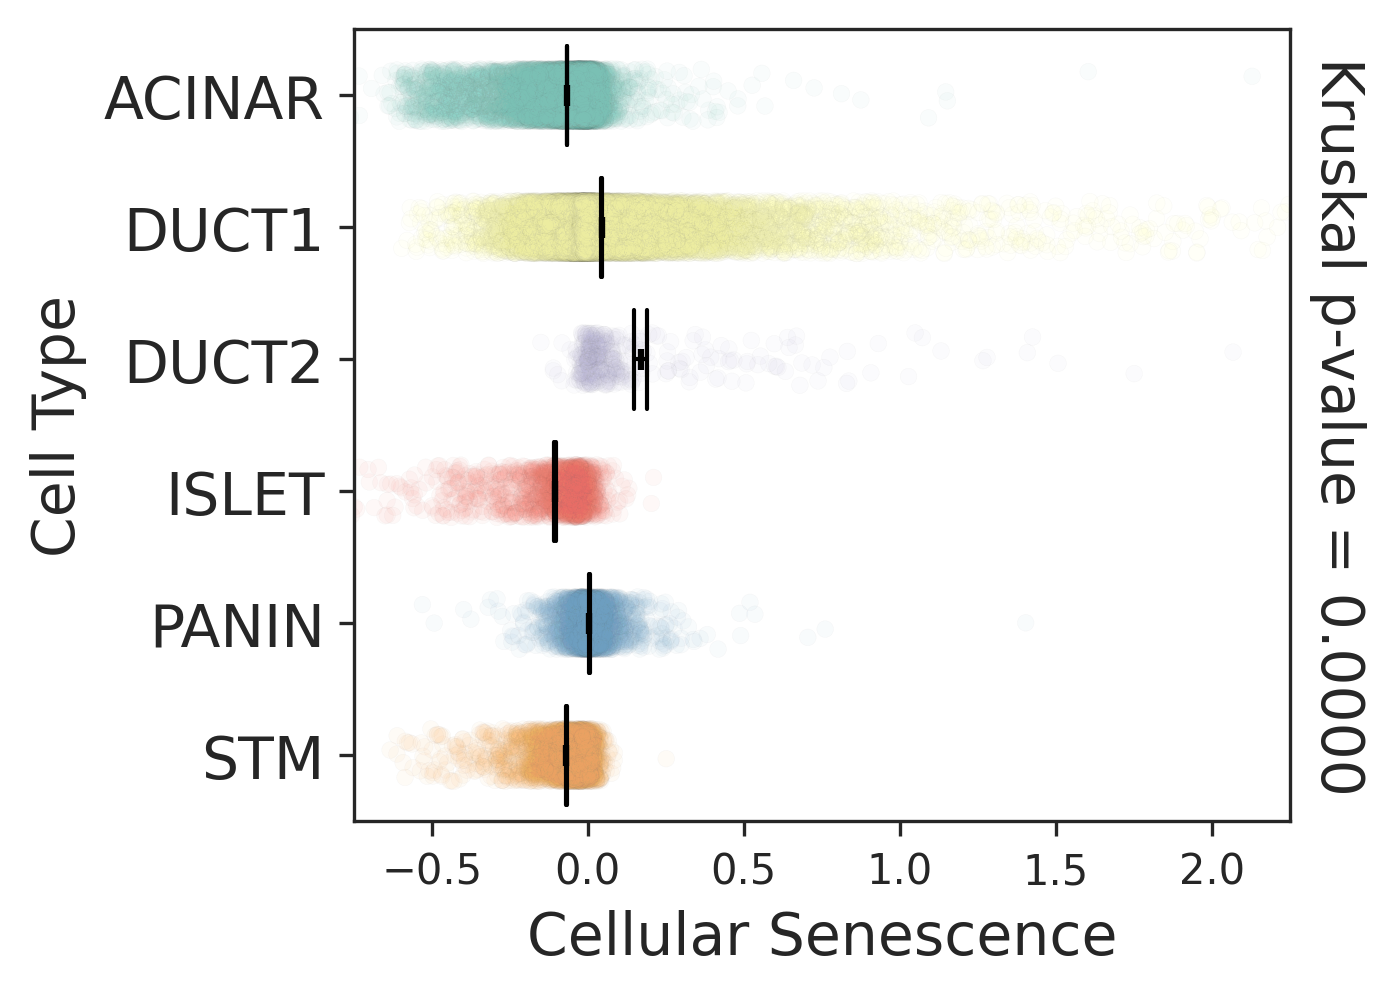
| Pancreas | Epi | DUCT1 | Duct-like1 cells | CFTR,BICC1,SLC4A4,GLIS3,SCTR,AMBP,FXYD2,ANXA4,SPP1,SOX9,FOS,JUN |
| Pancreas | Epi | ACINAR | Acinar cells | SPINK1,CLPS,CPB1,CPA1,PRSS3,PRSS1,AMY2A,AMY2B,CELA2B,CELA3A,CELA3B,SYCN,PNLIP,CTRC,CPA2 |
| Pancreas | Epi | ISLET | Pancreatic islet cells | INS,GCG,SST,GHR,PPY,GCK,PCSK1,PCSK2,CHGA,CHGB,SYP,KCNJ11 |
| Pancreas | Epi | PANIN | PanIN-like cells | MUC5AC,CXCL12,ITGA5,ITGA1,TIMP3,KLF4,IGFBP4,IGFBP7,COL1A1,COL1A2,COL3A1,COL4A1,REG4 |
| Pancreas | Epi | STM | Stem-like cells | EPCAM,CD24,ANPEP,SOX9,CD44,PDX1,ALDH1A1,PROM1,MET |
| Pancreas | Epi | DUCT2 | Duct-like2 cells | CRP,MUC5B,ONECUT2,CRISP3,TFF3 |
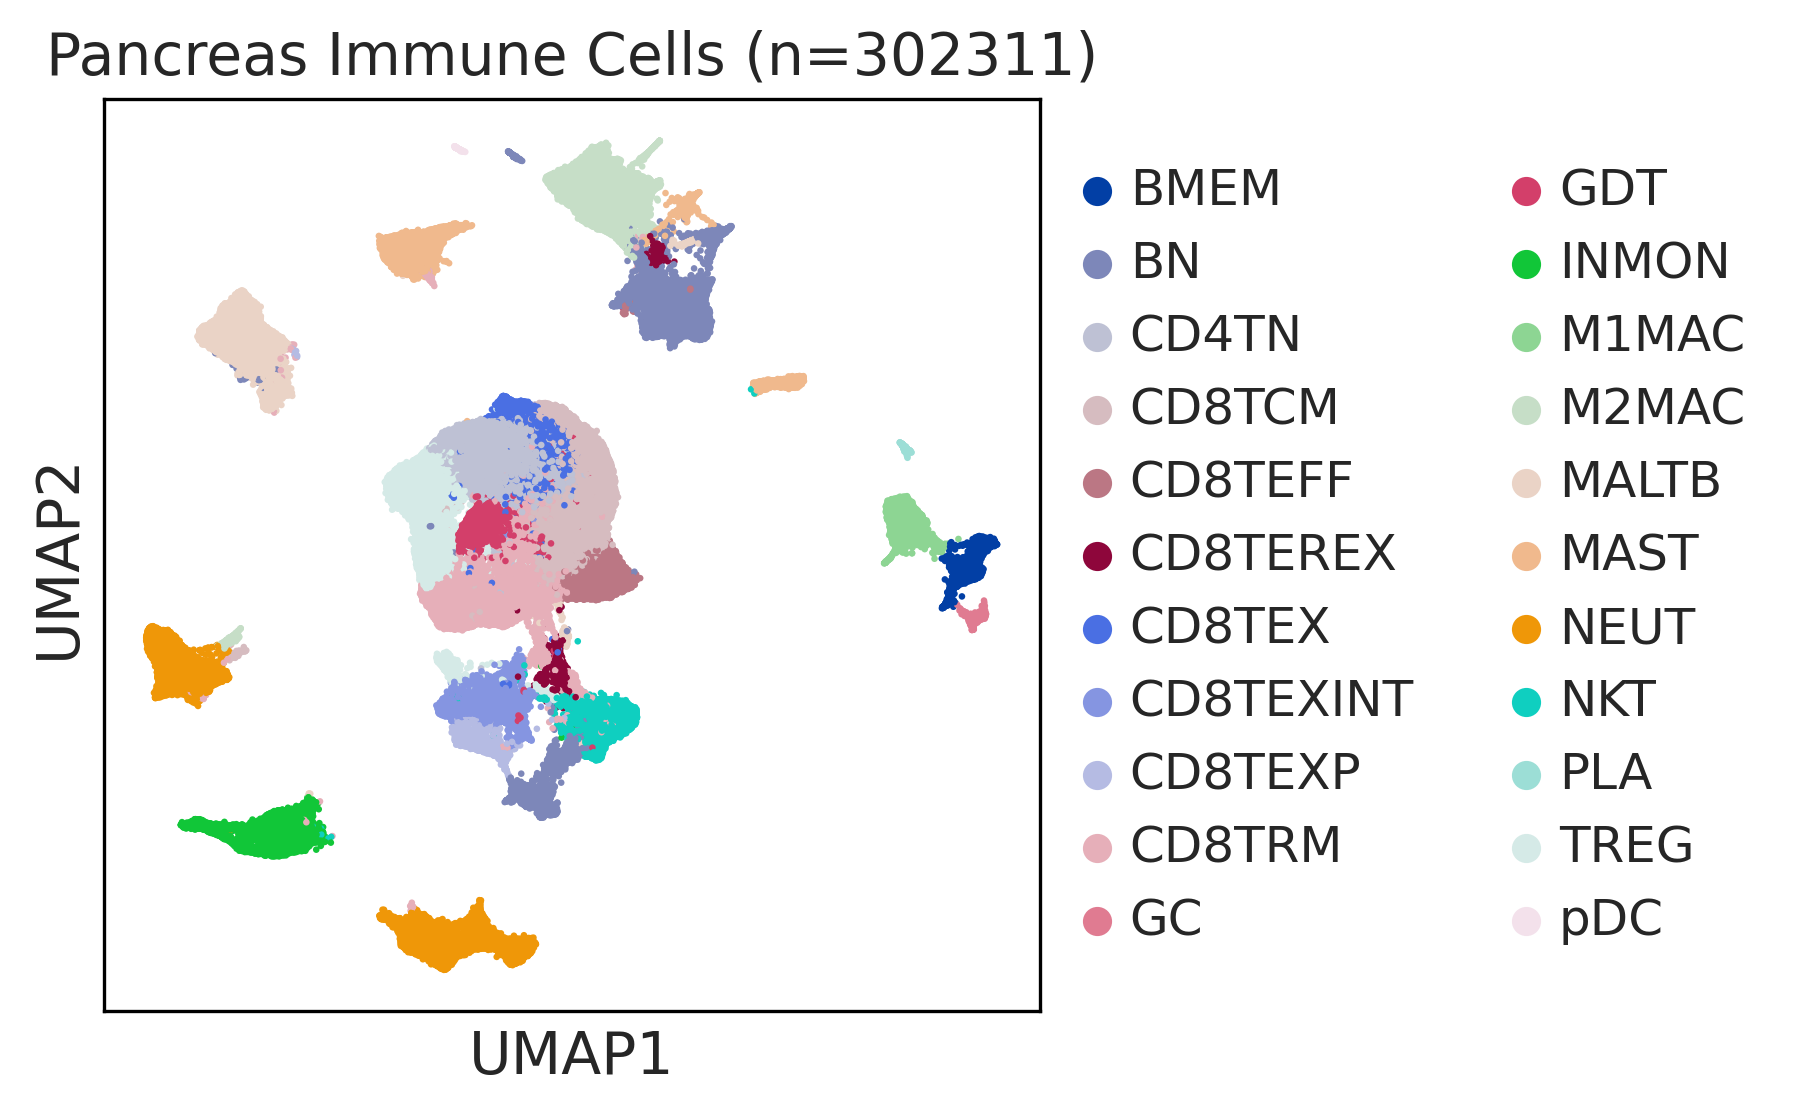
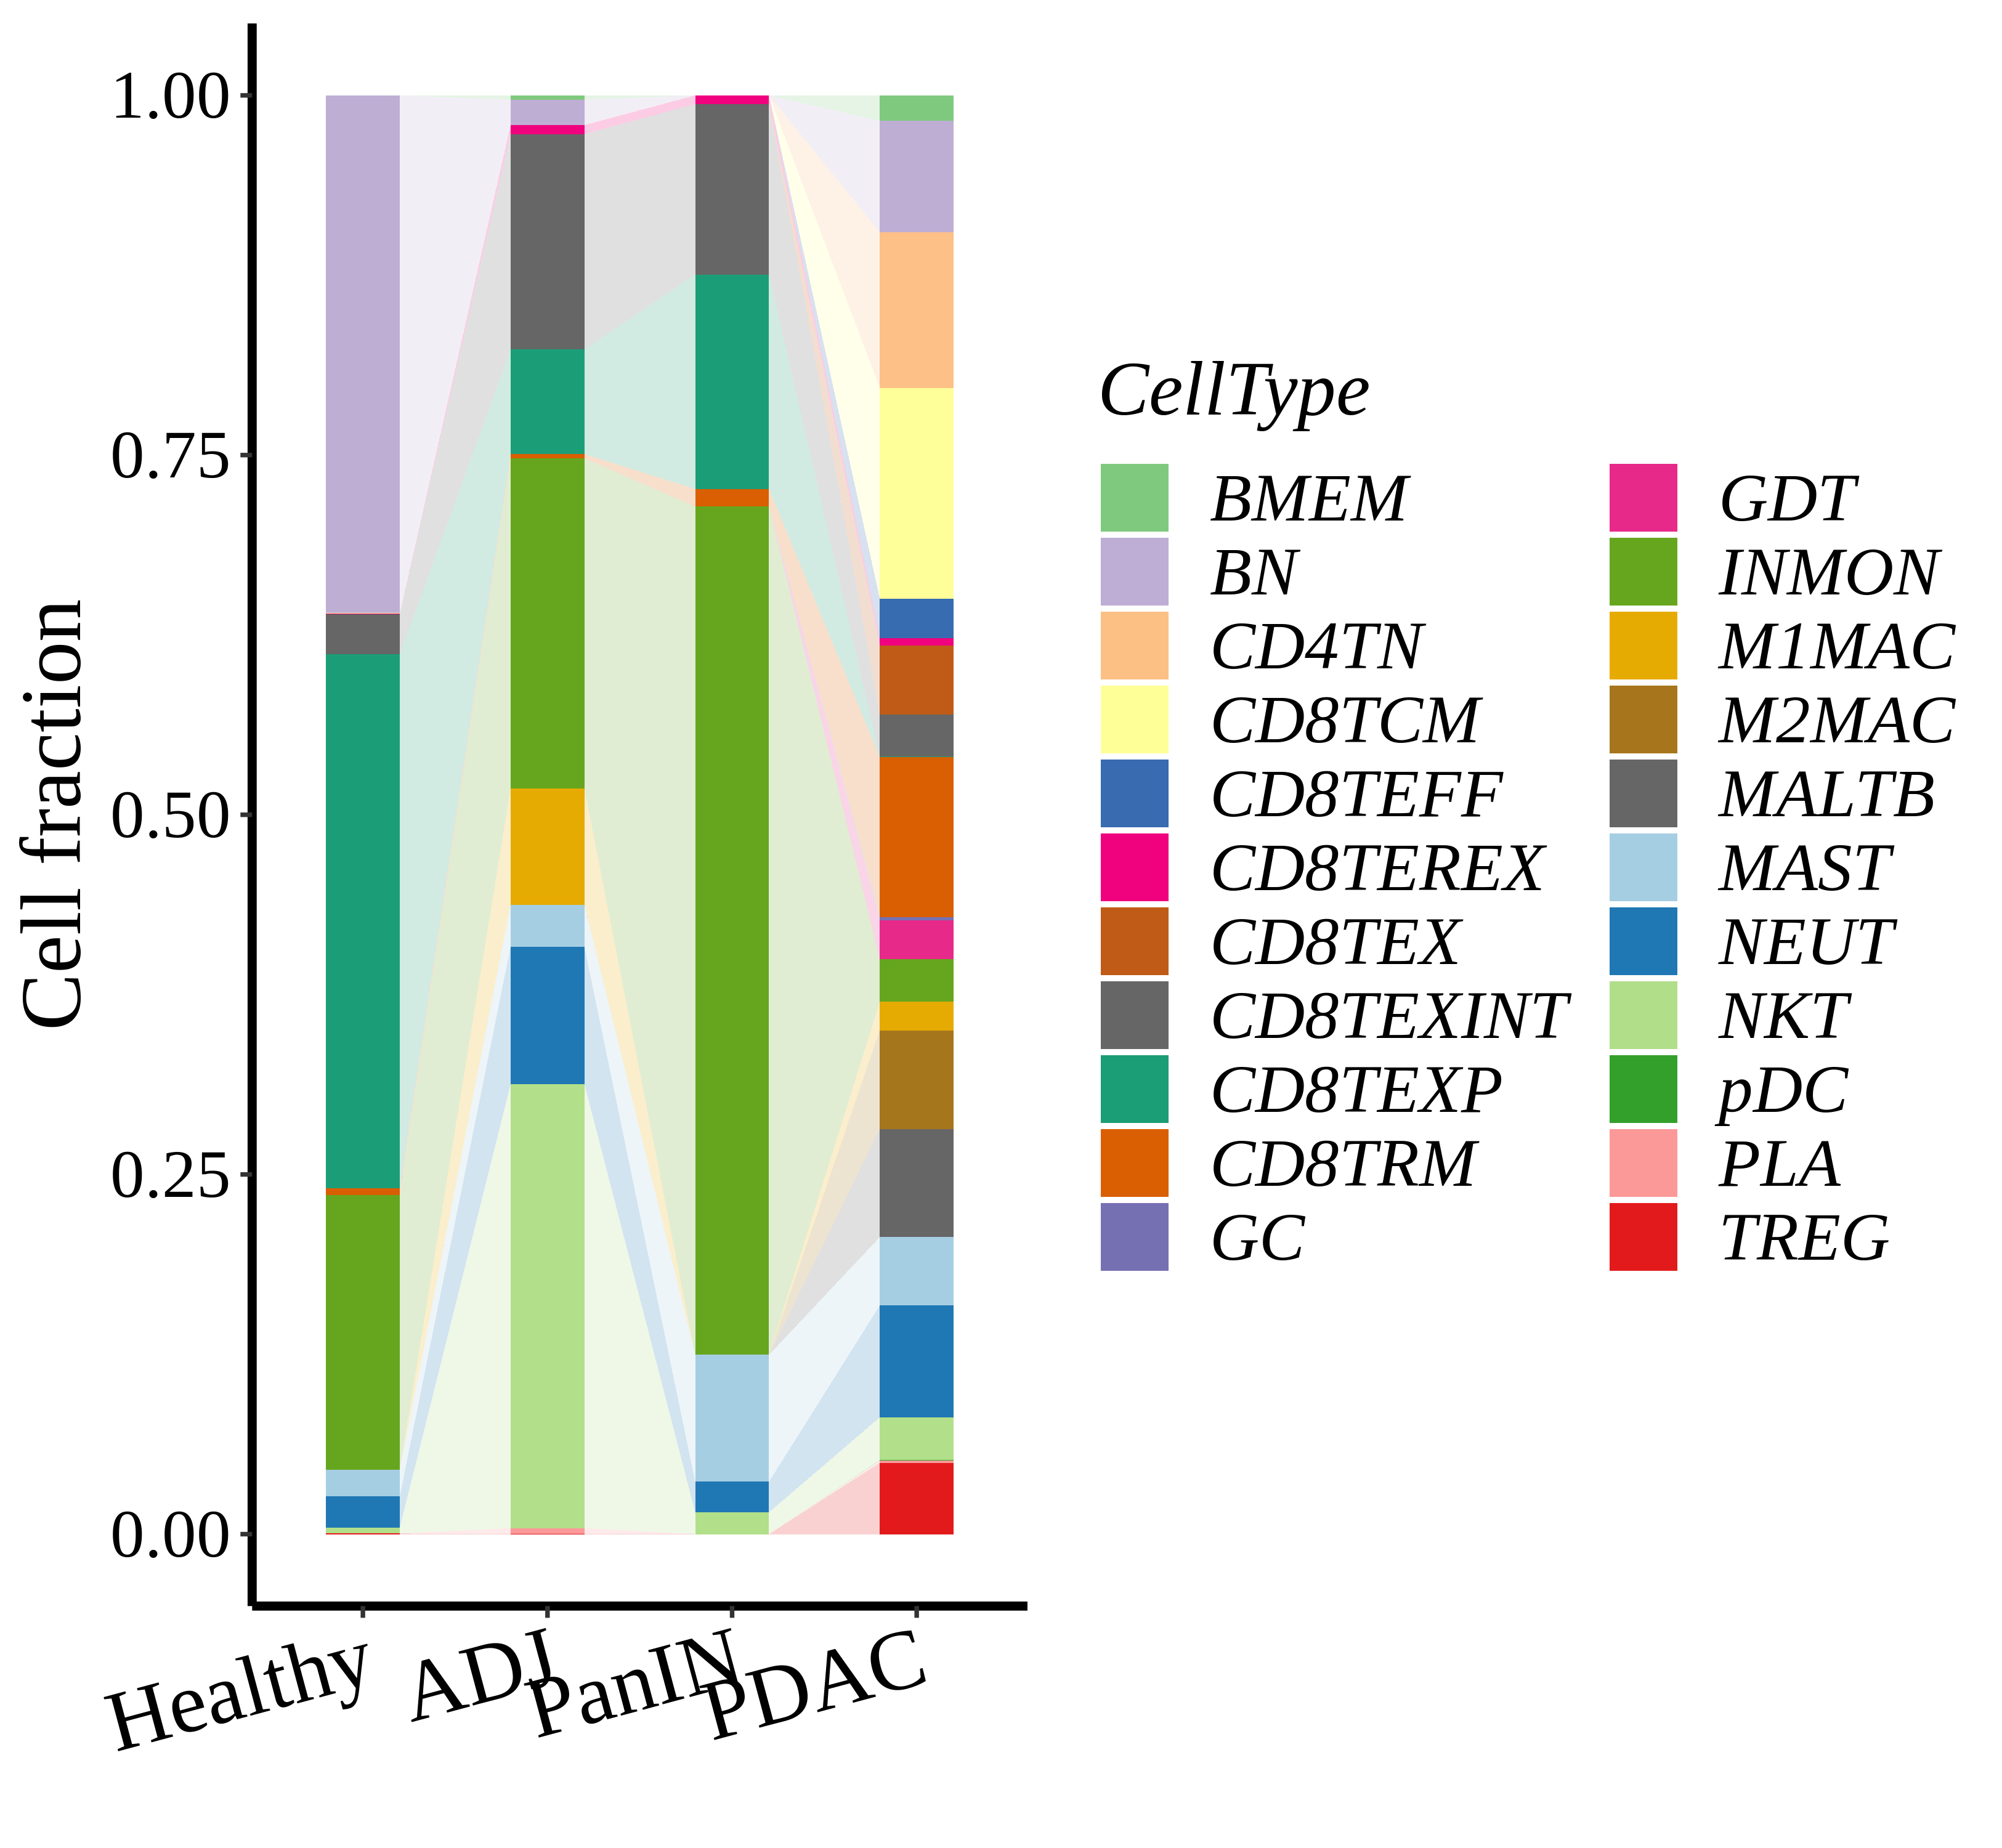
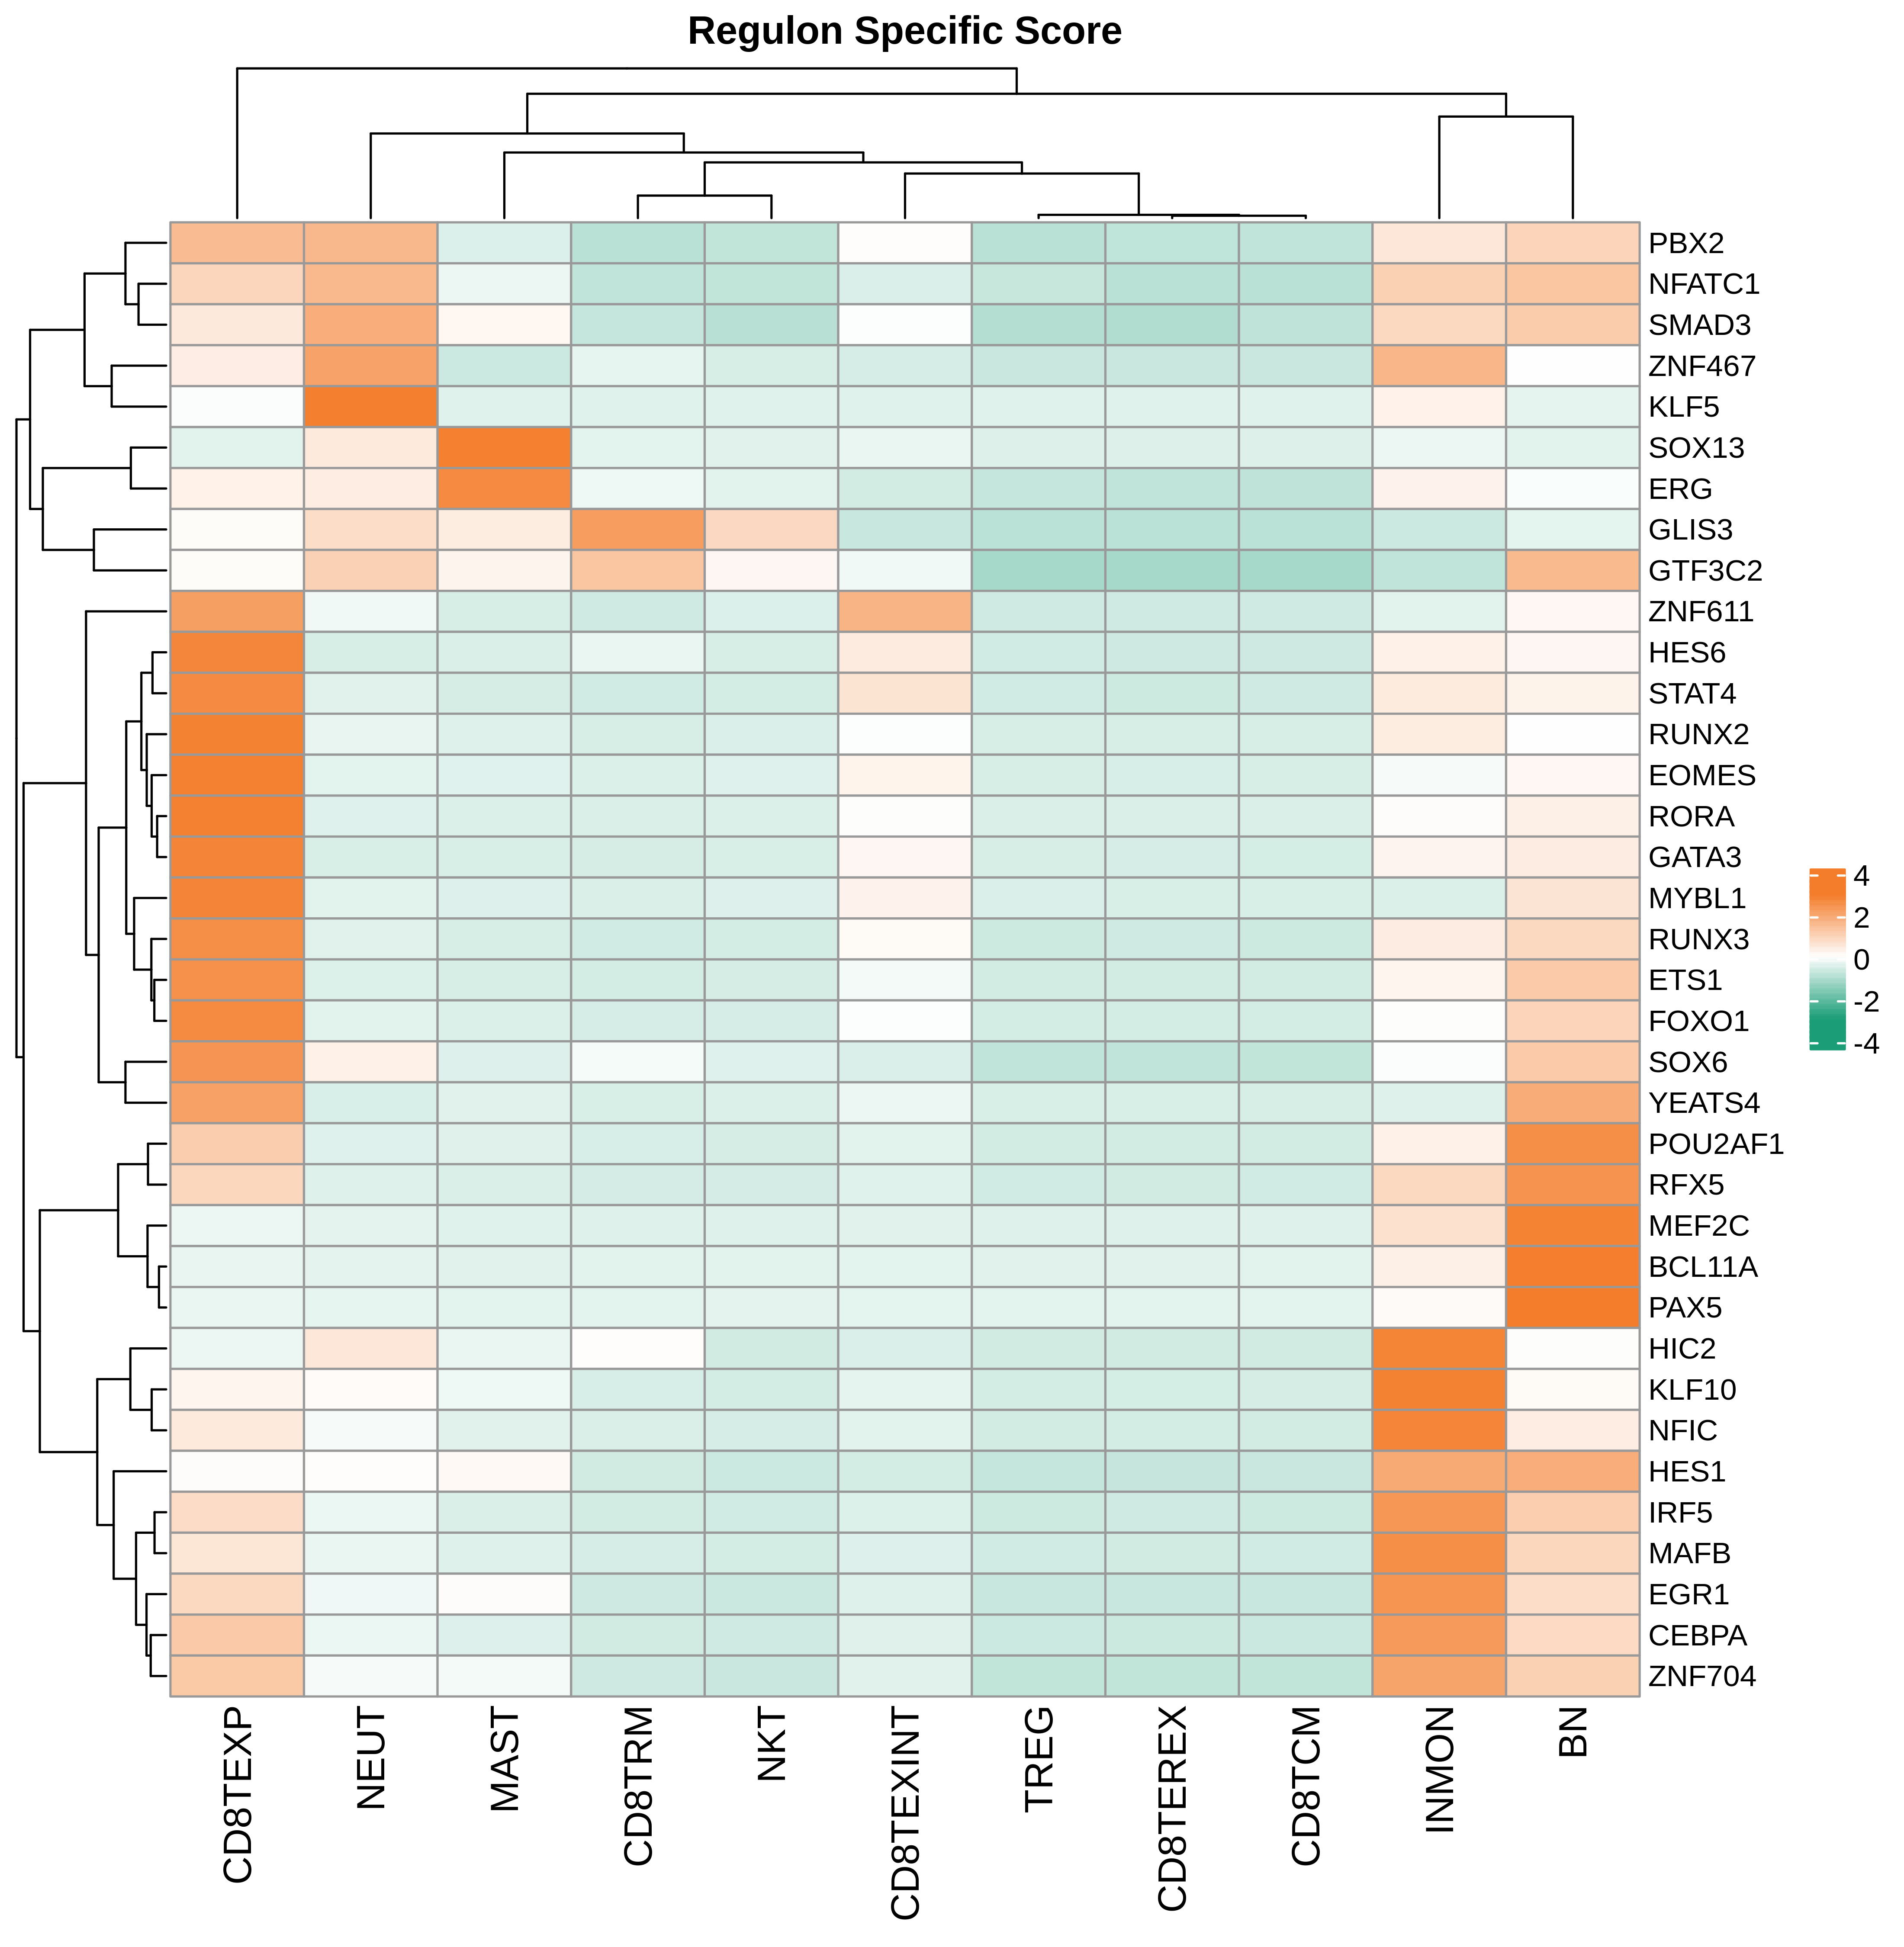
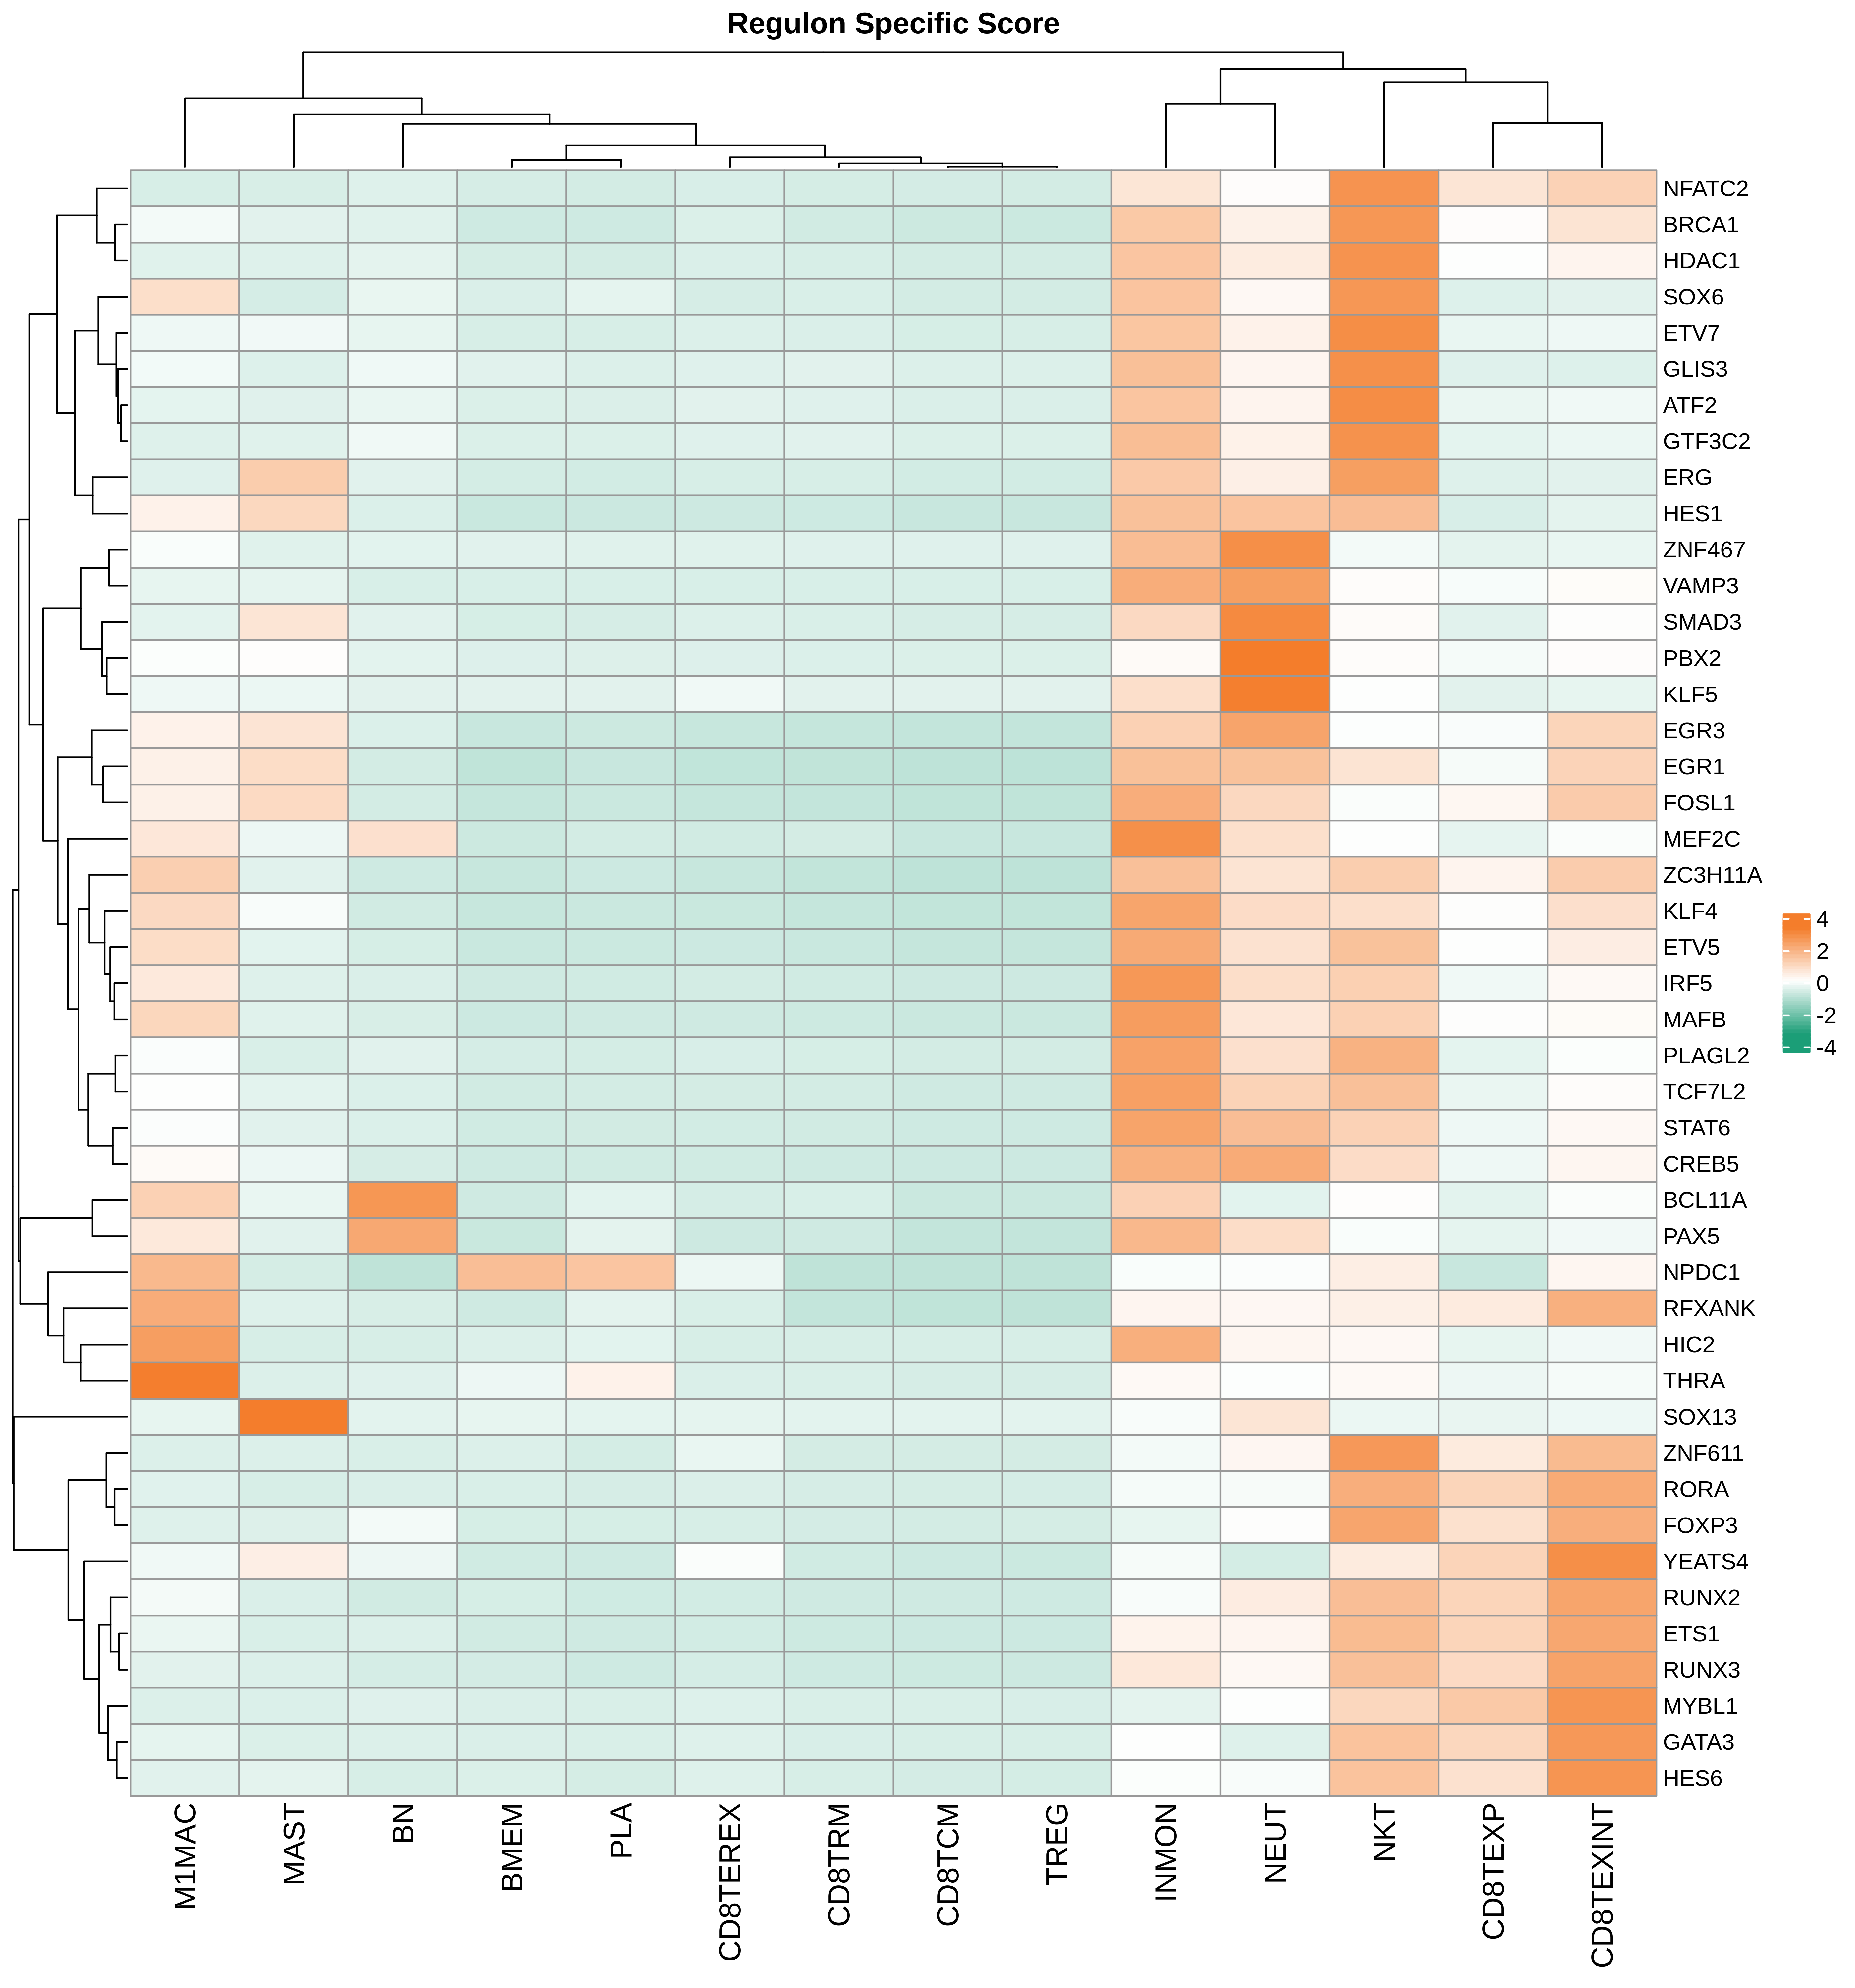
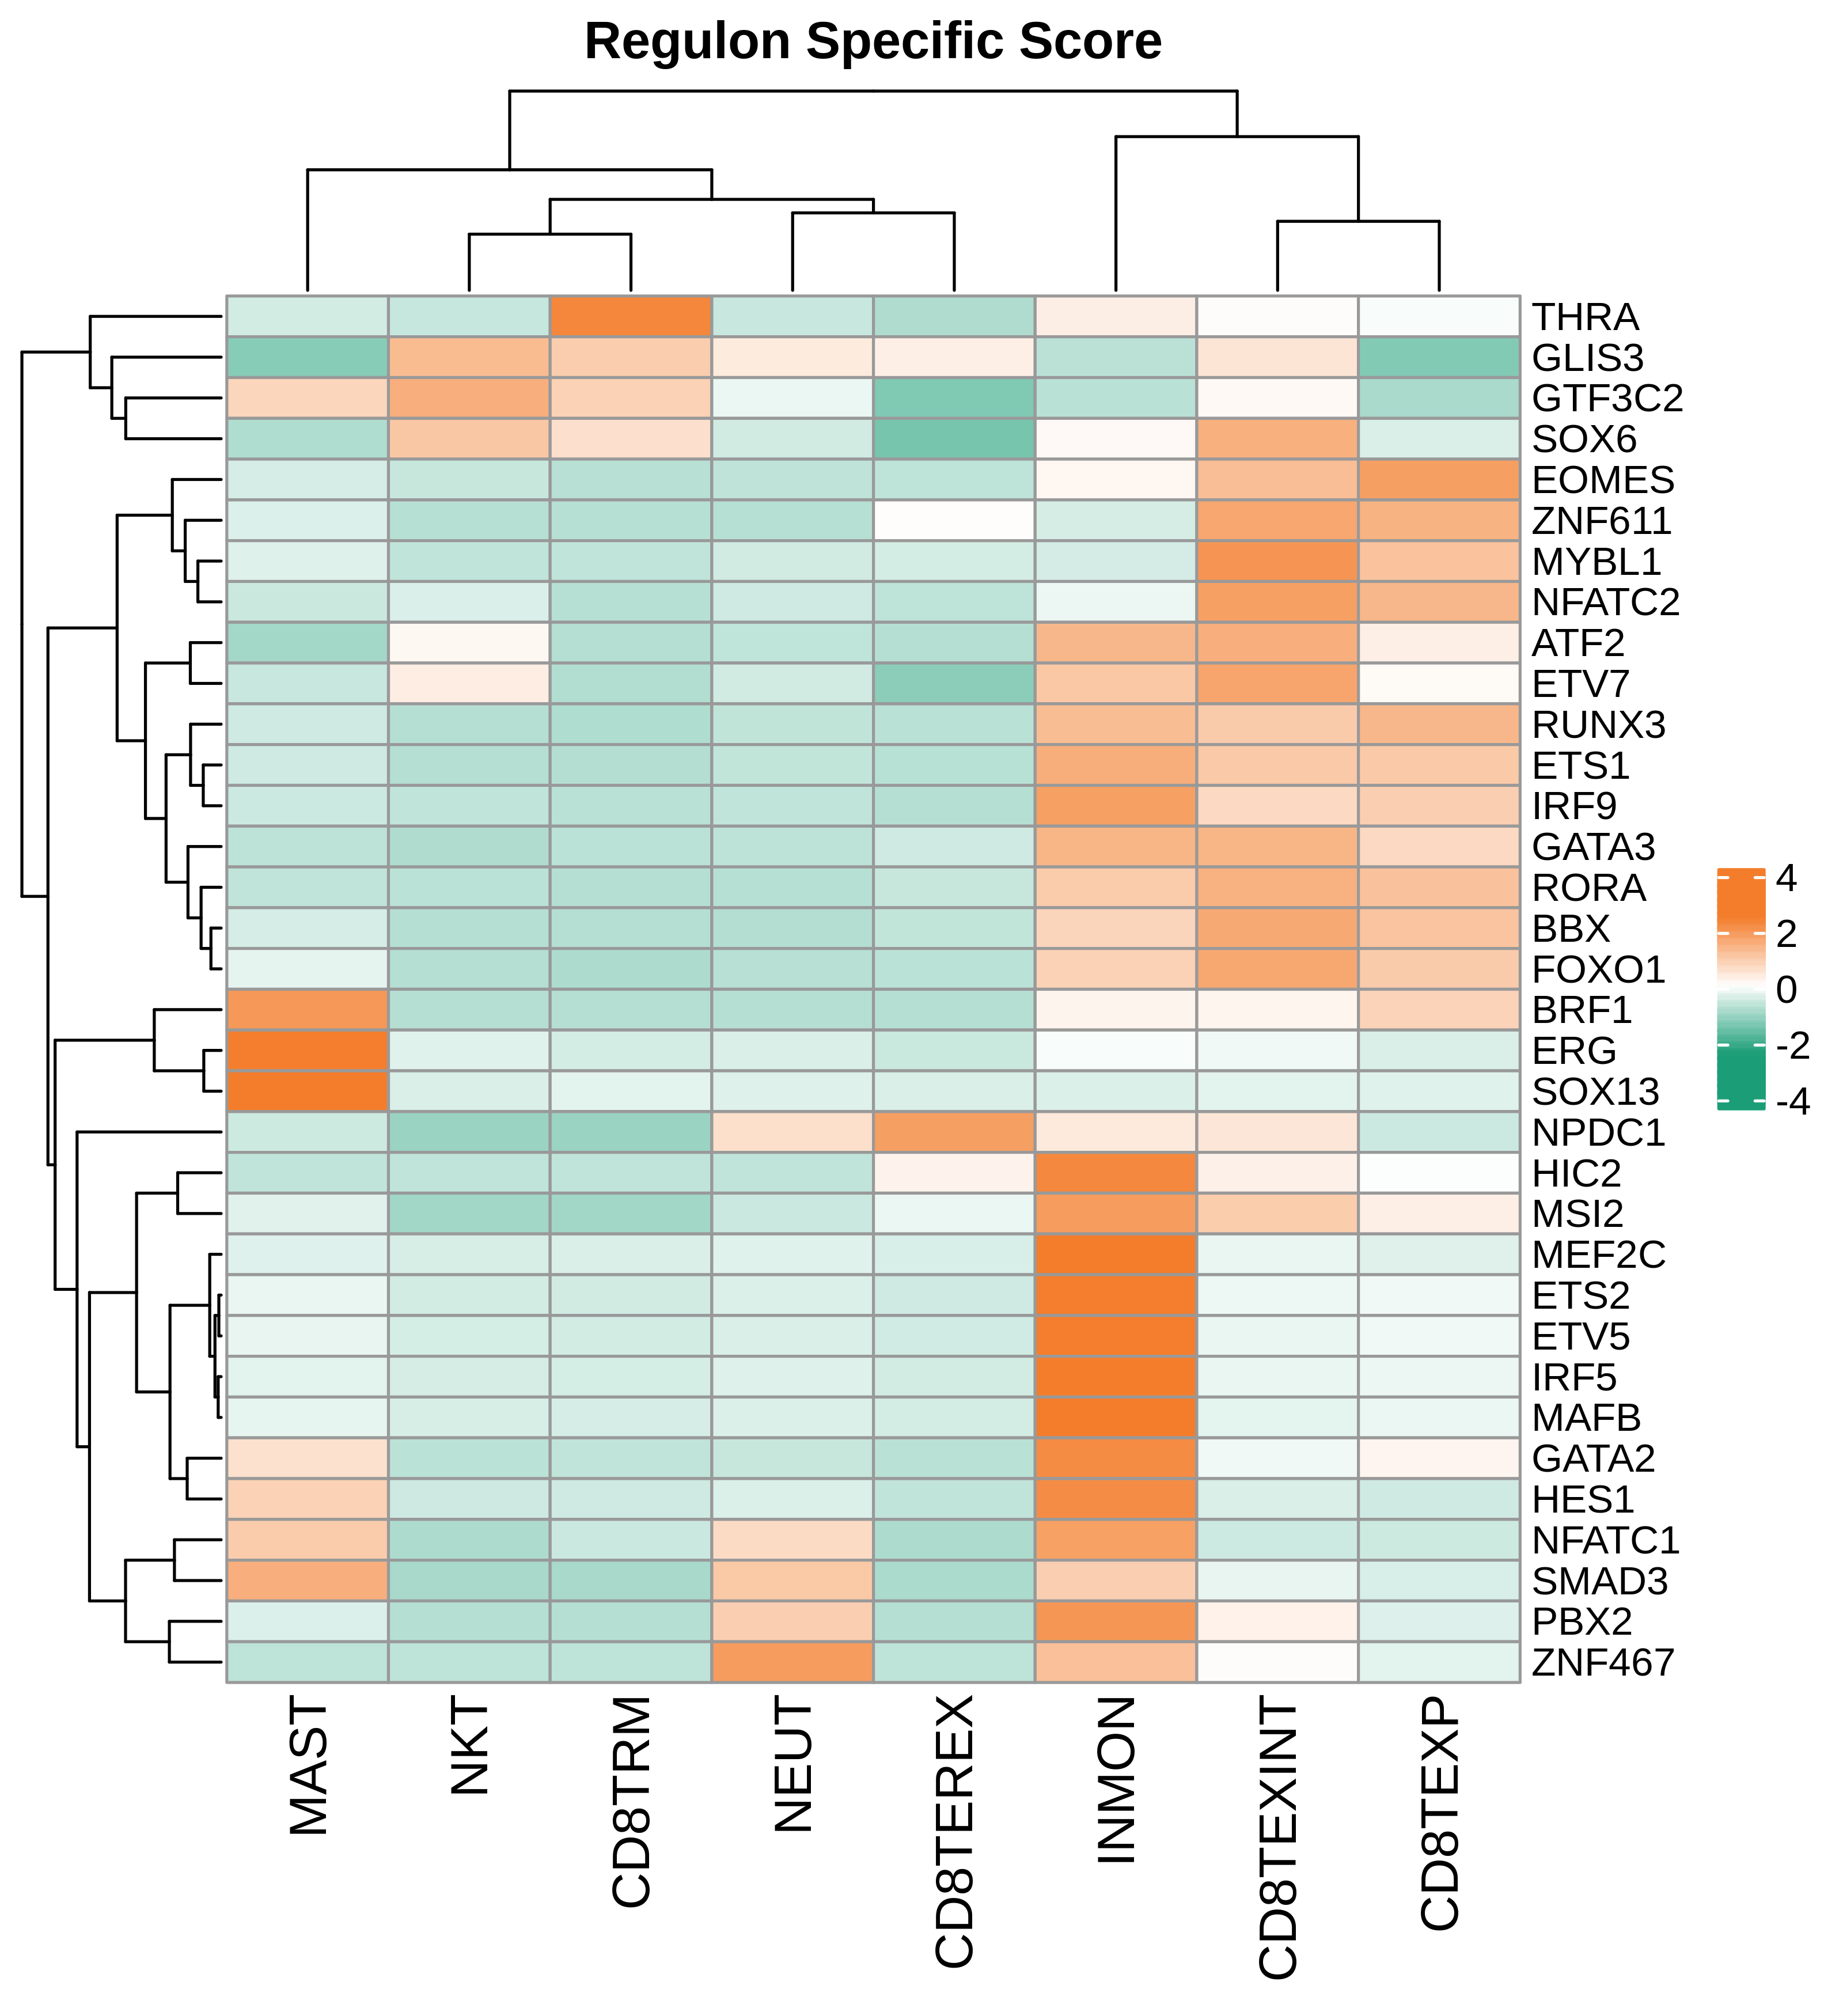
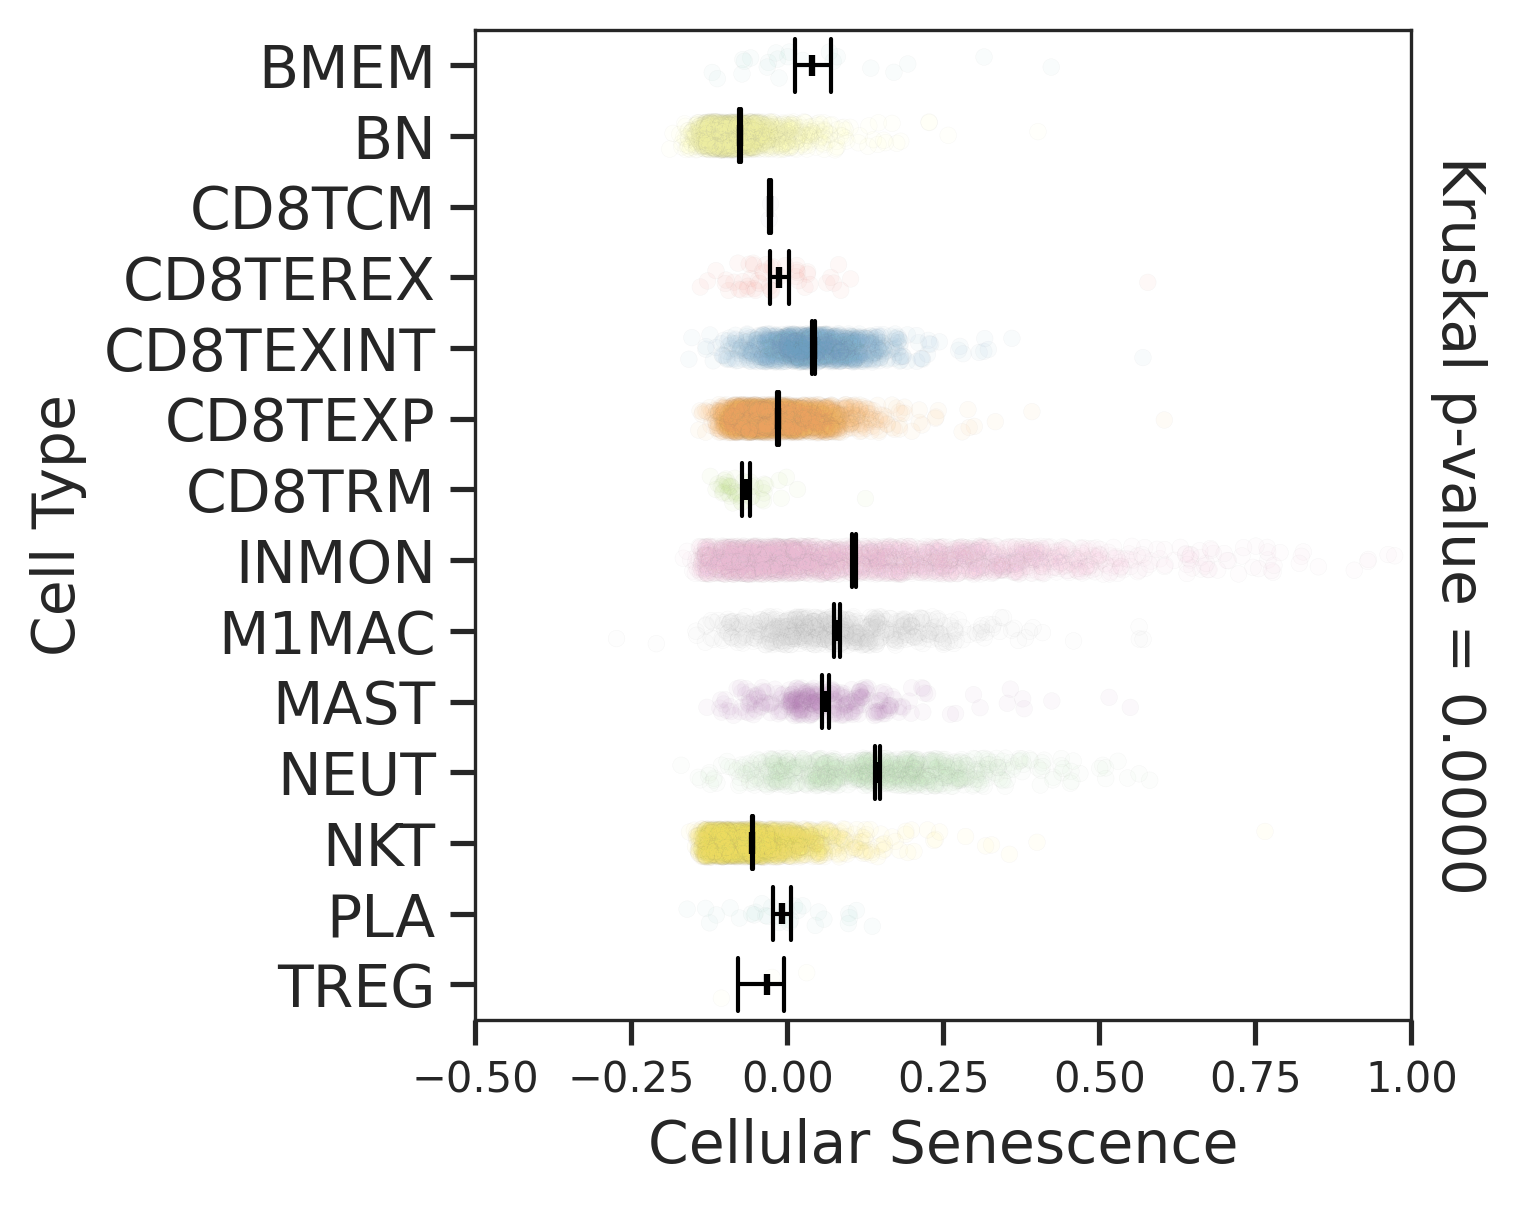
| Pancreas | Imm | INMON | Inflamotory monocytes | CD14,CLEC9A,FCGR1A,LILRB2,CD209,CD1E,FCN1,VCAN,S100A8,S100A9 |
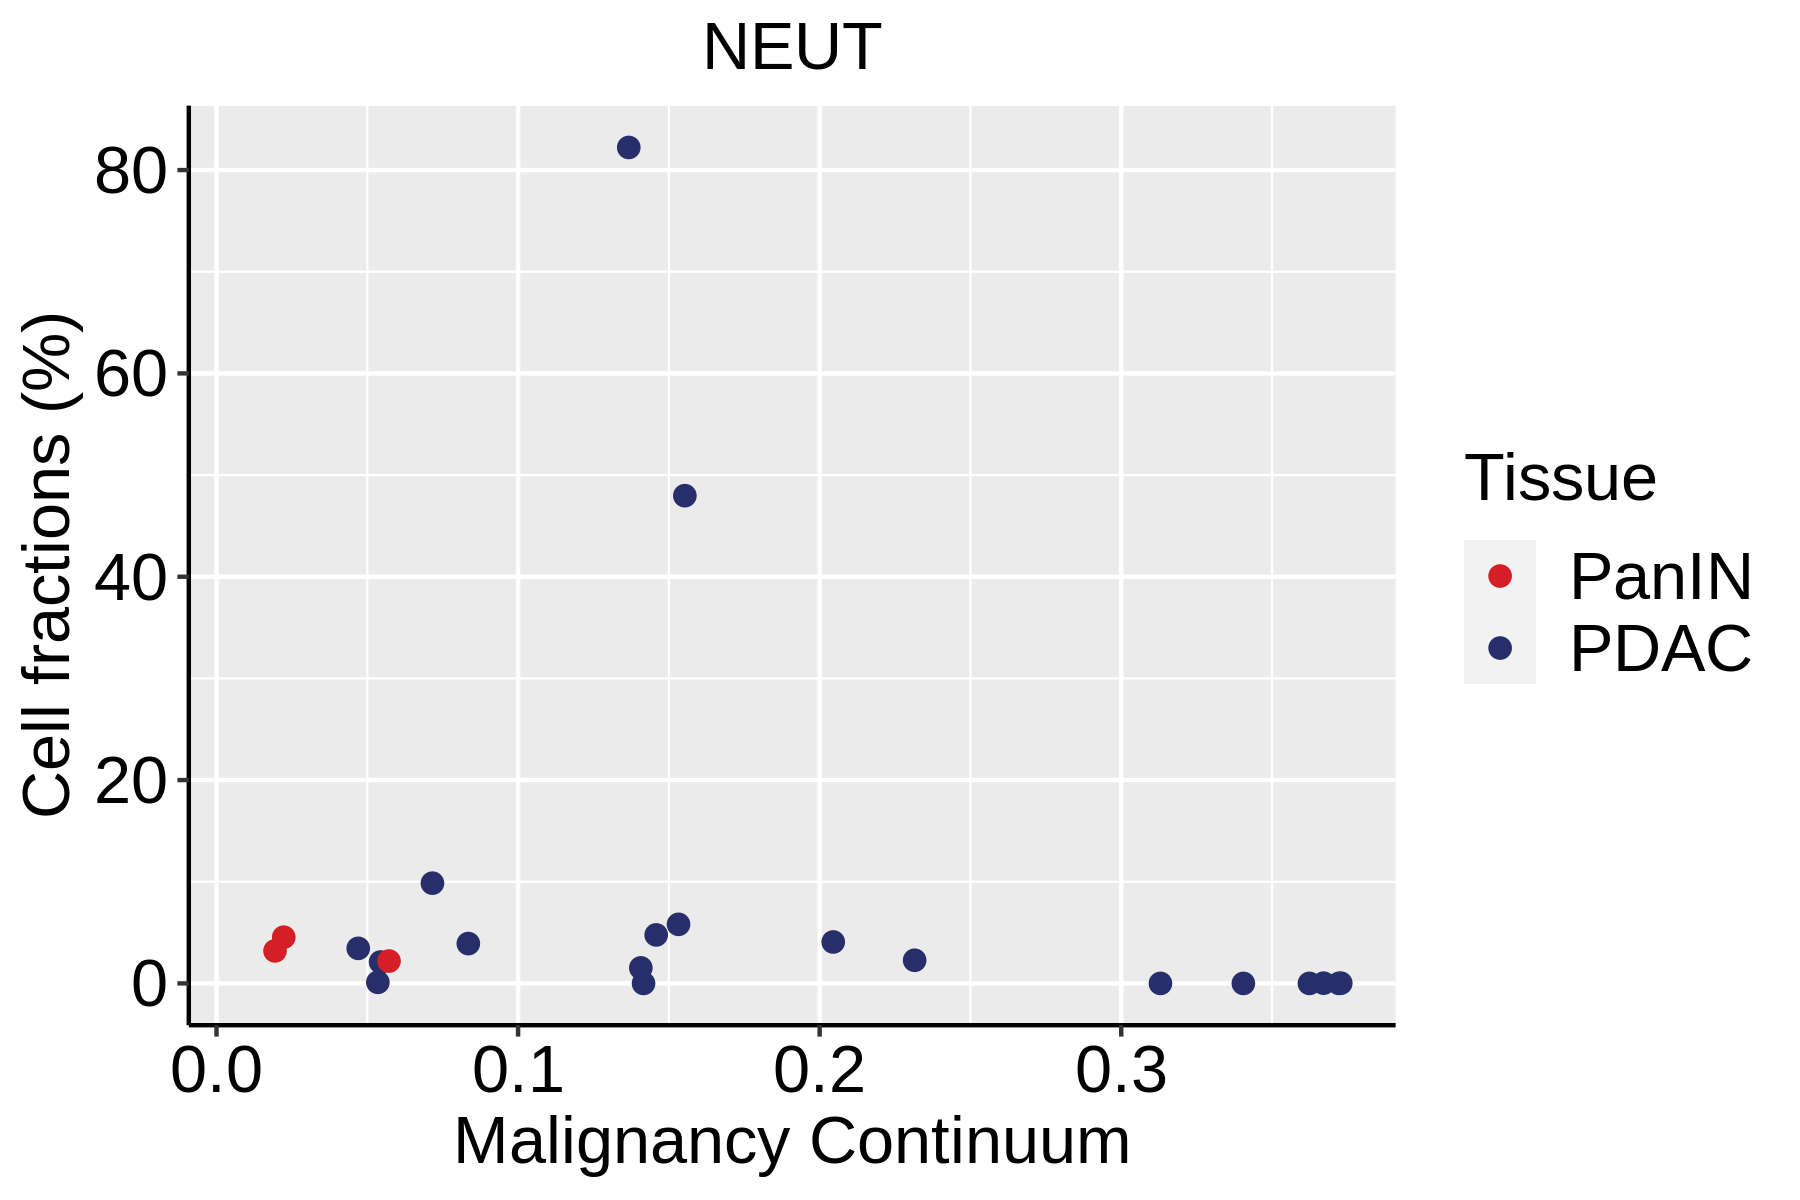
| Pancreas | Imm | NEUT | Neutriphils | CEACAM3,FCGR3B,CXCR2 |
| Pancreas | Imm | CD8TEXP | Progenitor exhausted CD8+ T cells | PDCD1,IL7R,GPR183,NR4A3,REL,TCF7 |
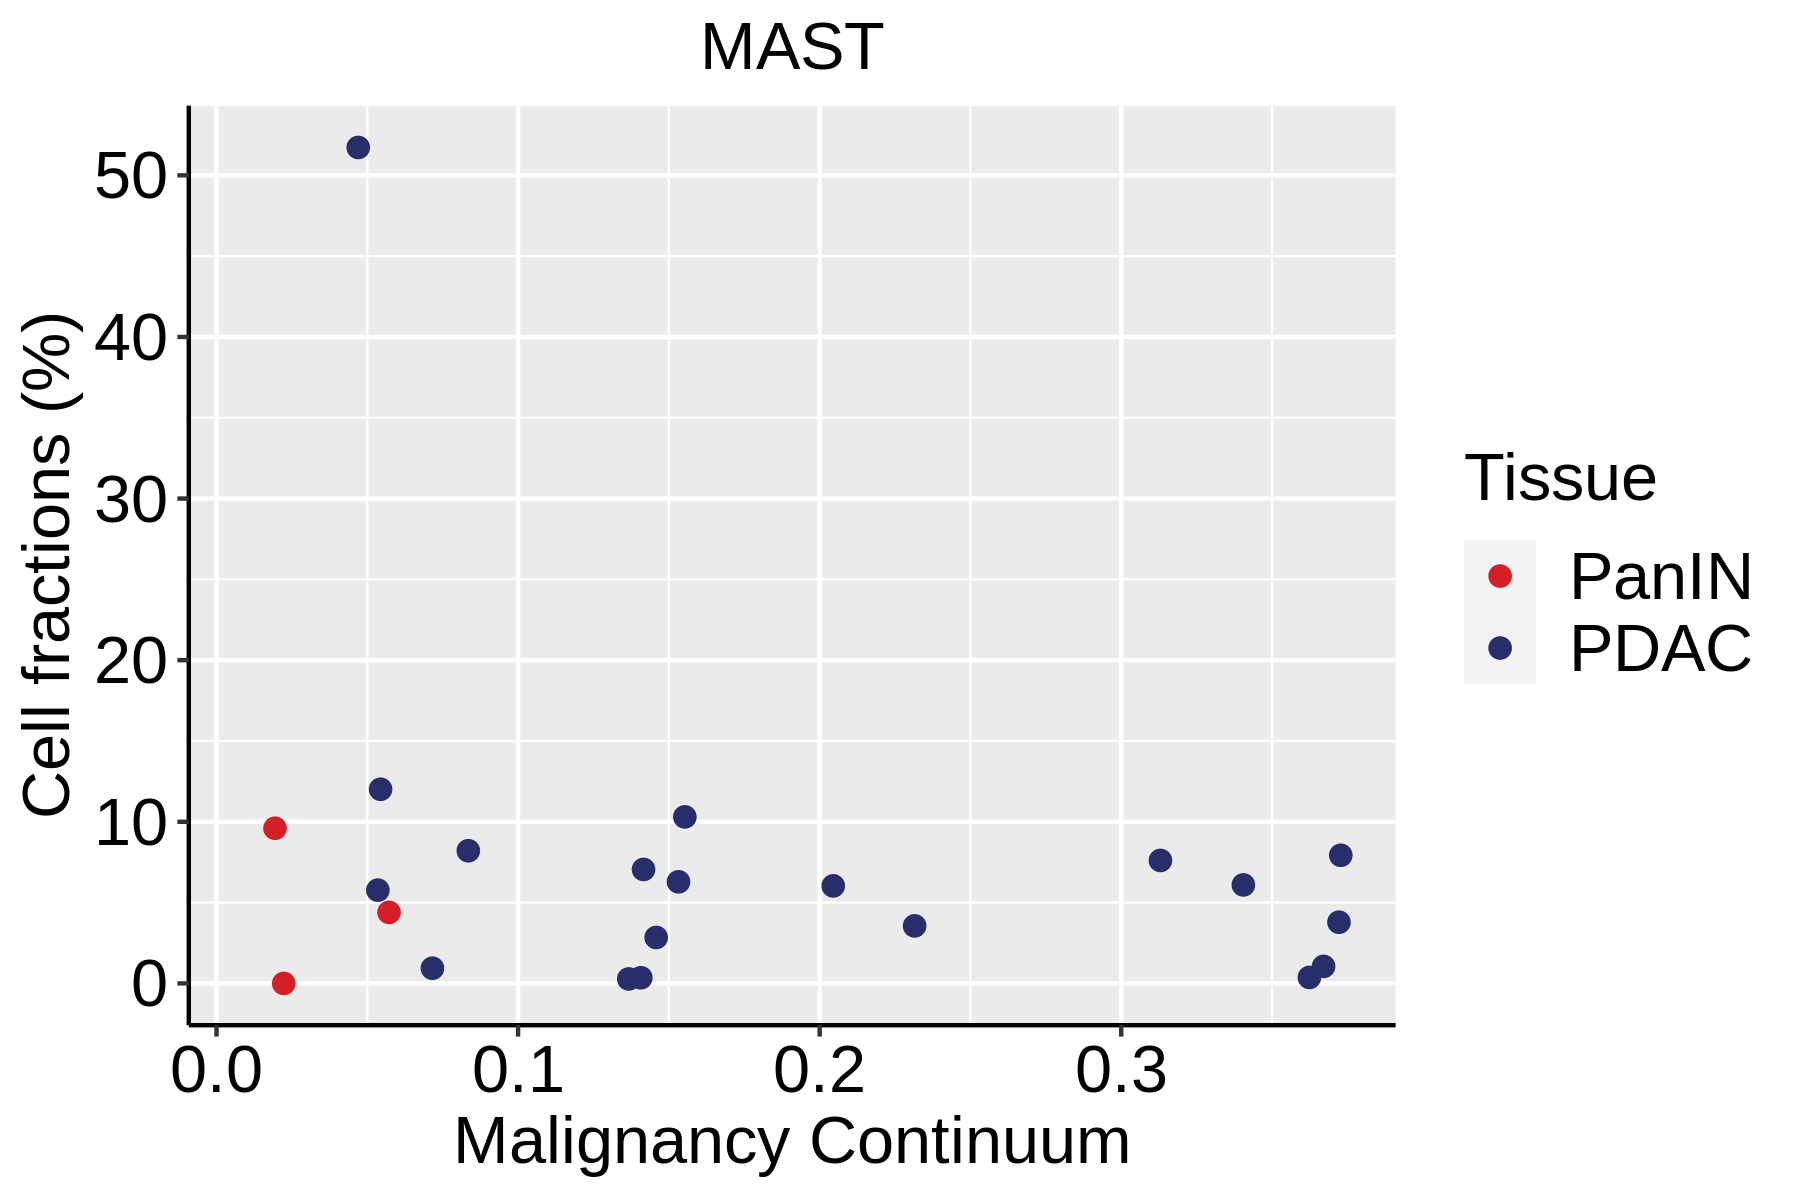
| Pancreas | Imm | MAST | Mast cells | TPSAB1,CPA3,HDC,CTSG,TPSB2,CMA1,MS4A2 |
| Pancreas | Imm | CD8TEXINT | Intermediate exhausted CD8+ T cells | PDCD1,LAG3,CD101,CD38,CXCR6,TIGIT |
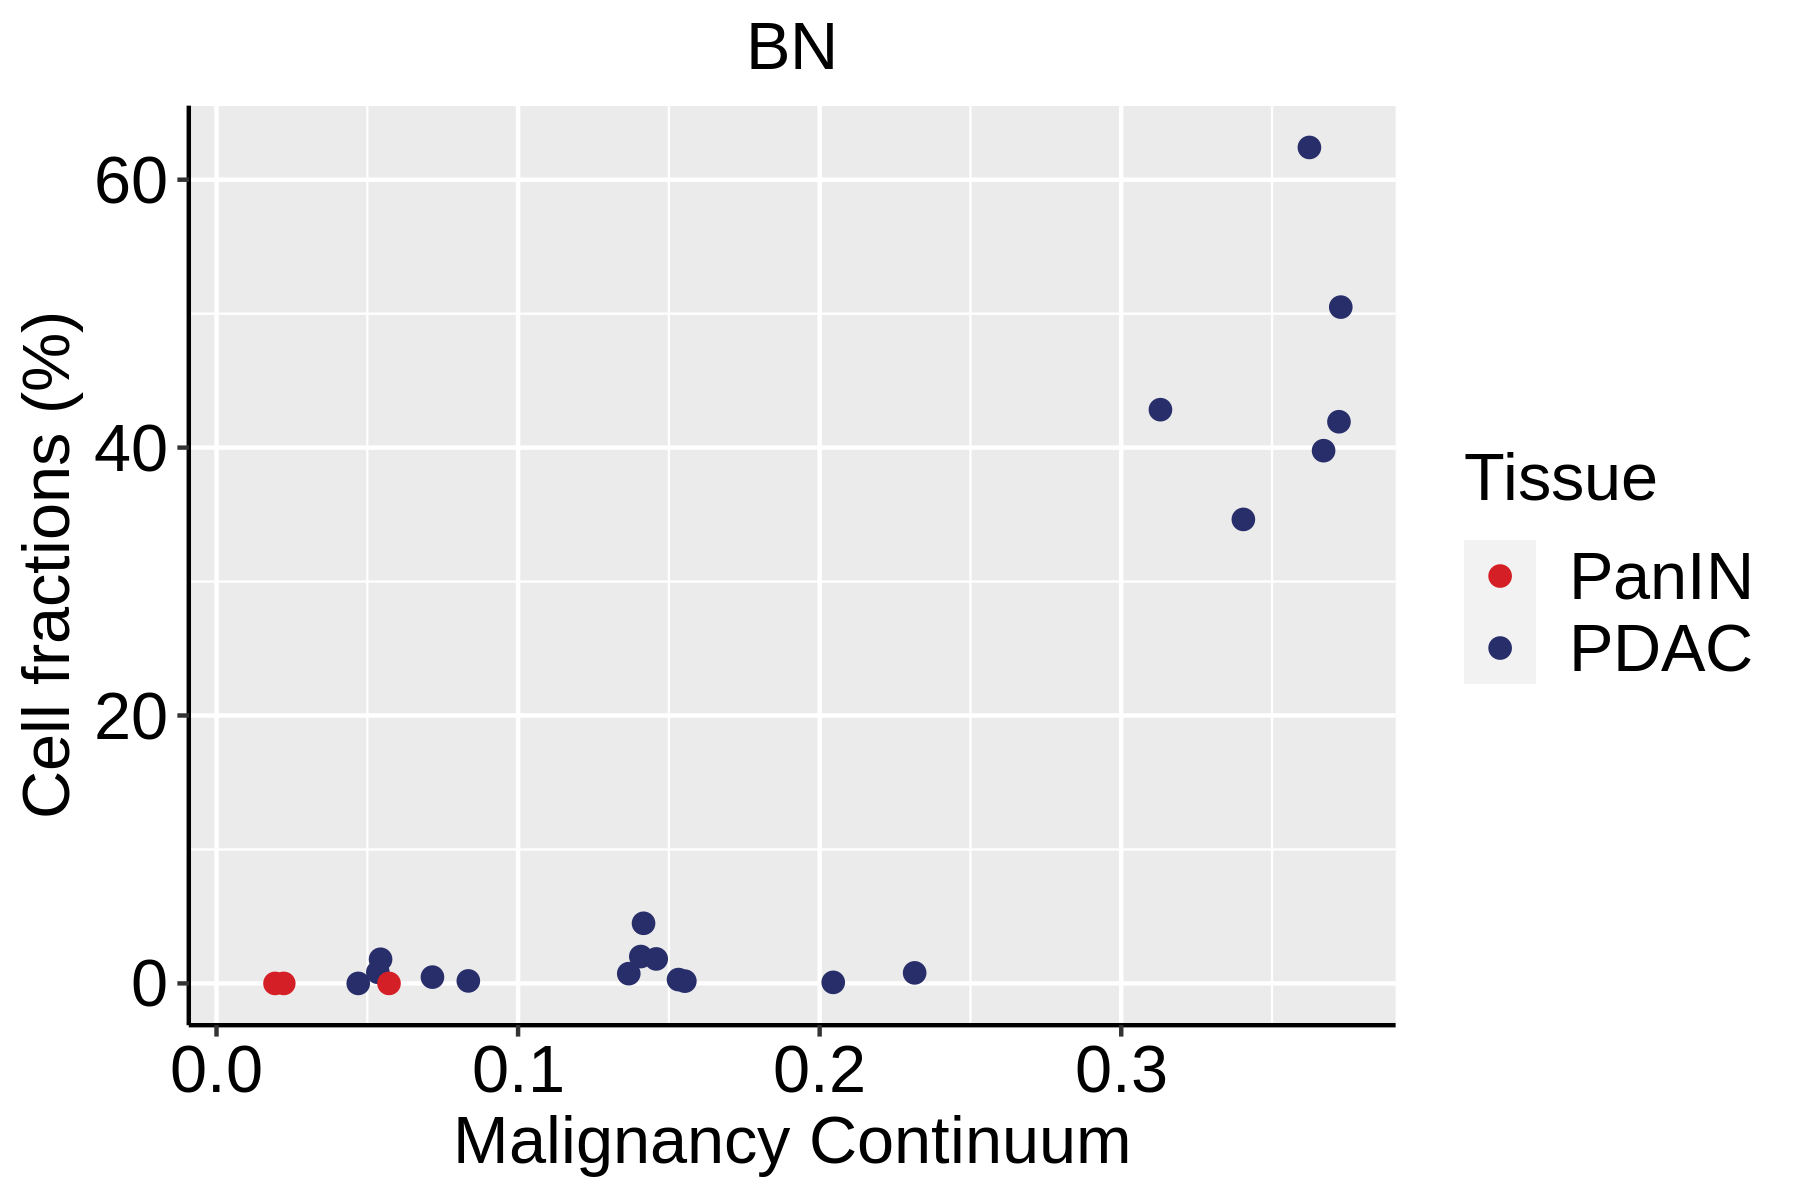
| Pancreas | Imm | BN | Naive B cells | CD19,IGHD,IGLL1,CD27,CD38 |
| Pancreas | Imm | CD8TRM | CD8+ tissue resident memory T cells | CD6,XCL1,XCL2,MYADM,CAPG,RORA,NR4A1,NR4A2,NR4A3,CD69,ITGAE |
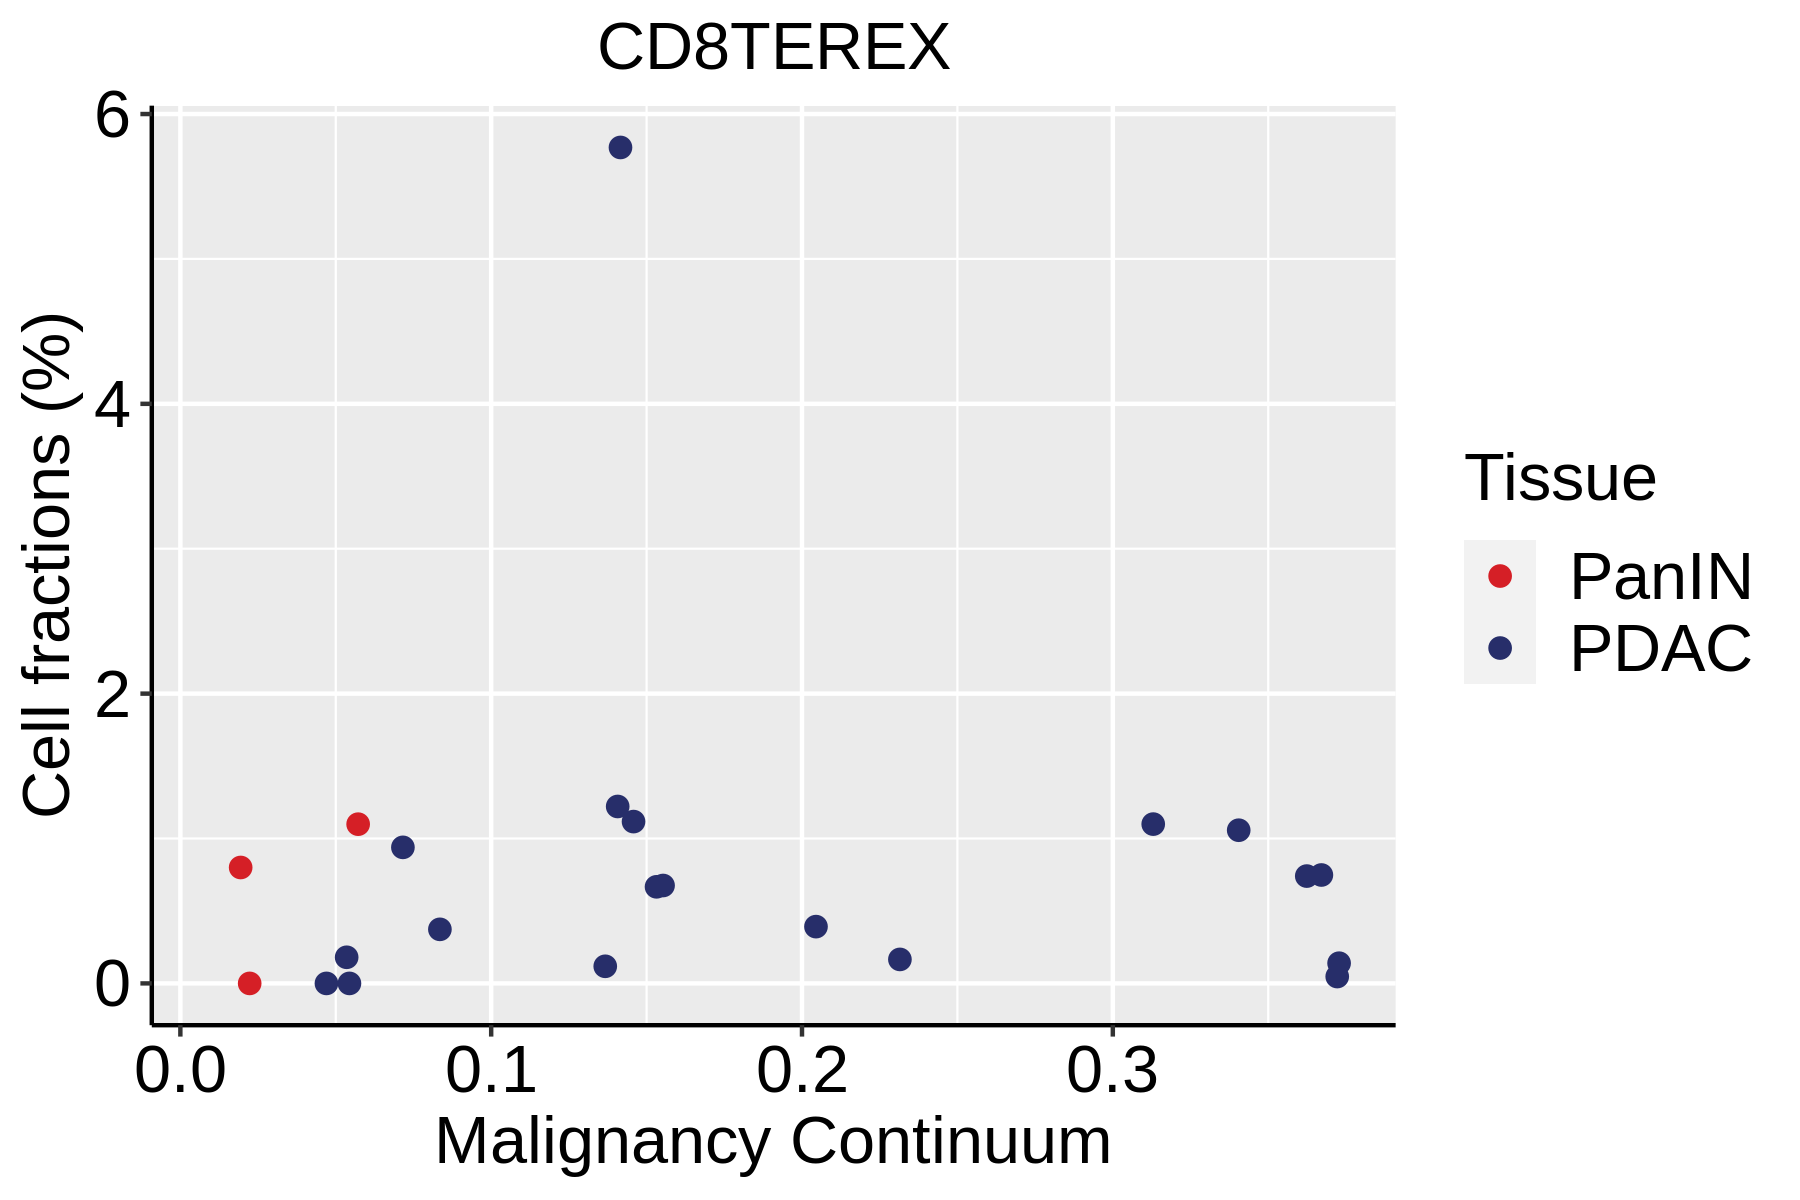
| Pancreas | Imm | CD8TEREX | Terminally exhausted CD8+ T cells | TOX,GZMB,ENTPD1,ITGAE,HAVCR2,CXCL13,PDCD1,LAYN,TOX,IFNG,GZMB,MIR155HG,TNFRSF9,ITGAE |
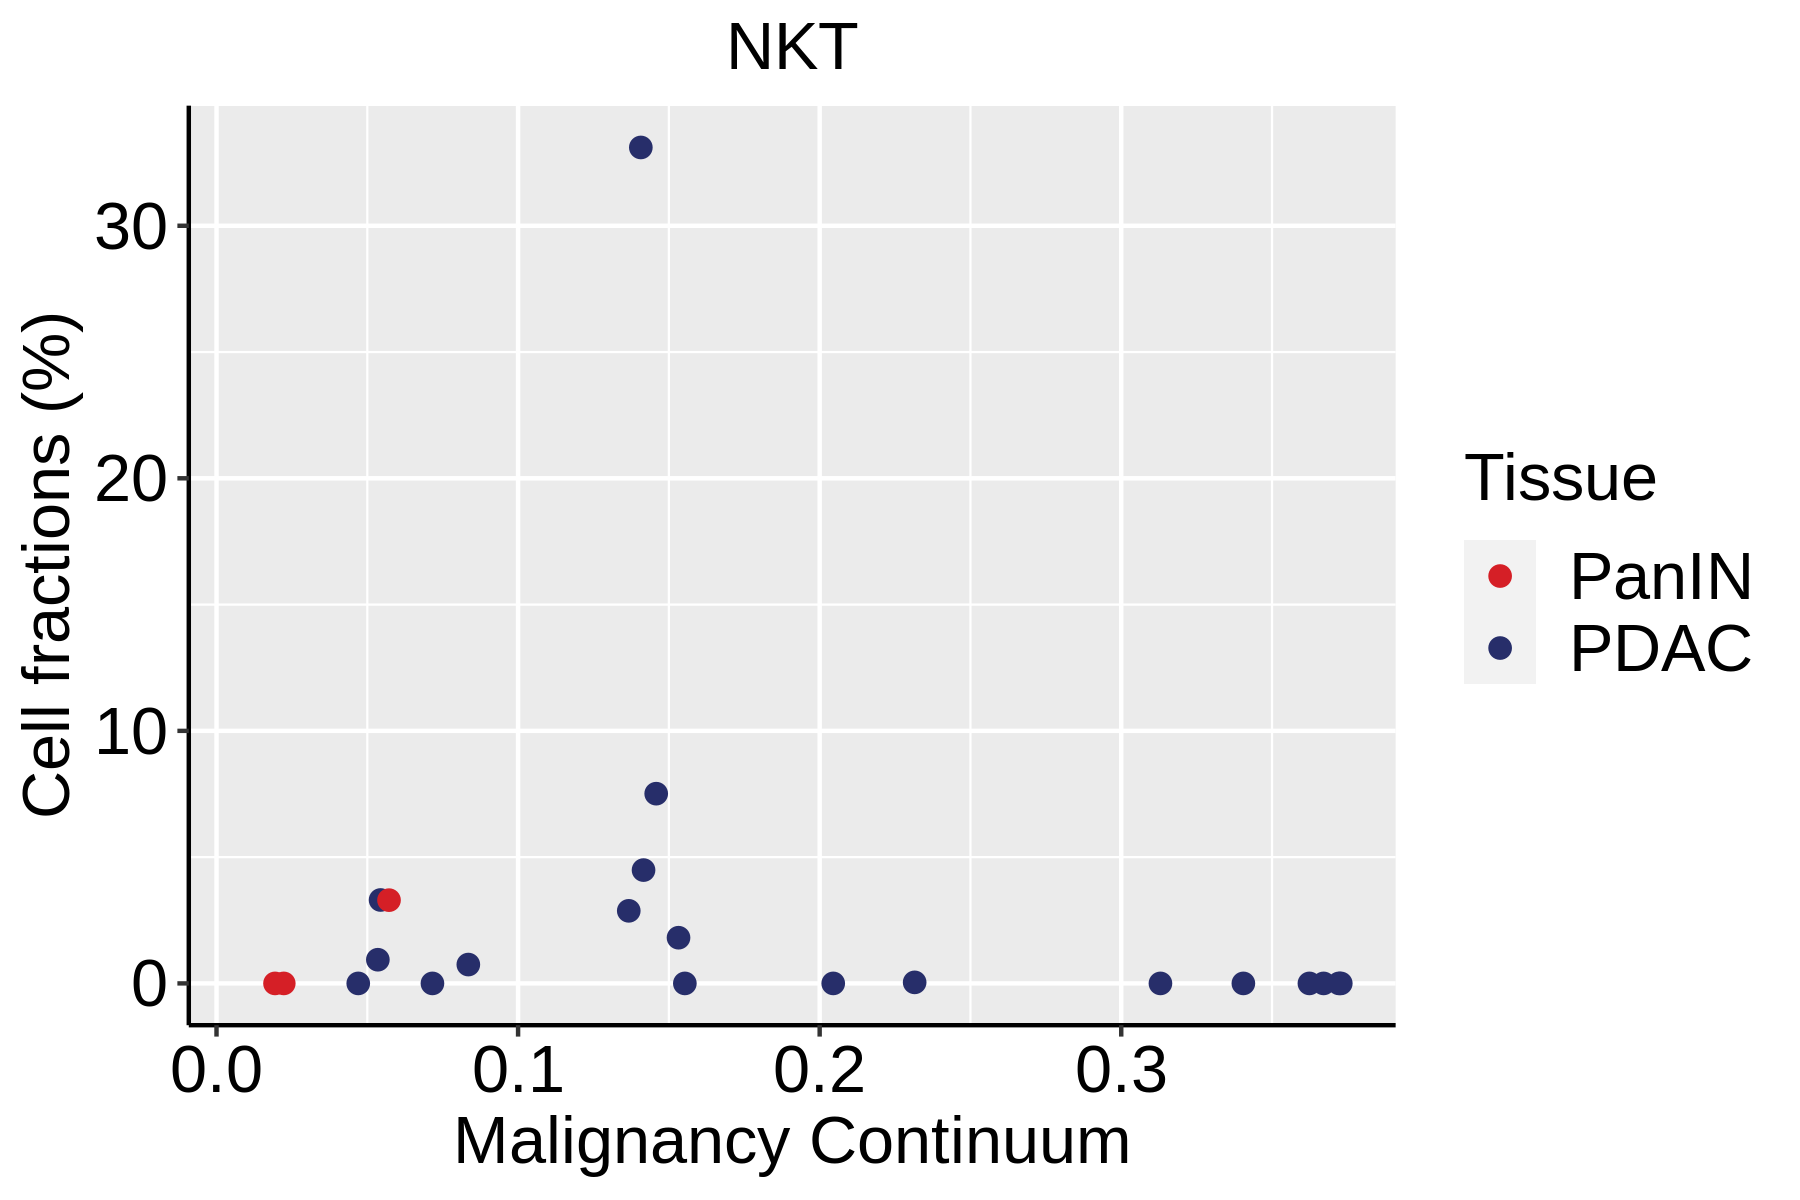
| Pancreas | Imm | NKT | Natural killer T cells | CD3D,CD3E,NCAM1,KLRB1 |
| Pancreas | Imm | TREG | Regulatory T cells | BATF,TNFRSF4,FOXP3,CTLA4,LAIR2,IL2RA |
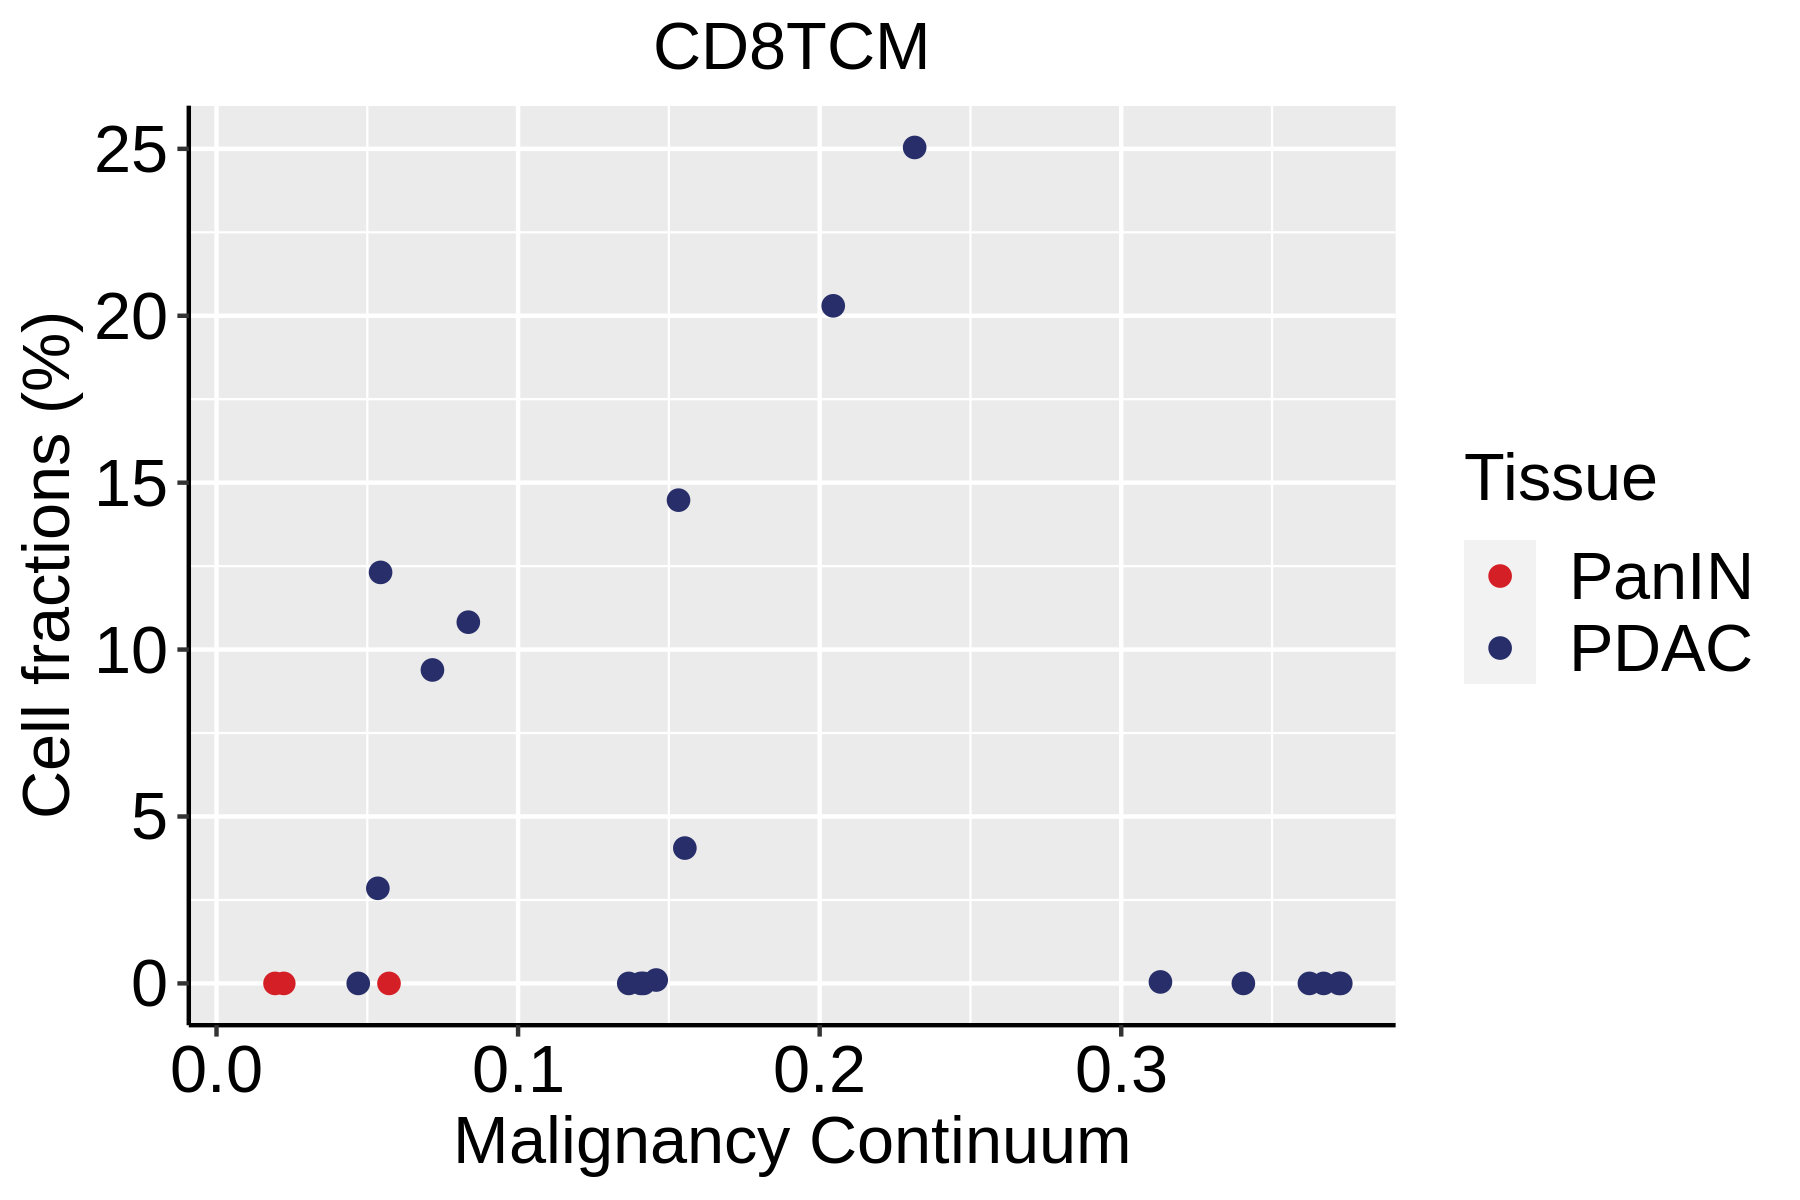
| Pancreas | Imm | CD8TCM | Central memory CD8+ T cells | CCR7,SELL,IL7R,CD27,CD28,PRF1,GZMA,CCL5,GPR183,S1PR1 |
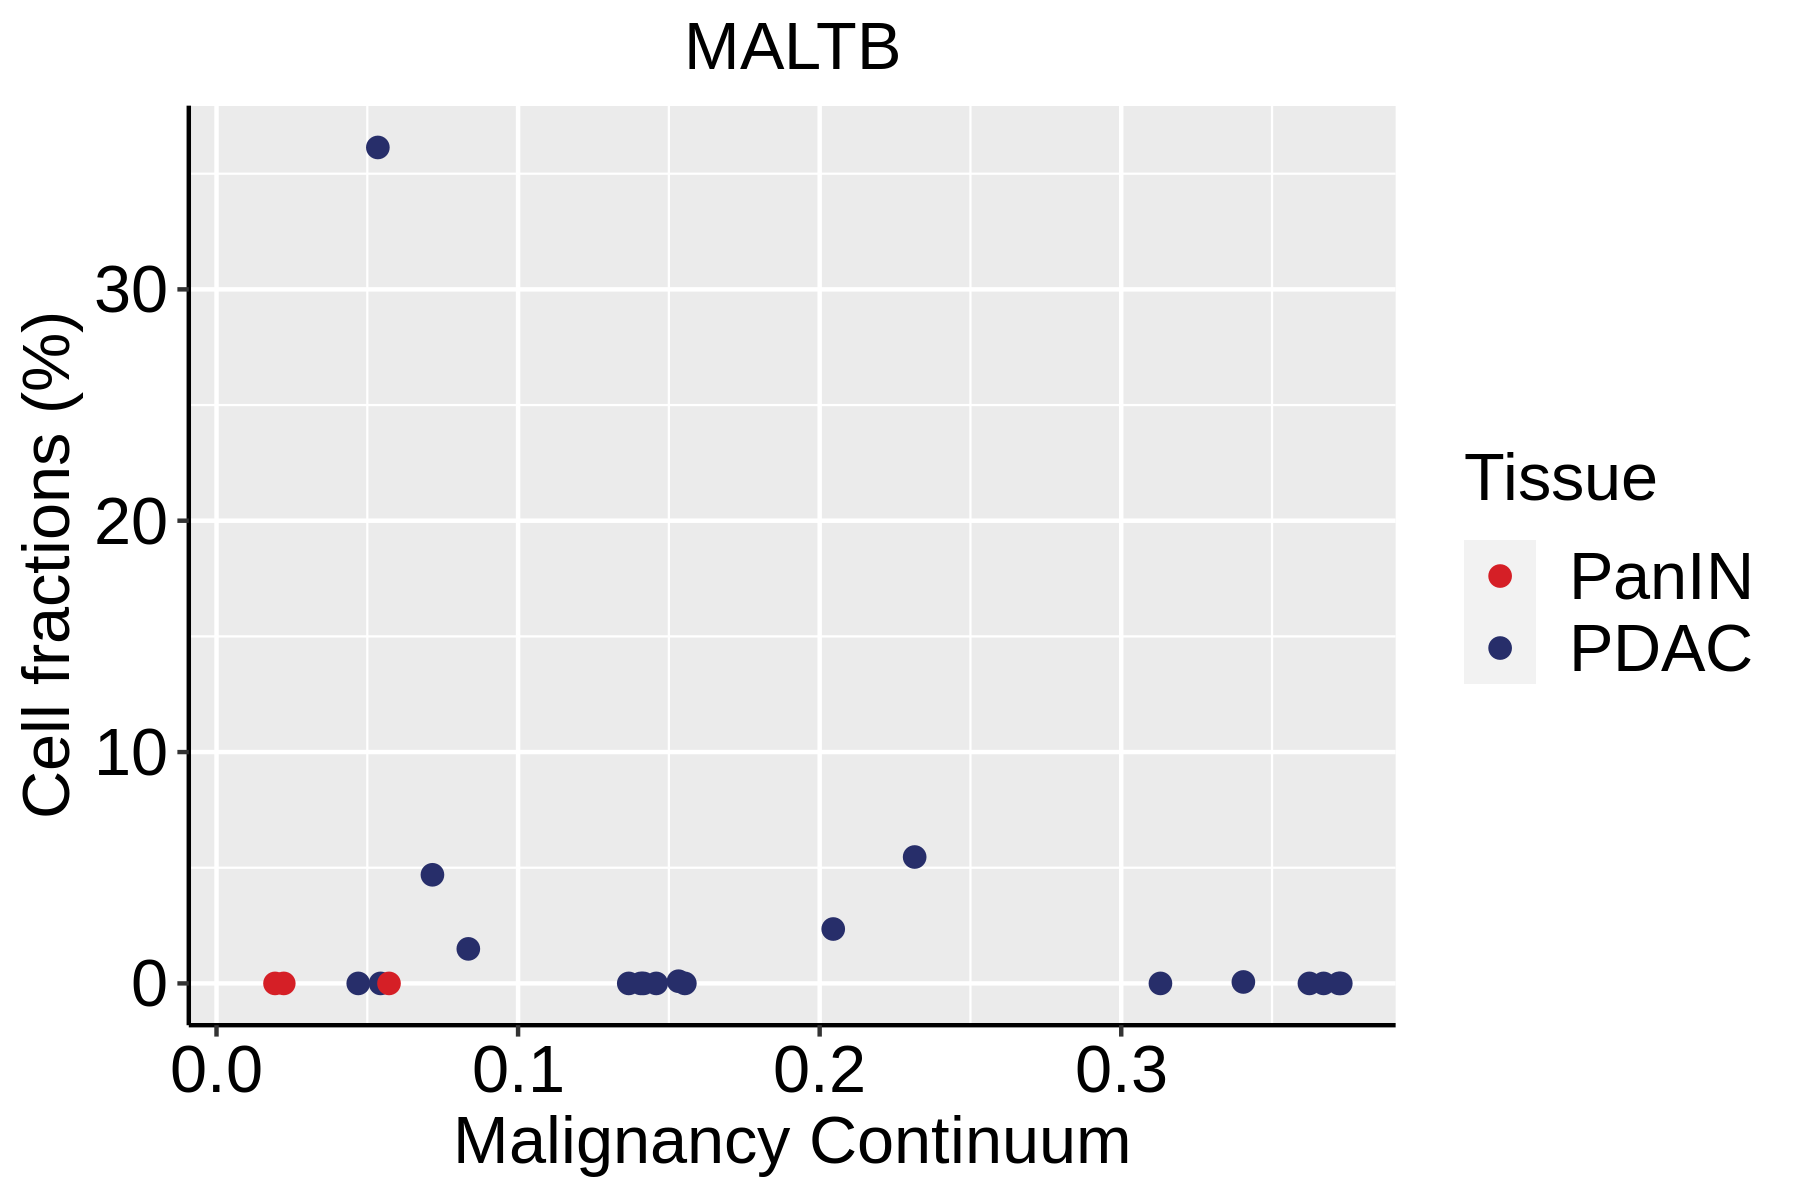
| Pancreas | Imm | MALTB | Mucosa-Associated Lymphoid Tissue B cells | CXCR4,CD80,CCR6,ITGB7 |
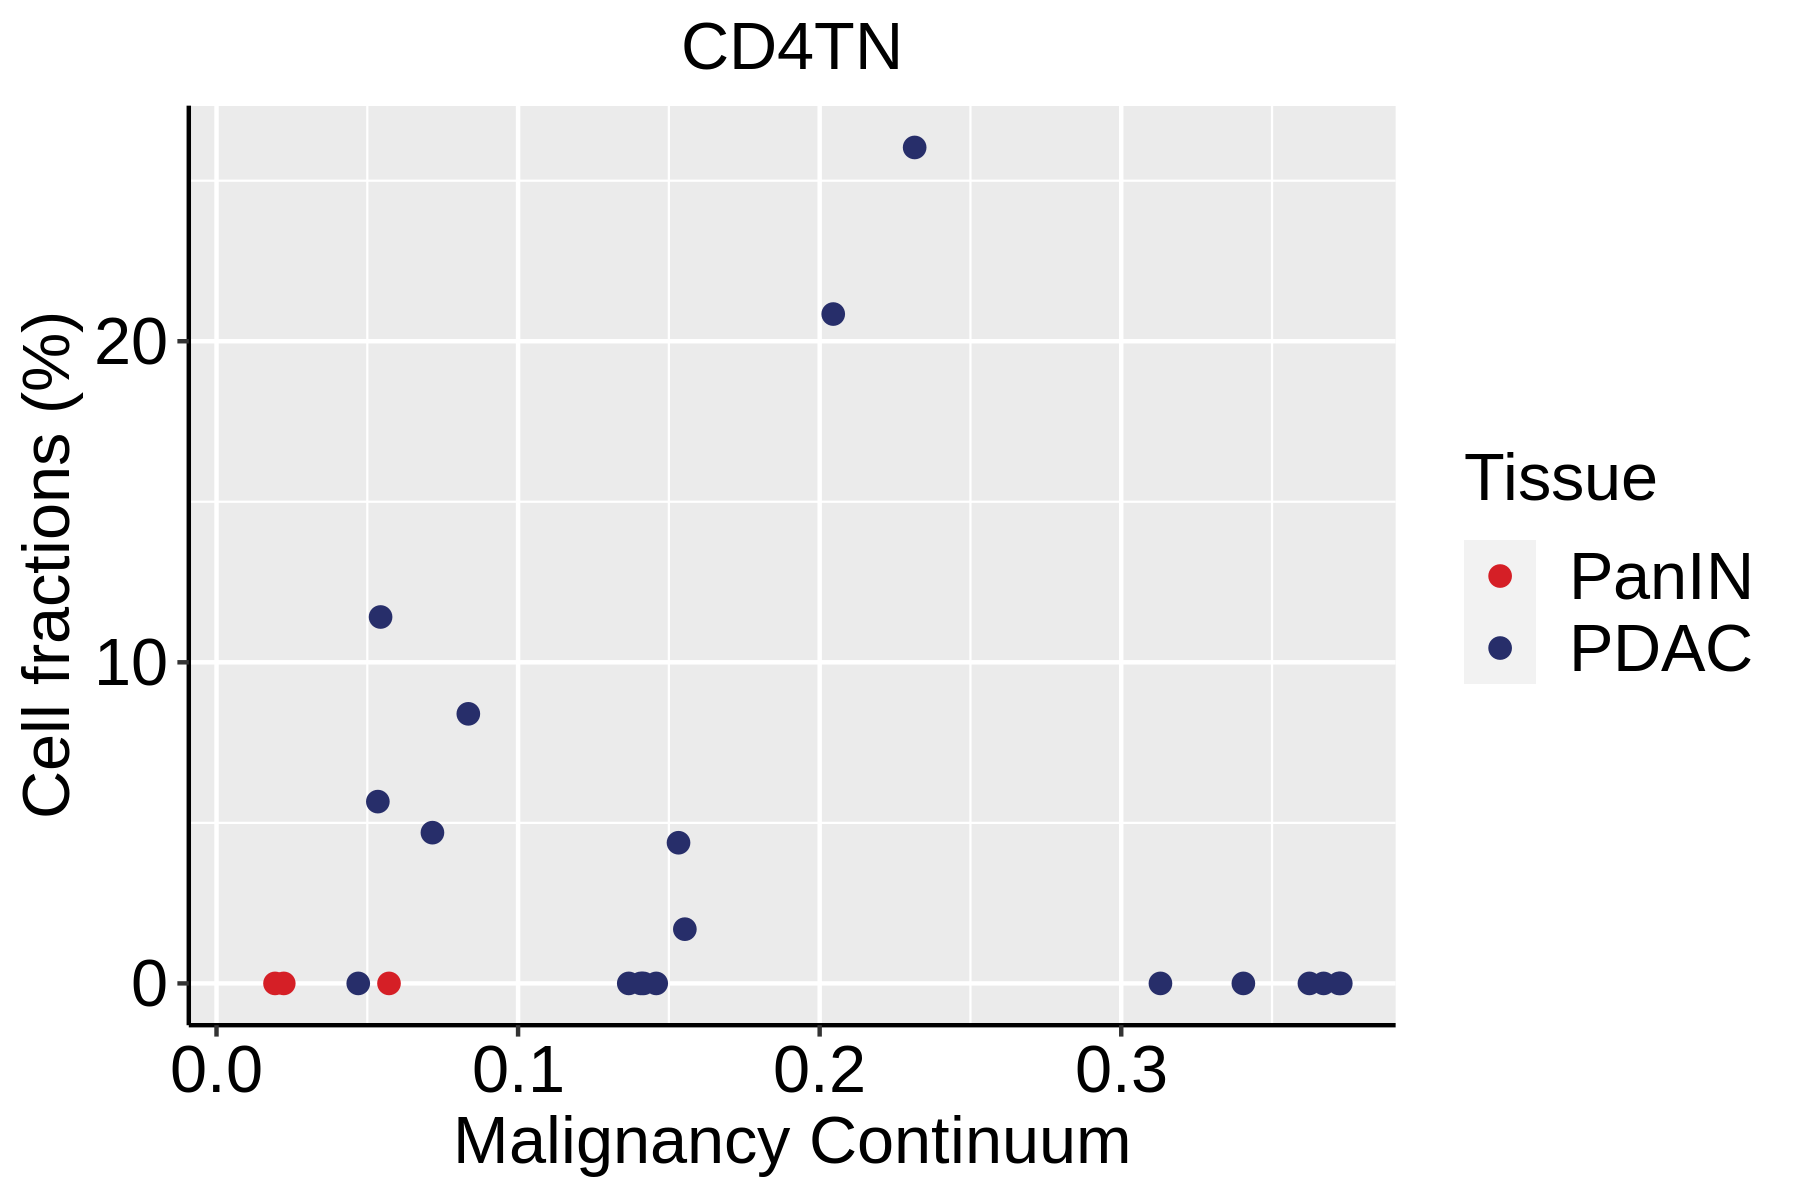
| Pancreas | Imm | CD4TN | Naive CD4+ T cells | IL7R,SELL,CCR7,S100A4,TCF7 |
| Pancreas | Imm | CD8TEX | Exhausted CD8+ T cells | PDCD1,LAG3,CD101,CD38,CXCR6,TIGIT |
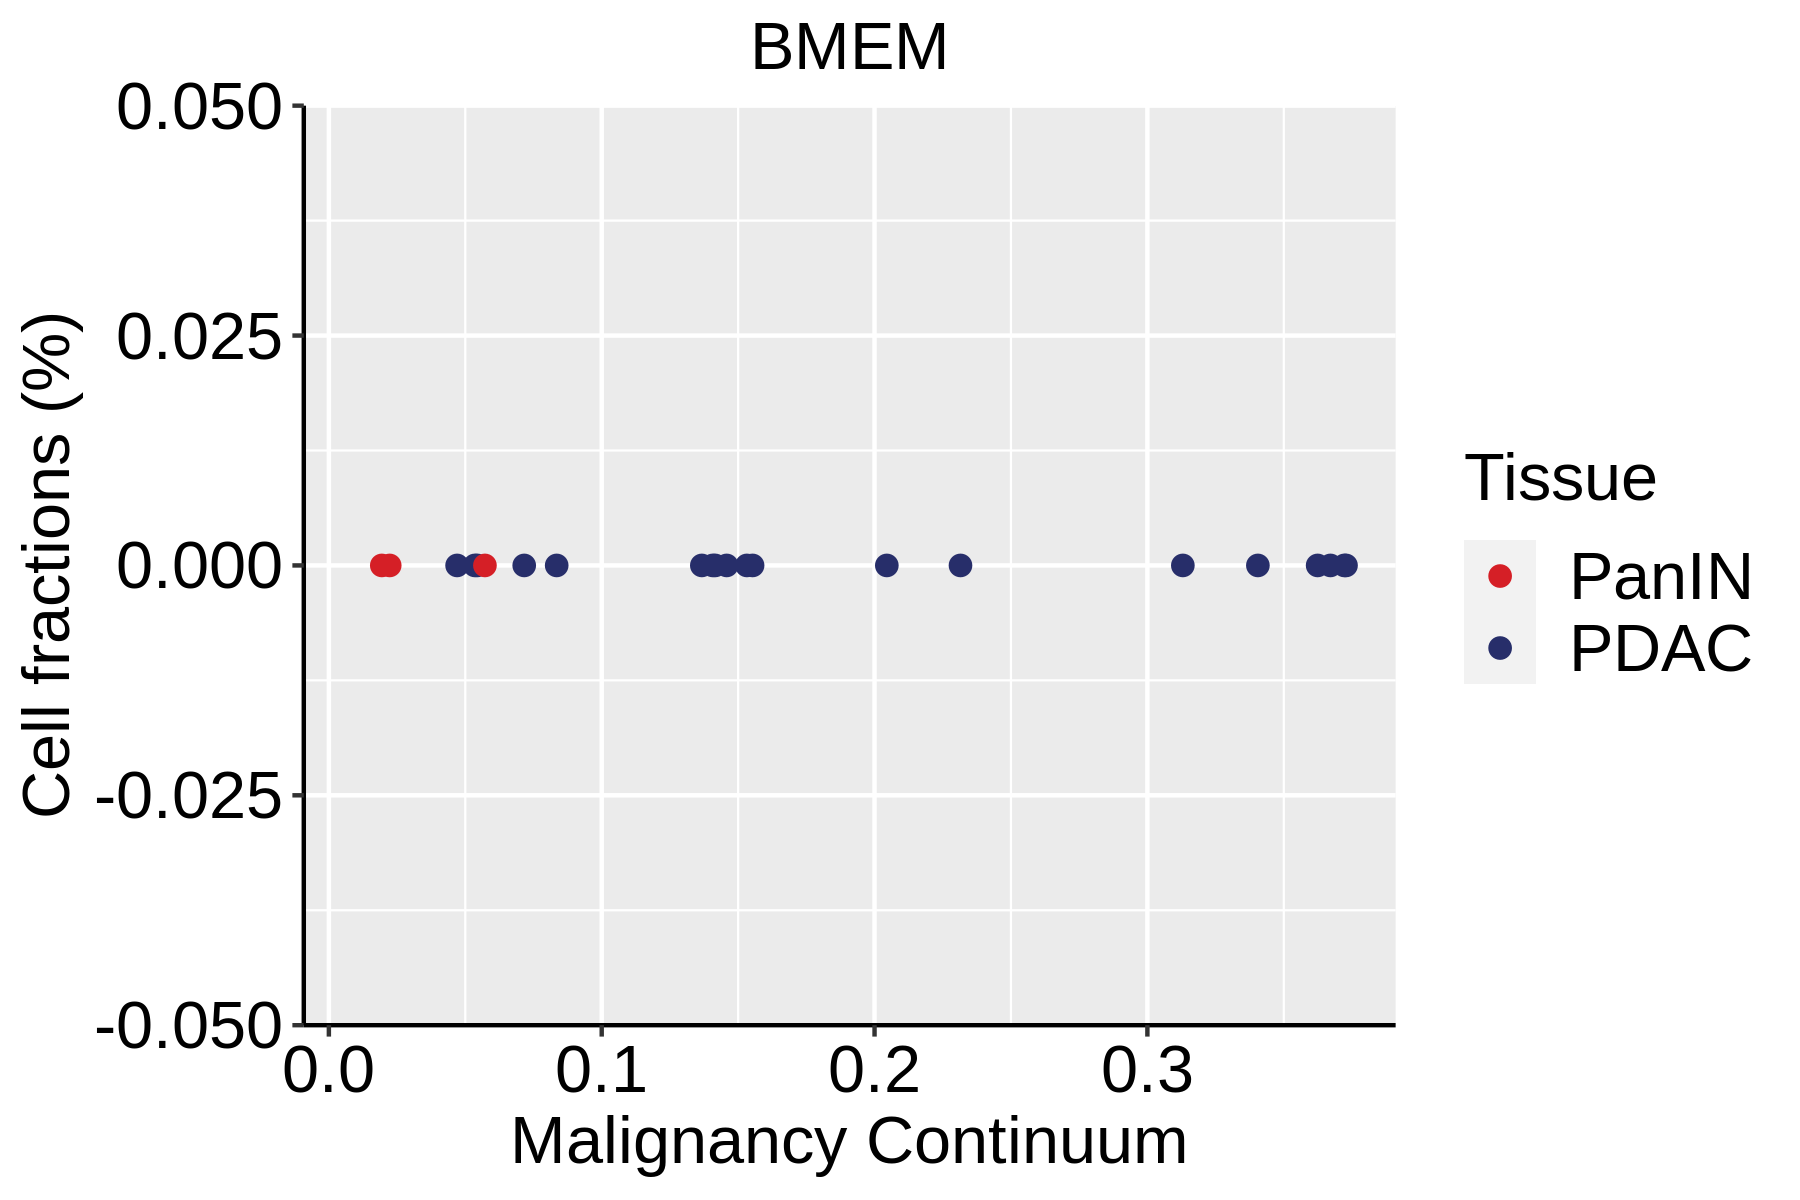
| Pancreas | Imm | BMEM | Memory B cells | PAX5,MS4A1,CD19,IGLL5,VPREB3,CD79A,CD79B,IGKC,CD74,HLA-DRA,CD37,CD22 |
| Pancreas | Imm | M1MAC | M1 macrophages | FOLR2,FABP3,PLA2G2D,ITGAM,ITGAX,CSF1R,CD68,CD163,THBD |
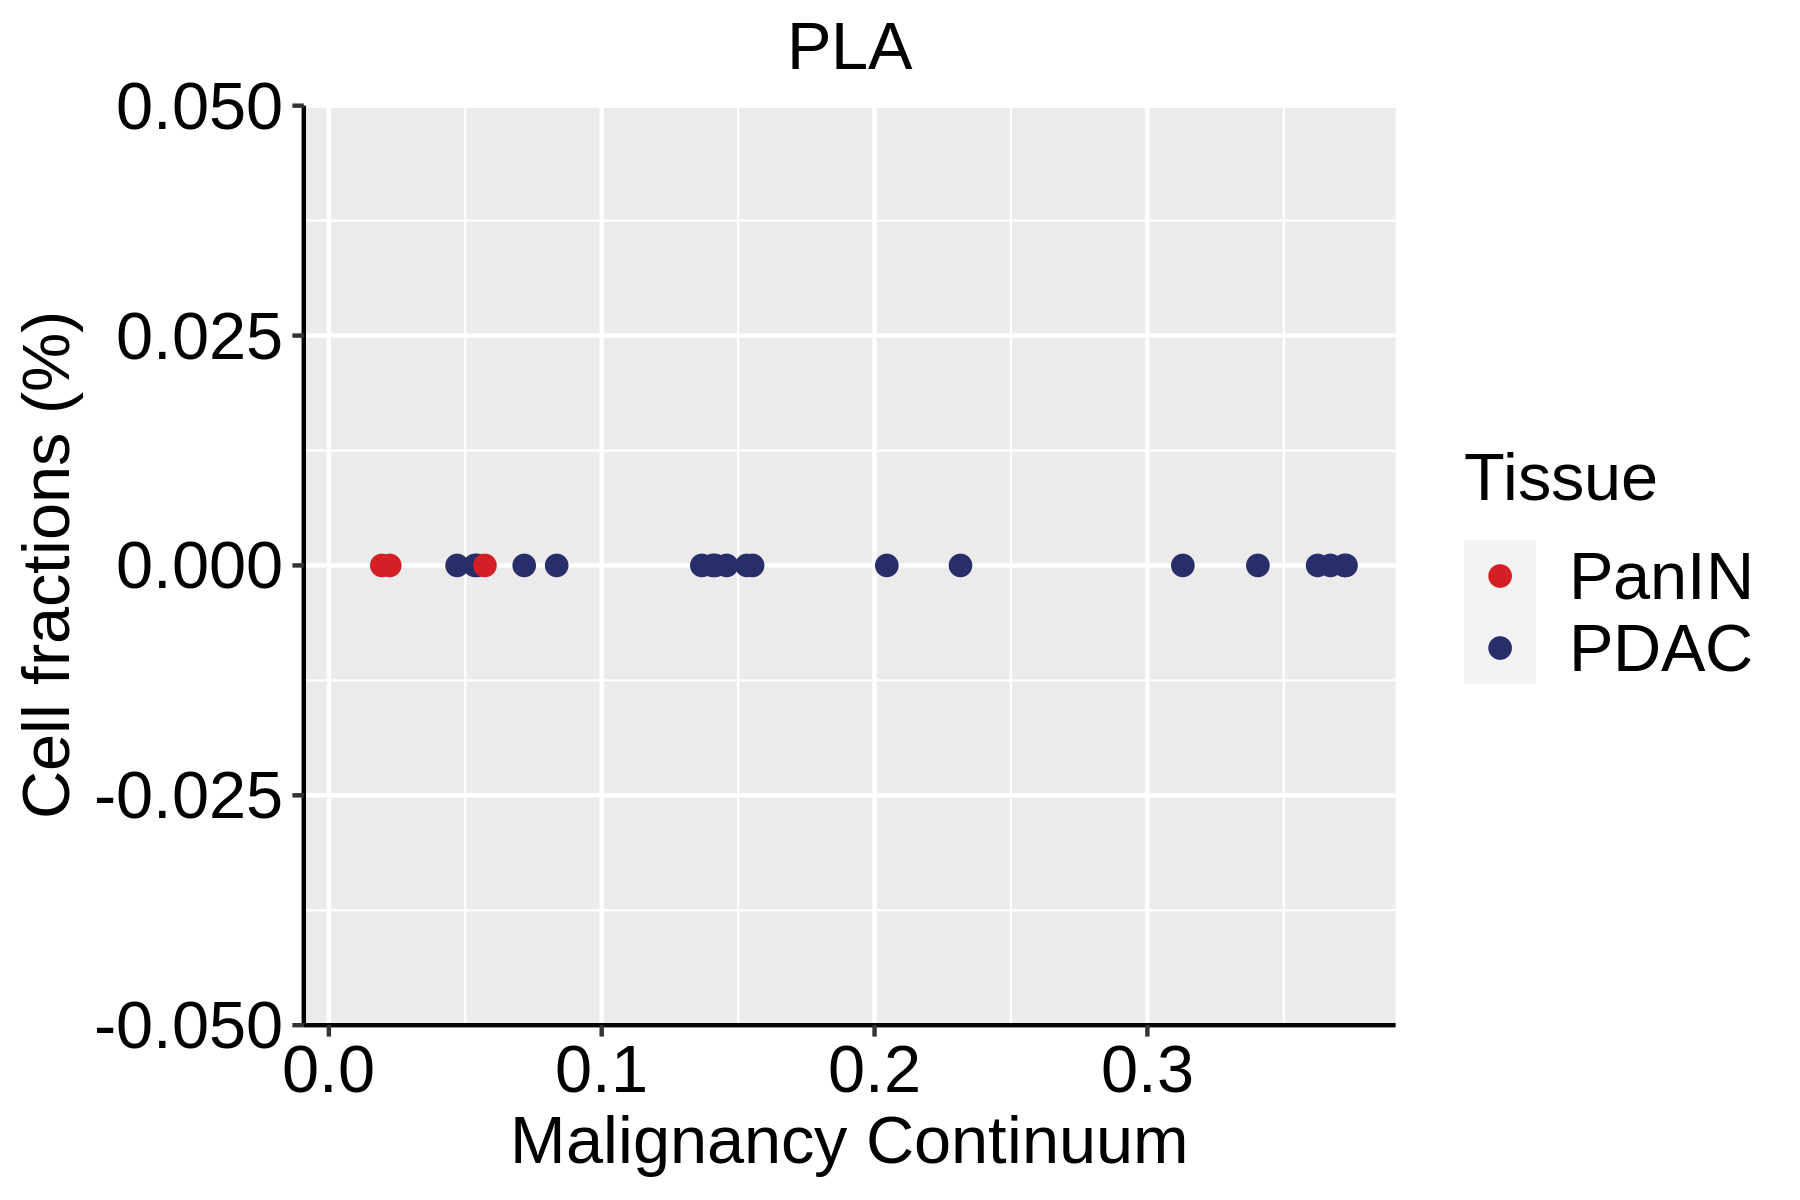
| Pancreas | Imm | PLA | Plasma cells | SSR4,IGLL5,IGLL1,AMPD1,IGHA1,IGHA2,JCHAIN,CD38,TNFRSF17,SDC1,IGHG1,MZB1 |
| Pancreas | Imm | GC | Germinal center B cells | SERPINA9,HRK,HTR3A,BCL6,CD180,FCRLA |
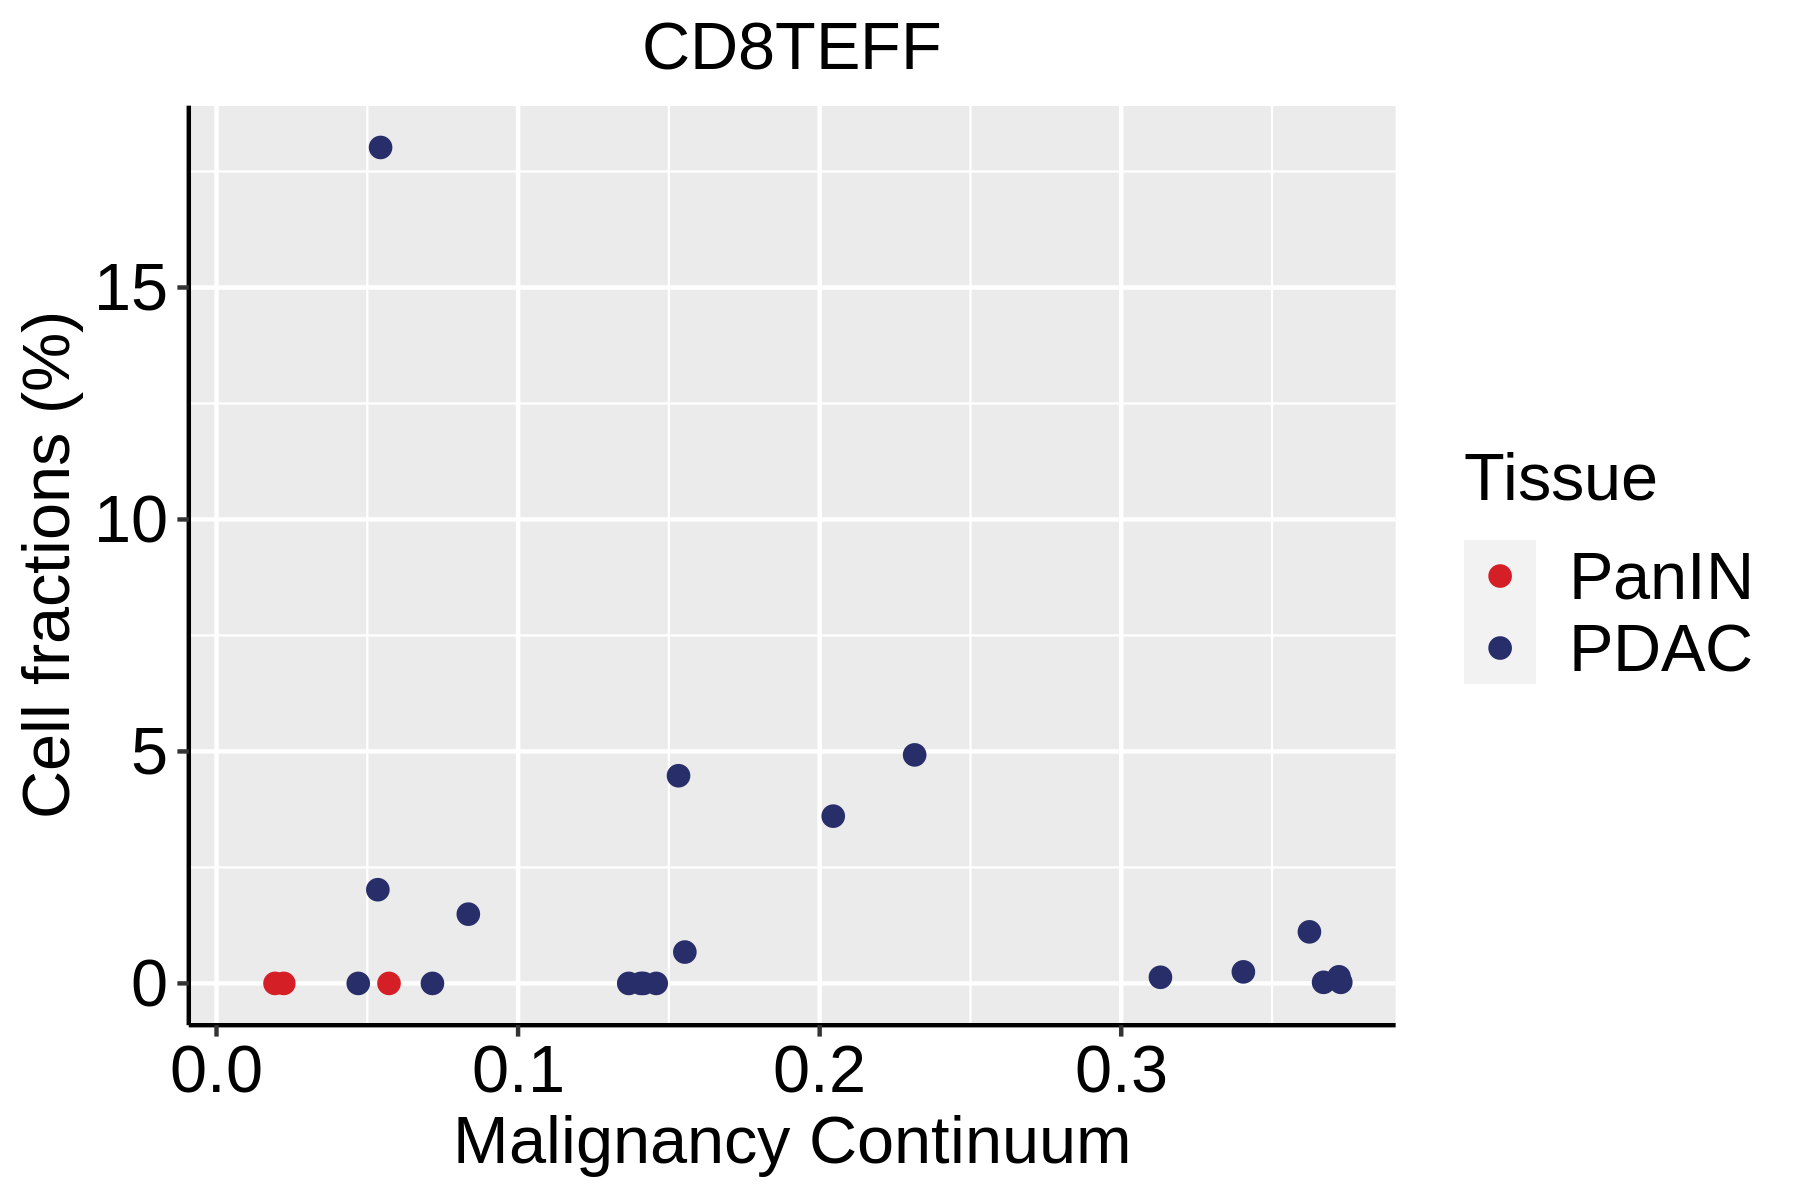
| Pancreas | Imm | CD8TEFF | Effector CD8+ T cells | CX3CR1,FCGR3A,FGFBP2,PRF1,GZMH,TBX21,EOMES,S1PR1 |
| Pancreas | Imm | GDT | Gamma-delta T cells | TRDC,TRGC1,TRGC2,NKG7,TIGIT |
| Pancreas | Imm | M2MAC | M2 macrophages | CSF1R,CSF3R,MRC1,IL10,CCL18,VSIG4,CHI3L1 |
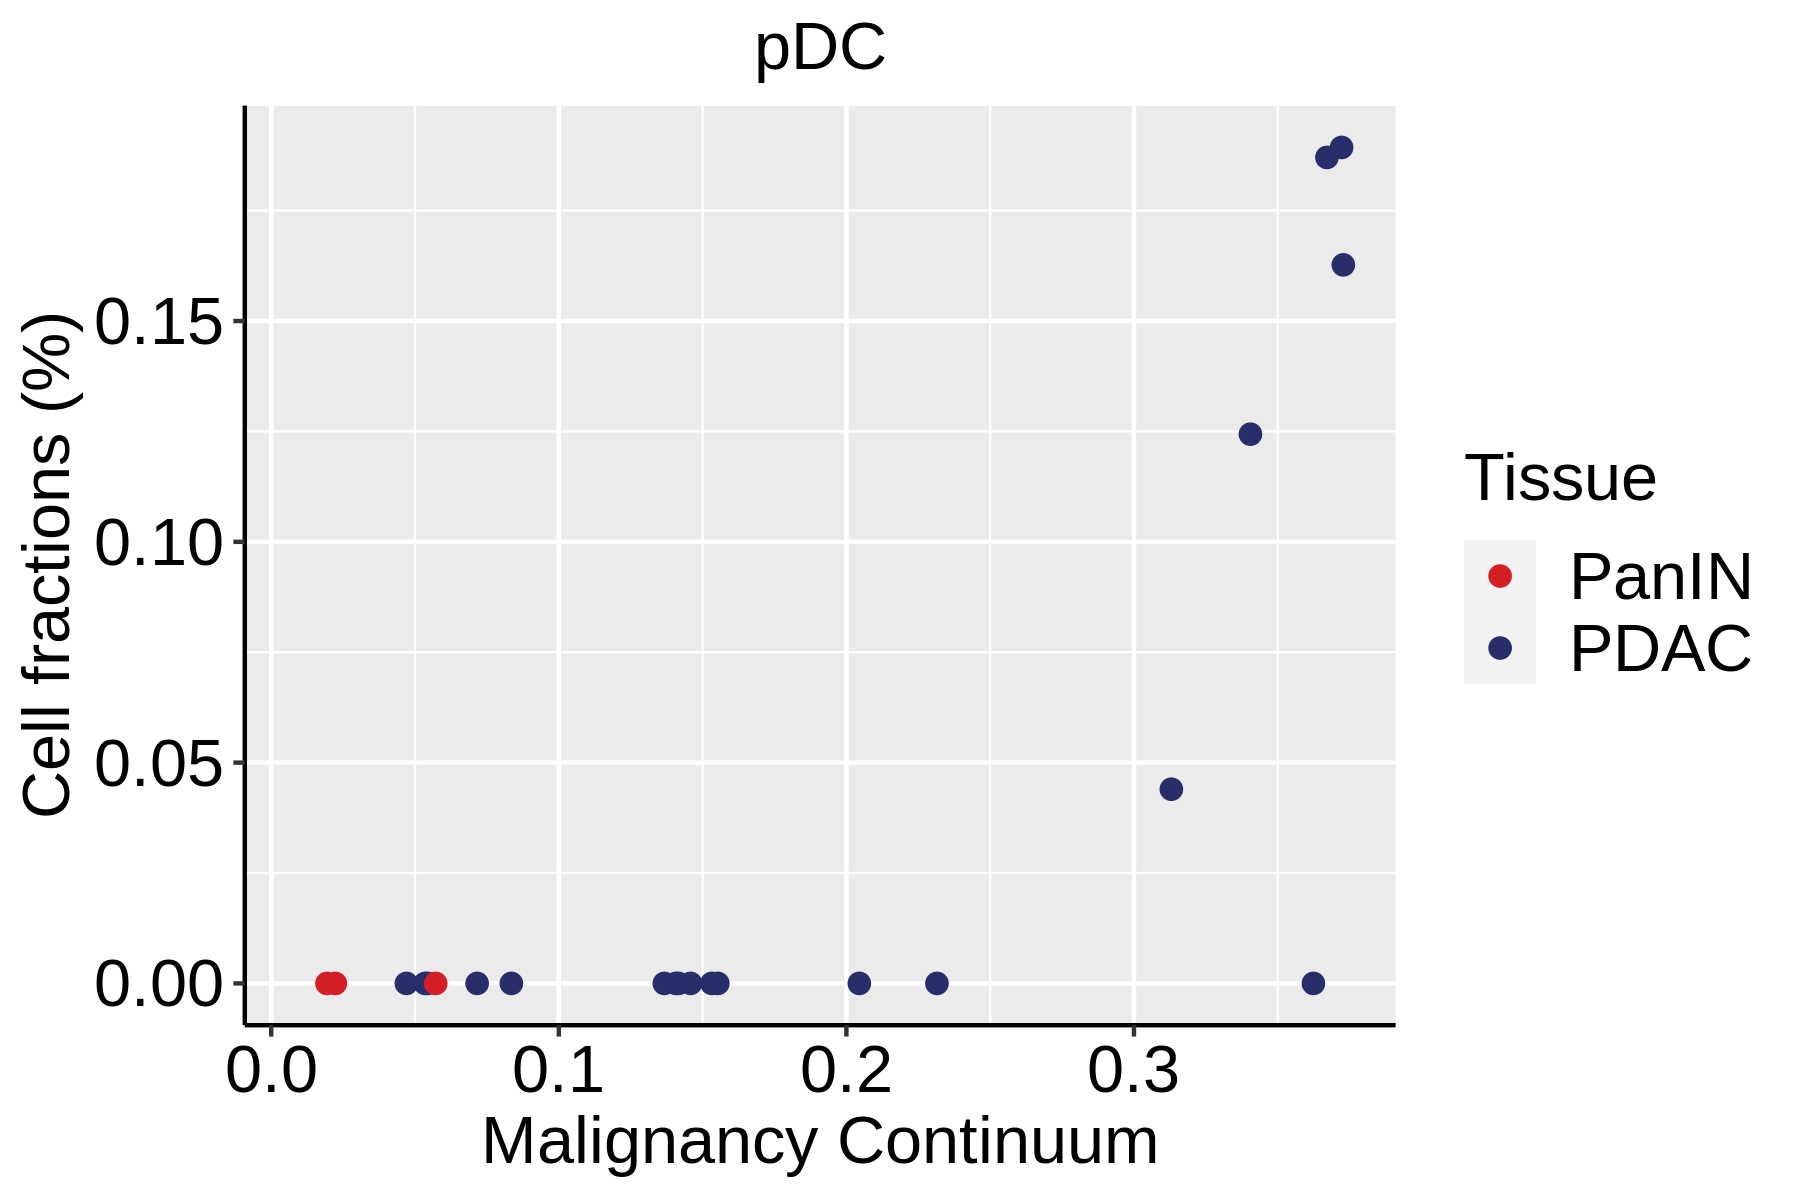
| Pancreas | Imm | pDC | Plasmacytoid dendritic cells | IL3RA,CLEC4C,NRP1,KLRD1 |
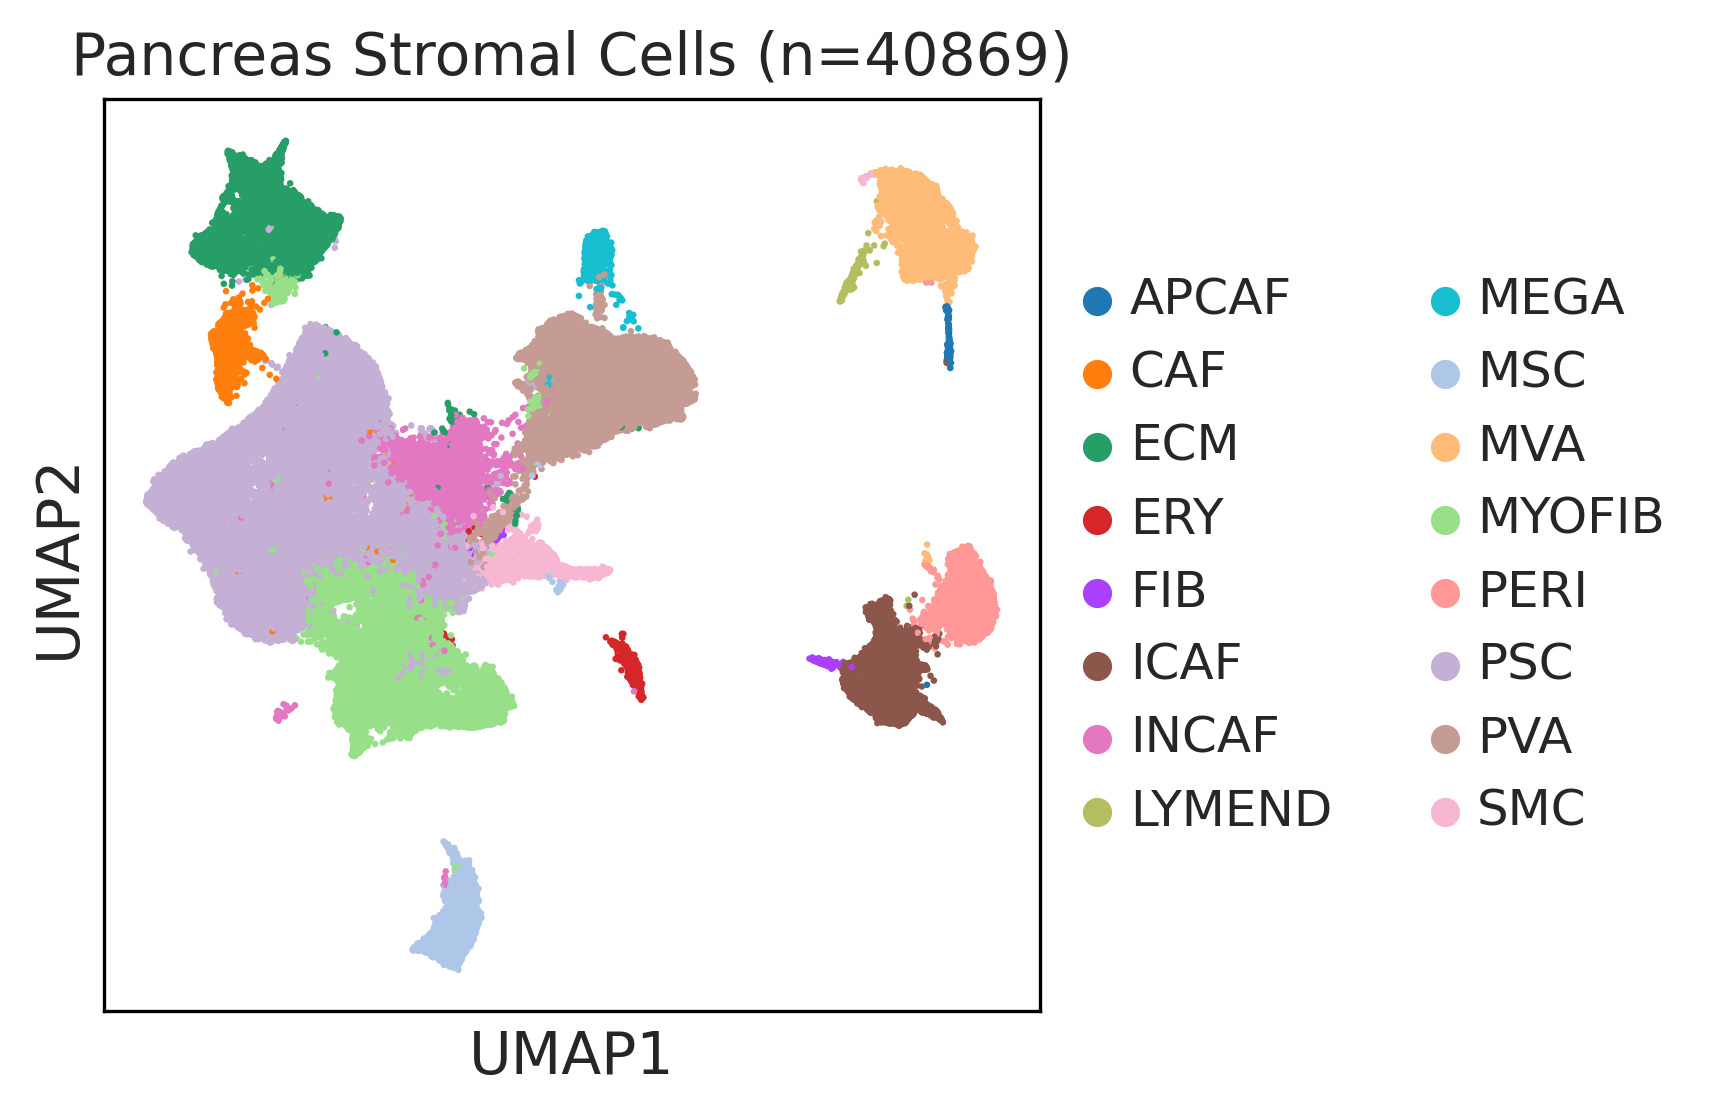
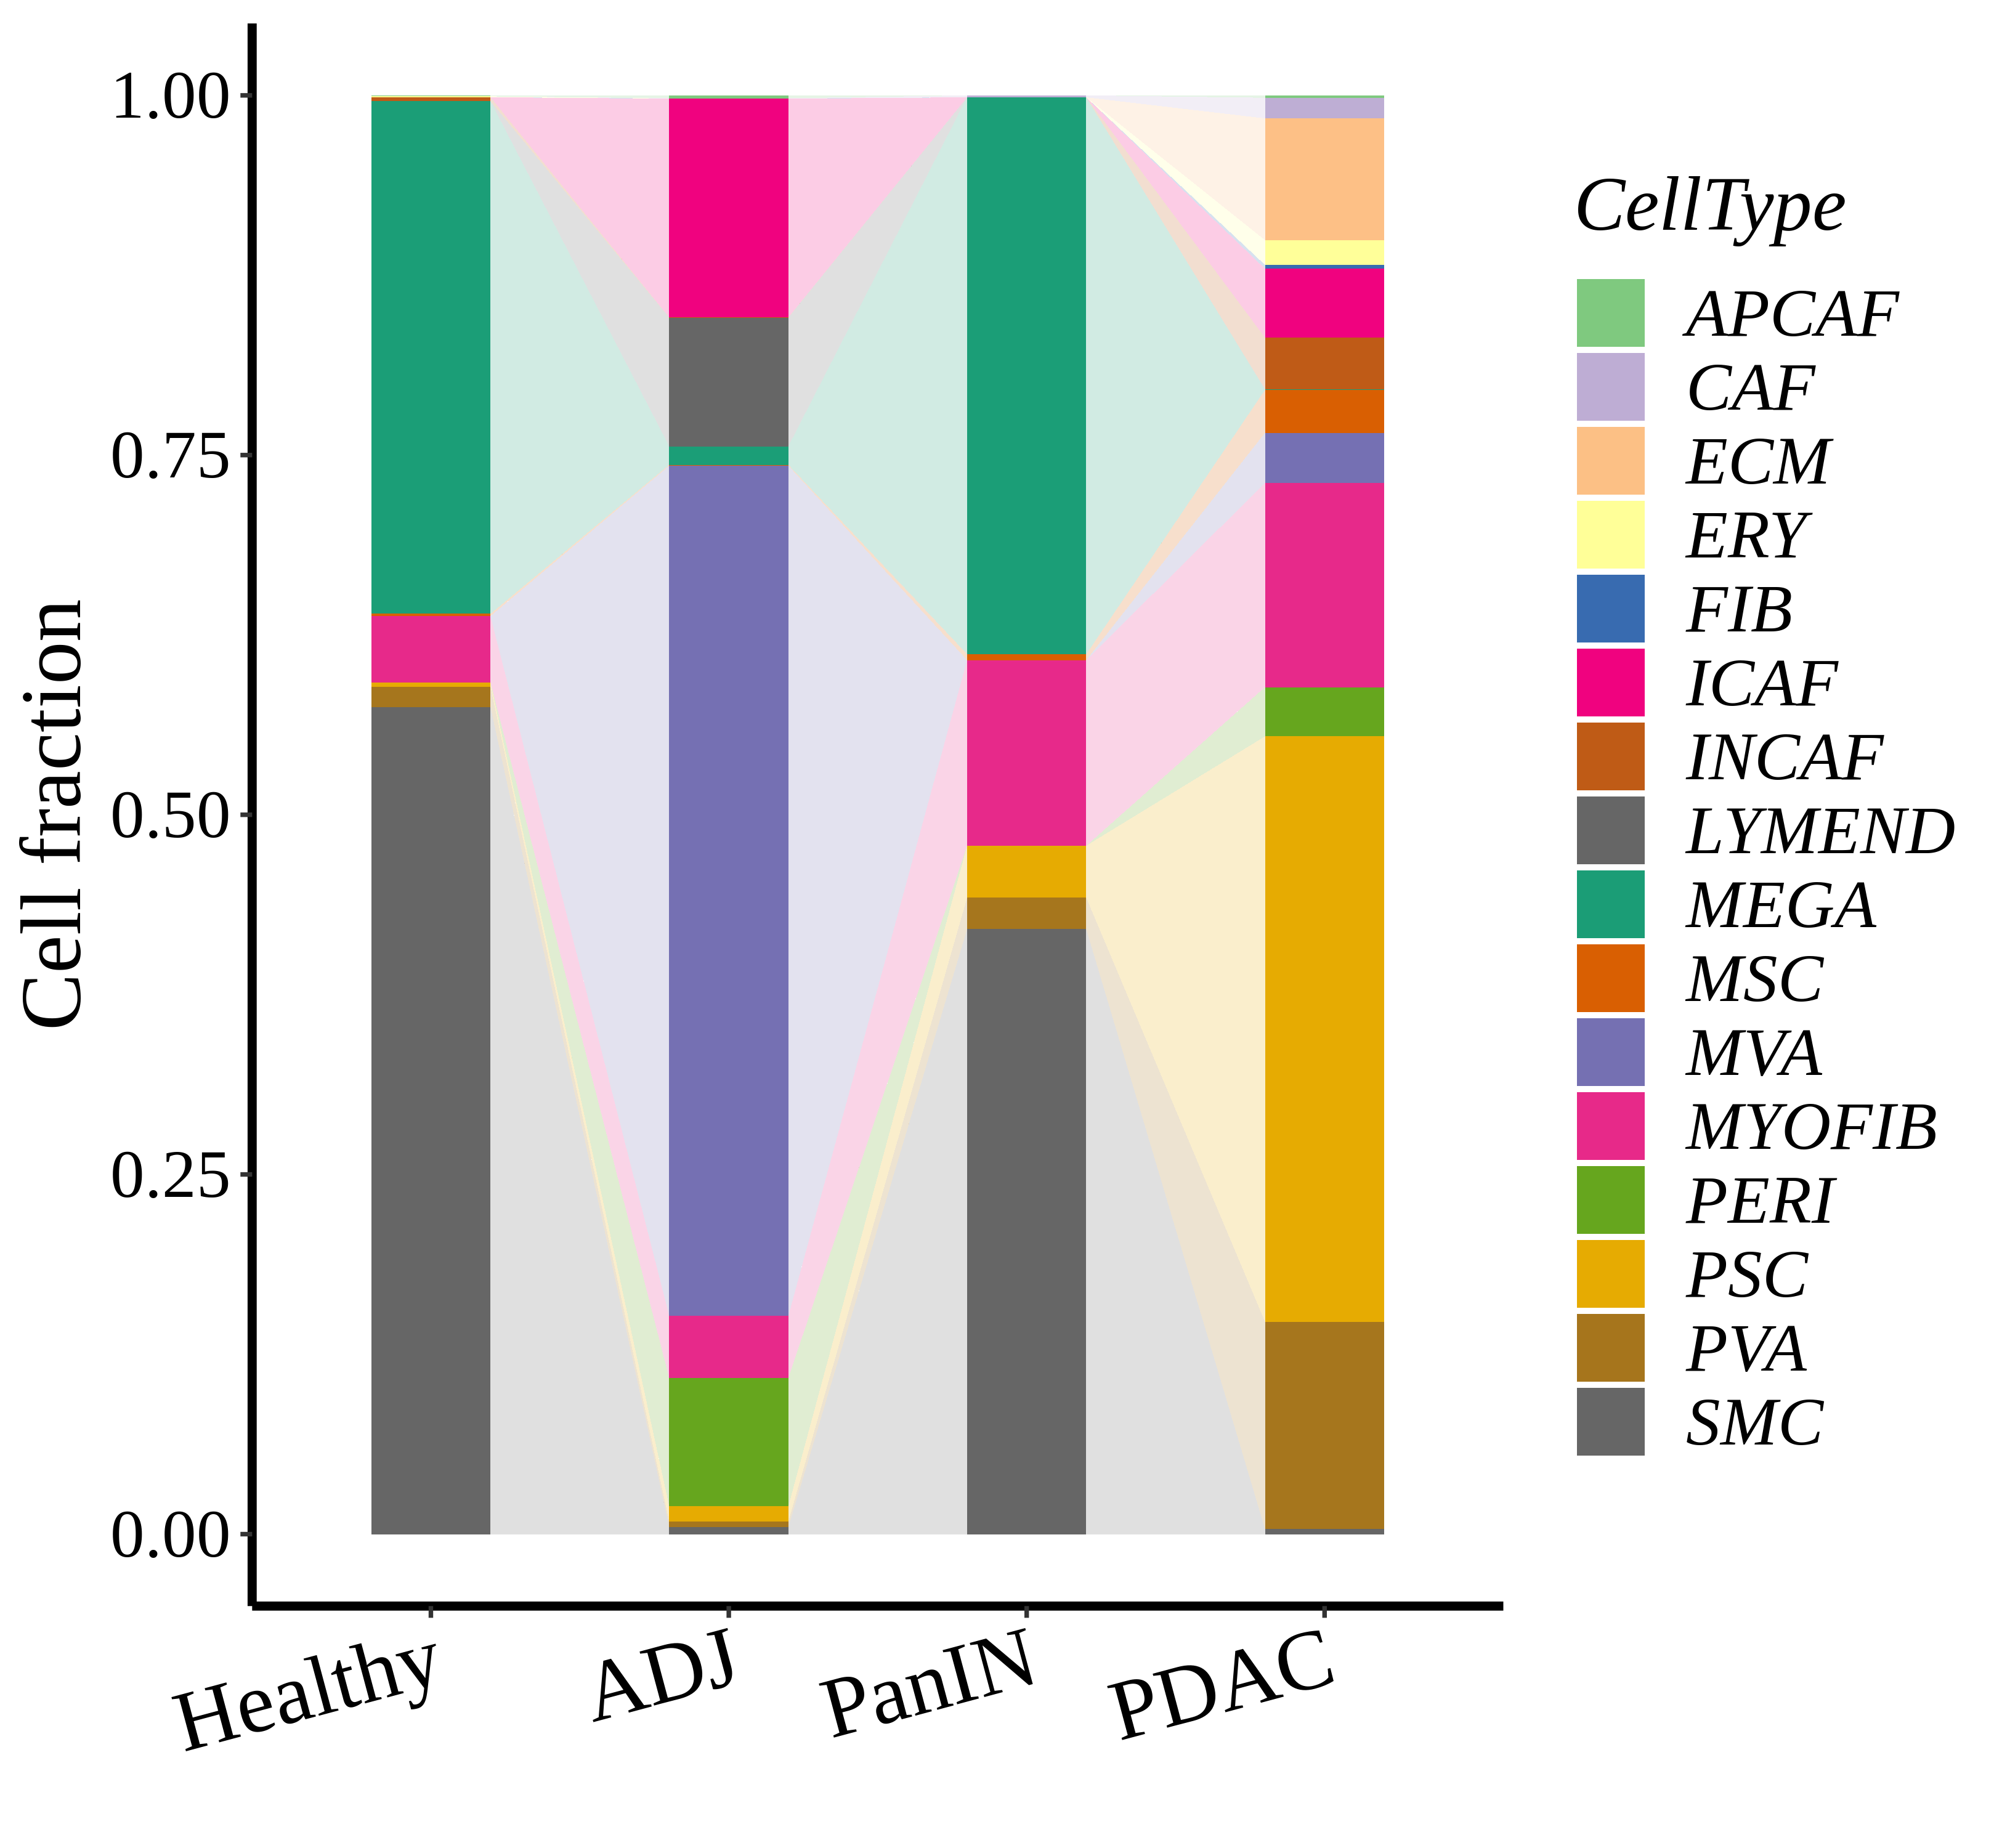
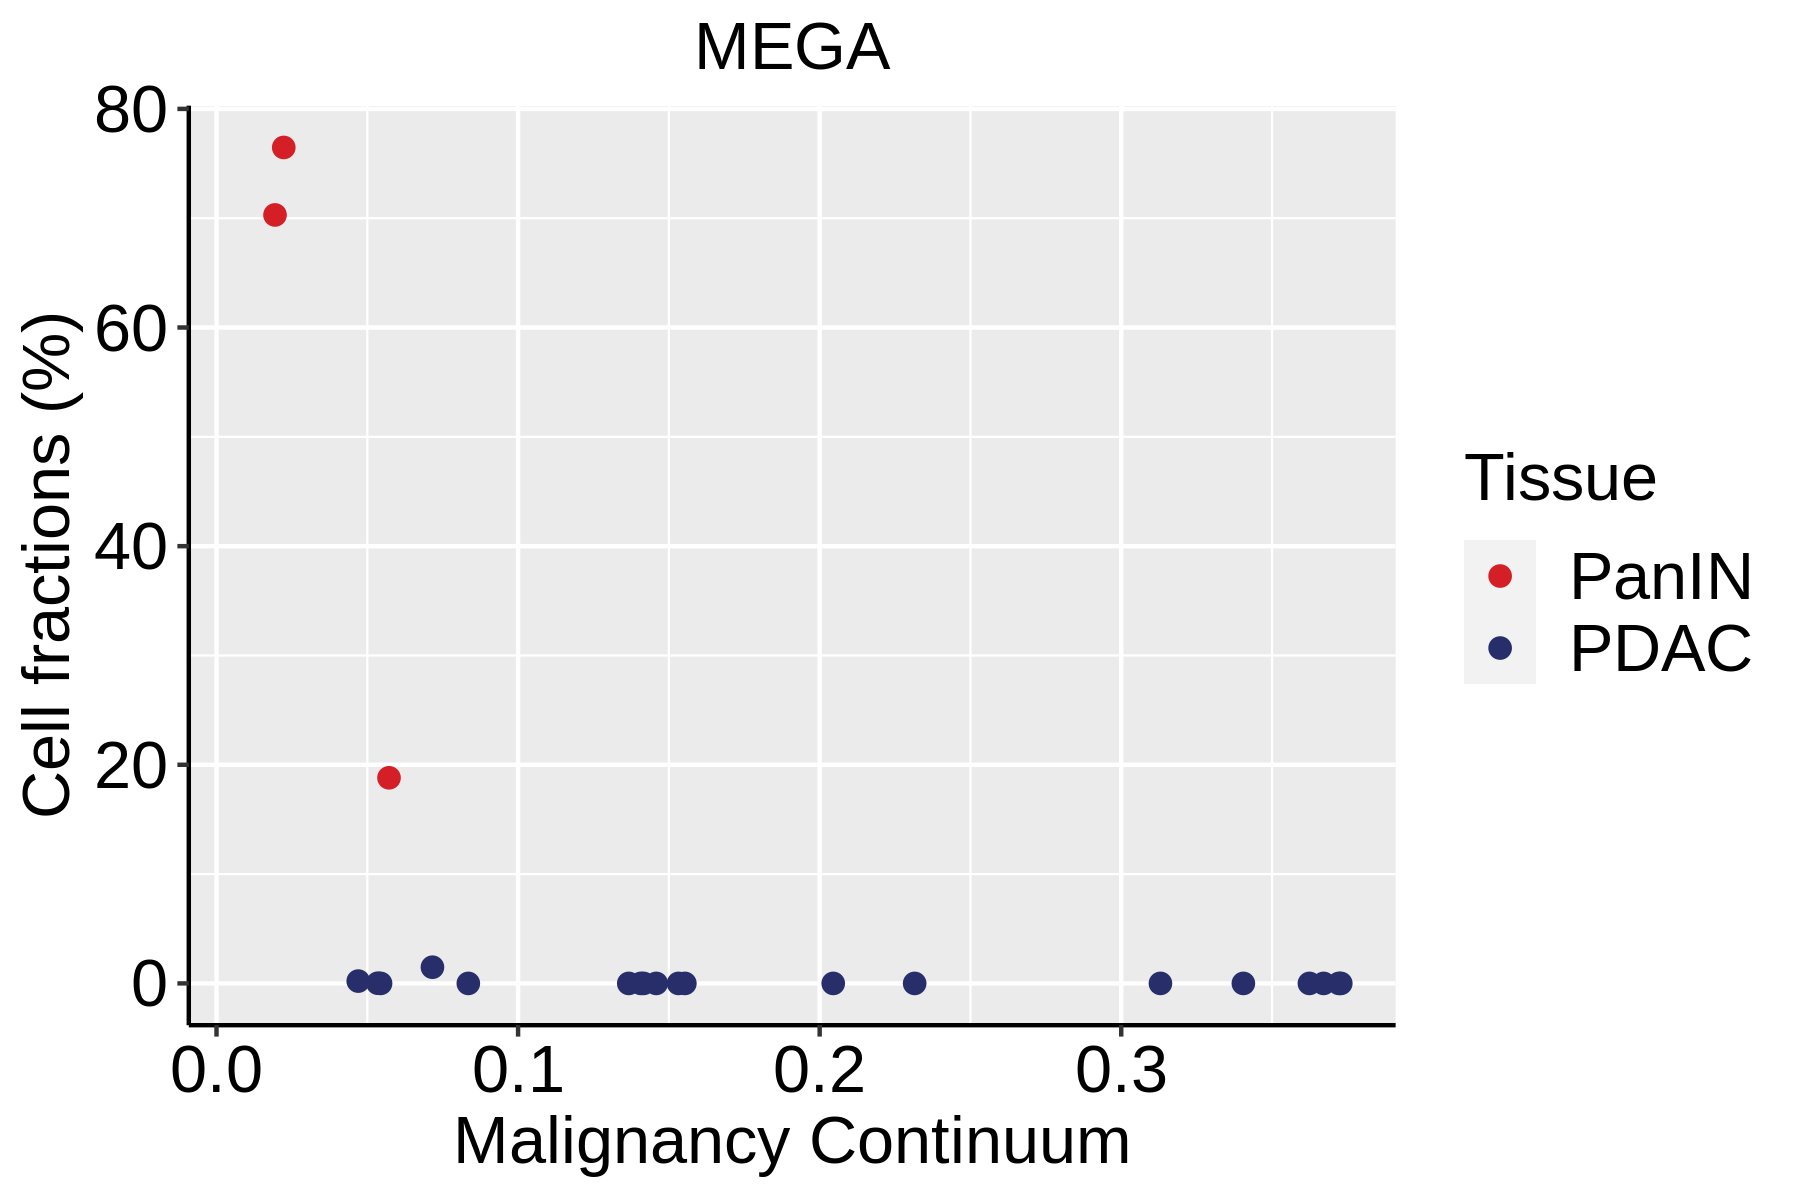
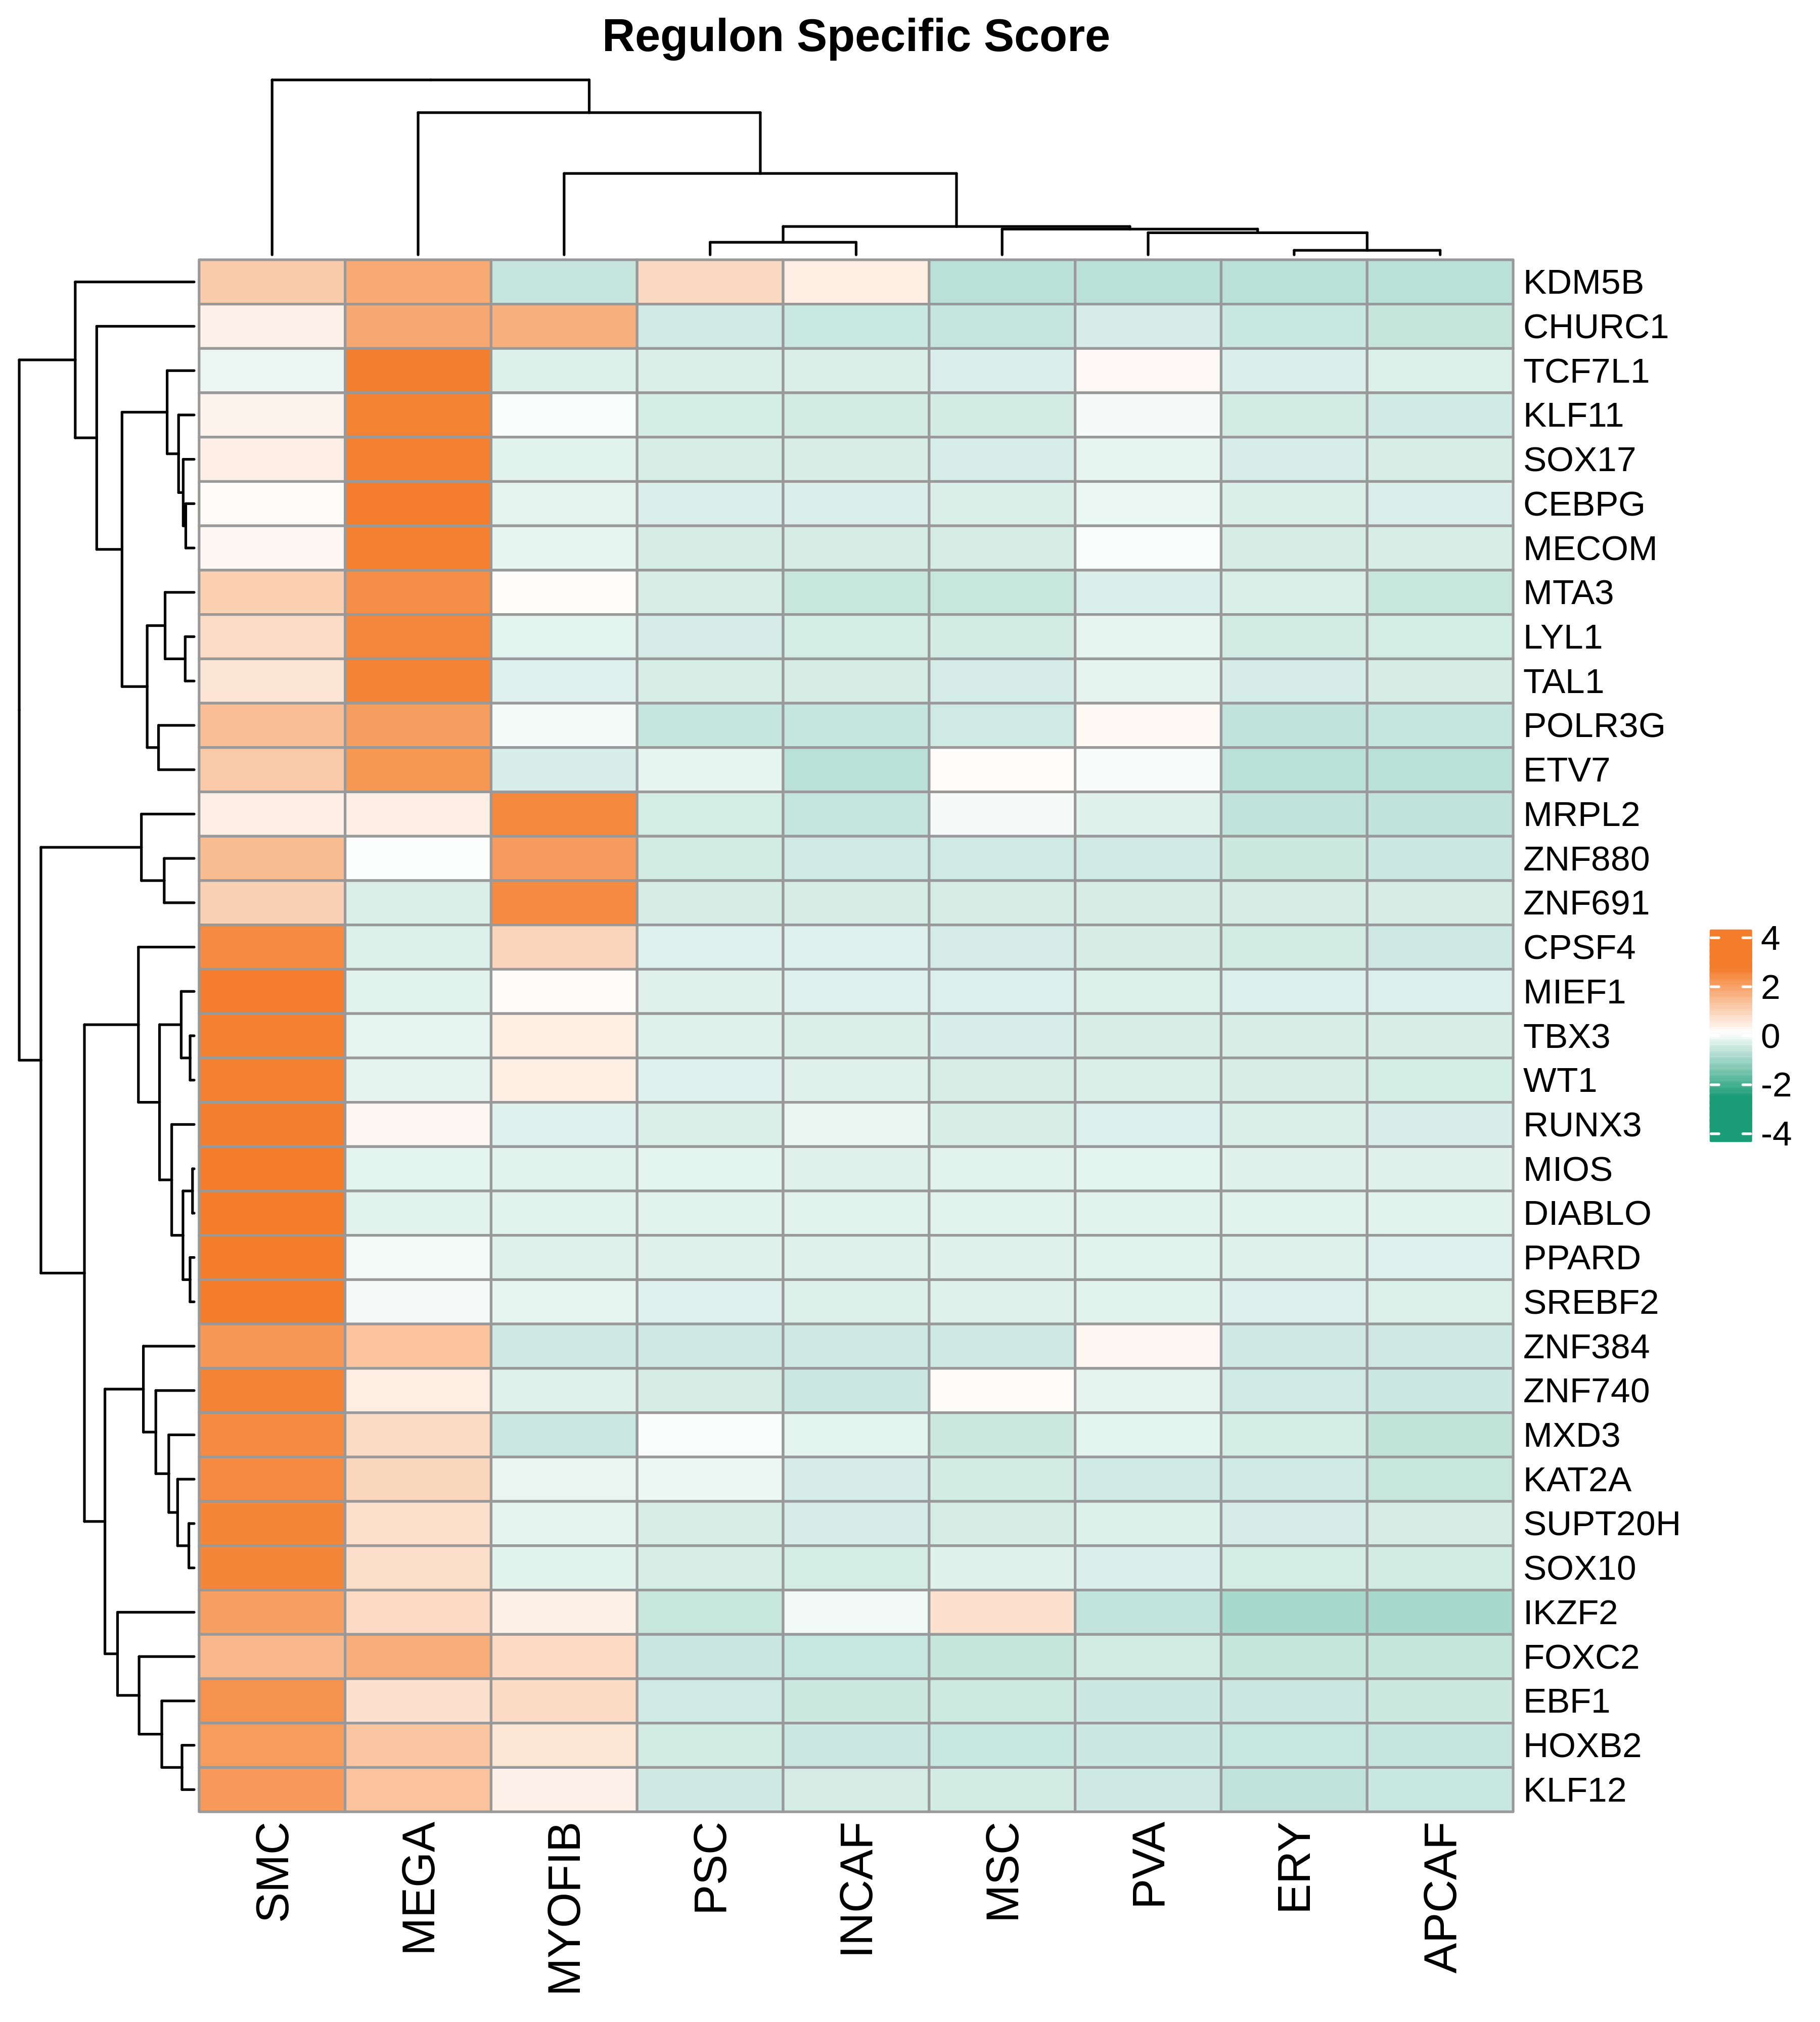
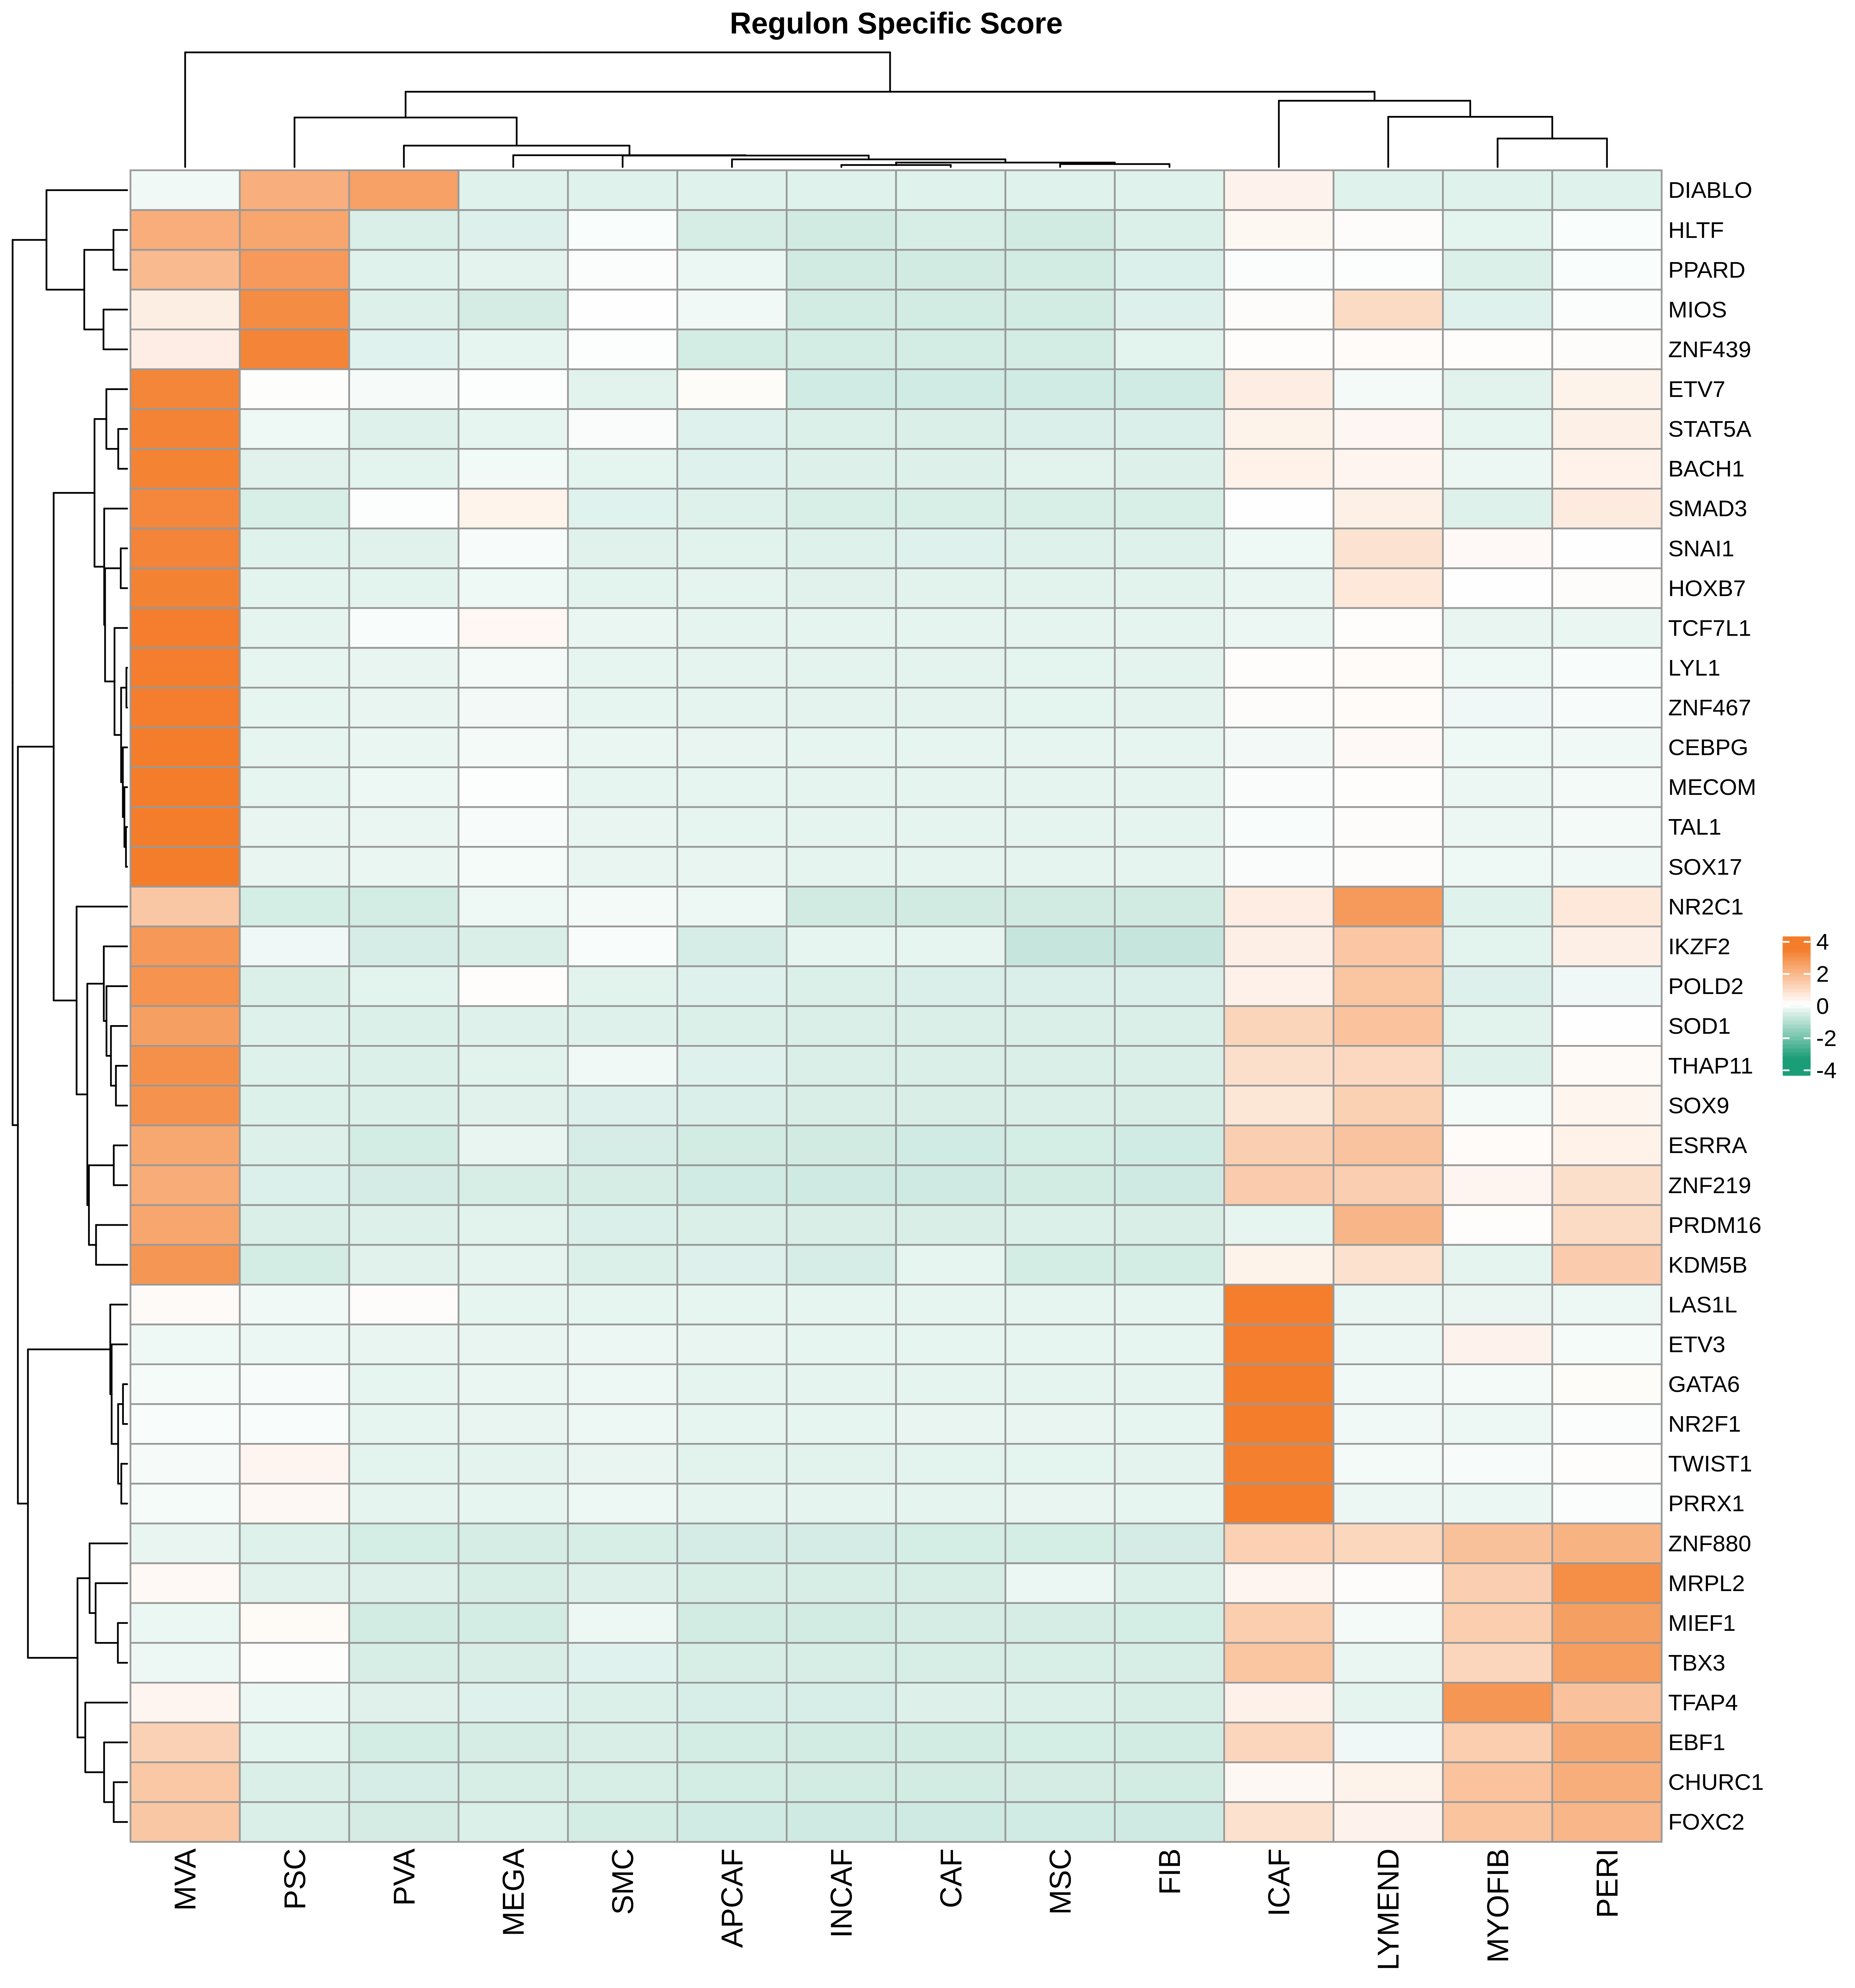
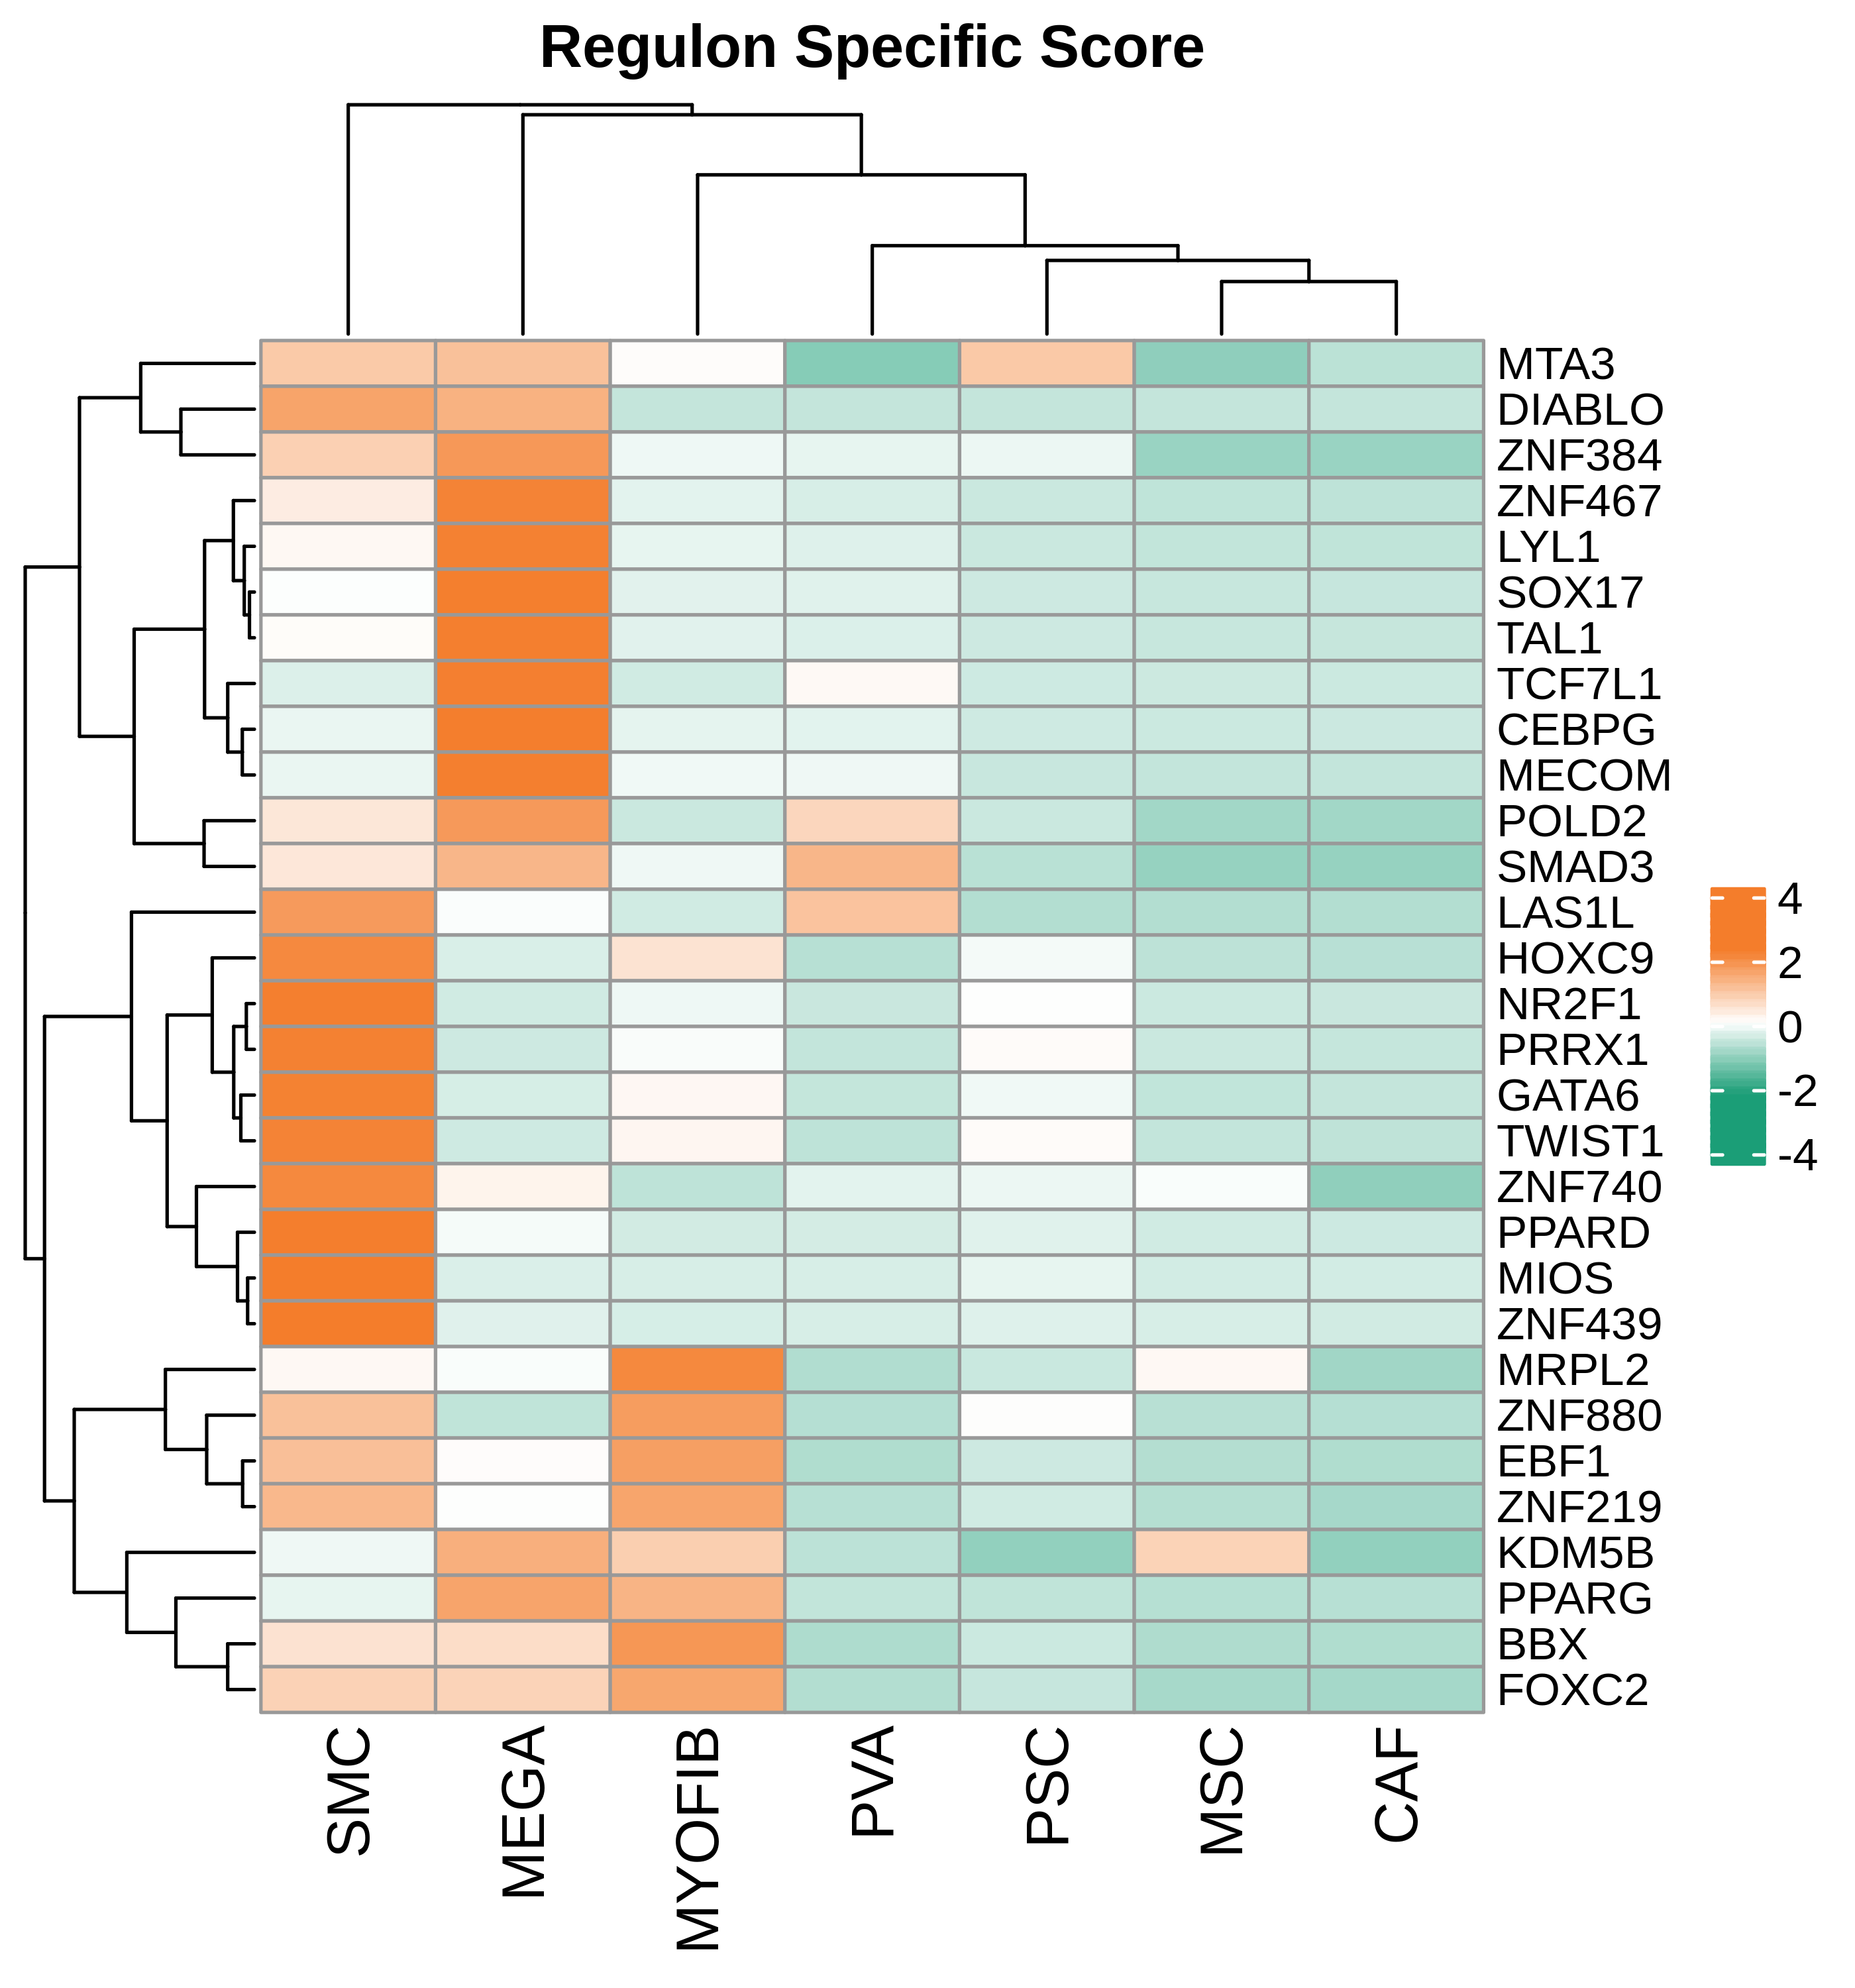
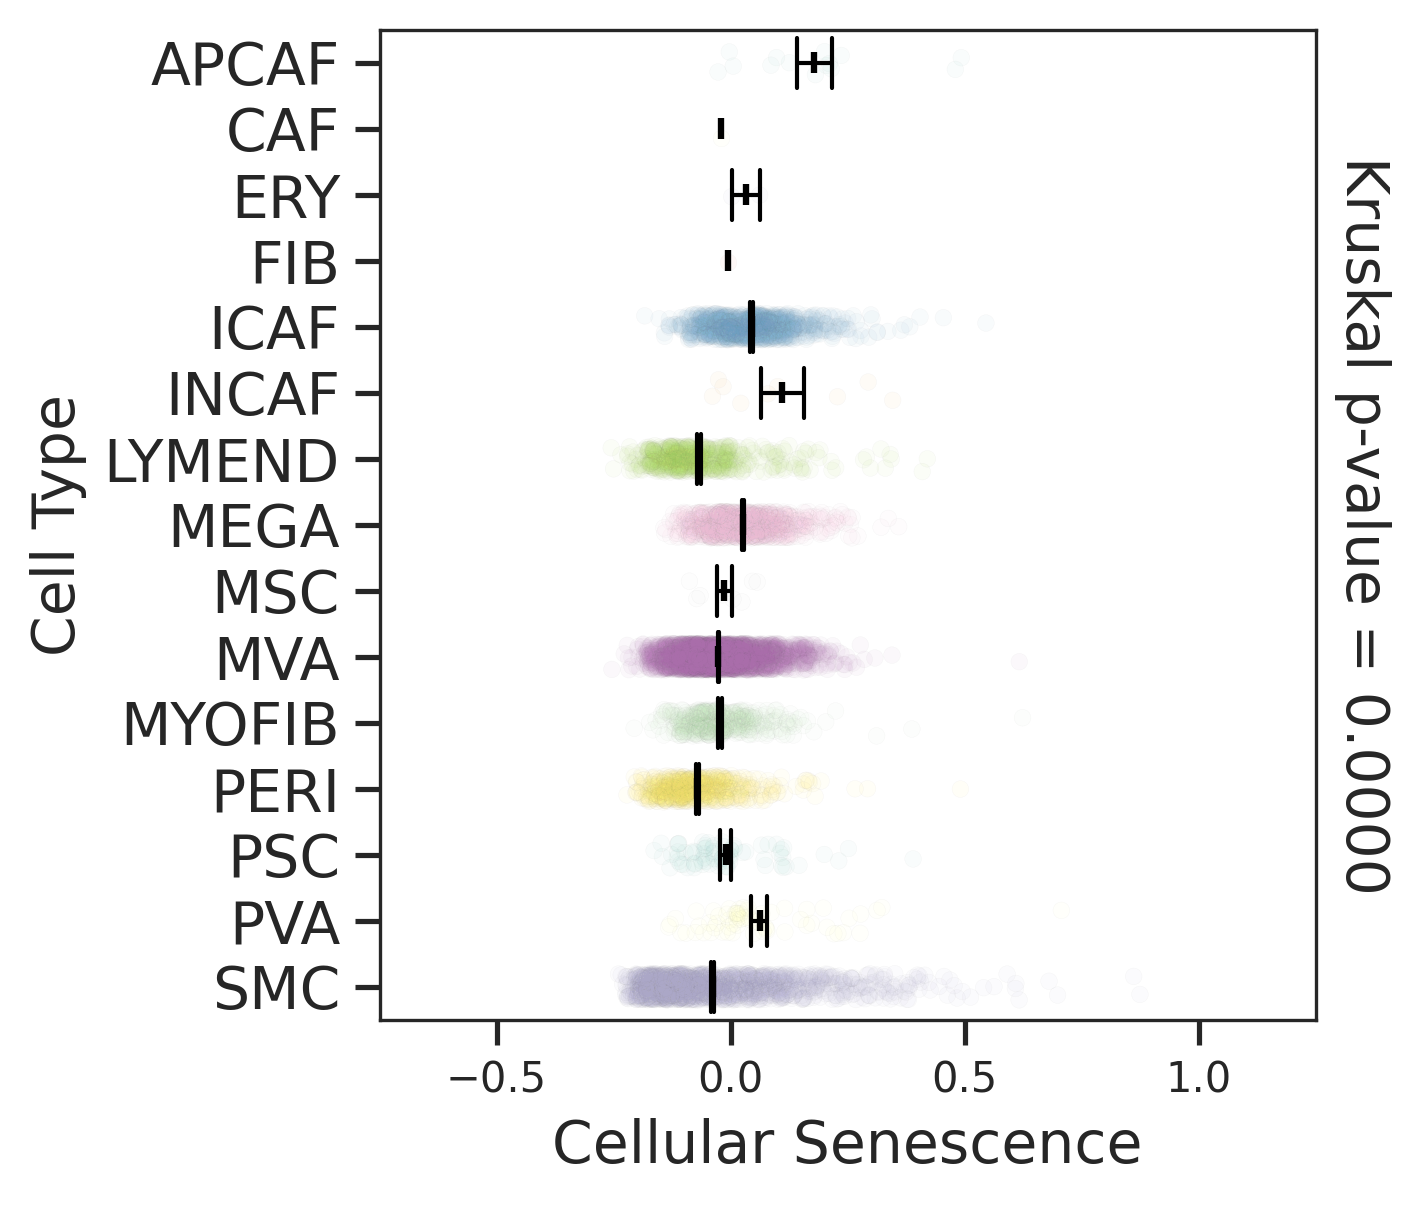
| Pancreas | Str | MEGA | Megakaryocytes | PF4,VWF,MPL,GP9,GP1BA,GP1BB,CD9,CD36,ITGA2B |
| Pancreas | Str | SMC | Smooth muscle cells | ACTA2,CNN1,MYH11,TAGLN,CALD1,TAGLN2 |
| Pancreas | Str | PVA | Post capillary venules | SELP,ZNF385D,FAM155A,GALNT15,MADCAM1,CORT |
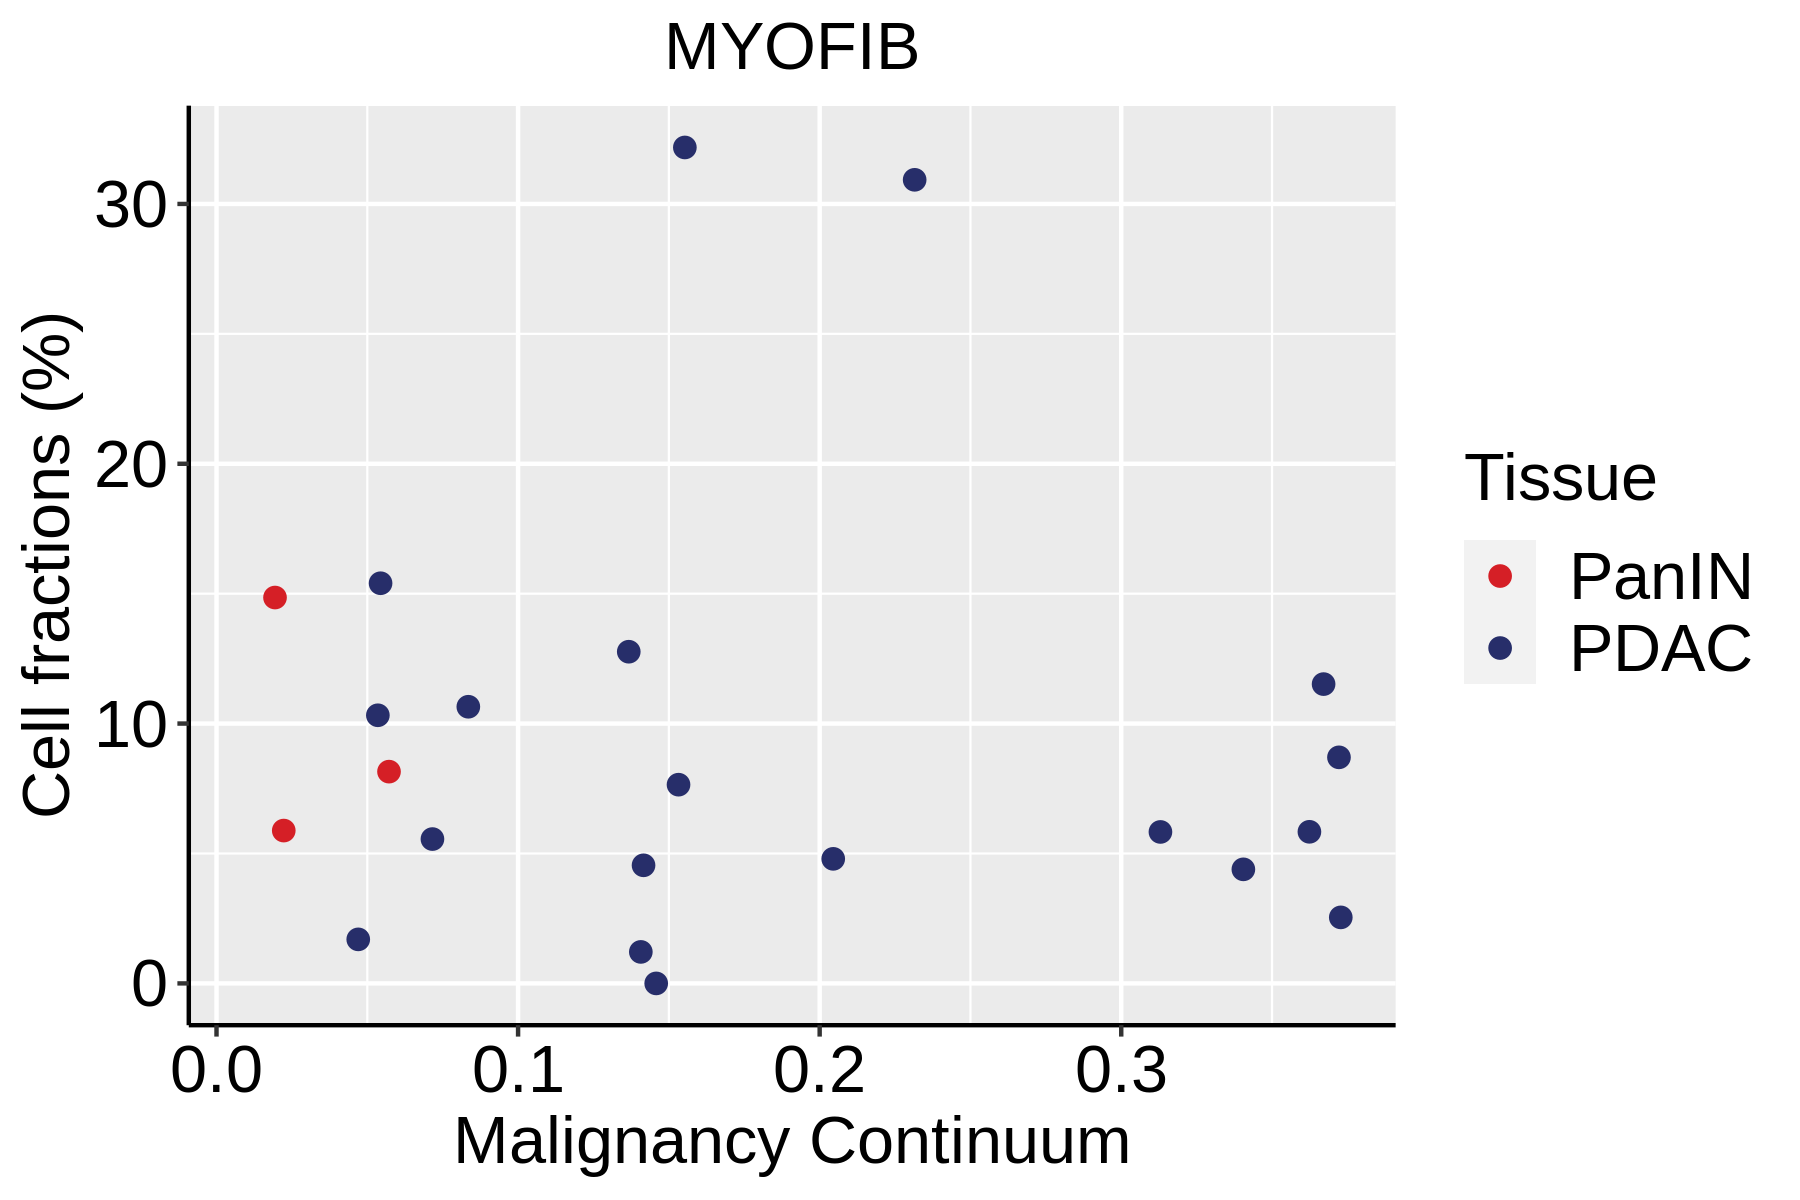
| Pancreas | Str | MYOFIB | Myofibroblasts | SYT10,SOSTDC1,DES,TAGLN,MYH11,TPM4 |
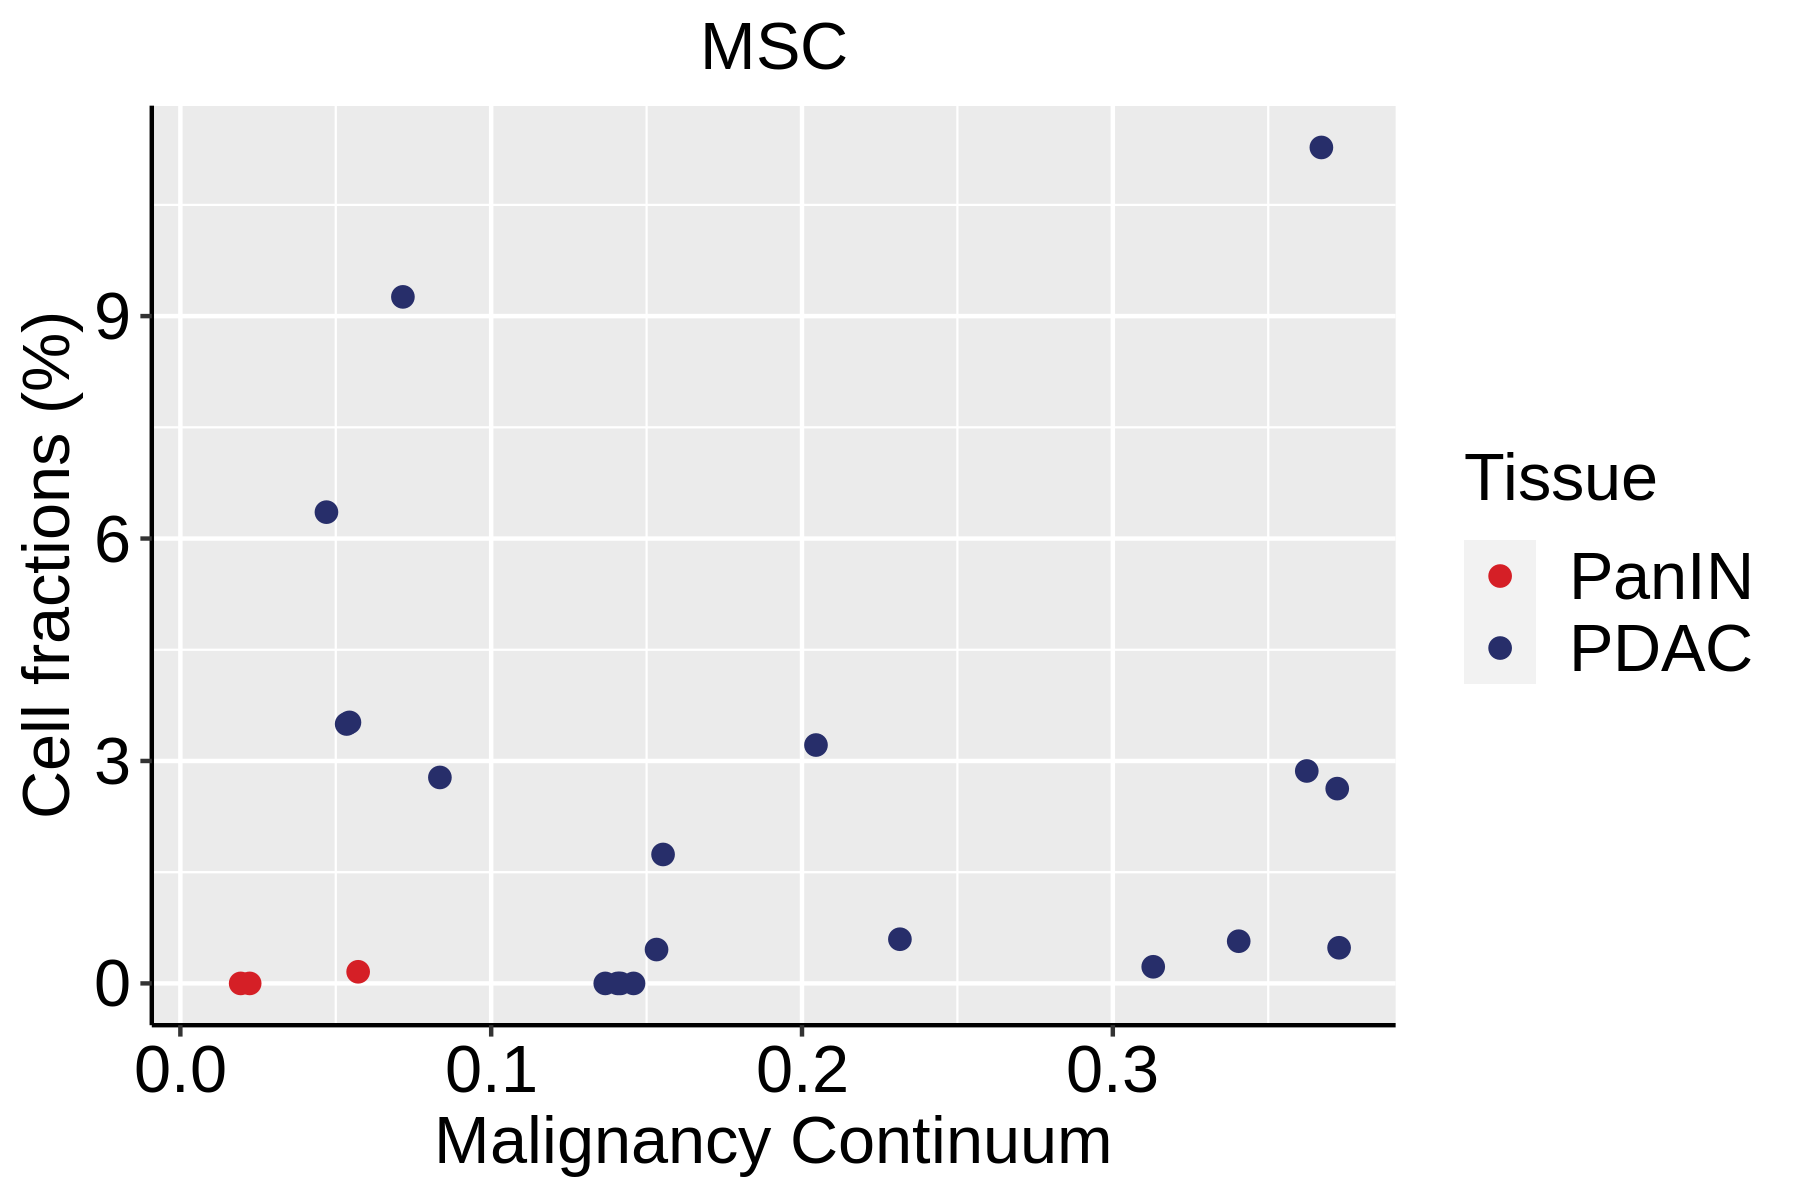
| Pancreas | Str | MSC | Mesenchymal stem cells | NT5E,THY1,ENG,CD44,ITGB1,MCAM,ENDOD1 |
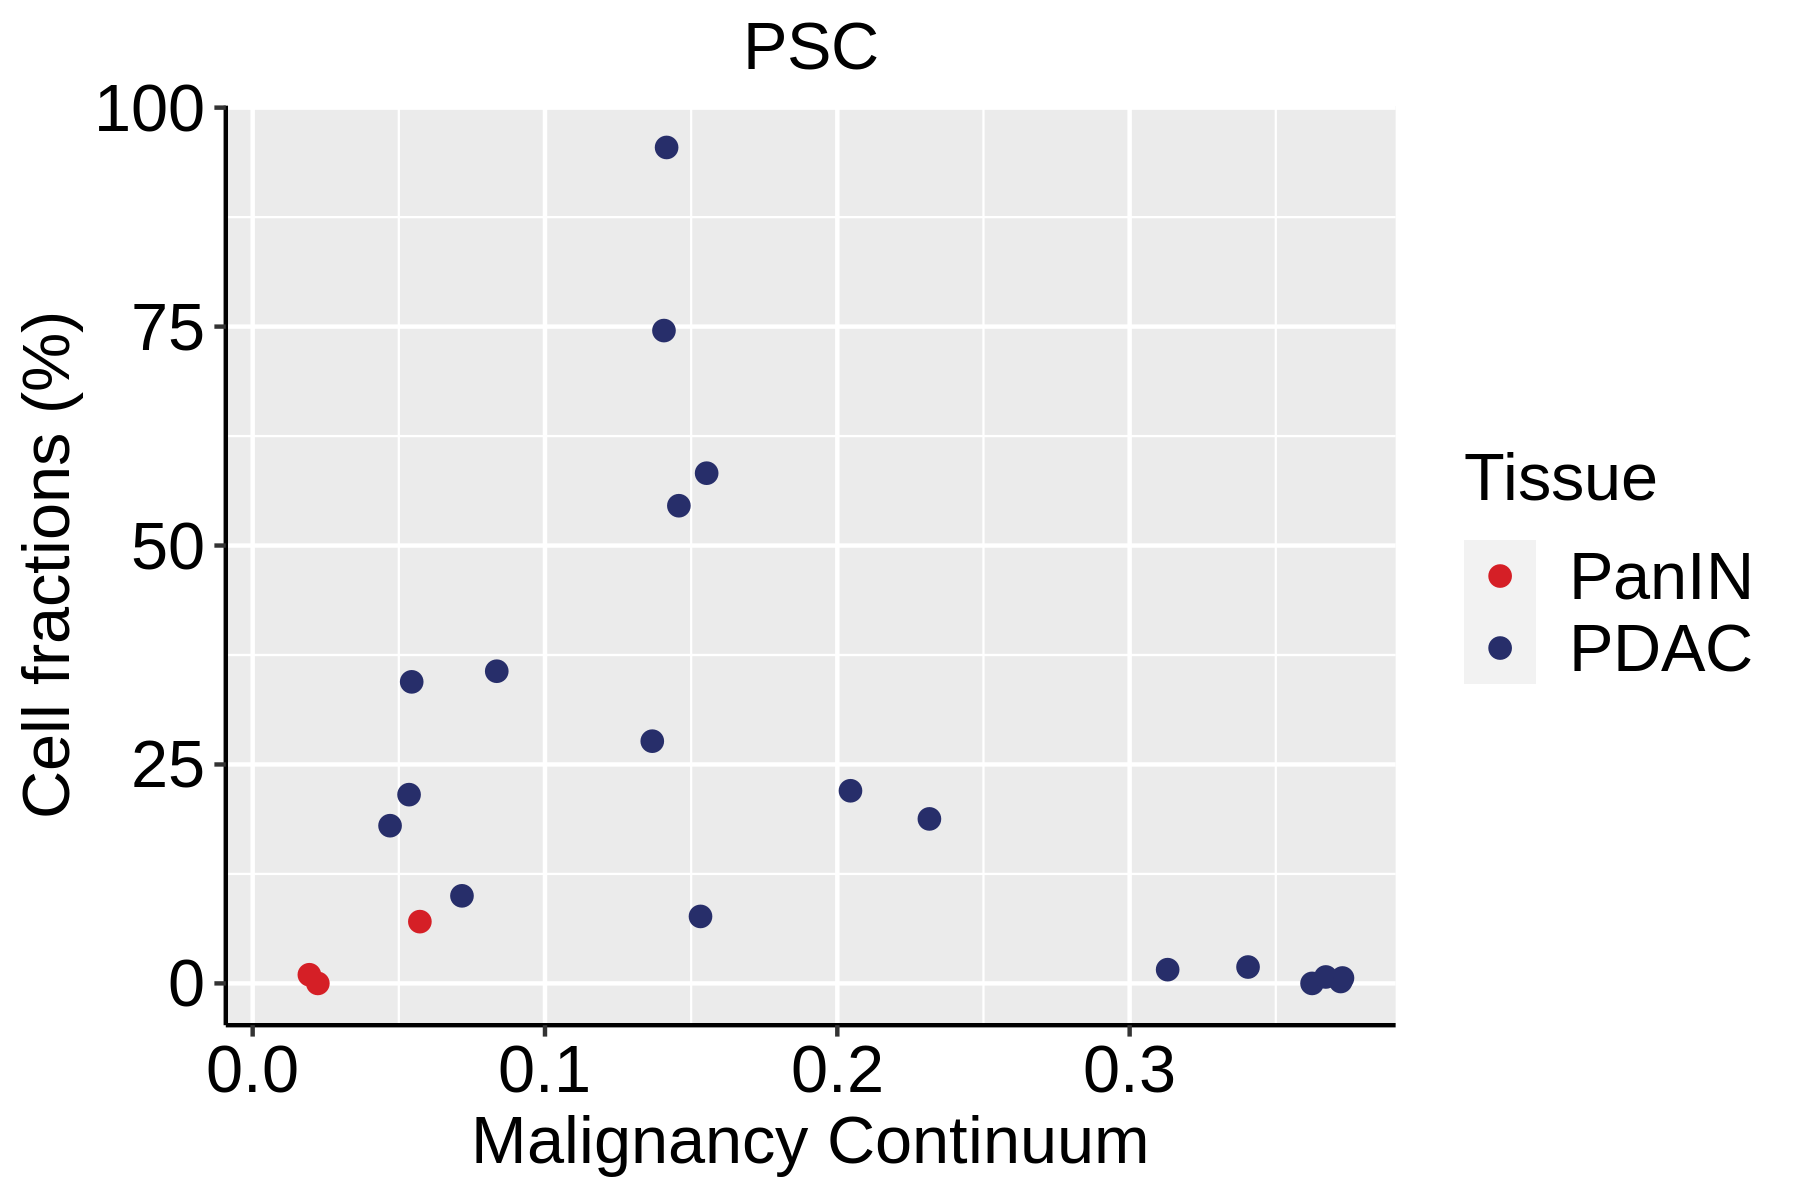
| Pancreas | Str | PSC | Pancreatic stellate cells | DES,ACTA2,VIM,NES,PDGFRB,SHH,COL1A1,COL1A2,COL3A1,COL4A1,COL4A2,MMP2,MMP9,MMP13 |
| Pancreas | Str | INCAF | Intermediate cancer-associated fibroblasts | PDGFRA,POSTN,ID1,ID3 |
| Pancreas | Str | ERY | Erythrocytes | HBD,GYPA,HBA1,HBA2,CA1,HBB,BRSK1 |
| Pancreas | Str | CAF | Cancer-associated fibroblasts | TWIST1,WNT2,FAP,CXCL1,CXCL2,CYR61 |
| Pancreas | Str | APCAF | Antigen-presenting cancer-associated fibroblasts | CD74,SAA2,SAA1 |
| Pancreas | Str | FIB | Fibroblasts | BMP7,MAP3K2,COL6A1,CD36,CD44,CBLN2,SPOCK1,ACSS3,FN1,COL3A1,BGN,DCN,POSTN,C1R,MMP2,FGF7,MME,CD47 |
| Pancreas | Str | PERI | Pericytes | PDGFRA,CSPG4,RGS5,MCAM,COX4I2,KCNJ8,HIGD1B,NOTCH3,HEYL,FAM162B |
| Pancreas | Str | ICAF | Inflammatory cancer-associated fibroblasts | TWIST1,WNT2,FAP,CXCL1,CXCL2,CYR61,IL1B,IL6,HGF |
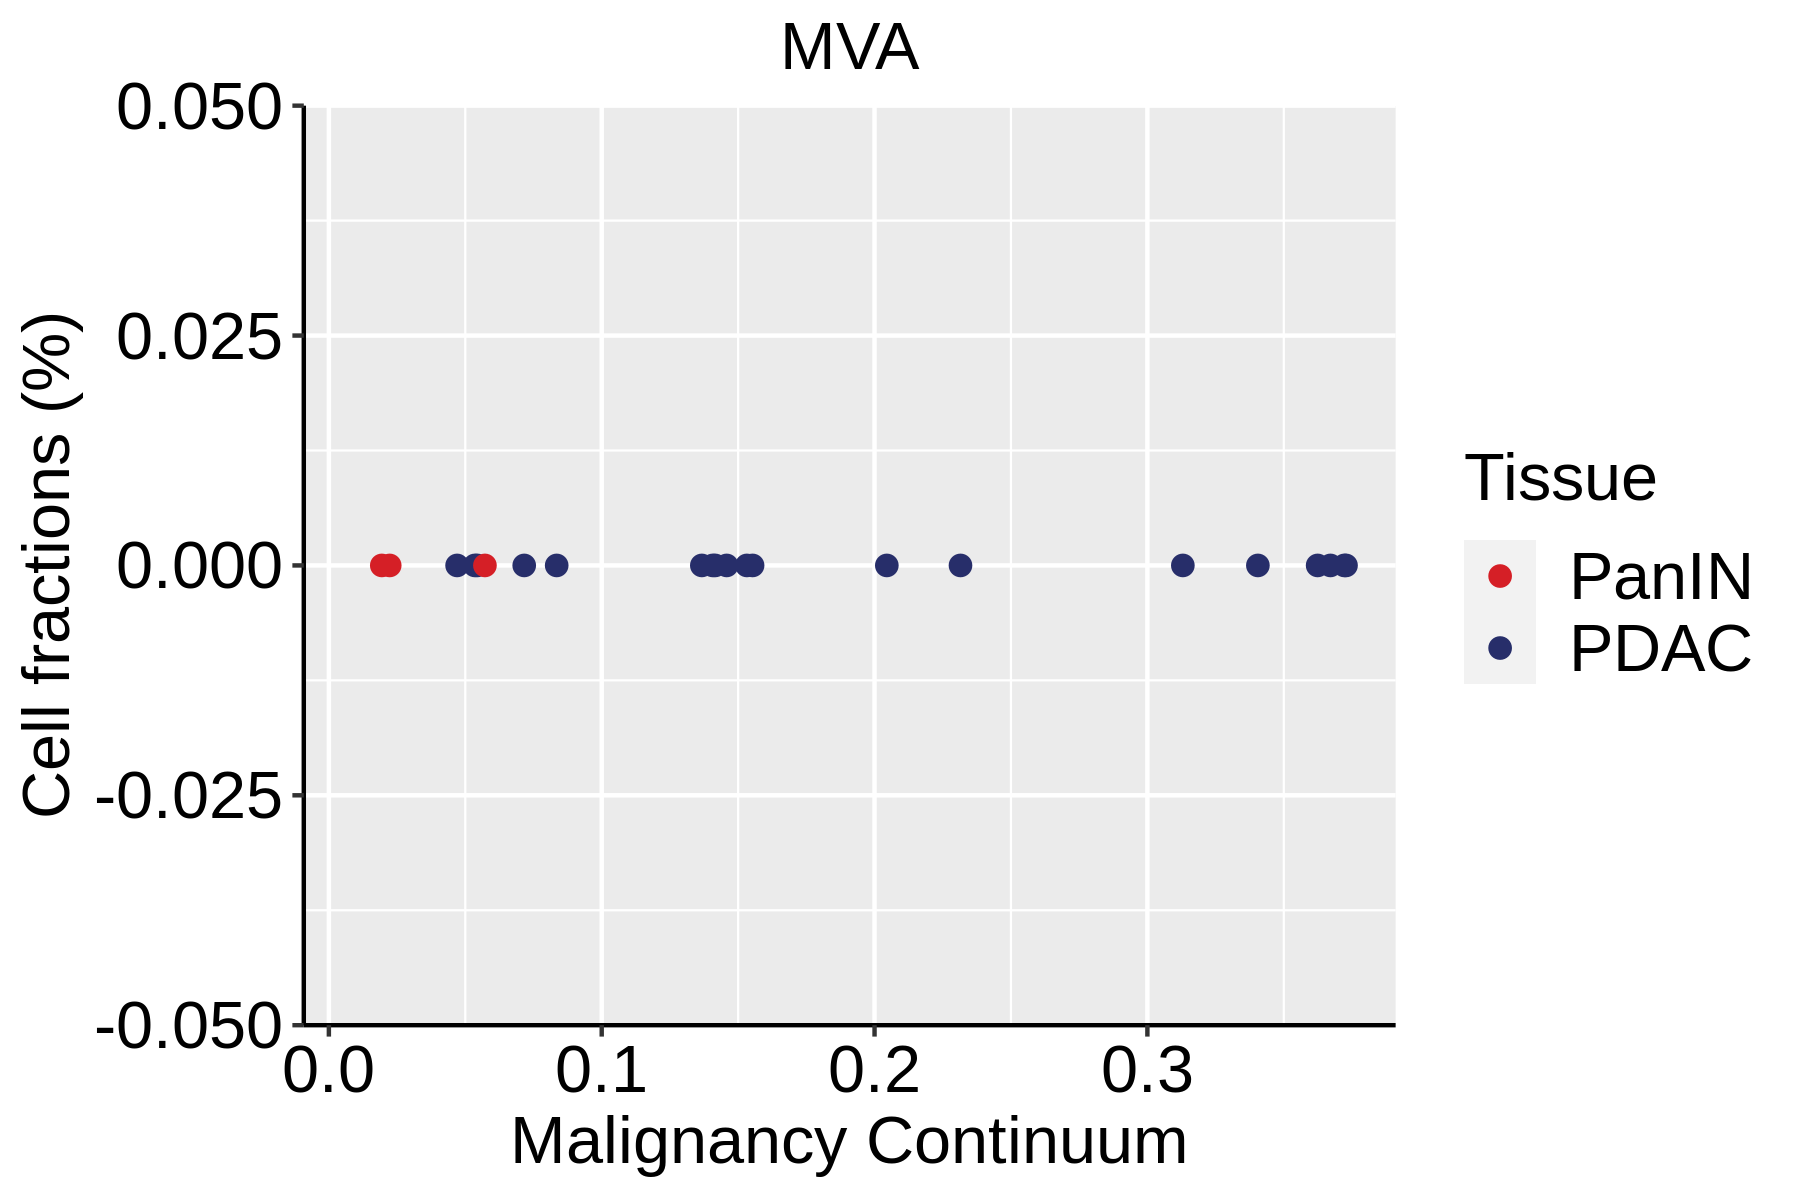
| Pancreas | Str | MVA | Microvascular cells | PLVAP,CD36,DYSF,NRP1,SH3BP5,EXOC3L2,FABP5,VWA1,BAALC,PRSS23,RAPGEF4,APLN,HTRA1 |
| Pancreas | Str | LYMEND | Lymphatic endothelial cells | PROX1,LYVE1,PDPN,PROCR,FLT4 |
| Pancreas | Str | ECM | Extracellular matrix | FBLN1,PCOLCE2,MFAP5 |