|
|||||
|
 | |
| |
| |
| |
| |
| |
| |
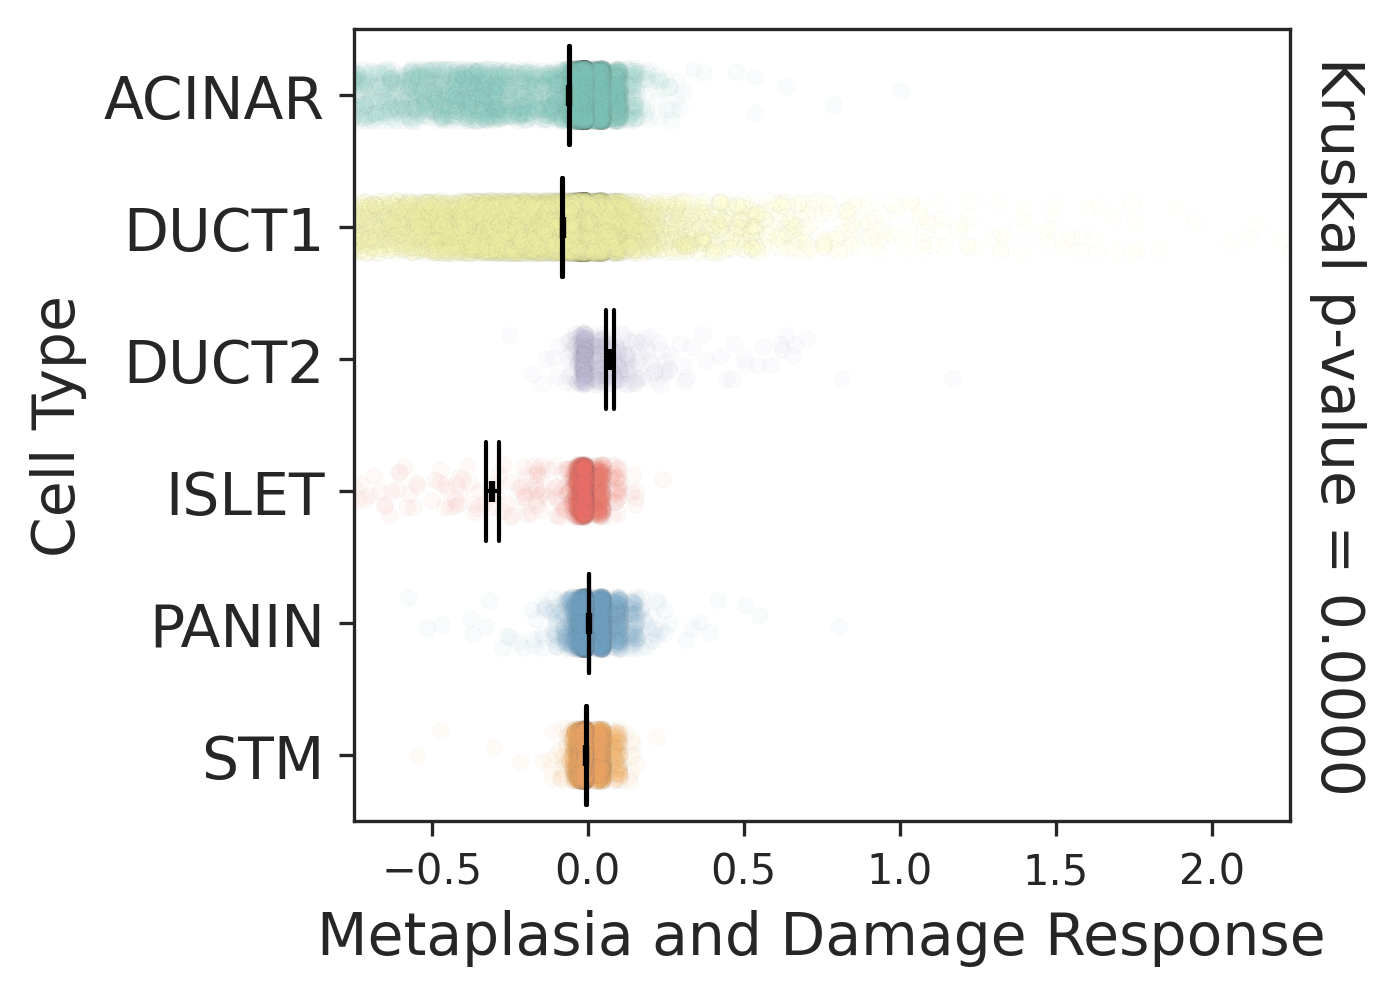
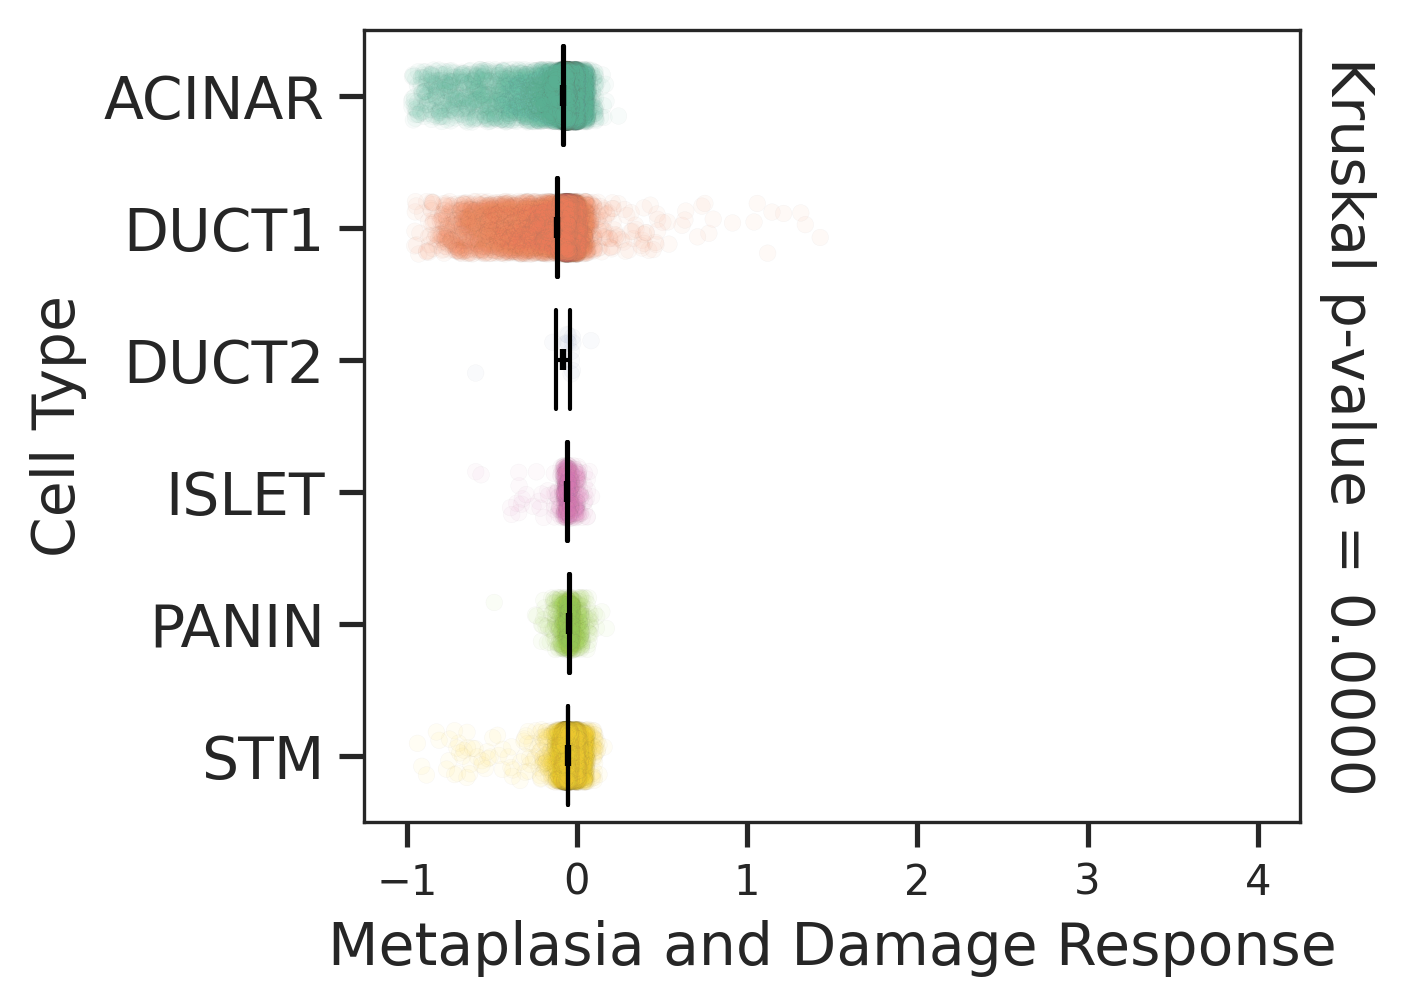
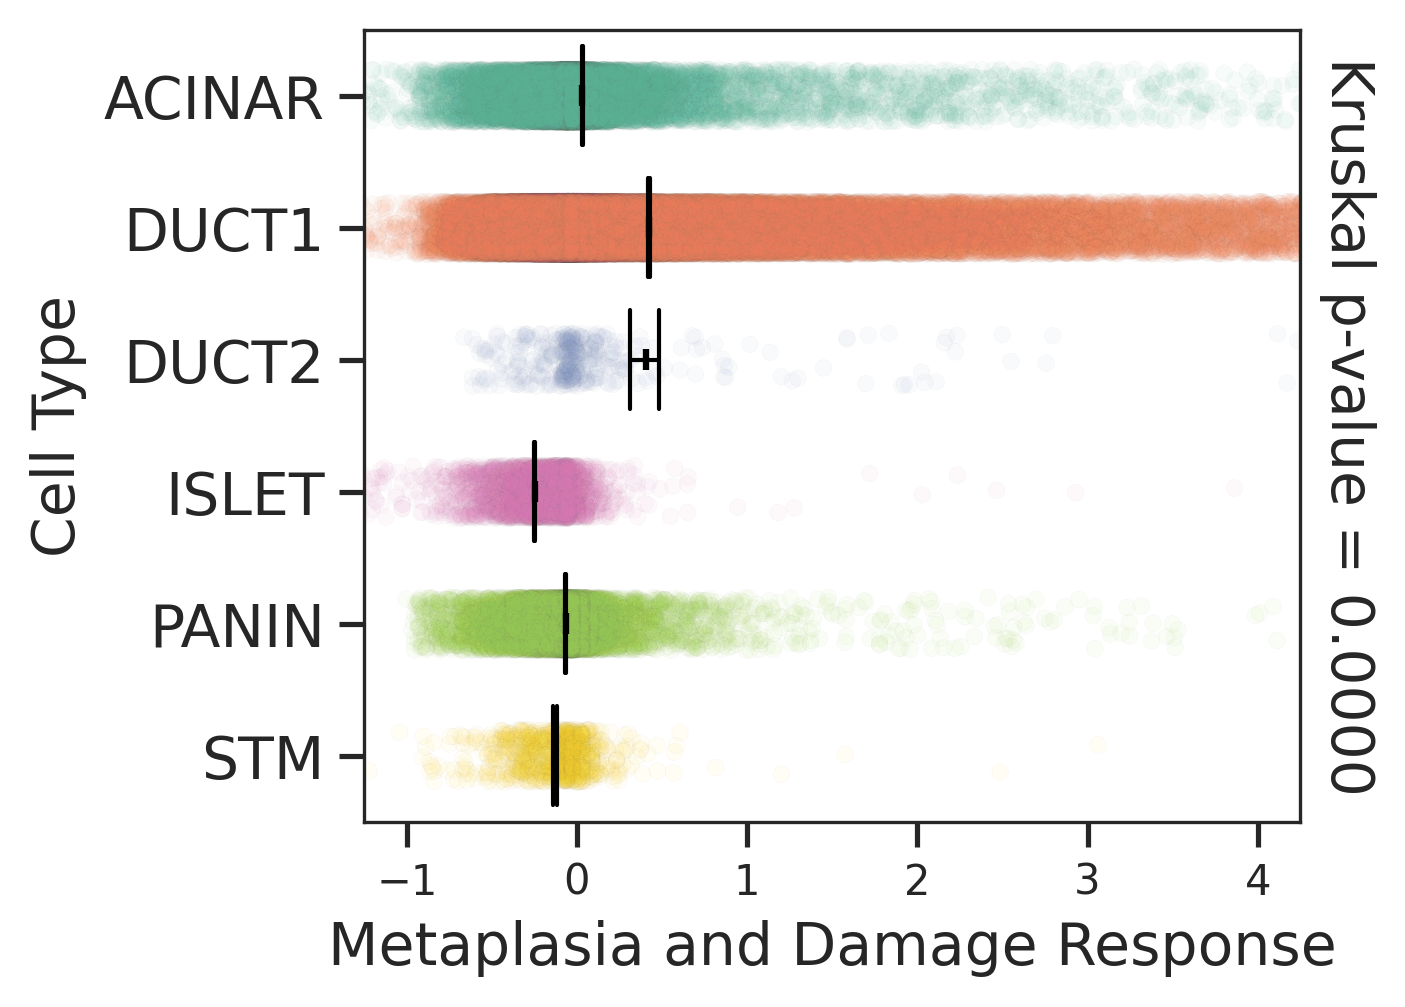
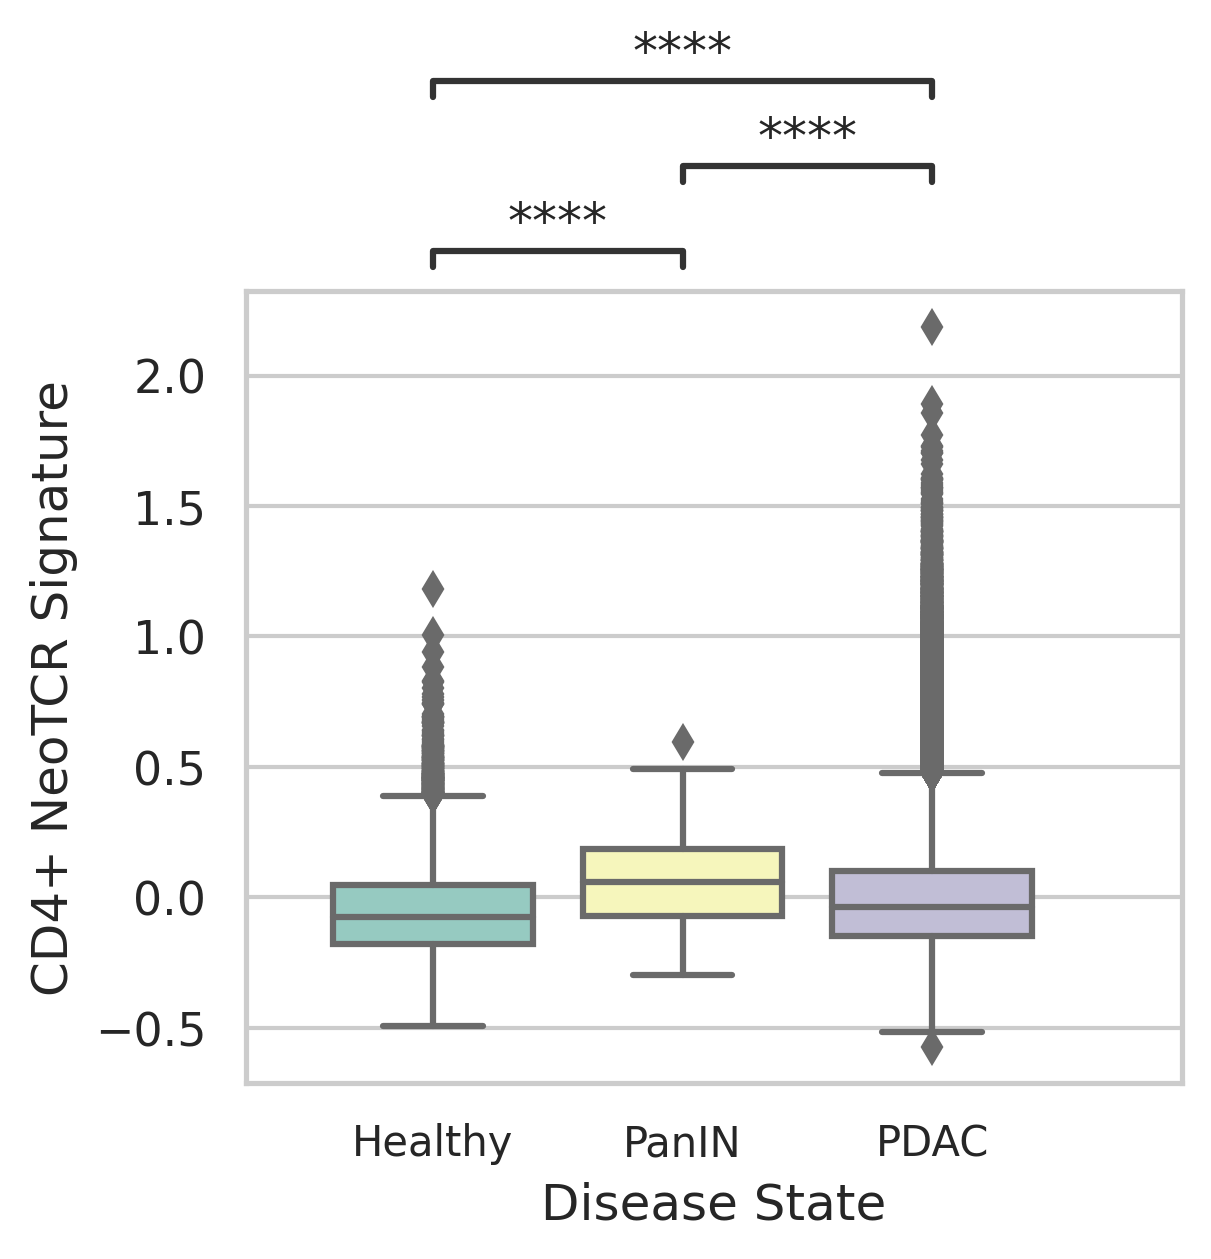
| Stemness, Senescence, Metaplasia and NeoTCR signature analysis |
Tissue: Pancreas |
Tissue samples summary |
| Epithelia | Immune | Stromal |
 |  |  |
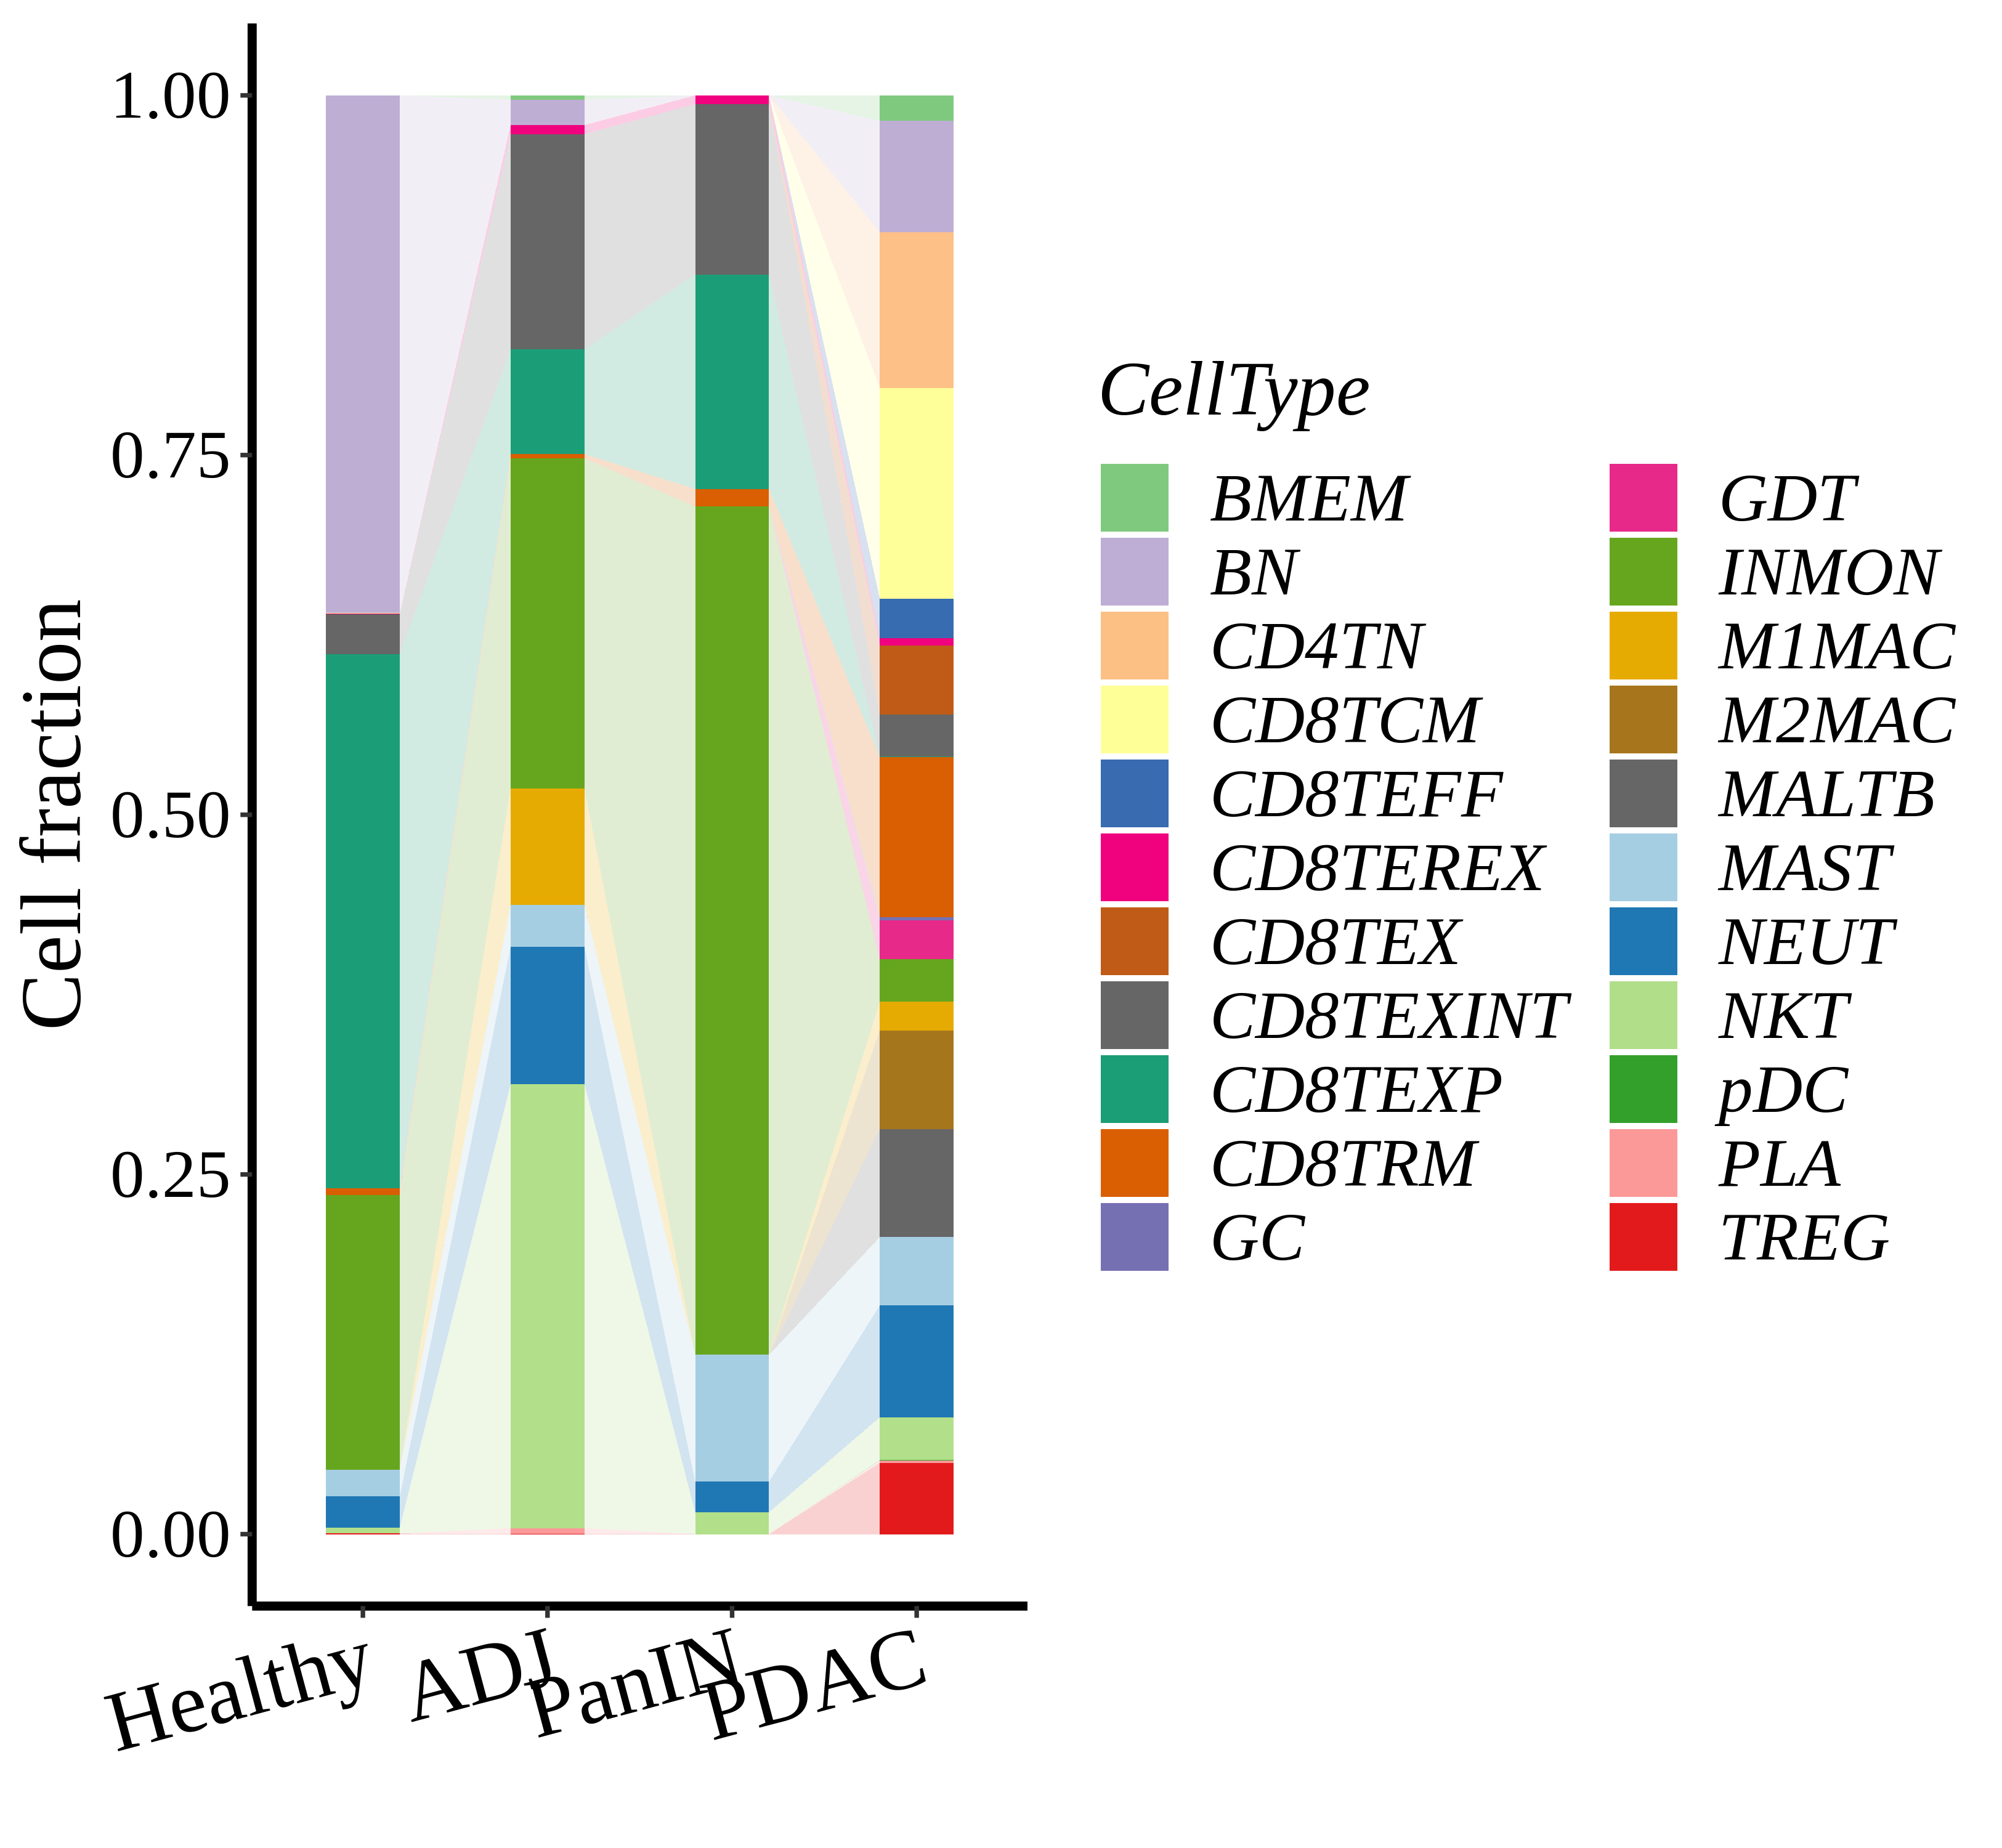
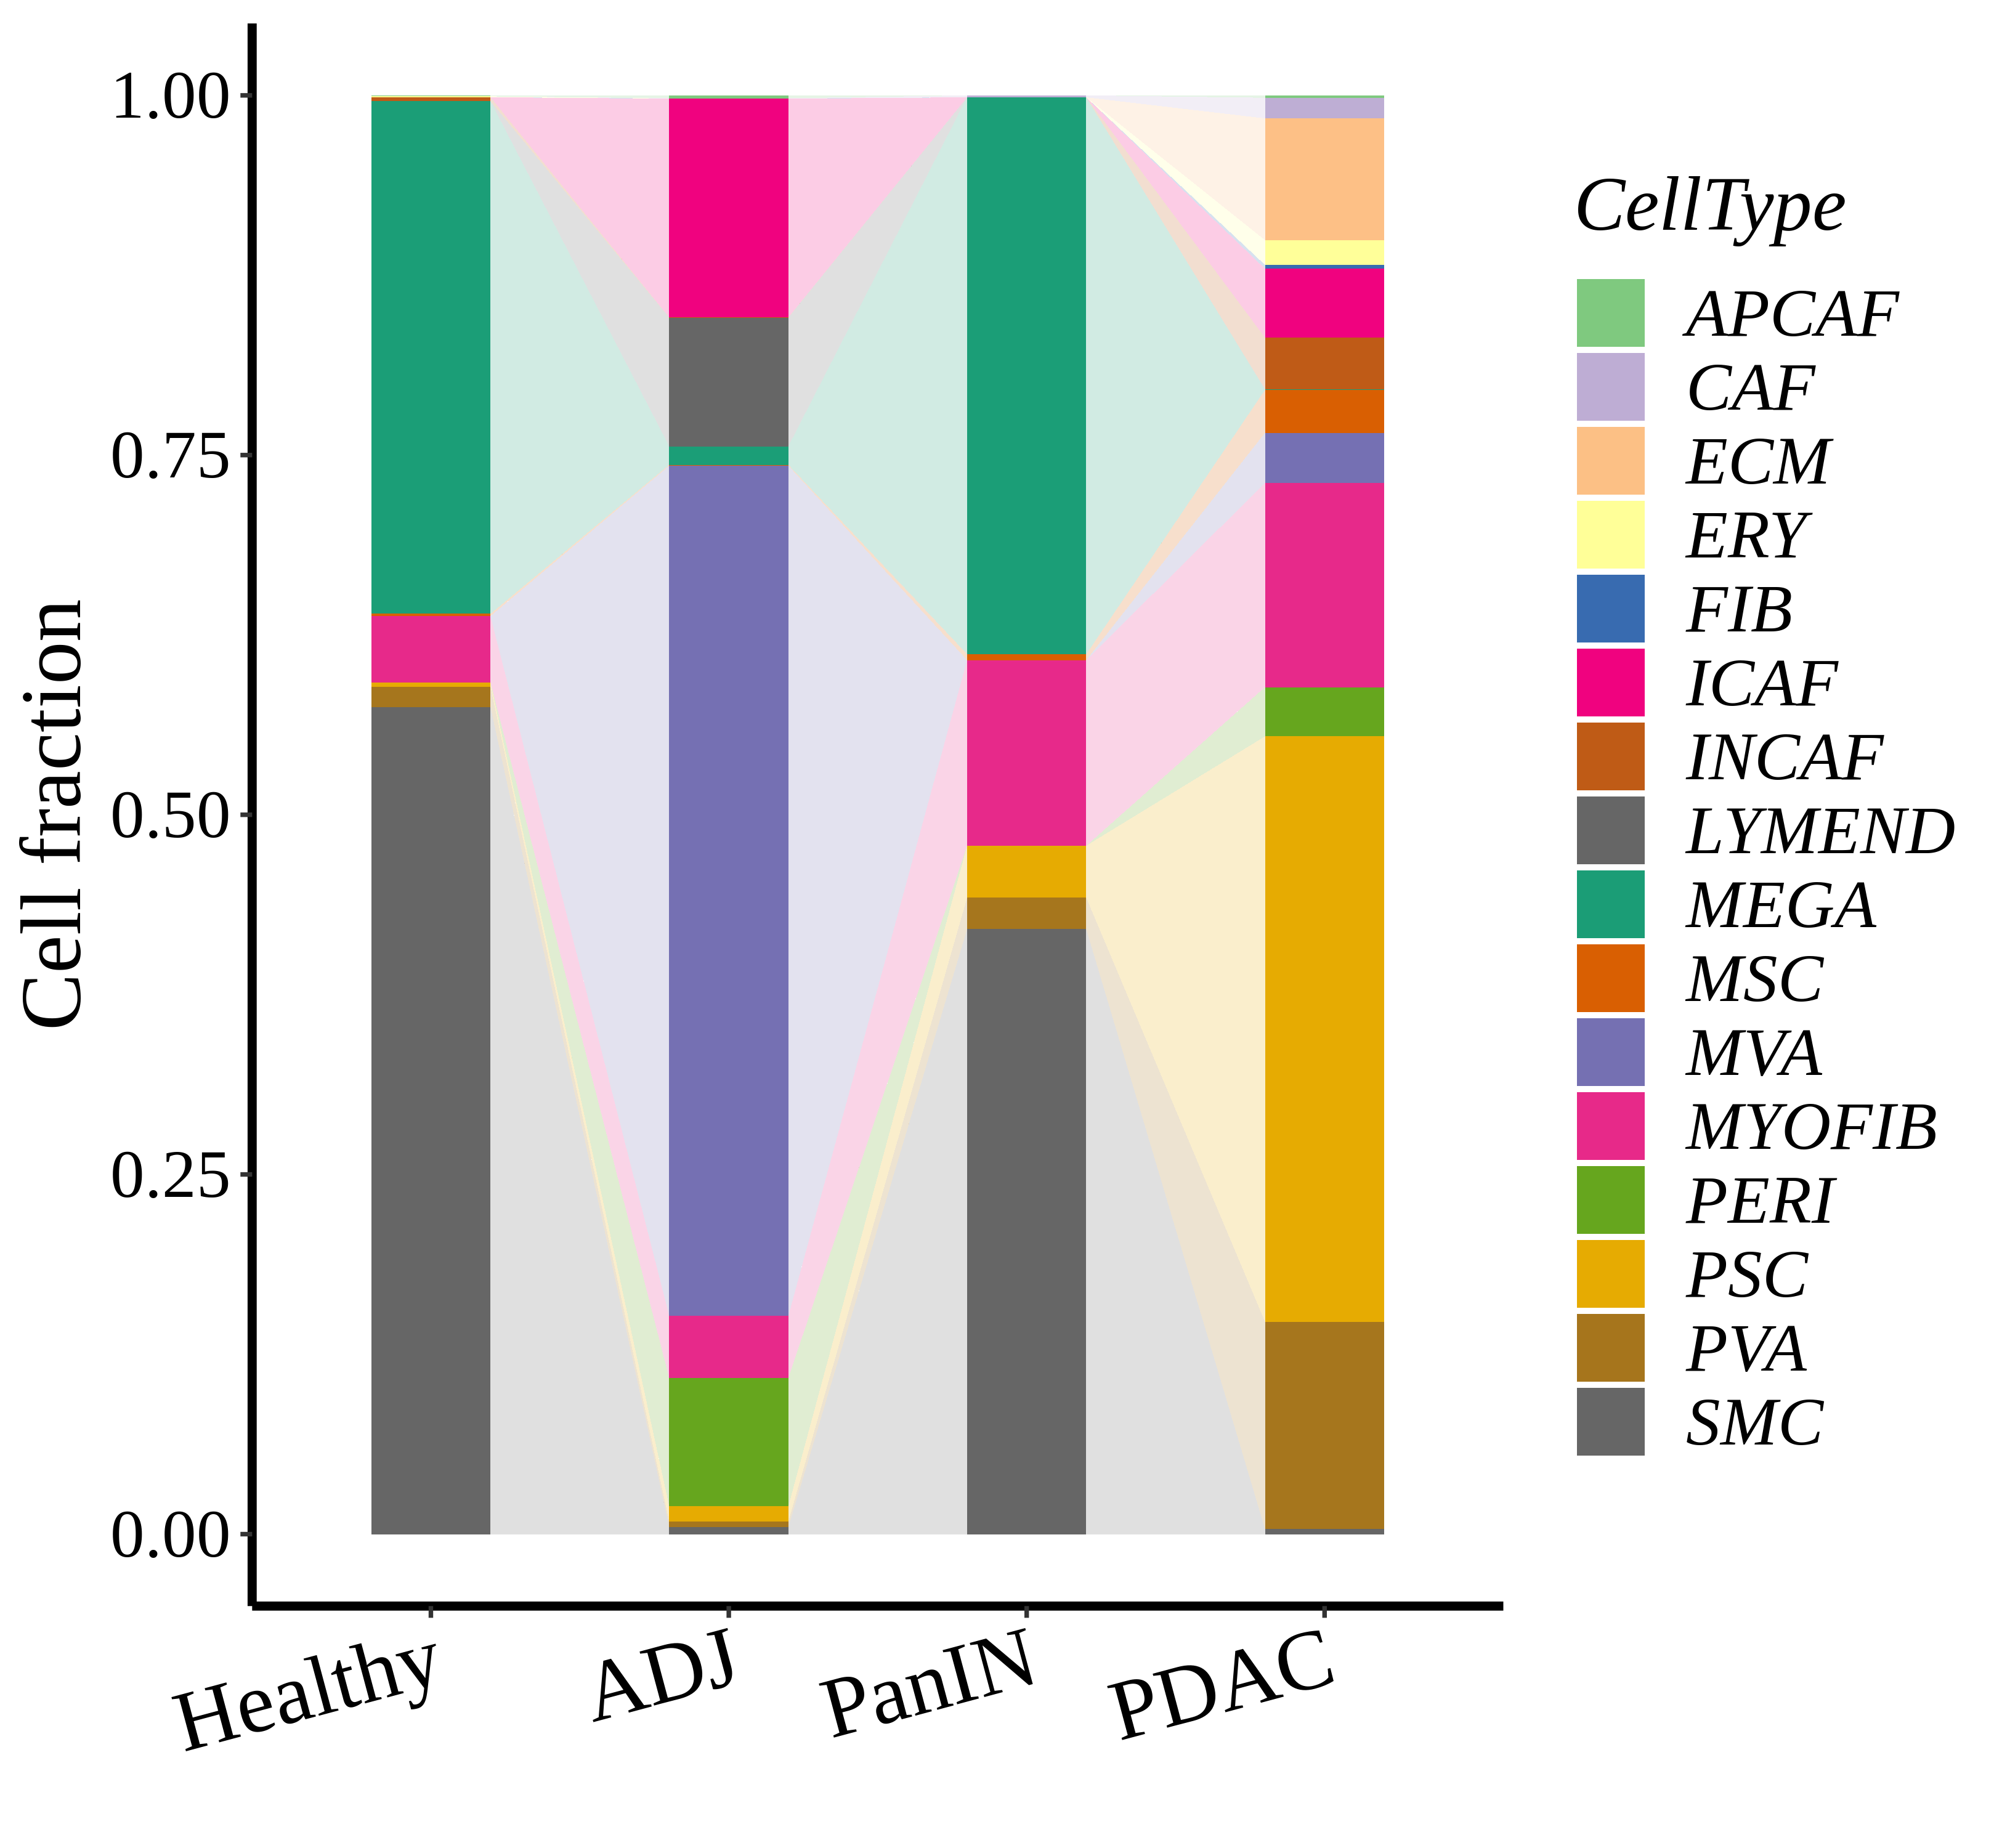
| ∗Bar plot representation of the fraction of all Epithelial, Immune and Stromal cells in each sample composed of each cell type for the integrated scRNA-seq datasets of Pancreas tissue. Each row represents a single sample, with each color representing a different cell type present in the sample. |
| Tissue | Disease State | Replicates | Epithelia UMAP | PMID | Source | Platform |
| Pancreas | PDAC | HTA12-18-3 | Projection | 35995947 | HTA11 | 10X Genomics |
| Pancreas | PDAC | HTA12-19-1 | Projection | 35995947 | HTA11 | 10X Genomics |
| Pancreas | PDAC | HTA12-19-2 | Projection | 35995947 | HTA11 | 10X Genomics |
| Pancreas | PDAC | HTA12-19-3 | Projection | 35995947 | HTA11 | 10X Genomics |
| Pancreas | PDAC | HTA12-2-1 | Projection | 35995947 | HTA11 | 10X Genomics |
| Pancreas | PDAC | HTA12-2-10 | Projection | 35995947 | HTA11 | 10X Genomics |
| Pancreas | PDAC | HTA12-2-11 | Projection | 35995947 | HTA11 | 10X Genomics |
| Pancreas | PDAC | HTA12-2-12 | Projection | 35995947 | HTA11 | 10X Genomics |
| Pancreas | PDAC | HTA12-2-2 | Projection | 35995947 | HTA11 | 10X Genomics |
| Pancreas | PDAC | HTA12-2-3 | Projection | 35995947 | HTA11 | 10X Genomics |
| Pancreas | PDAC | HTA12-2-4 | Projection | 35995947 | HTA11 | 10X Genomics |
| Pancreas | PDAC | HTA12-2-5 | Projection | 35995947 | HTA11 | 10X Genomics |
| Pancreas | PDAC | HTA12-2-6 | Projection | 35995947 | HTA11 | 10X Genomics |
| Pancreas | PDAC | HTA12-2-7 | Projection | 35995947 | HTA11 | 10X Genomics |
| Pancreas | PDAC | HTA12-2-8 | Projection | 35995947 | HTA11 | 10X Genomics |
| Pancreas | PDAC | HTA12-2-9 | Projection | 35995947 | HTA11 | 10X Genomics |
| Pancreas | PDAC | HTA12-20-1 | Projection | 35995947 | HTA11 | 10X Genomics |
| Pancreas | PDAC | HTA12-20-2 | Projection | 35995947 | HTA11 | 10X Genomics |
| Pancreas | PDAC | HTA12-20-3 | Projection | 35995947 | HTA11 | 10X Genomics |
| Pancreas | PDAC | HTA12-21-1 | Projection | 35995947 | HTA11 | 10X Genomics |
| ∗Projection of epithelial scRNA-seq cells from Pancreas diseased tissue samples into the manifold of normal tissue epithelial cells. Projected cells are colored by nearest normal cells in the projection and normal epithelial cells are colored gray. |
| Page: 1 2 3 4 5 6 7 8 9 10 |
Top |
Annotation details for different cell compartments |
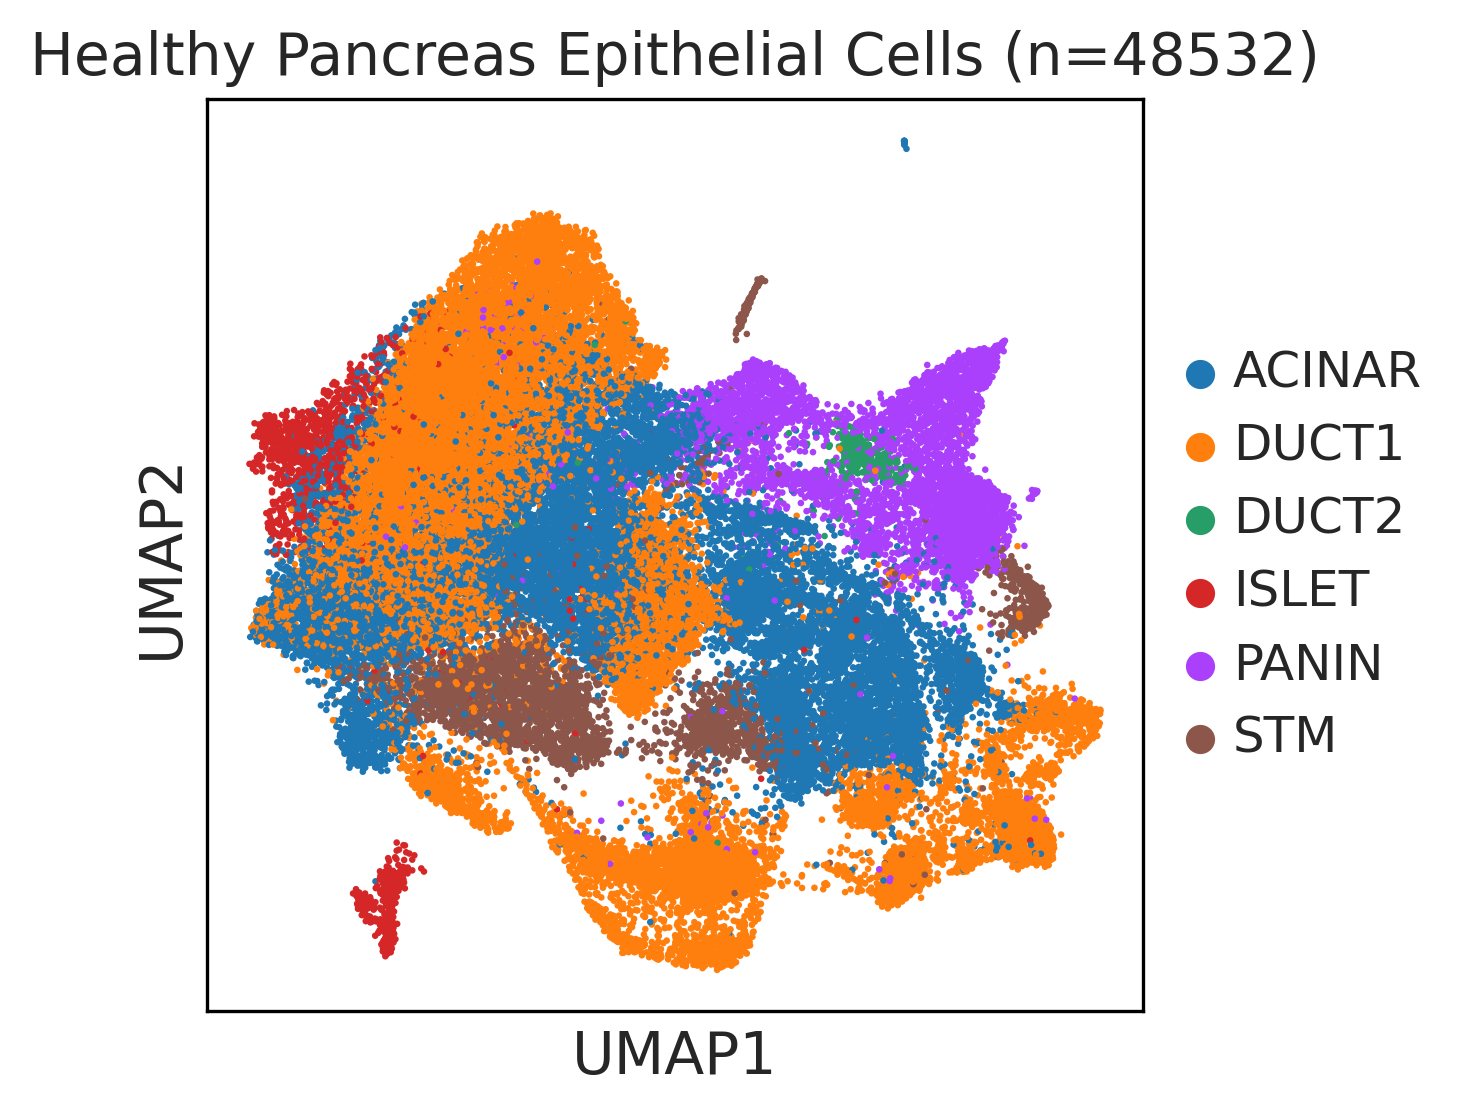 | 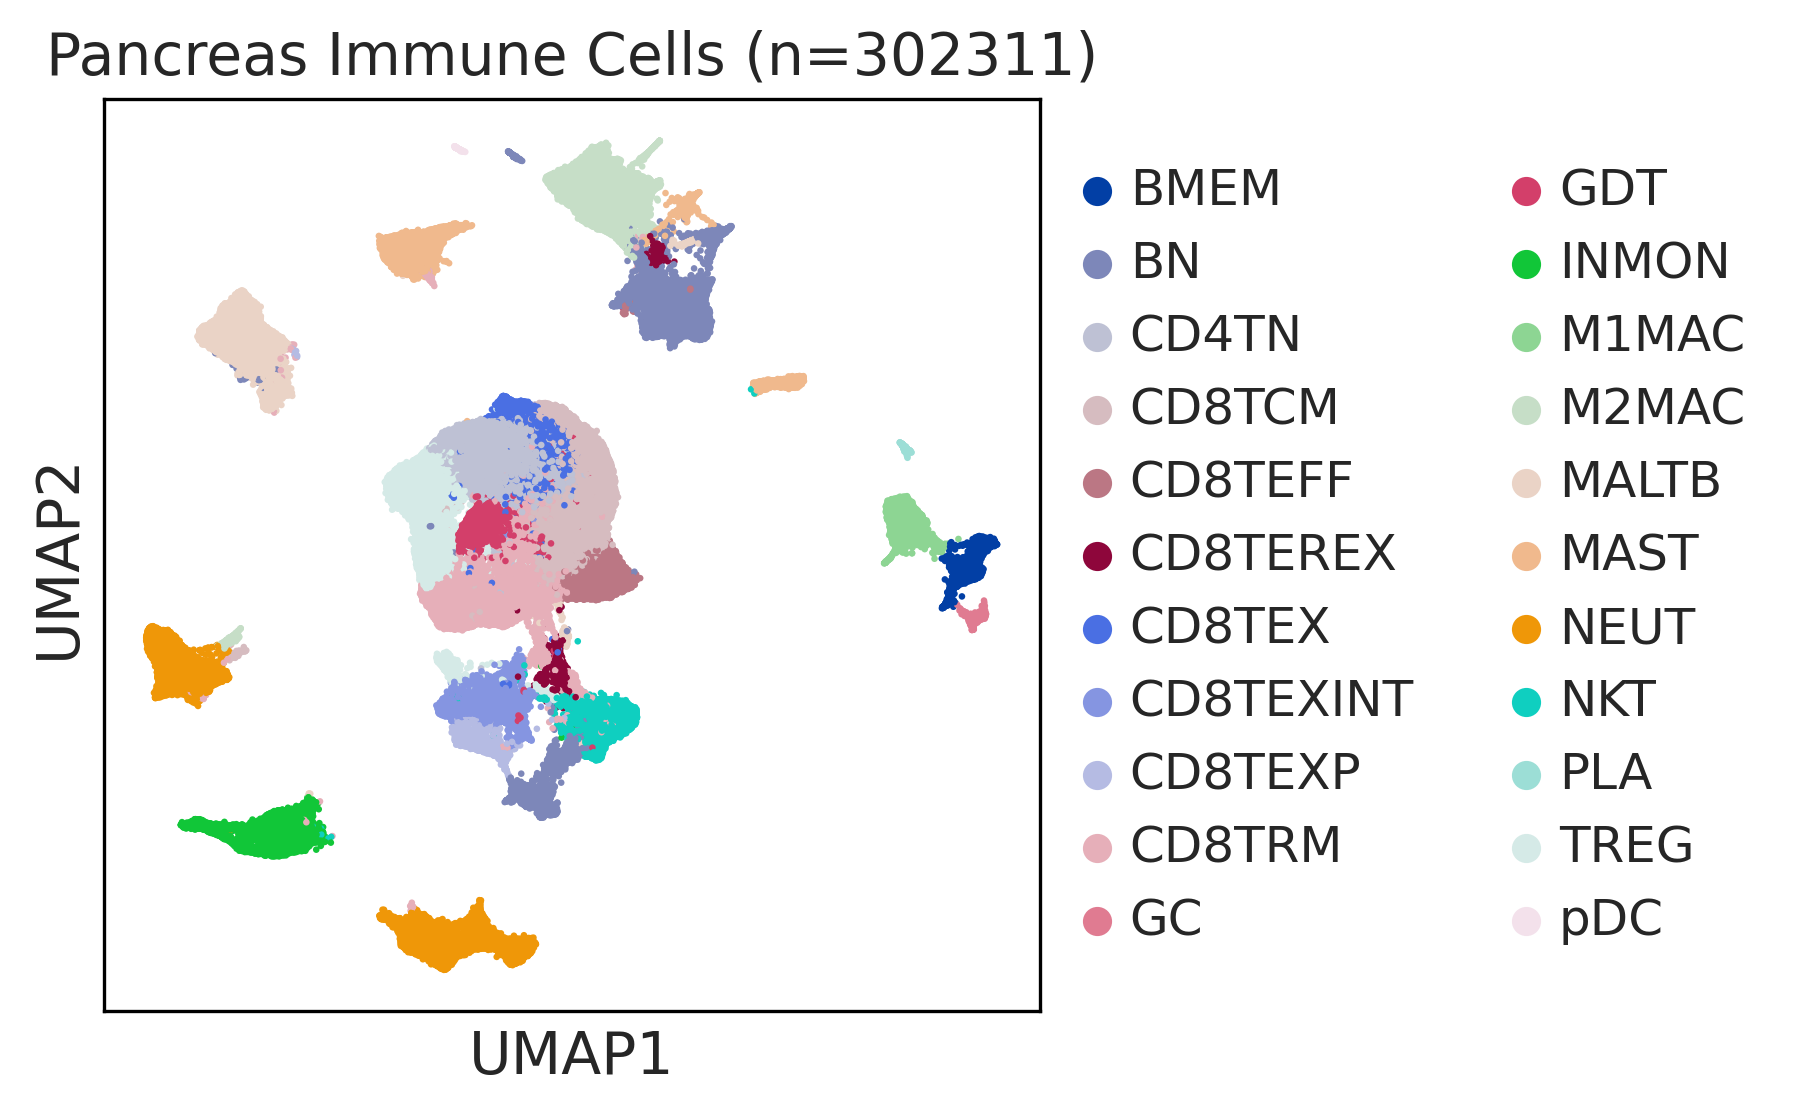 | 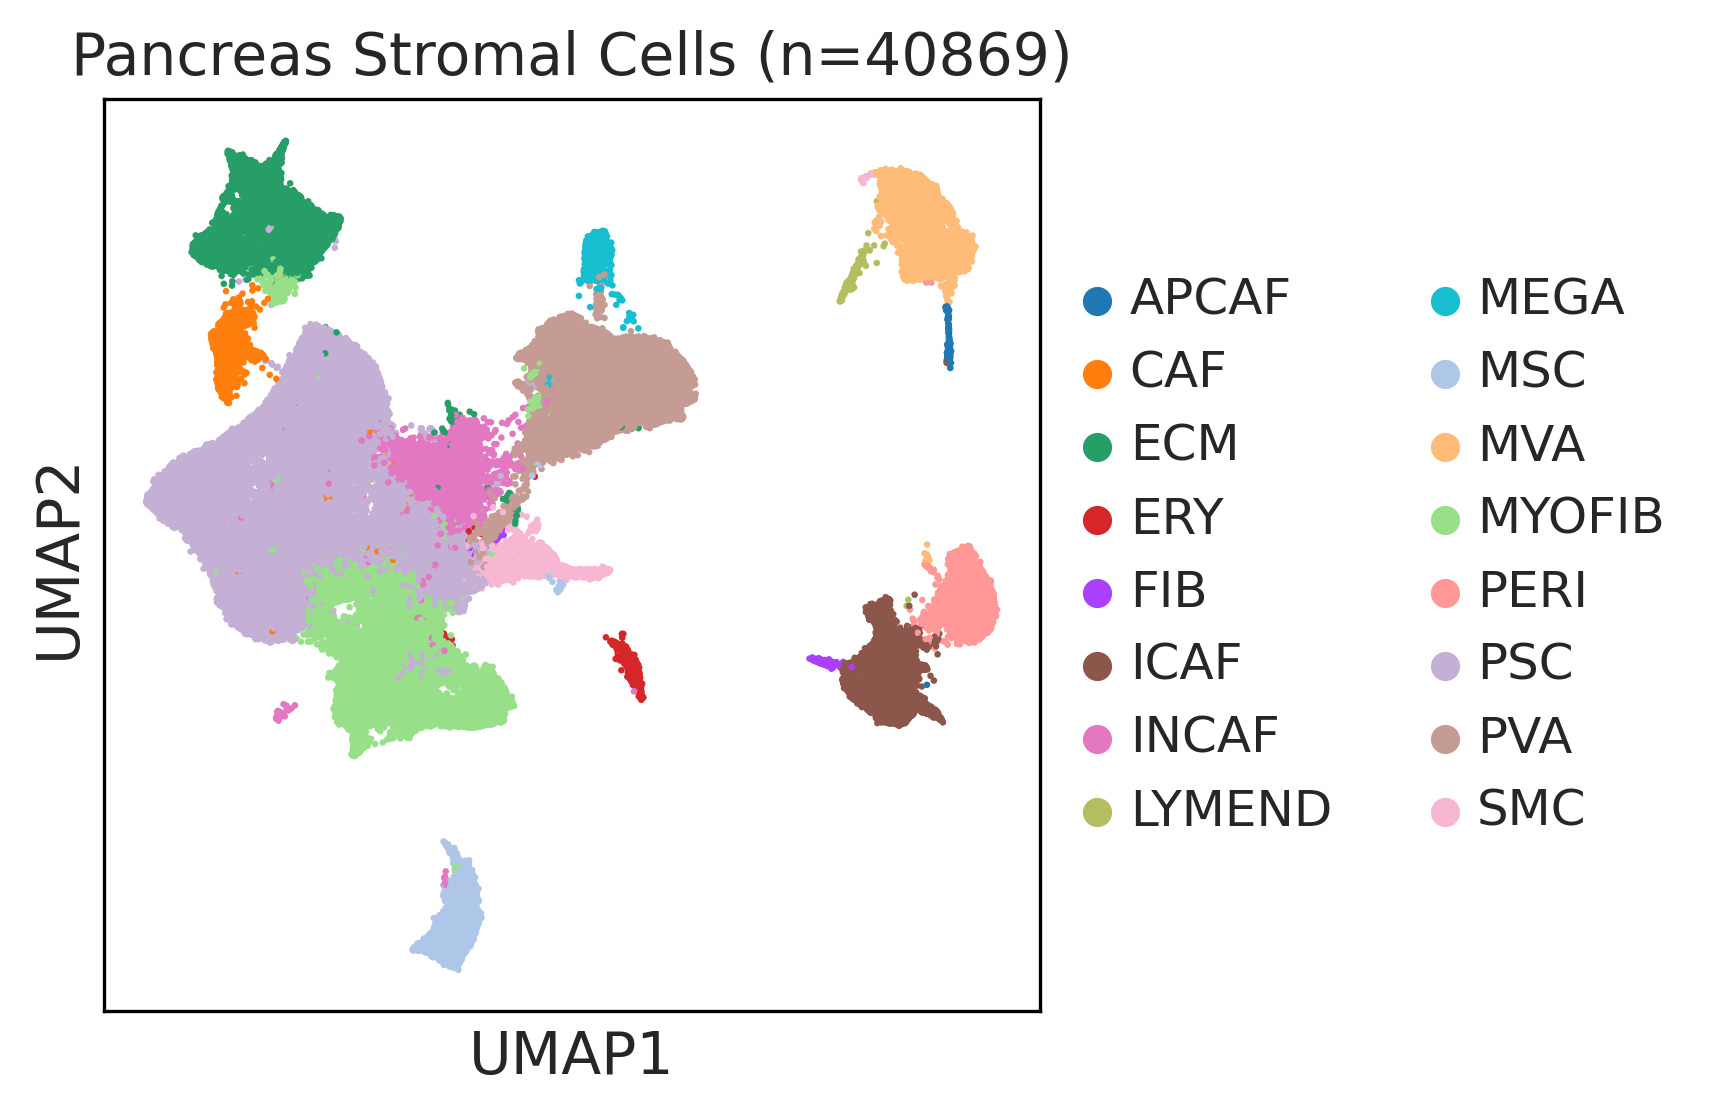 |
| ∗UMAP representations and annotations of Epithelial, Immune, Stromal cells in the integrated scRNA-seq data of Pancreas tissue. Colors represent cell types of each compartment. |
| Tissue | Major Cell Type | Minor Cell Type | Full Name | Markers |
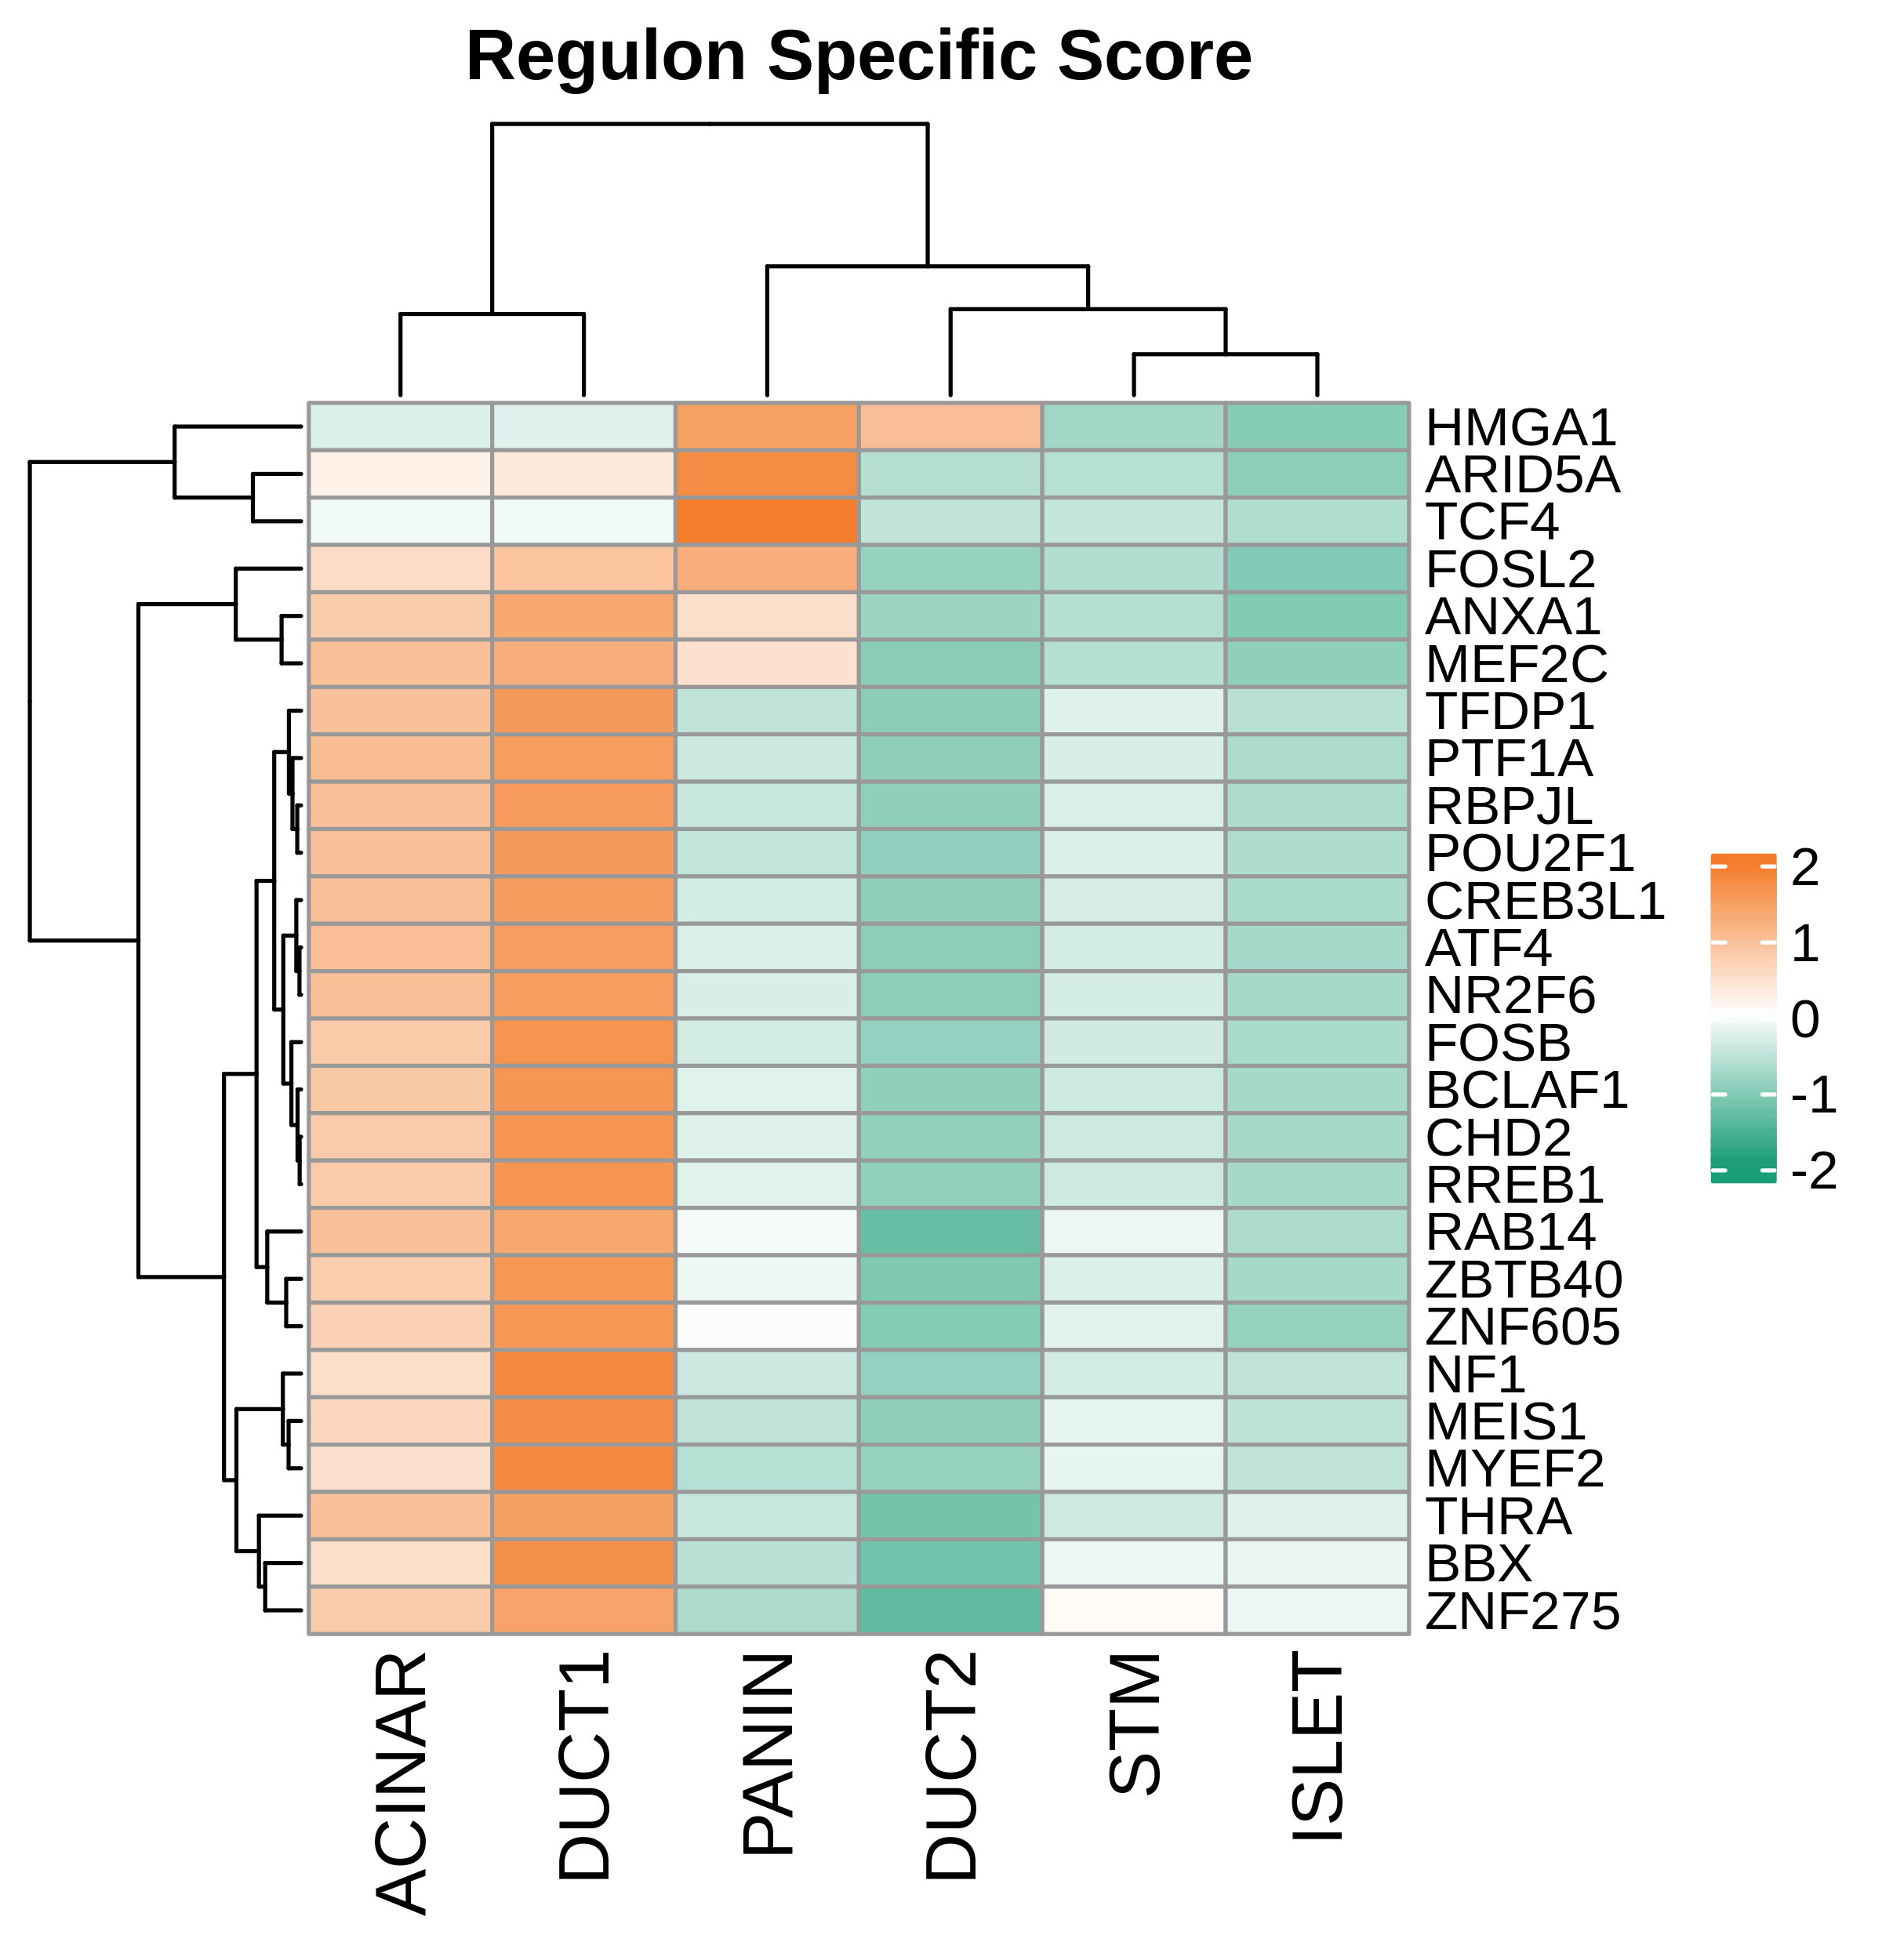
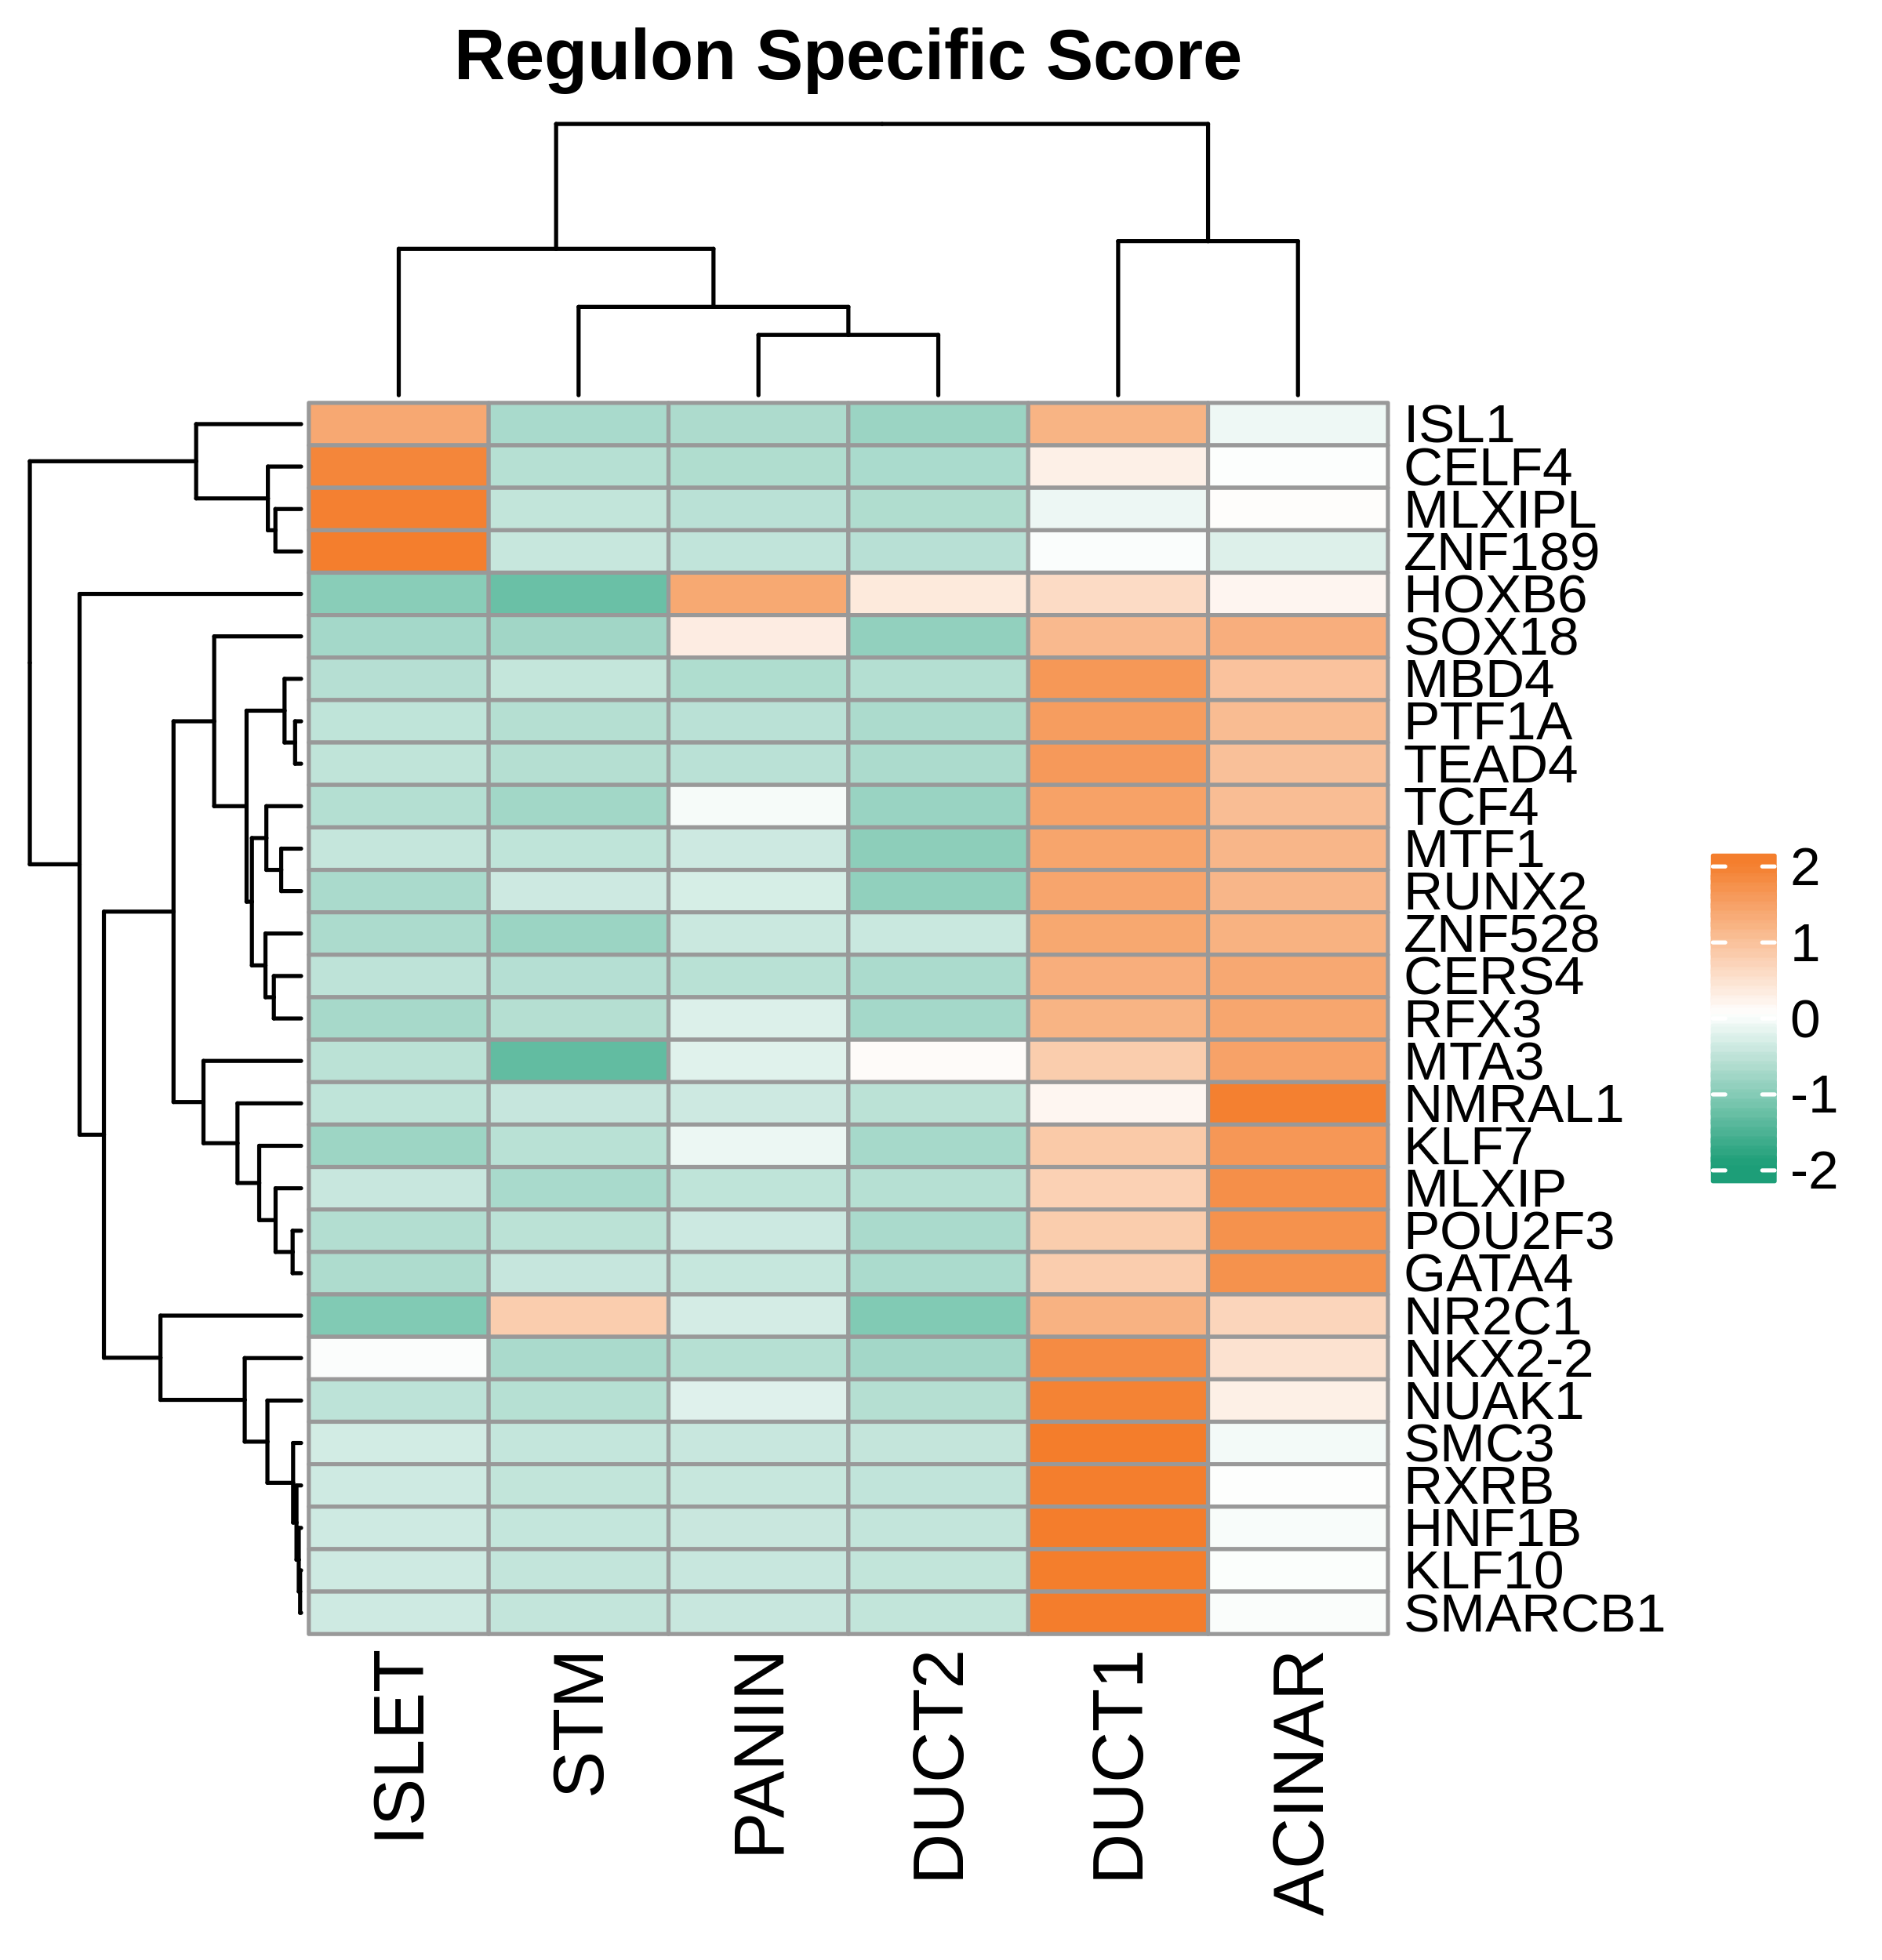
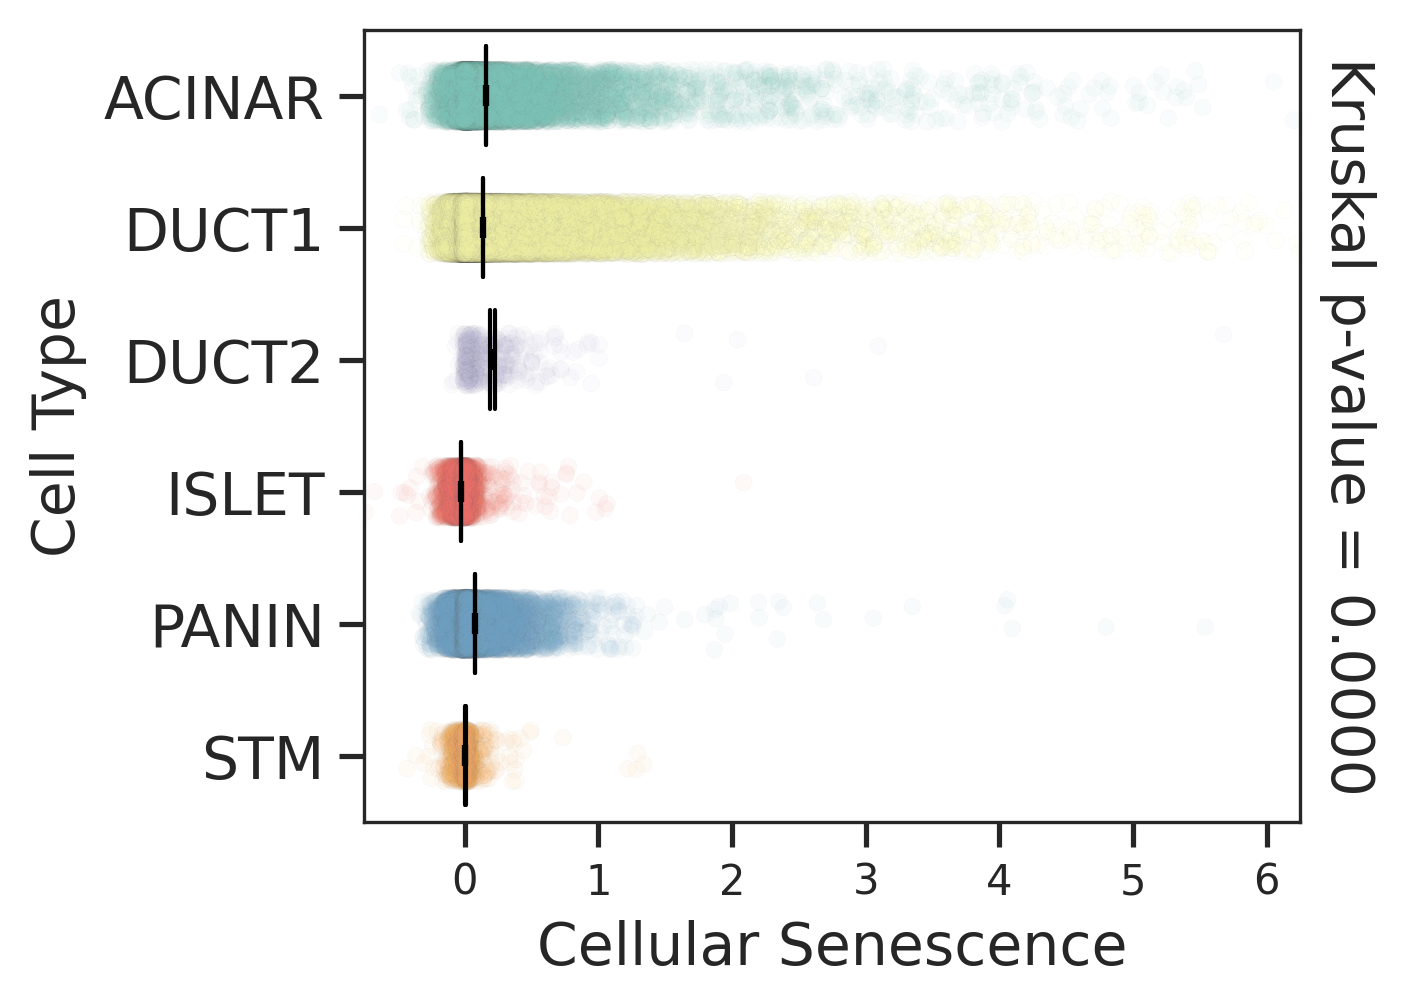
| Pancreas | Epi | DUCT1 | Duct-like1 cells | CFTR,BICC1,SLC4A4,GLIS3,SCTR,AMBP,FXYD2,ANXA4,SPP1,SOX9,FOS,JUN |
| Pancreas | Epi | ACINAR | Acinar cells | SPINK1,CLPS,CPB1,CPA1,PRSS3,PRSS1,AMY2A,AMY2B,CELA2B,CELA3A,CELA3B,SYCN,PNLIP,CTRC,CPA2 |
| Pancreas | Epi | ISLET | Pancreatic islet cells | INS,GCG,SST,GHR,PPY,GCK,PCSK1,PCSK2,CHGA,CHGB,SYP,KCNJ11 |
| Pancreas | Epi | PANIN | PanIN-like cells | MUC5AC,CXCL12,ITGA5,ITGA1,TIMP3,KLF4,IGFBP4,IGFBP7,COL1A1,COL1A2,COL3A1,COL4A1,REG4 |
| Pancreas | Epi | STM | Stem-like cells | EPCAM,CD24,ANPEP,SOX9,CD44,PDX1,ALDH1A1,PROM1,MET |
| Pancreas | Epi | DUCT2 | Duct-like2 cells | CRP,MUC5B,ONECUT2,CRISP3,TFF3 |
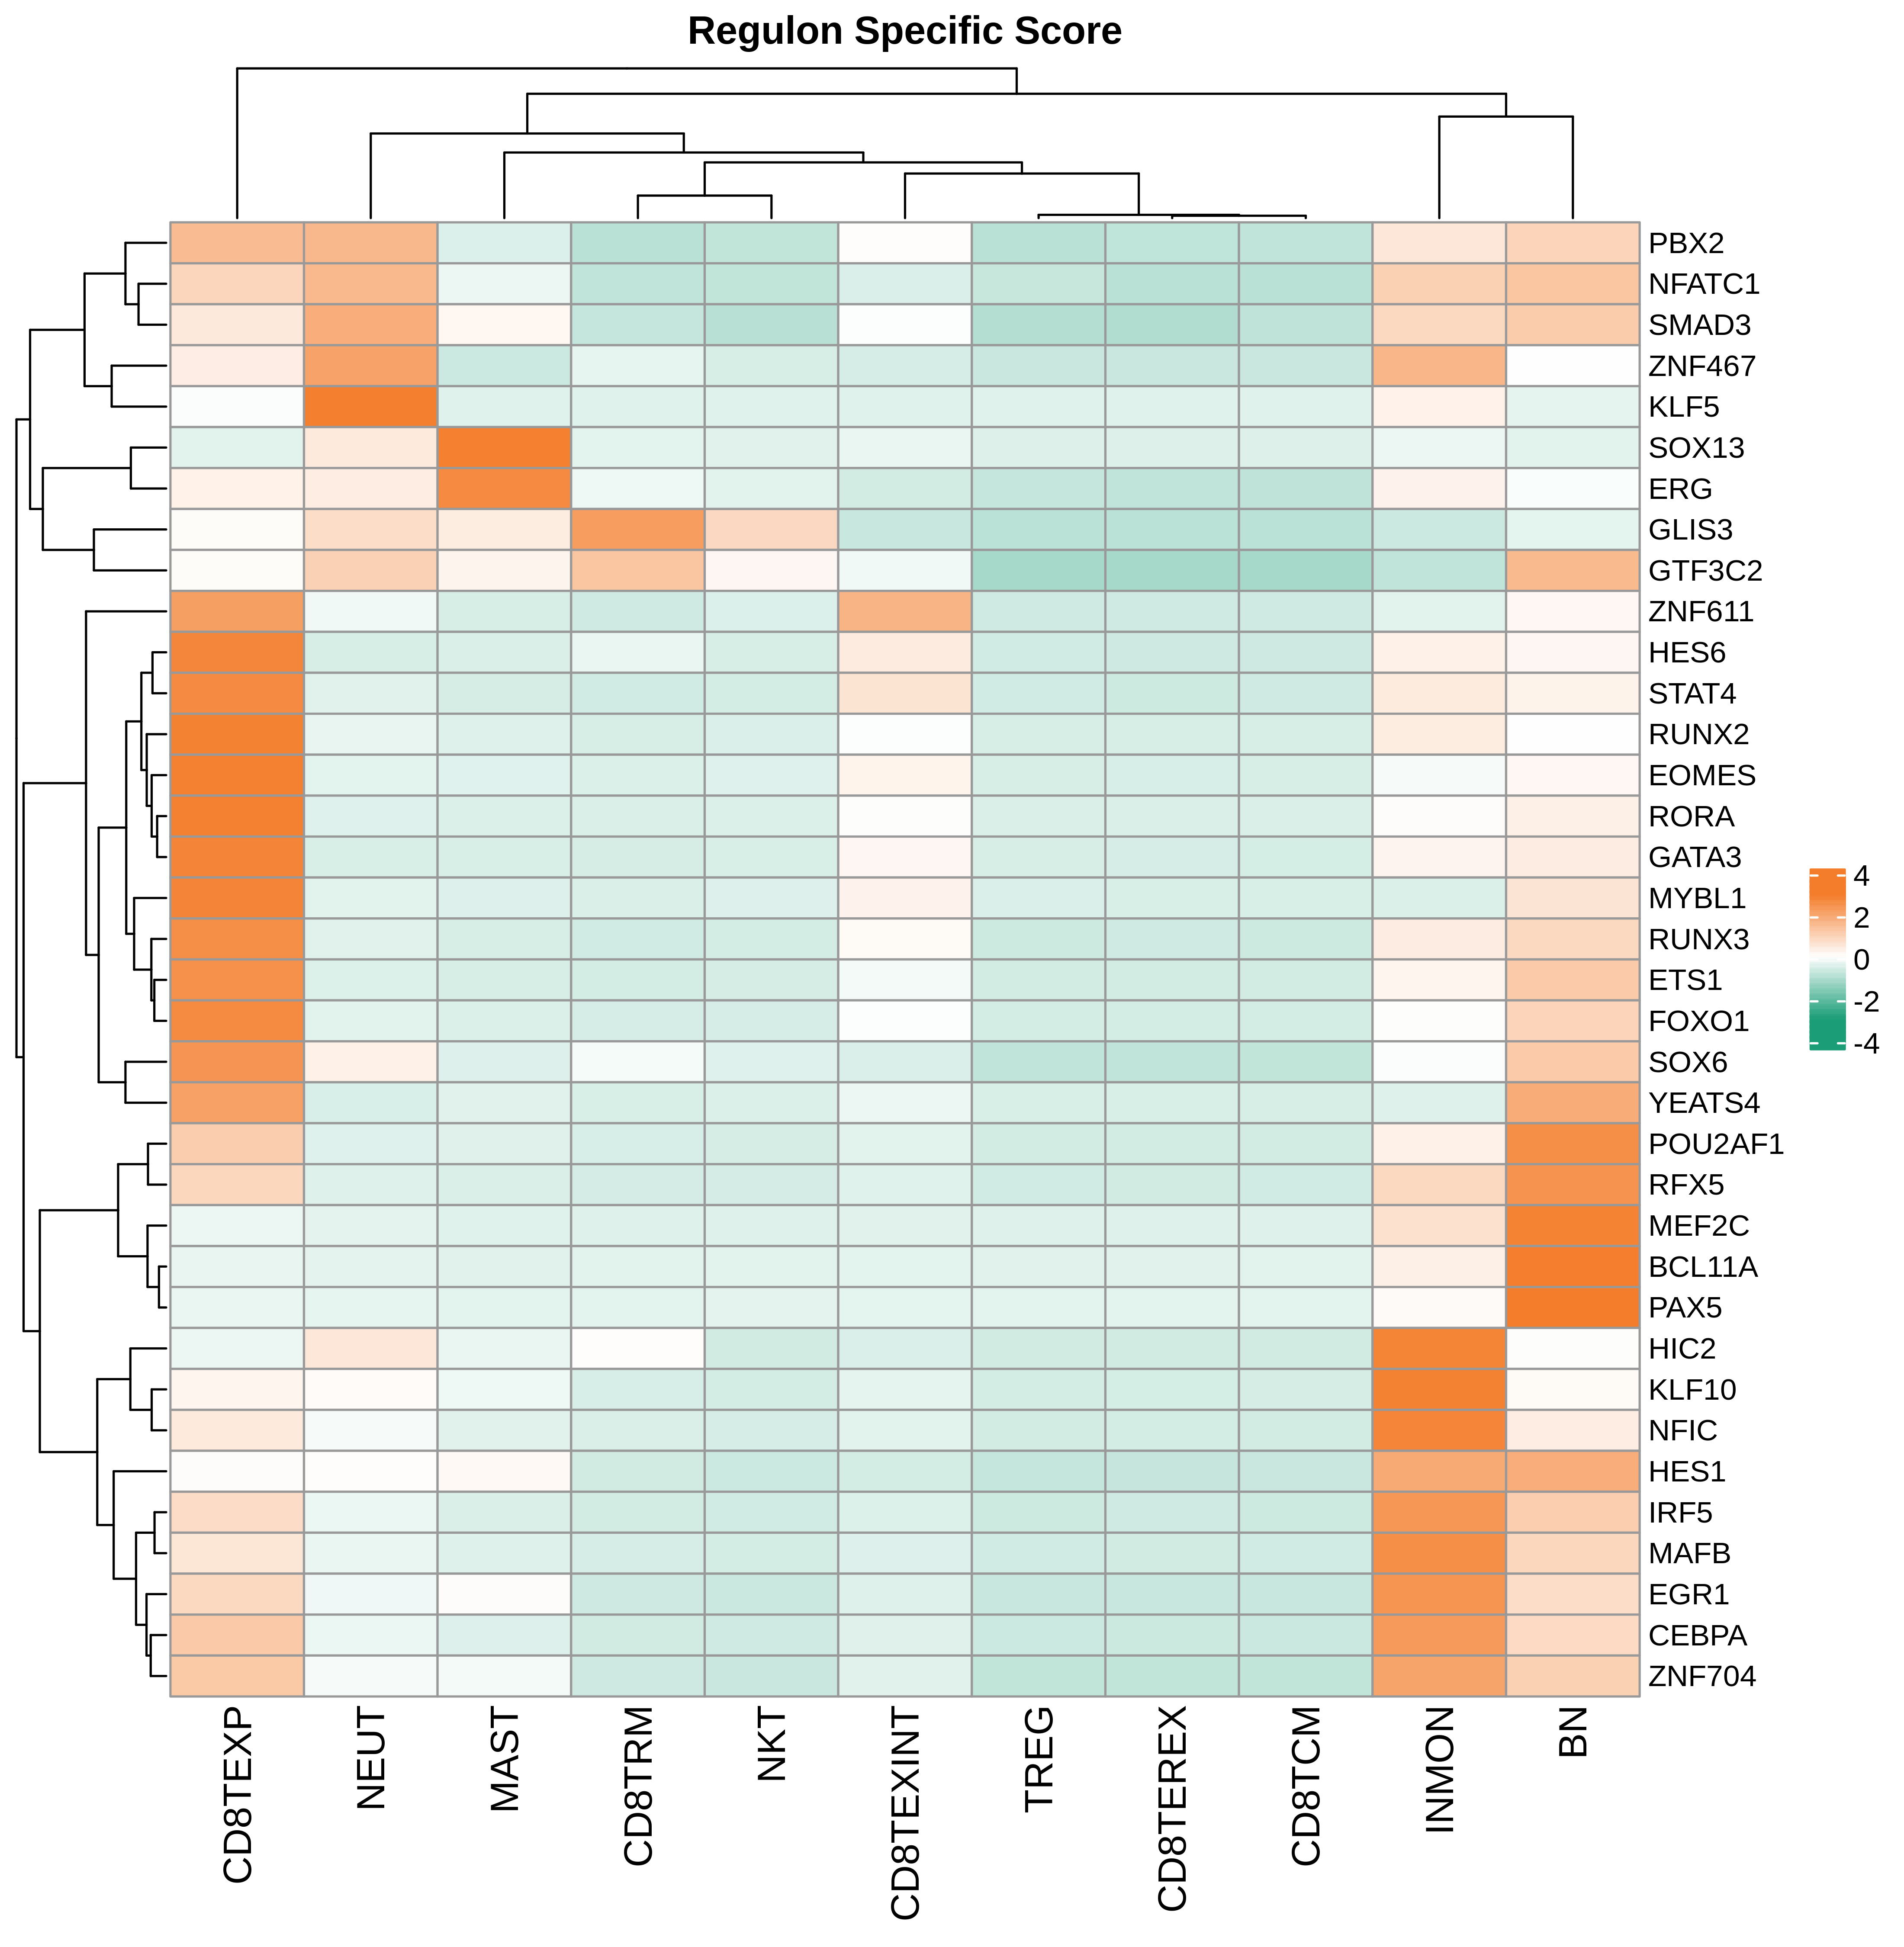
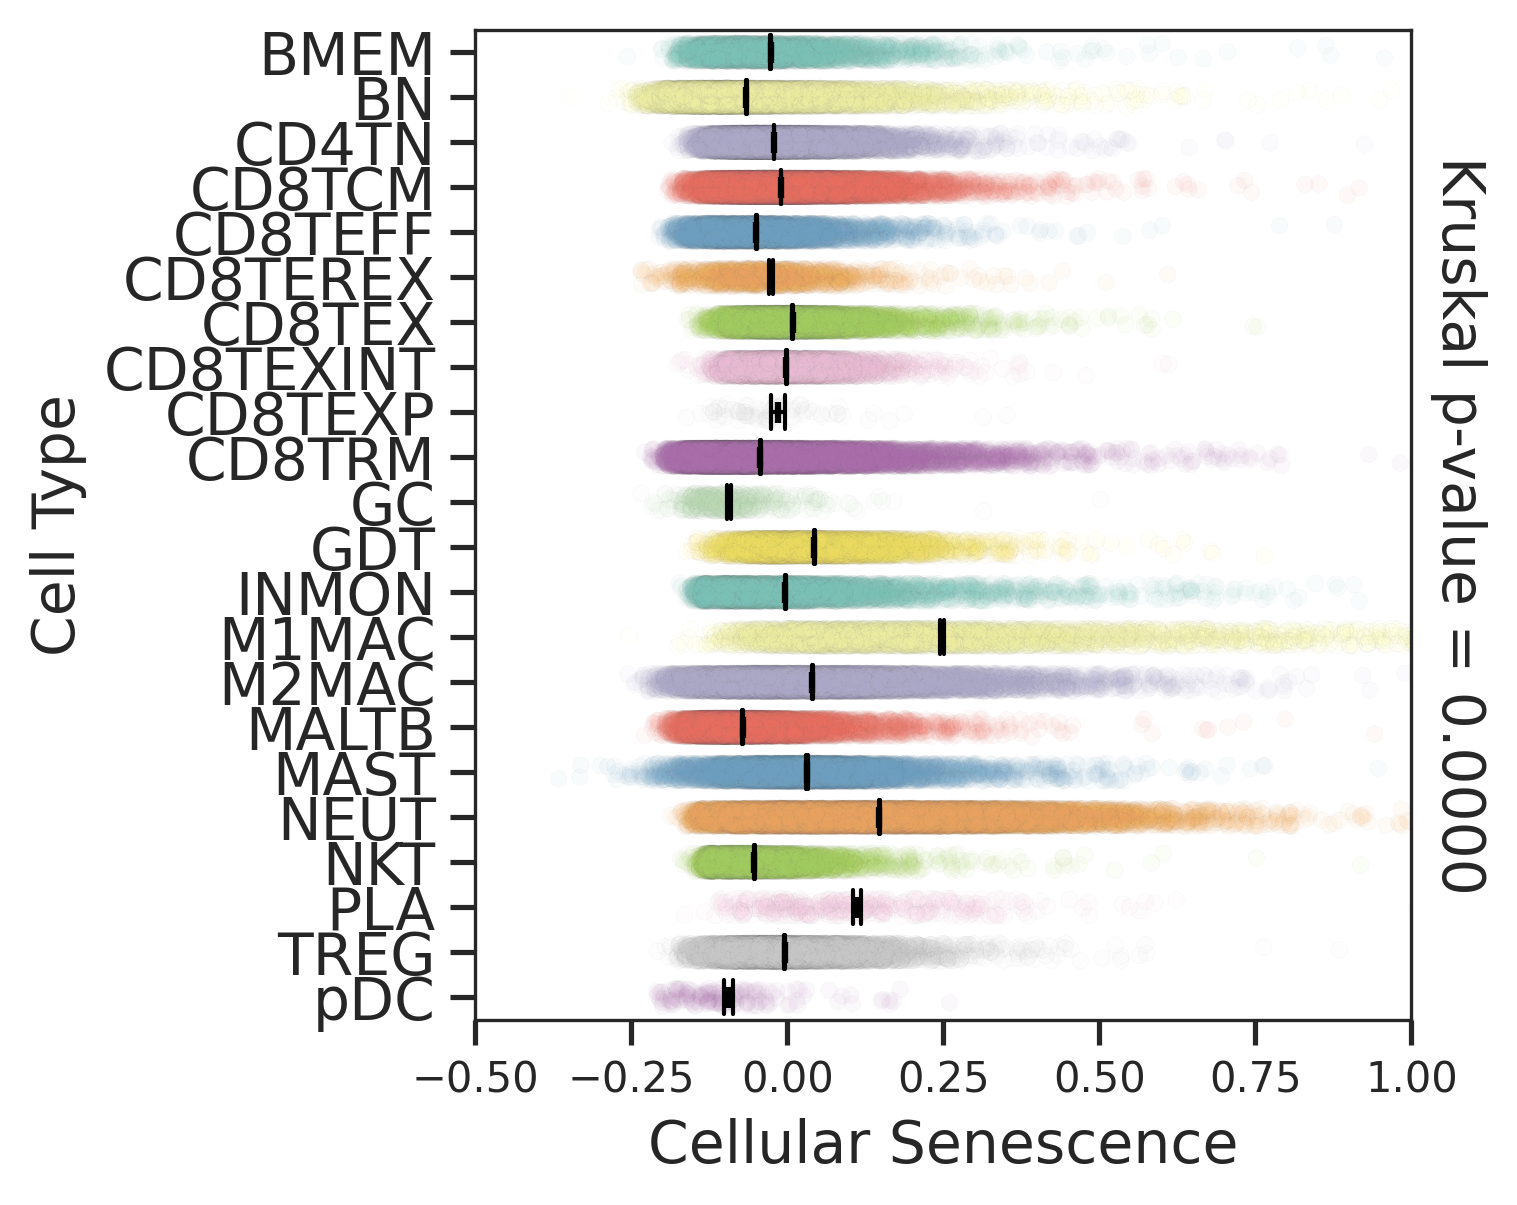
| Pancreas | Imm | INMON | Inflamotory monocytes | CD14,CLEC9A,FCGR1A,LILRB2,CD209,CD1E,FCN1,VCAN,S100A8,S100A9 |
| Pancreas | Imm | NEUT | Neutriphils | CEACAM3,FCGR3B,CXCR2 |
| Pancreas | Imm | CD8TEXP | Progenitor exhausted CD8+ T cells | PDCD1,IL7R,GPR183,NR4A3,REL,TCF7 |
| Pancreas | Imm | MAST | Mast cells | TPSAB1,CPA3,HDC,CTSG,TPSB2,CMA1,MS4A2 |
| Pancreas | Imm | CD8TEXINT | Intermediate exhausted CD8+ T cells | PDCD1,LAG3,CD101,CD38,CXCR6,TIGIT |
| Pancreas | Imm | BN | Naive B cells | CD19,IGHD,IGLL1,CD27,CD38 |
| Pancreas | Imm | CD8TRM | CD8+ tissue resident memory T cells | CD6,XCL1,XCL2,MYADM,CAPG,RORA,NR4A1,NR4A2,NR4A3,CD69,ITGAE |
| Pancreas | Imm | CD8TEREX | Terminally exhausted CD8+ T cells | TOX,GZMB,ENTPD1,ITGAE,HAVCR2,CXCL13,PDCD1,LAYN,TOX,IFNG,GZMB,MIR155HG,TNFRSF9,ITGAE |
| Pancreas | Imm | NKT | Natural killer T cells | CD3D,CD3E,NCAM1,KLRB1 |
| Pancreas | Imm | TREG | Regulatory T cells | BATF,TNFRSF4,FOXP3,CTLA4,LAIR2,IL2RA |
| Pancreas | Imm | CD8TCM | Central memory CD8+ T cells | CCR7,SELL,IL7R,CD27,CD28,PRF1,GZMA,CCL5,GPR183,S1PR1 |
| Pancreas | Imm | MALTB | Mucosa-Associated Lymphoid Tissue B cells | CXCR4,CD80,CCR6,ITGB7 |
| Pancreas | Imm | CD4TN | Naive CD4+ T cells | IL7R,SELL,CCR7,S100A4,TCF7 |
| Pancreas | Imm | CD8TEX | Exhausted CD8+ T cells | PDCD1,LAG3,CD101,CD38,CXCR6,TIGIT |
| Pancreas | Imm | BMEM | Memory B cells | PAX5,MS4A1,CD19,IGLL5,VPREB3,CD79A,CD79B,IGKC,CD74,HLA-DRA,CD37,CD22 |
| Pancreas | Imm | M1MAC | M1 macrophages | FOLR2,FABP3,PLA2G2D,ITGAM,ITGAX,CSF1R,CD68,CD163,THBD |
| Pancreas | Imm | PLA | Plasma cells | SSR4,IGLL5,IGLL1,AMPD1,IGHA1,IGHA2,JCHAIN,CD38,TNFRSF17,SDC1,IGHG1,MZB1 |
| Pancreas | Imm | GC | Germinal center B cells | SERPINA9,HRK,HTR3A,BCL6,CD180,FCRLA |
| Pancreas | Imm | CD8TEFF | Effector CD8+ T cells | CX3CR1,FCGR3A,FGFBP2,PRF1,GZMH,TBX21,EOMES,S1PR1 |
| Pancreas | Imm | GDT | Gamma-delta T cells | TRDC,TRGC1,TRGC2,NKG7,TIGIT |
| Pancreas | Imm | M2MAC | M2 macrophages | CSF1R,CSF3R,MRC1,IL10,CCL18,VSIG4,CHI3L1 |
| Pancreas | Imm | pDC | Plasmacytoid dendritic cells | IL3RA,CLEC4C,NRP1,KLRD1 |
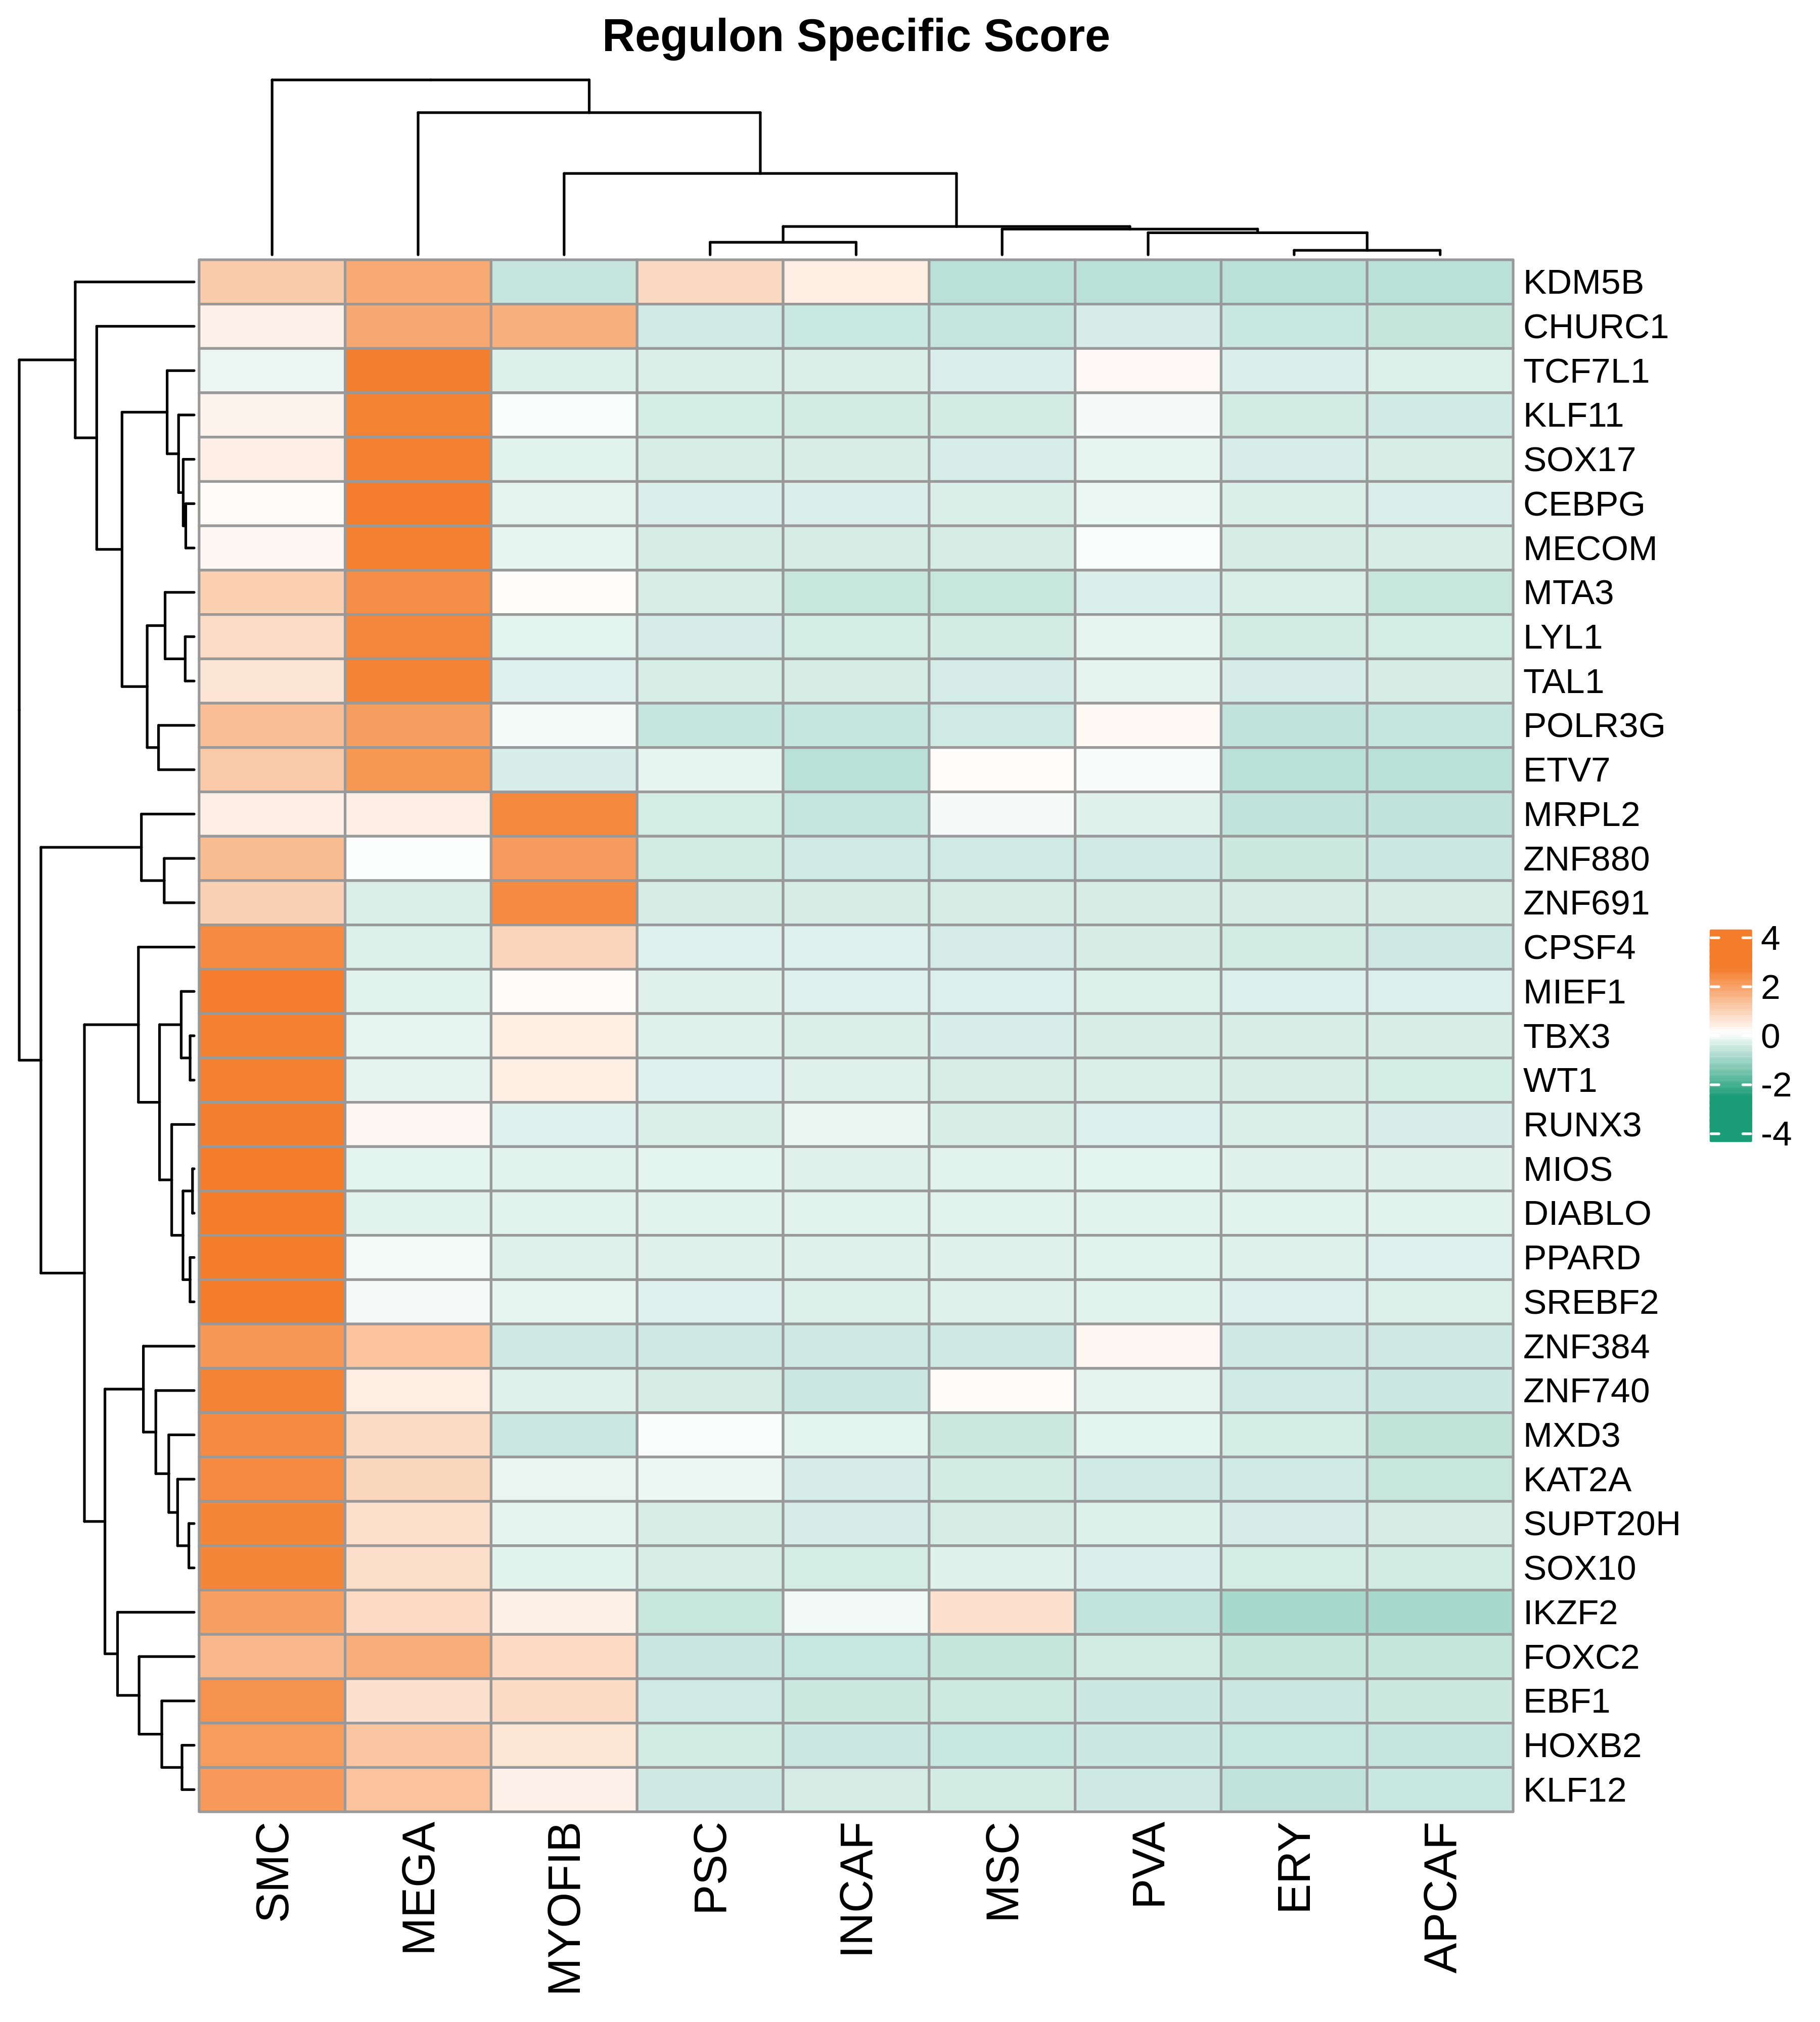
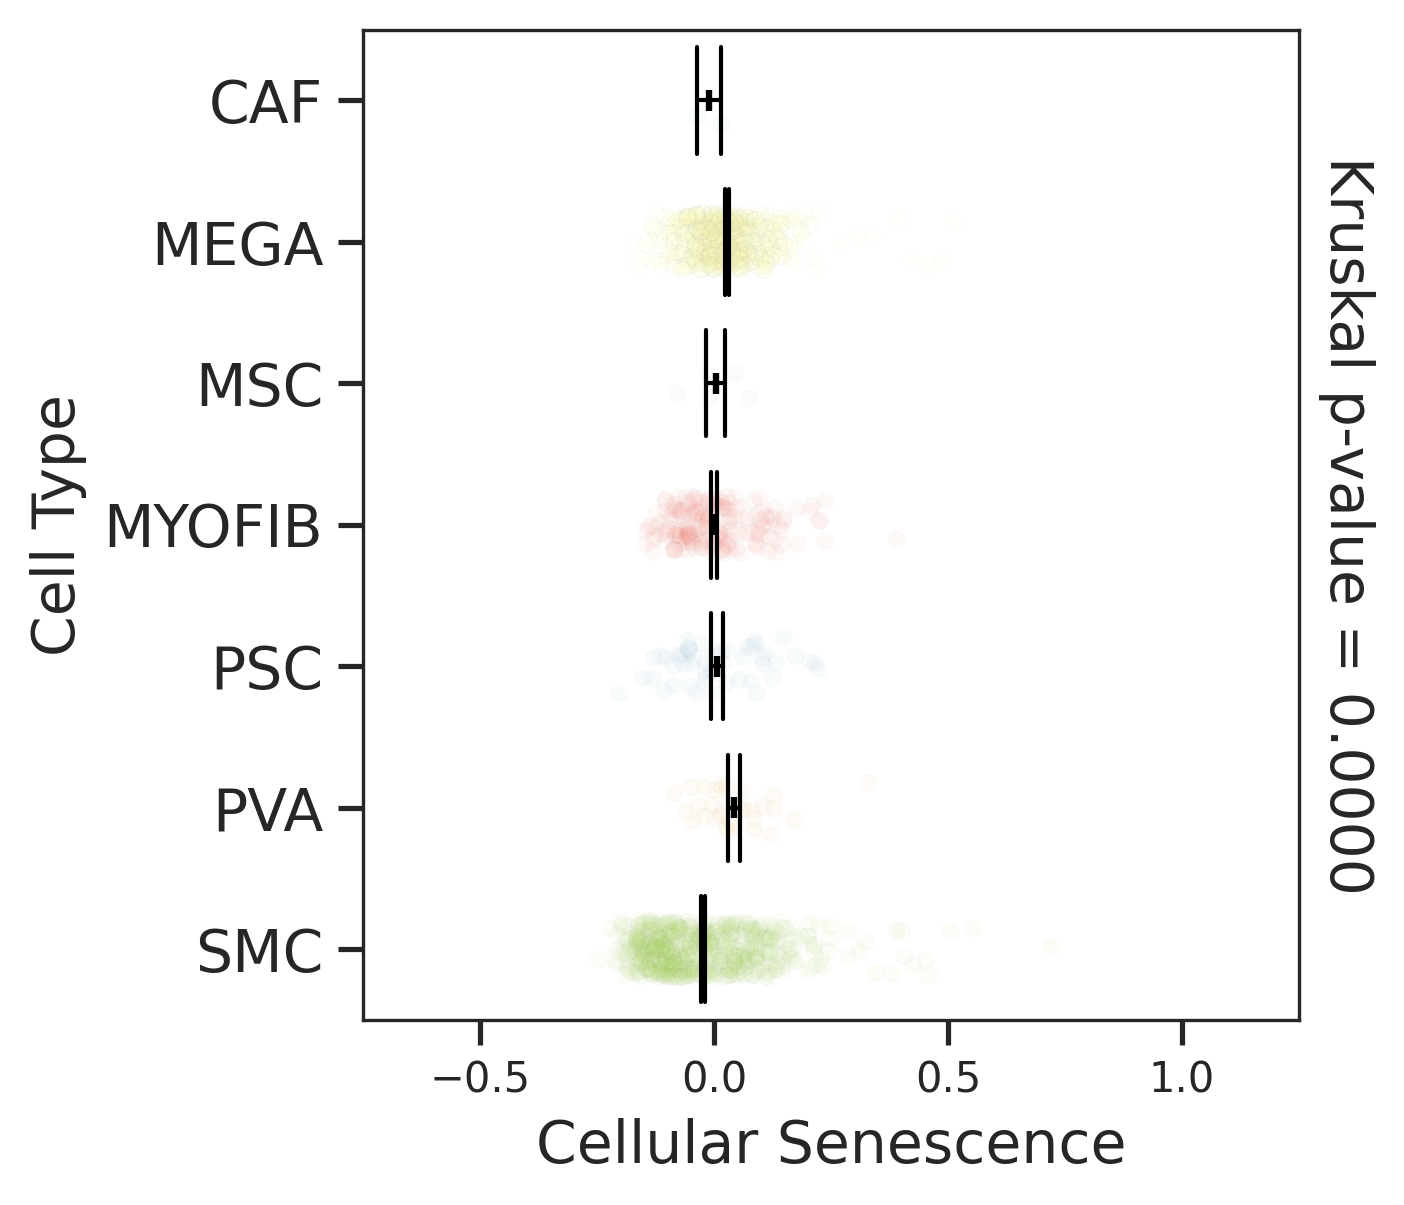
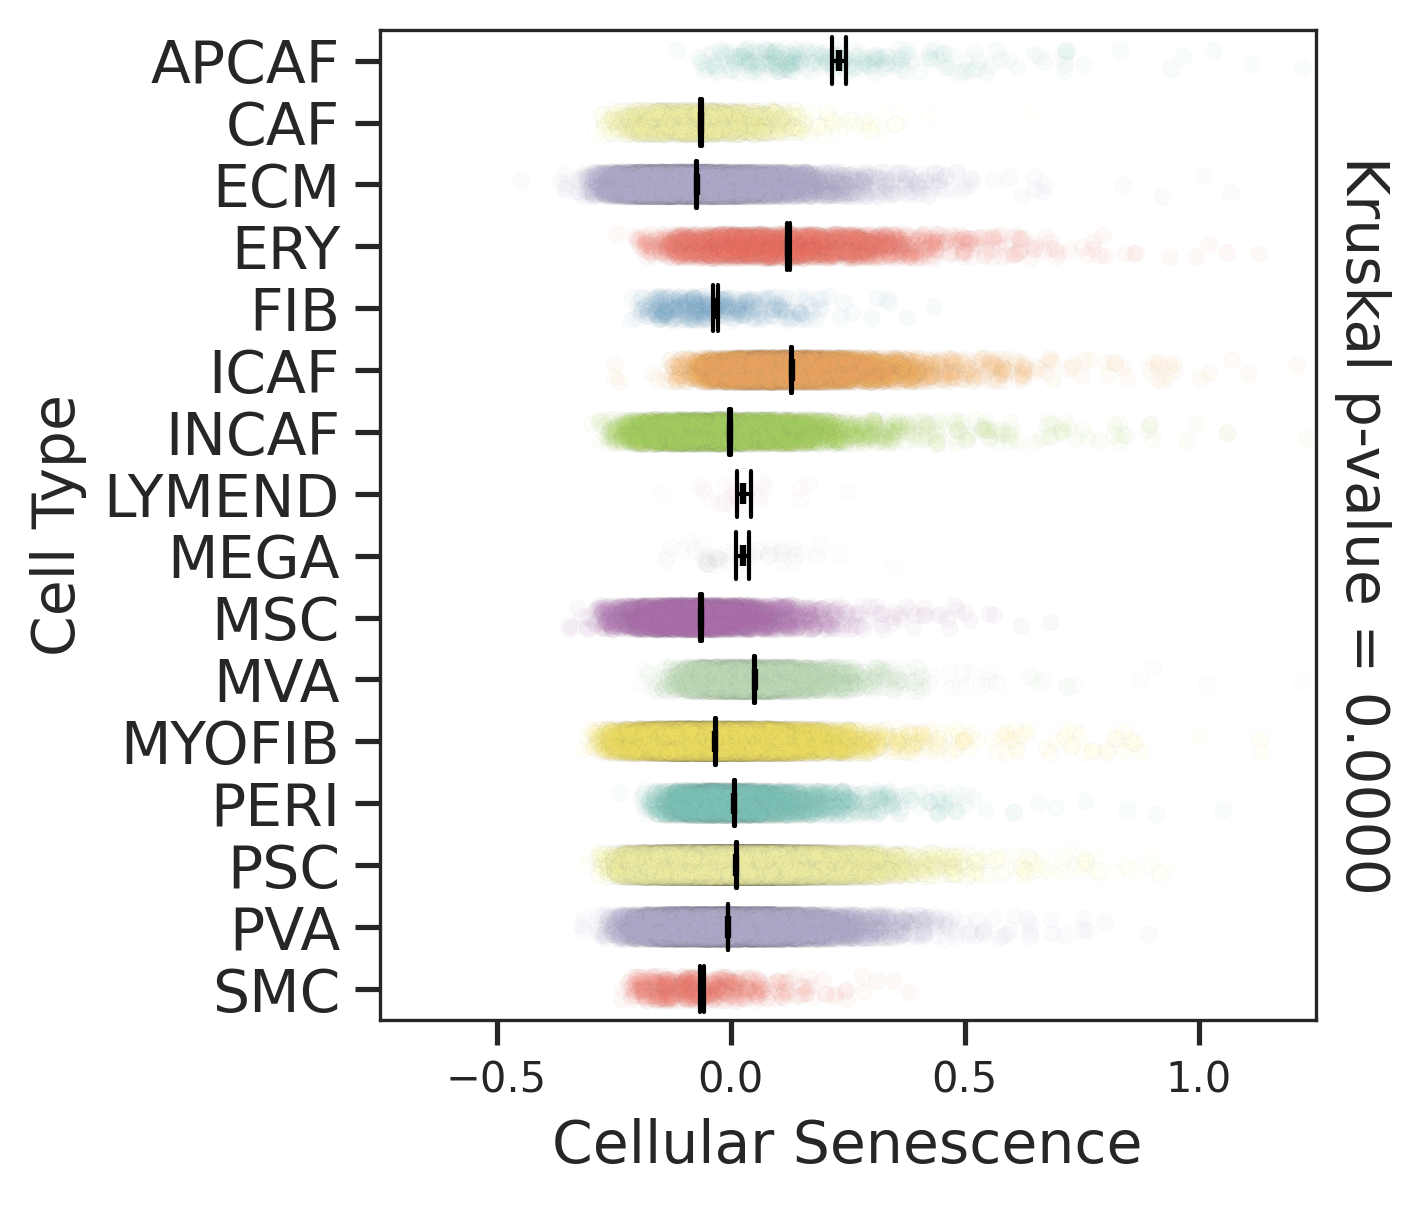
| Pancreas | Str | MEGA | Megakaryocytes | PF4,VWF,MPL,GP9,GP1BA,GP1BB,CD9,CD36,ITGA2B |
| Pancreas | Str | SMC | Smooth muscle cells | ACTA2,CNN1,MYH11,TAGLN,CALD1,TAGLN2 |
| Pancreas | Str | PVA | Post capillary venules | SELP,ZNF385D,FAM155A,GALNT15,MADCAM1,CORT |
| Pancreas | Str | MYOFIB | Myofibroblasts | SYT10,SOSTDC1,DES,TAGLN,MYH11,TPM4 |
| Pancreas | Str | MSC | Mesenchymal stem cells | NT5E,THY1,ENG,CD44,ITGB1,MCAM,ENDOD1 |
| Pancreas | Str | PSC | Pancreatic stellate cells | DES,ACTA2,VIM,NES,PDGFRB,SHH,COL1A1,COL1A2,COL3A1,COL4A1,COL4A2,MMP2,MMP9,MMP13 |
| Pancreas | Str | INCAF | Intermediate cancer-associated fibroblasts | PDGFRA,POSTN,ID1,ID3 |
| Pancreas | Str | ERY | Erythrocytes | HBD,GYPA,HBA1,HBA2,CA1,HBB,BRSK1 |
| Pancreas | Str | CAF | Cancer-associated fibroblasts | TWIST1,WNT2,FAP,CXCL1,CXCL2,CYR61 |
| Pancreas | Str | APCAF | Antigen-presenting cancer-associated fibroblasts | CD74,SAA2,SAA1 |
| Pancreas | Str | FIB | Fibroblasts | BMP7,MAP3K2,COL6A1,CD36,CD44,CBLN2,SPOCK1,ACSS3,FN1,COL3A1,BGN,DCN,POSTN,C1R,MMP2,FGF7,MME,CD47 |
| Pancreas | Str | PERI | Pericytes | PDGFRA,CSPG4,RGS5,MCAM,COX4I2,KCNJ8,HIGD1B,NOTCH3,HEYL,FAM162B |
| Pancreas | Str | ICAF | Inflammatory cancer-associated fibroblasts | TWIST1,WNT2,FAP,CXCL1,CXCL2,CYR61,IL1B,IL6,HGF |
| Pancreas | Str | MVA | Microvascular cells | PLVAP,CD36,DYSF,NRP1,SH3BP5,EXOC3L2,FABP5,VWA1,BAALC,PRSS23,RAPGEF4,APLN,HTRA1 |
| Pancreas | Str | LYMEND | Lymphatic endothelial cells | PROX1,LYVE1,PDPN,PROCR,FLT4 |
| Pancreas | Str | ECM | Extracellular matrix | FBLN1,PCOLCE2,MFAP5 |
Top |
Cell type statistics by disease state |
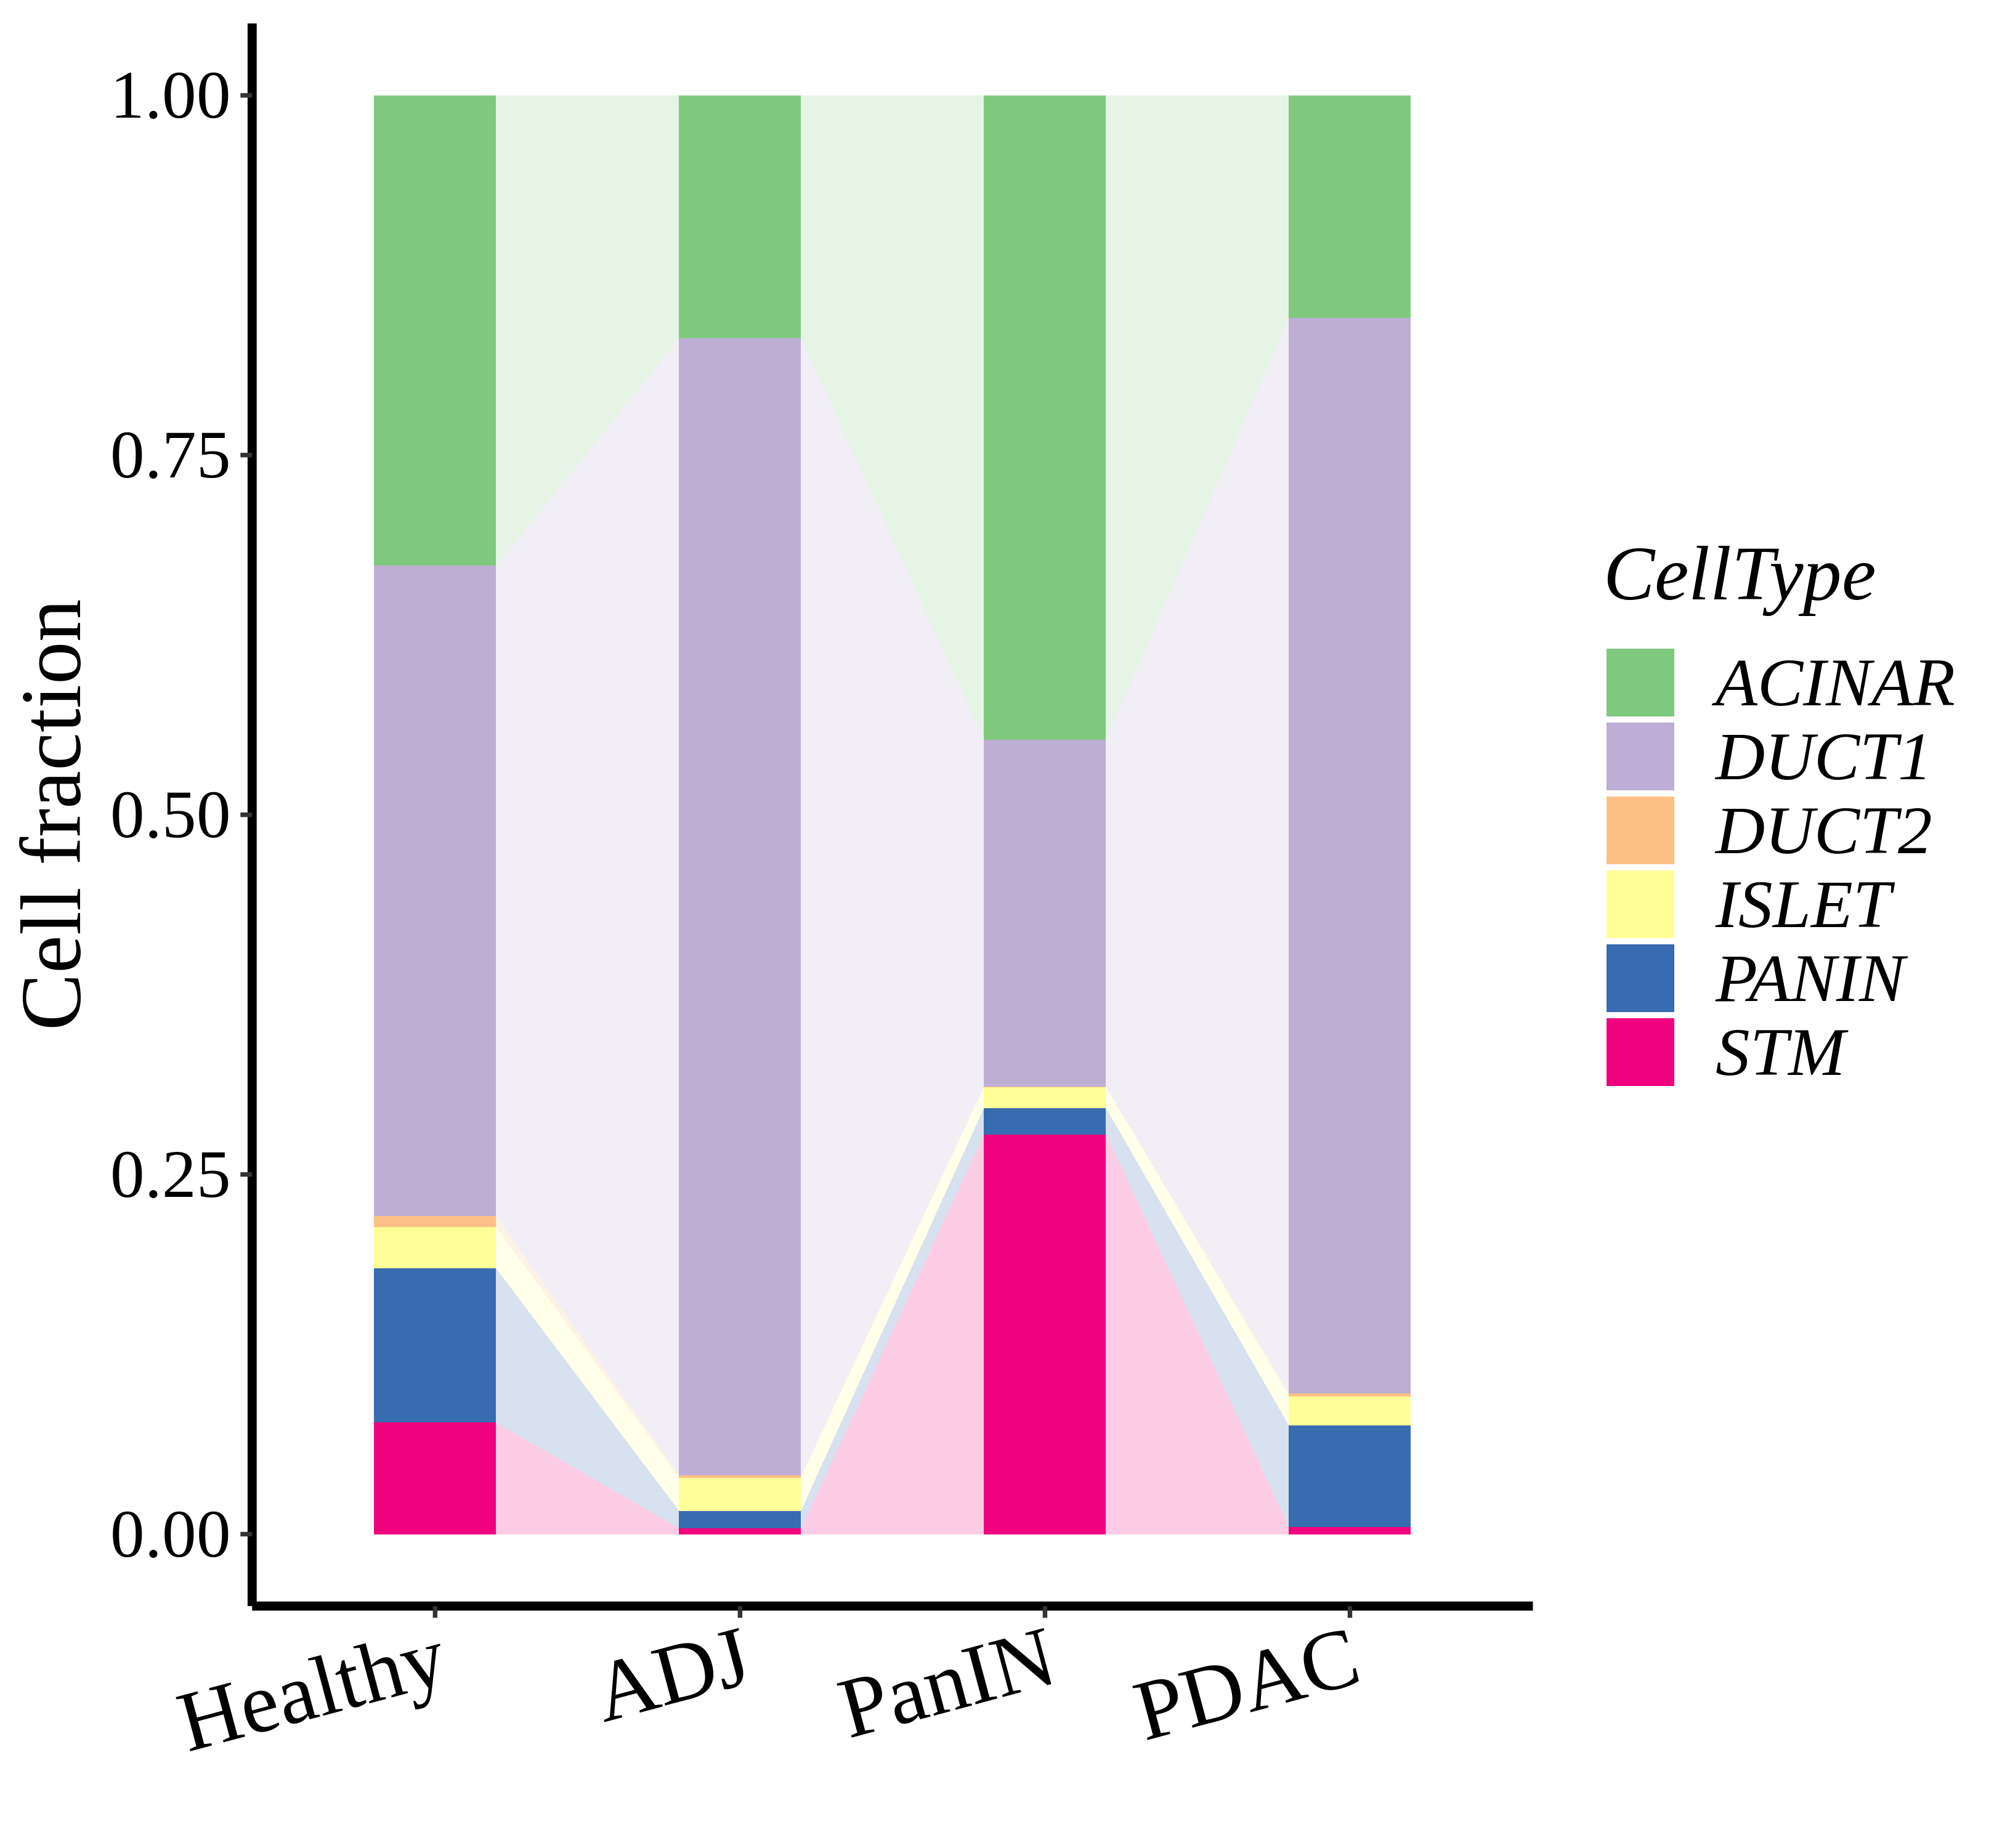 |  |  |
| ∗Stacked bar graph representation of the fraction of each epithelial cell type derived from samples with different Disease States in the integrated dataset of Pancreas tissue. Cells from each Disease State sample have a different color. |
Top |
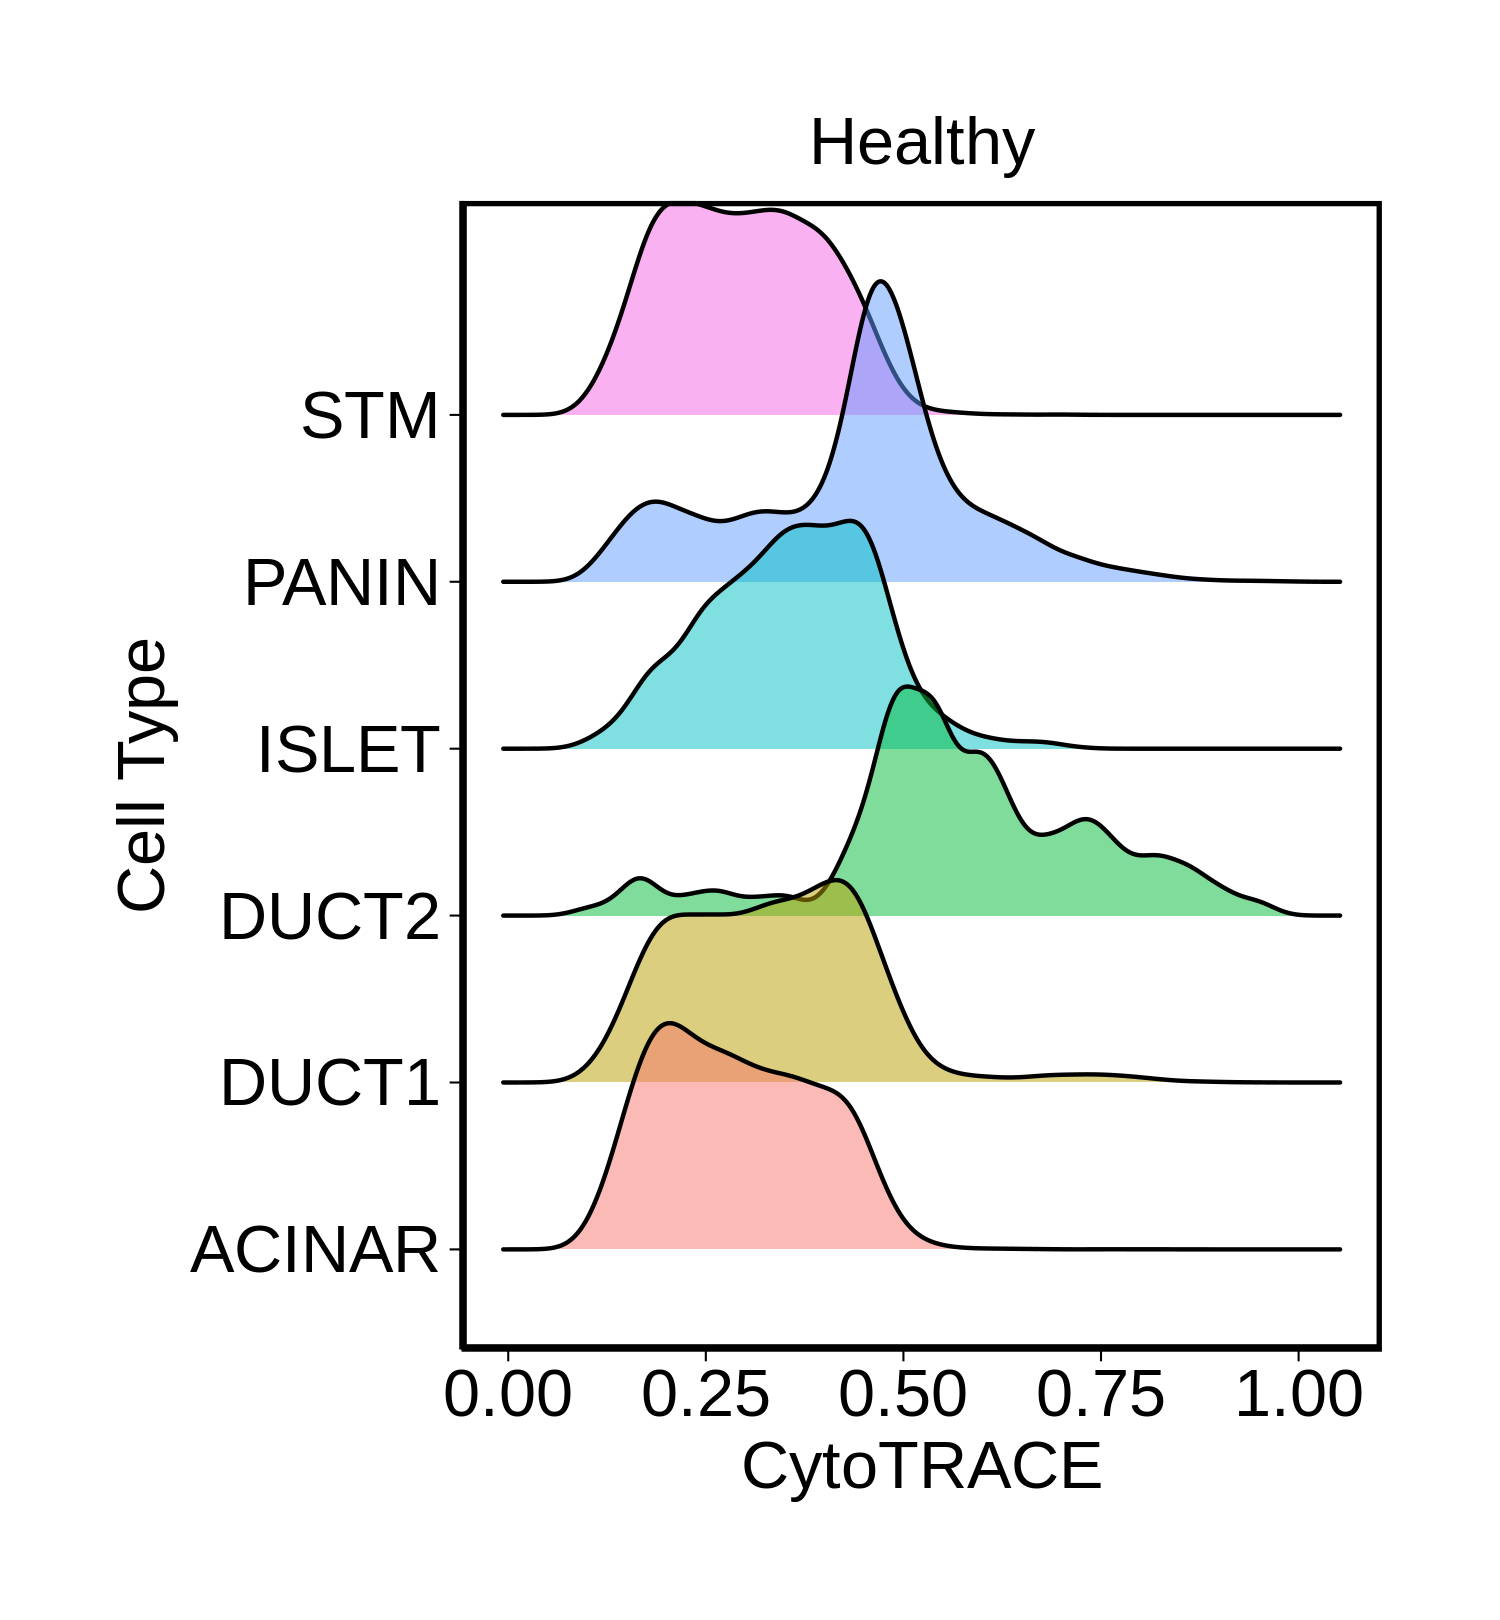
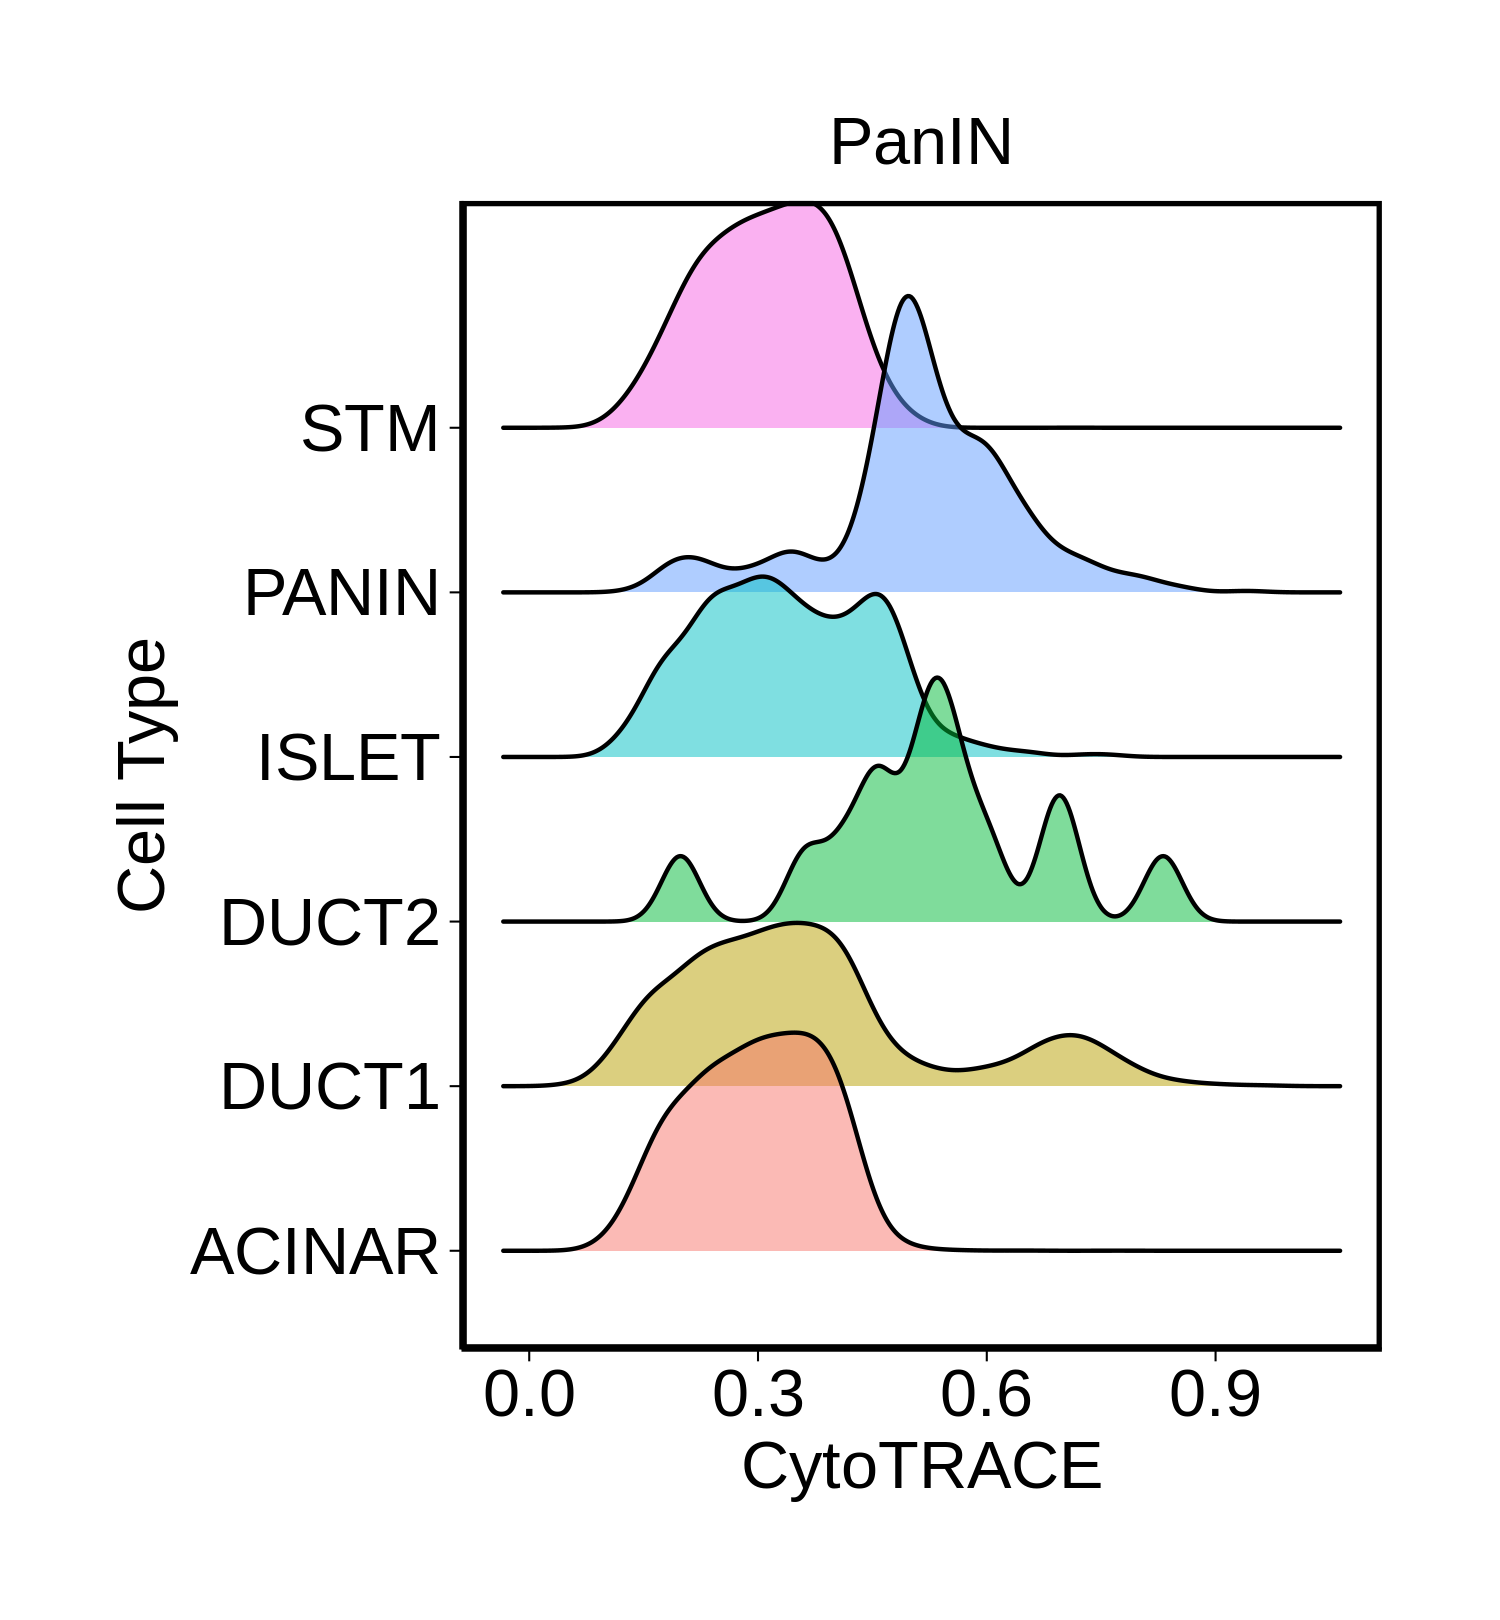
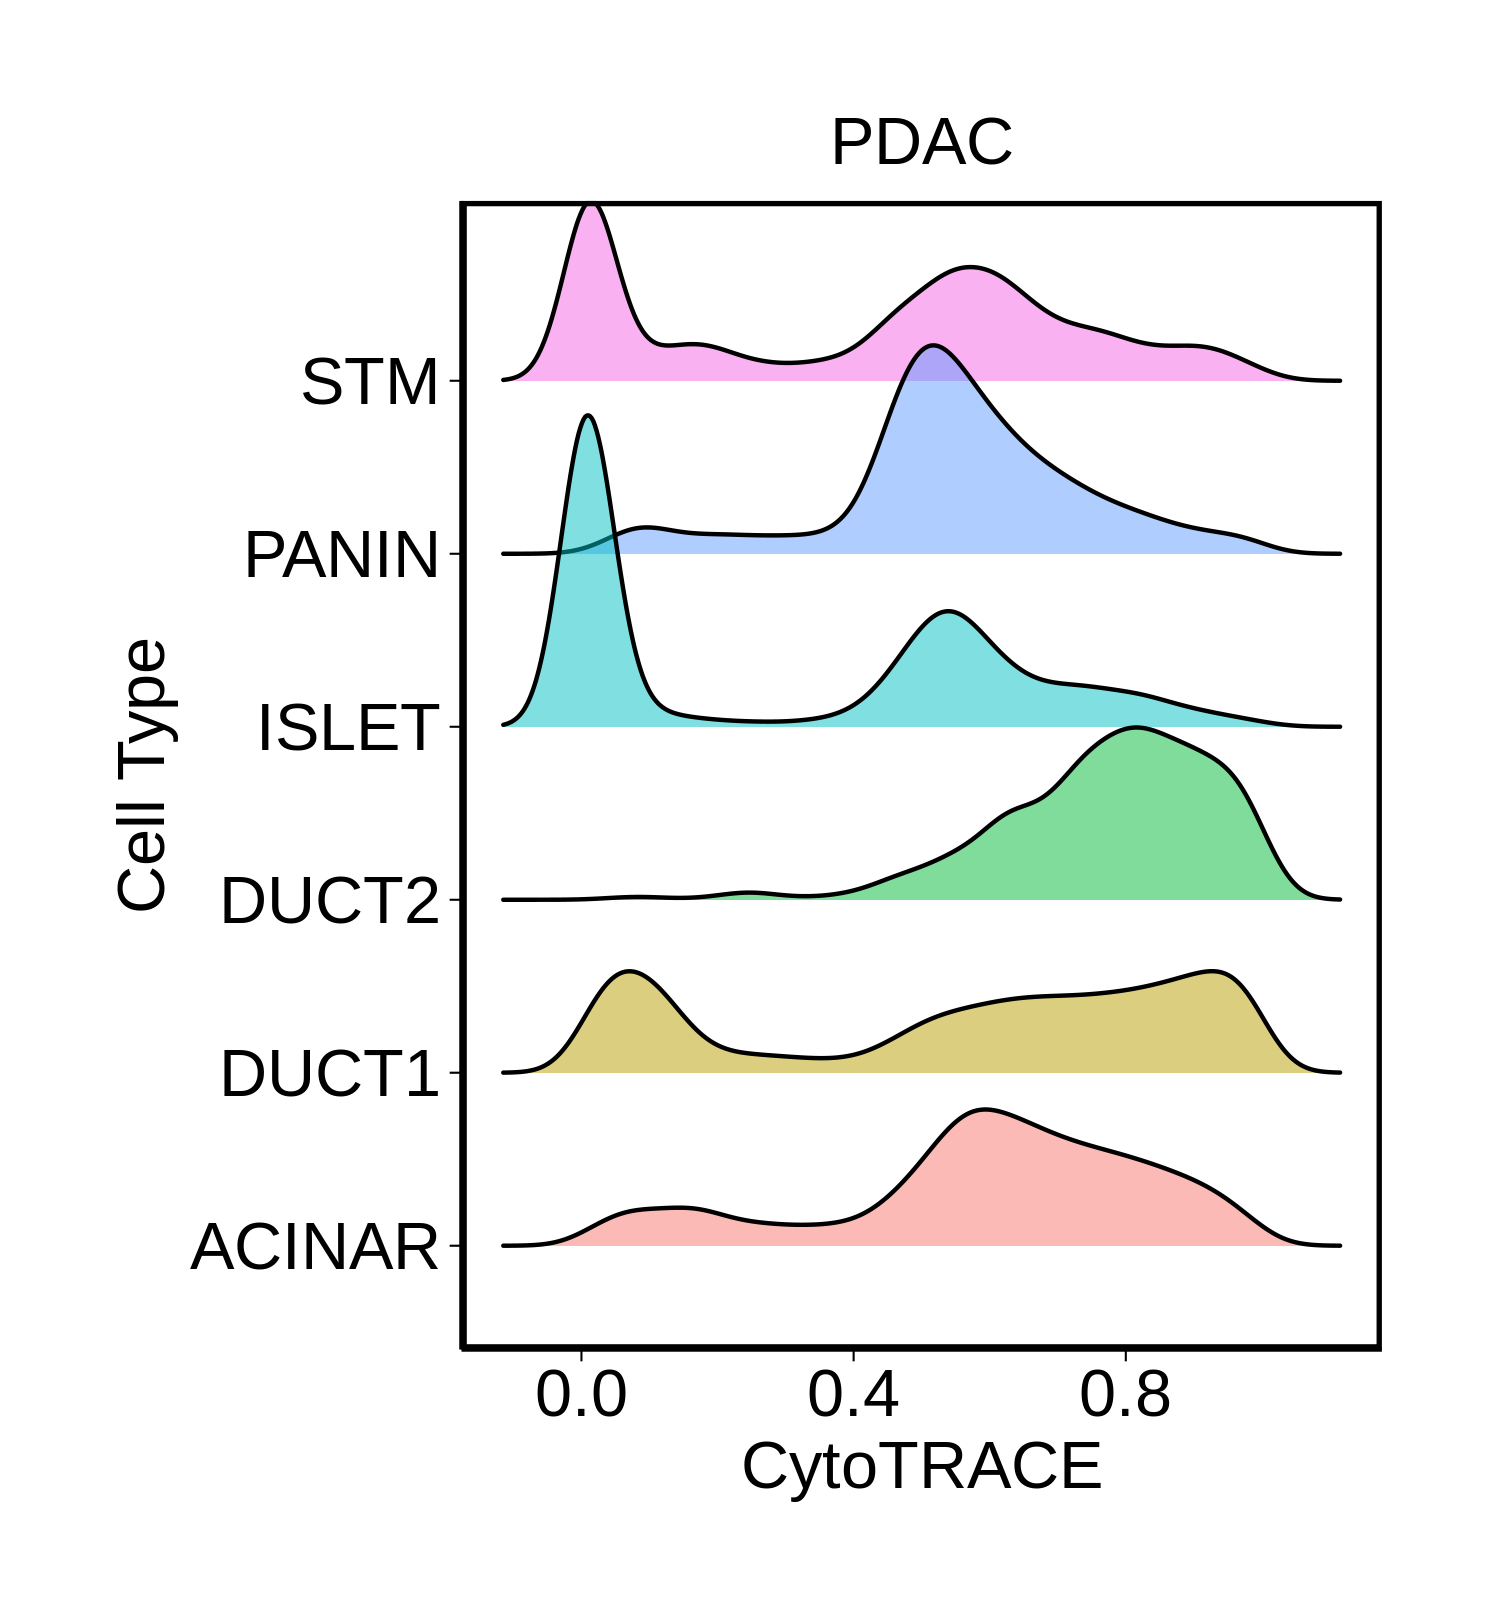
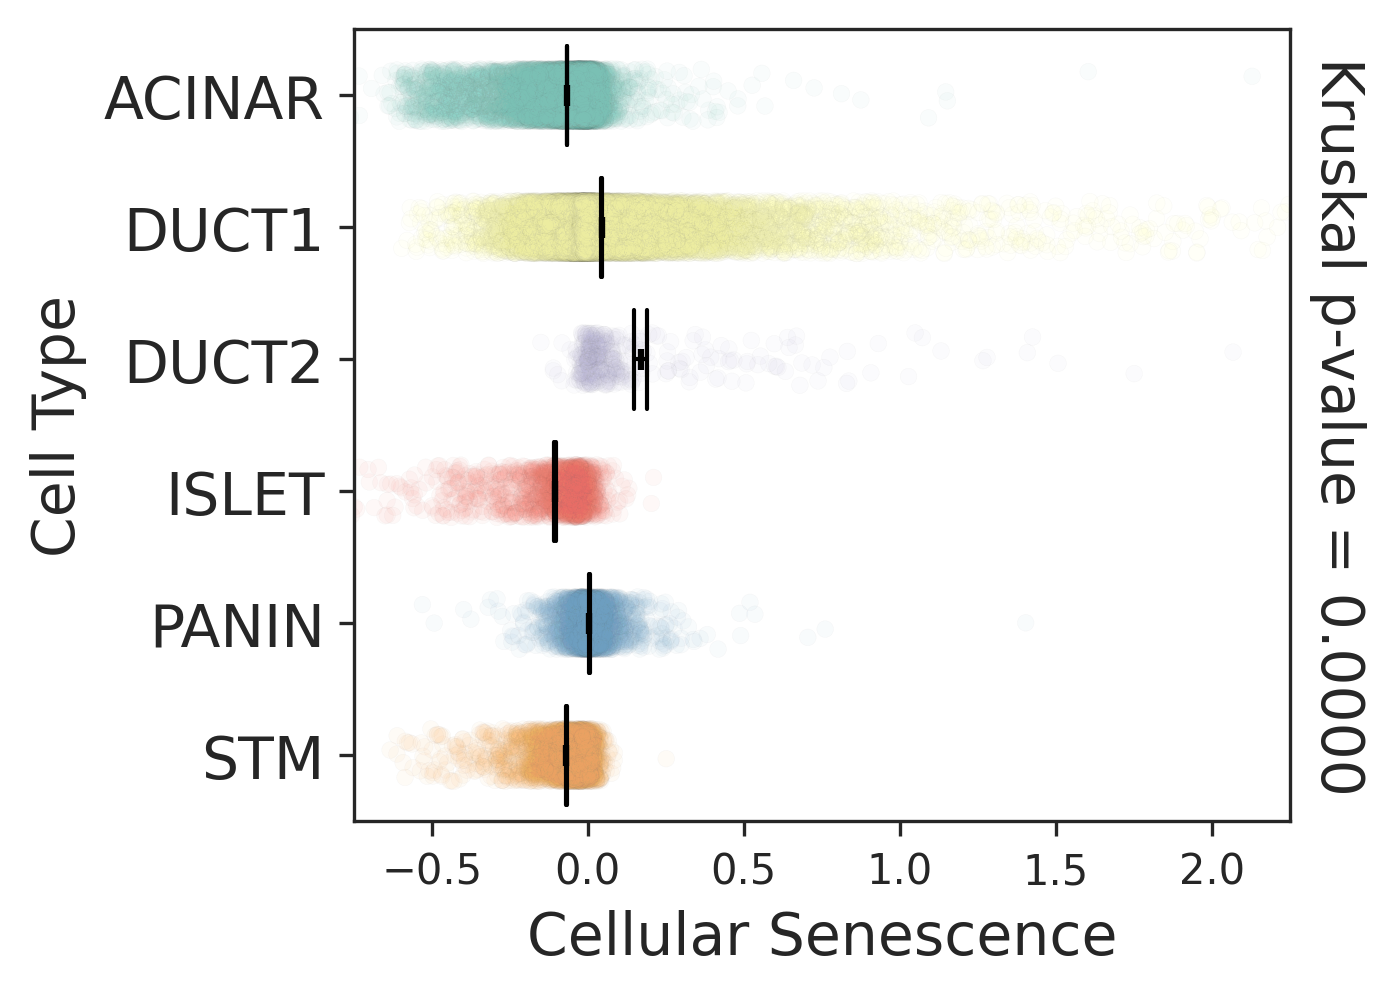
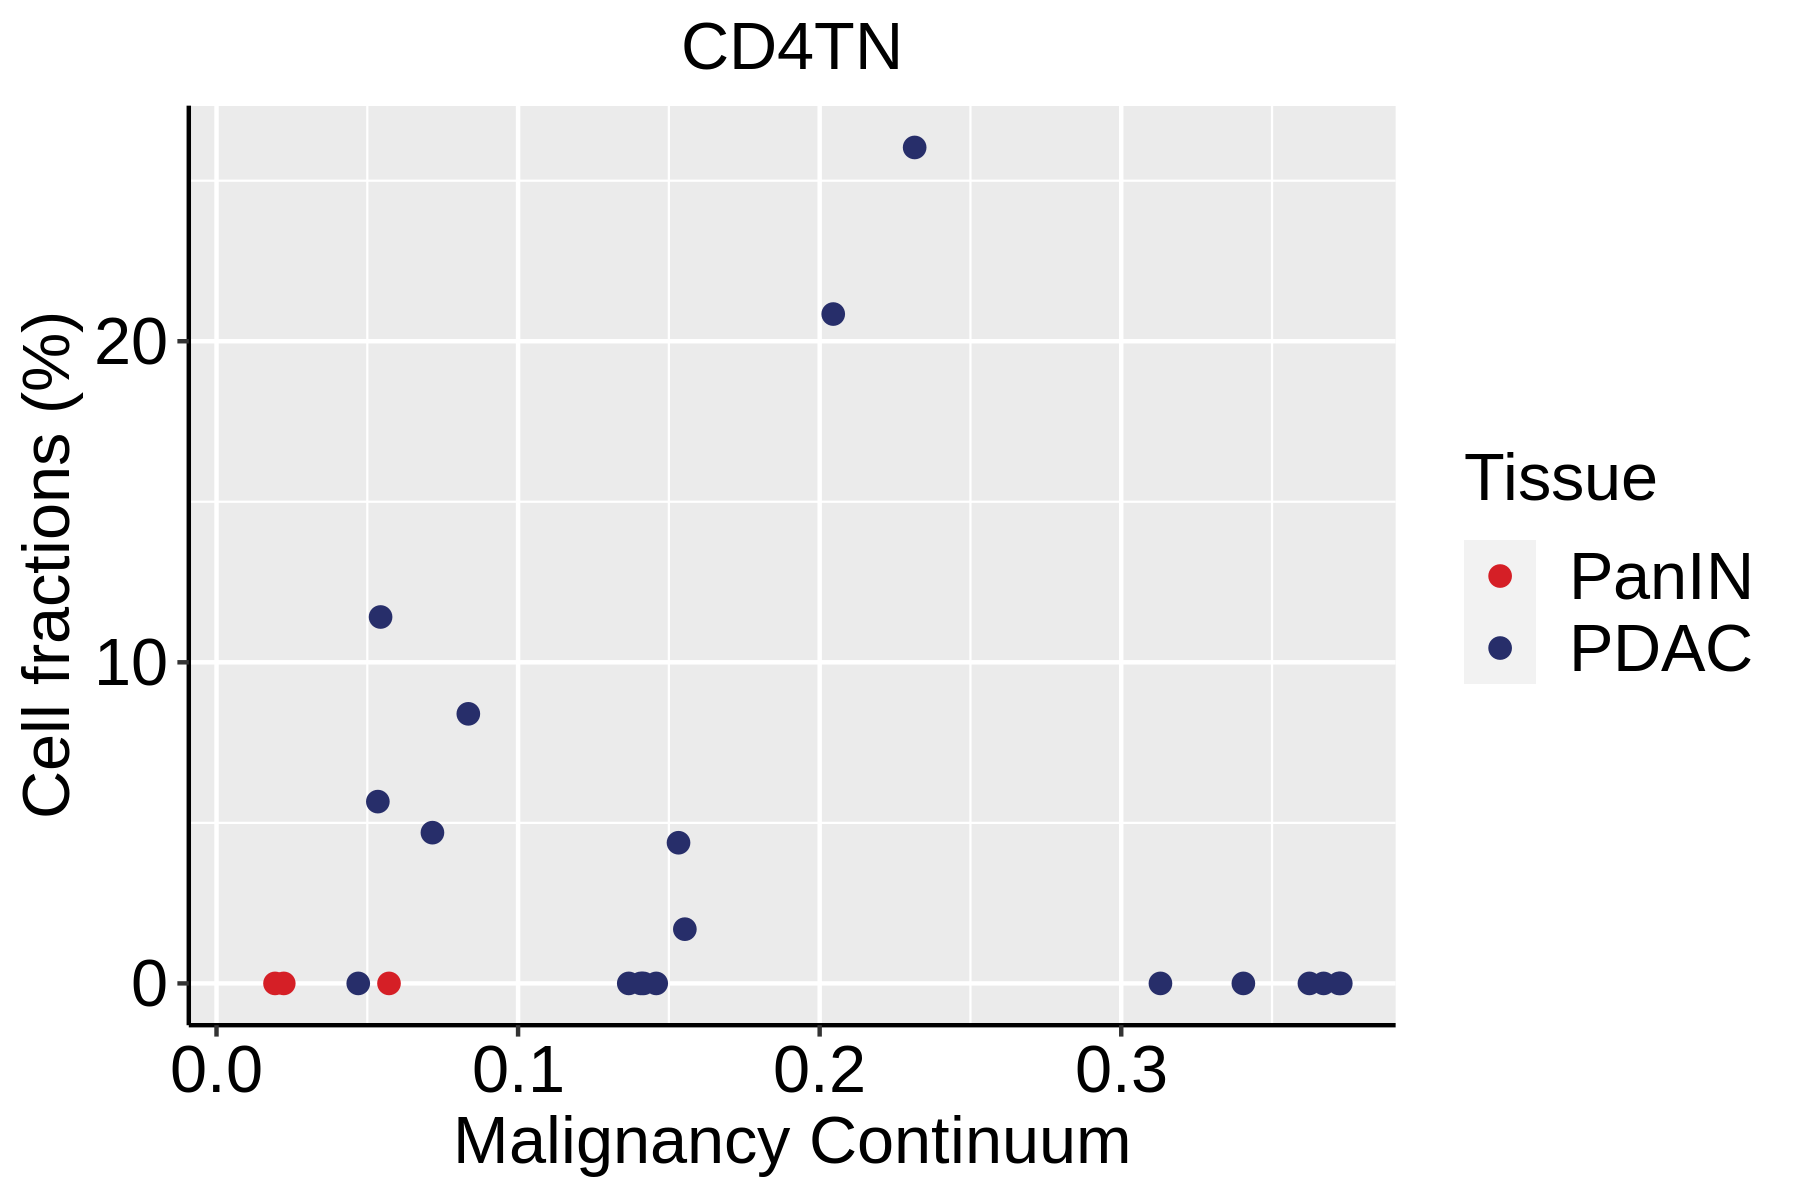
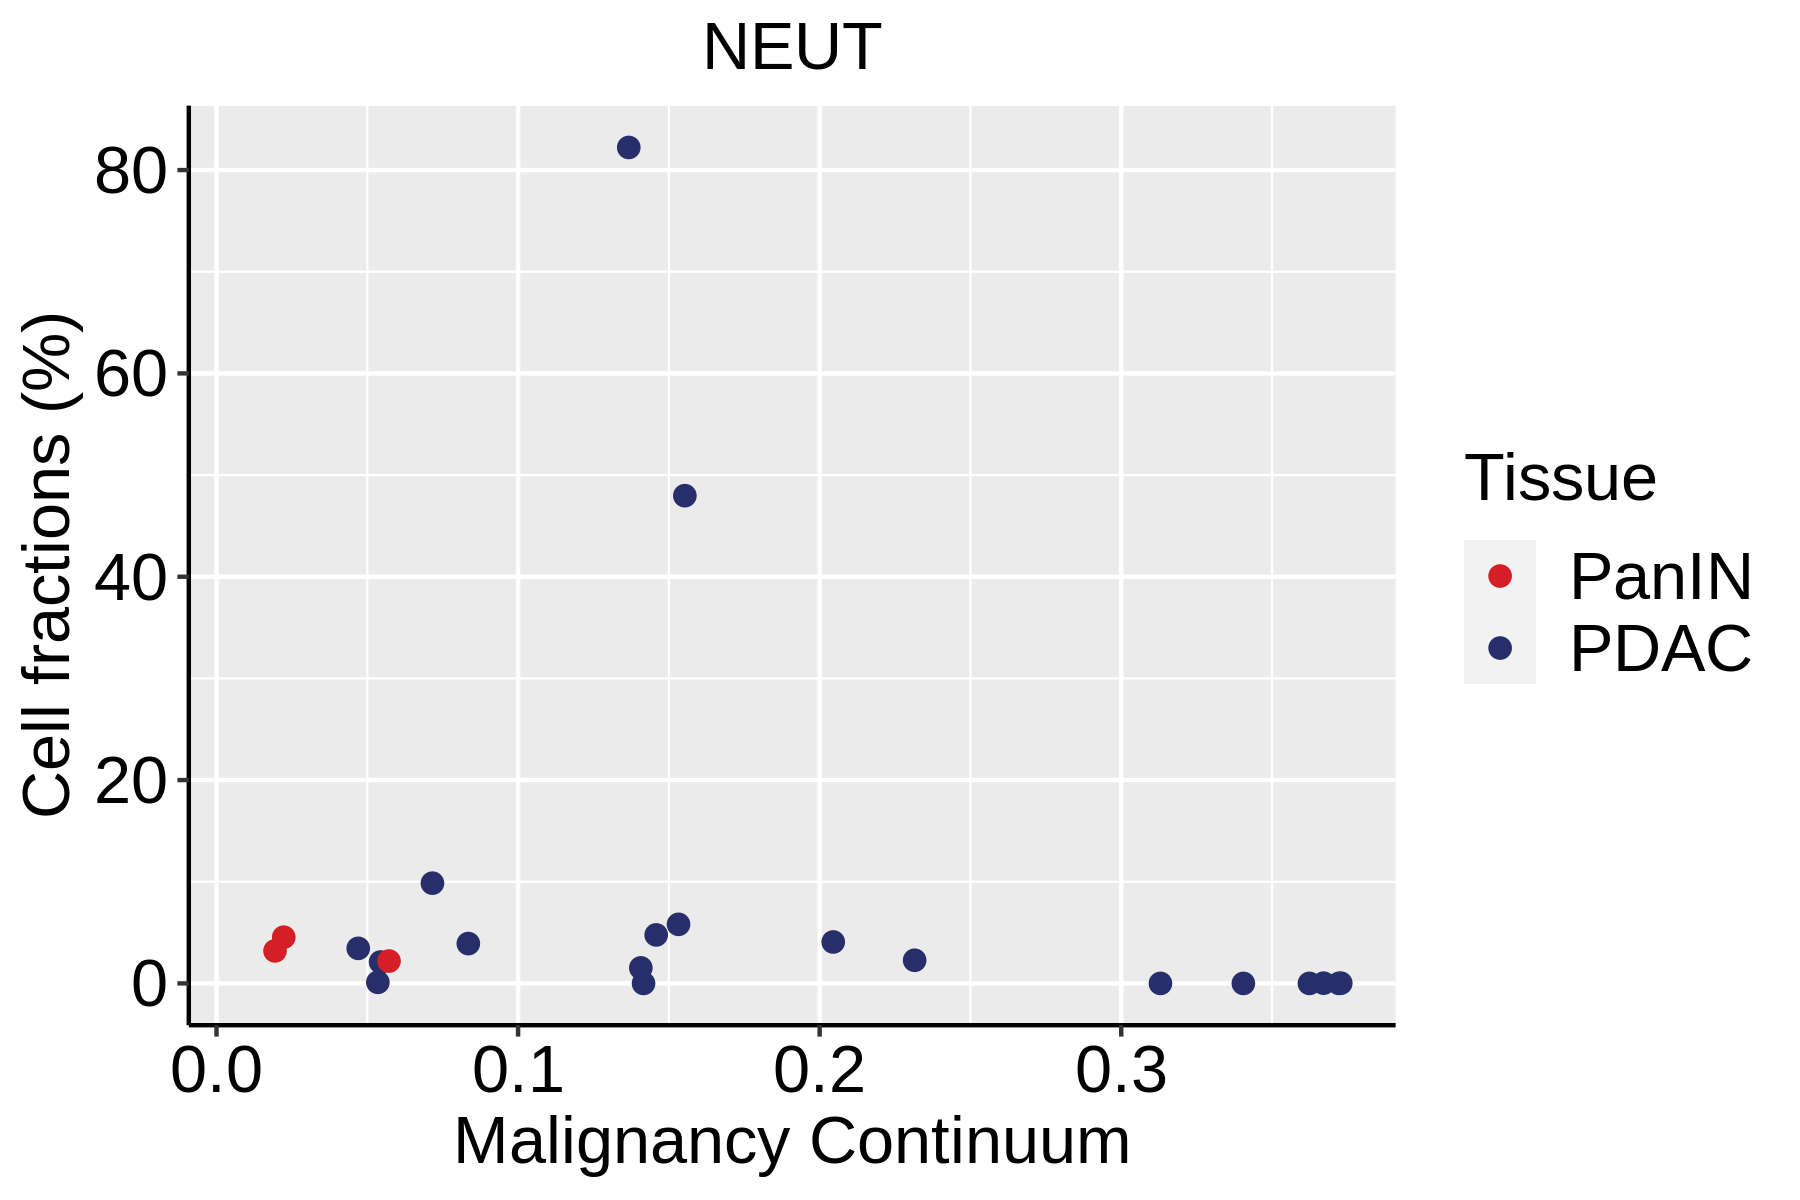
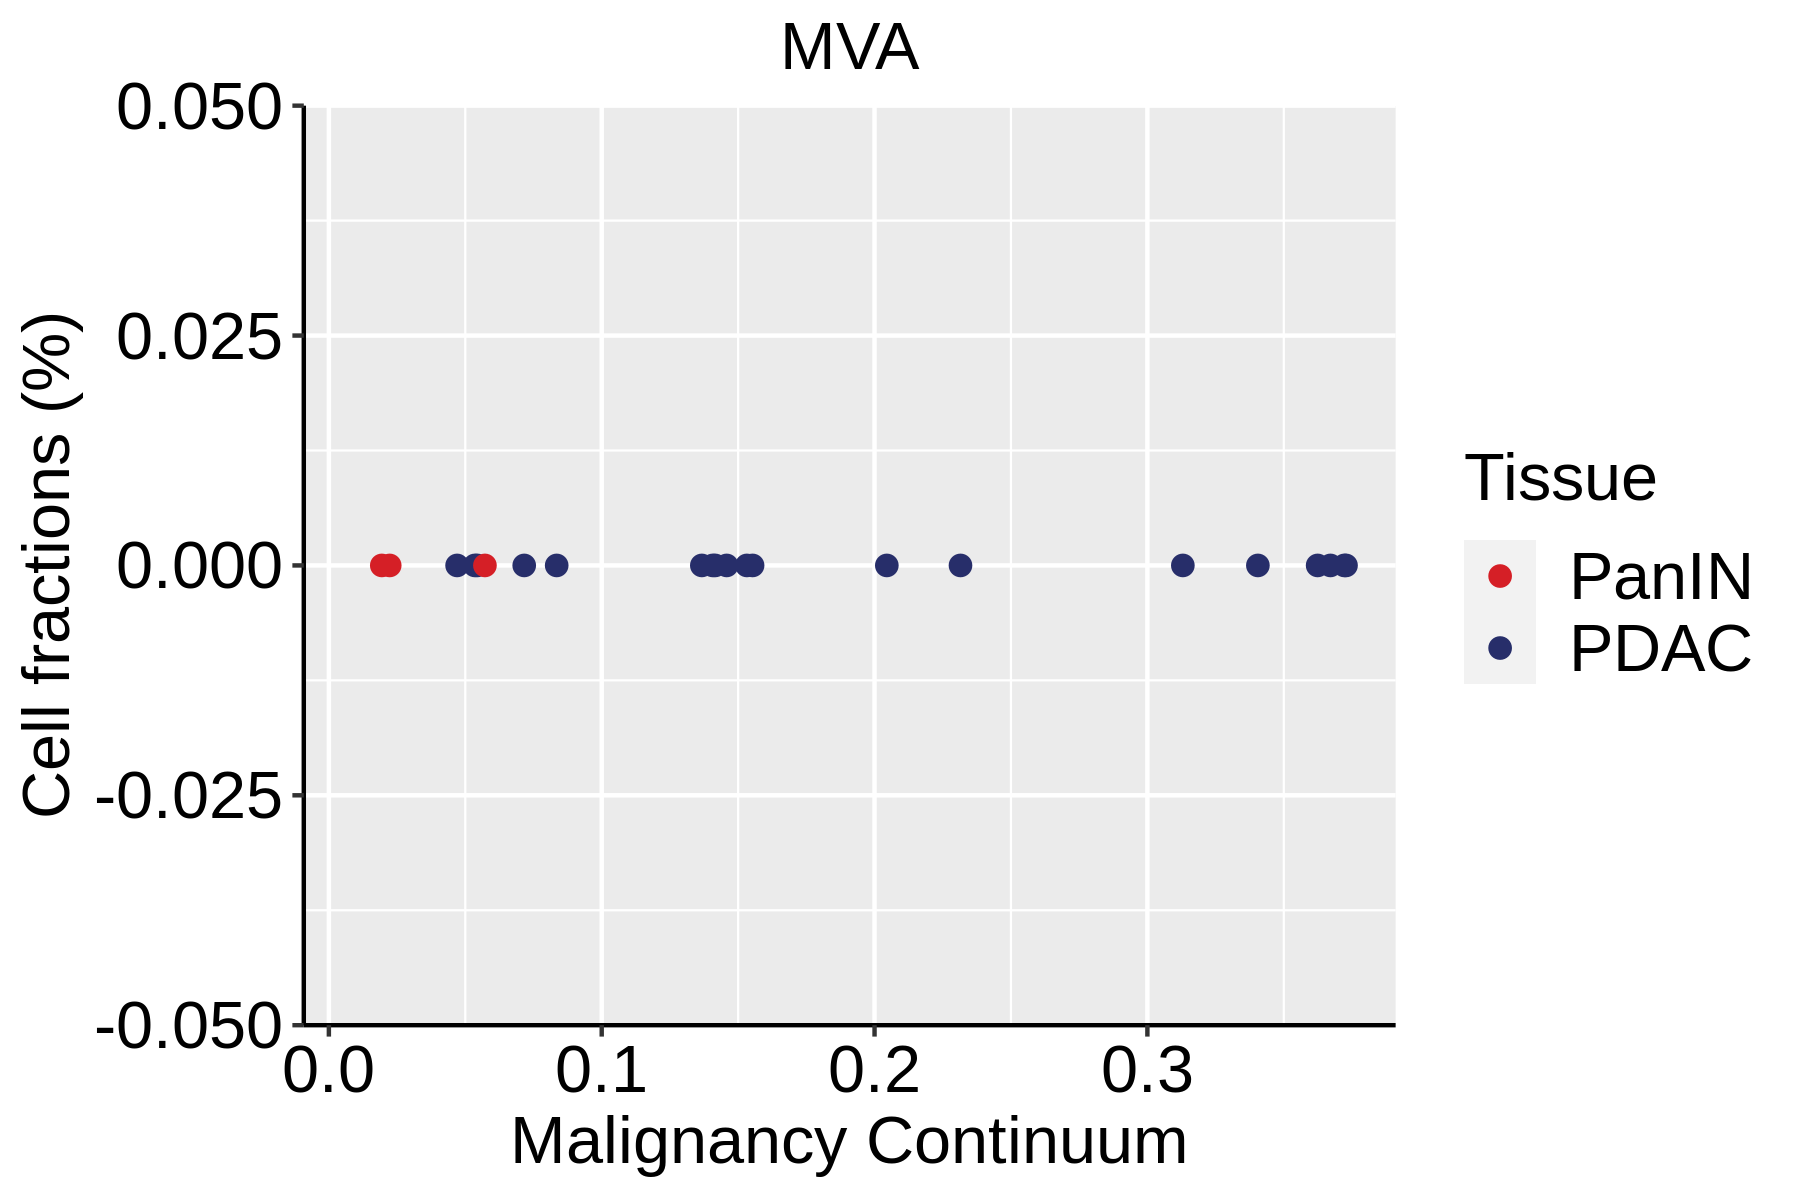
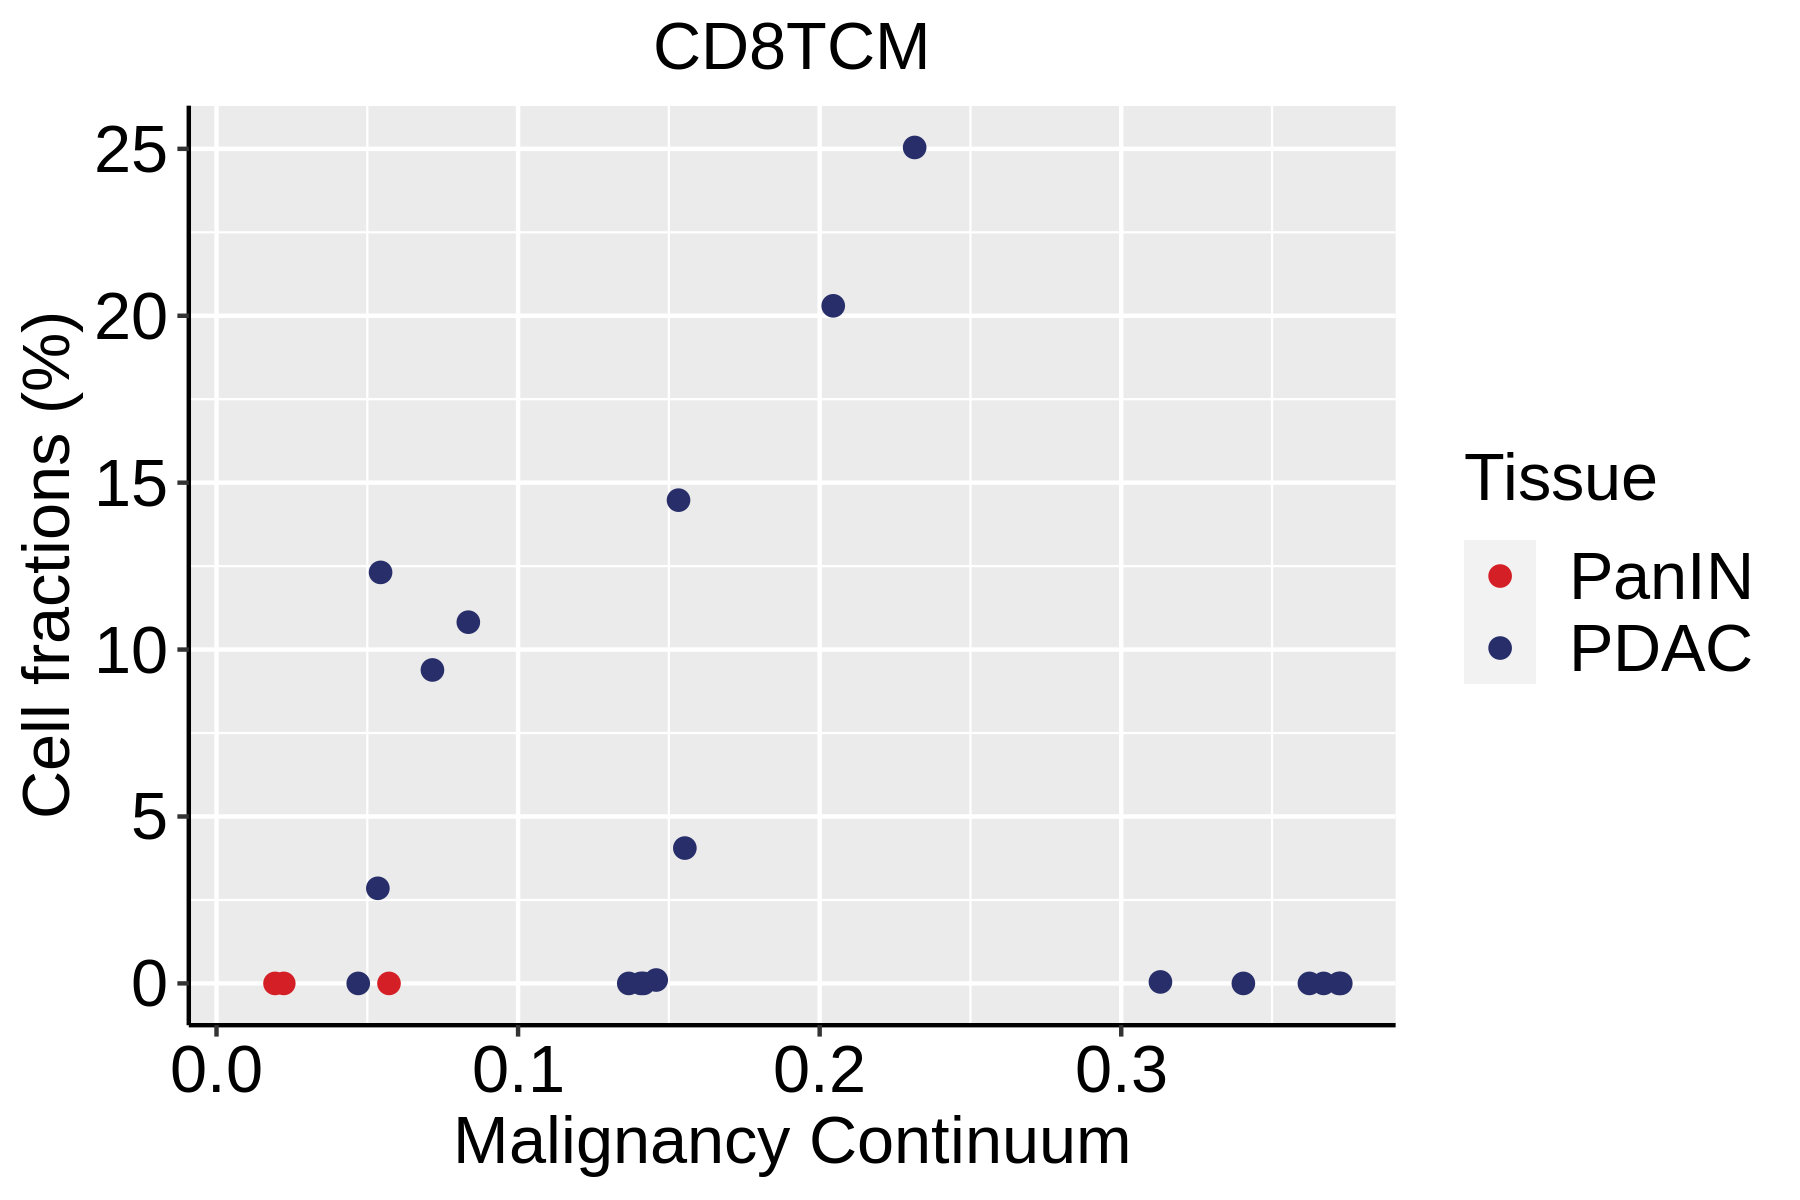
Cell type dynamics in malignant transformation |
 |  | 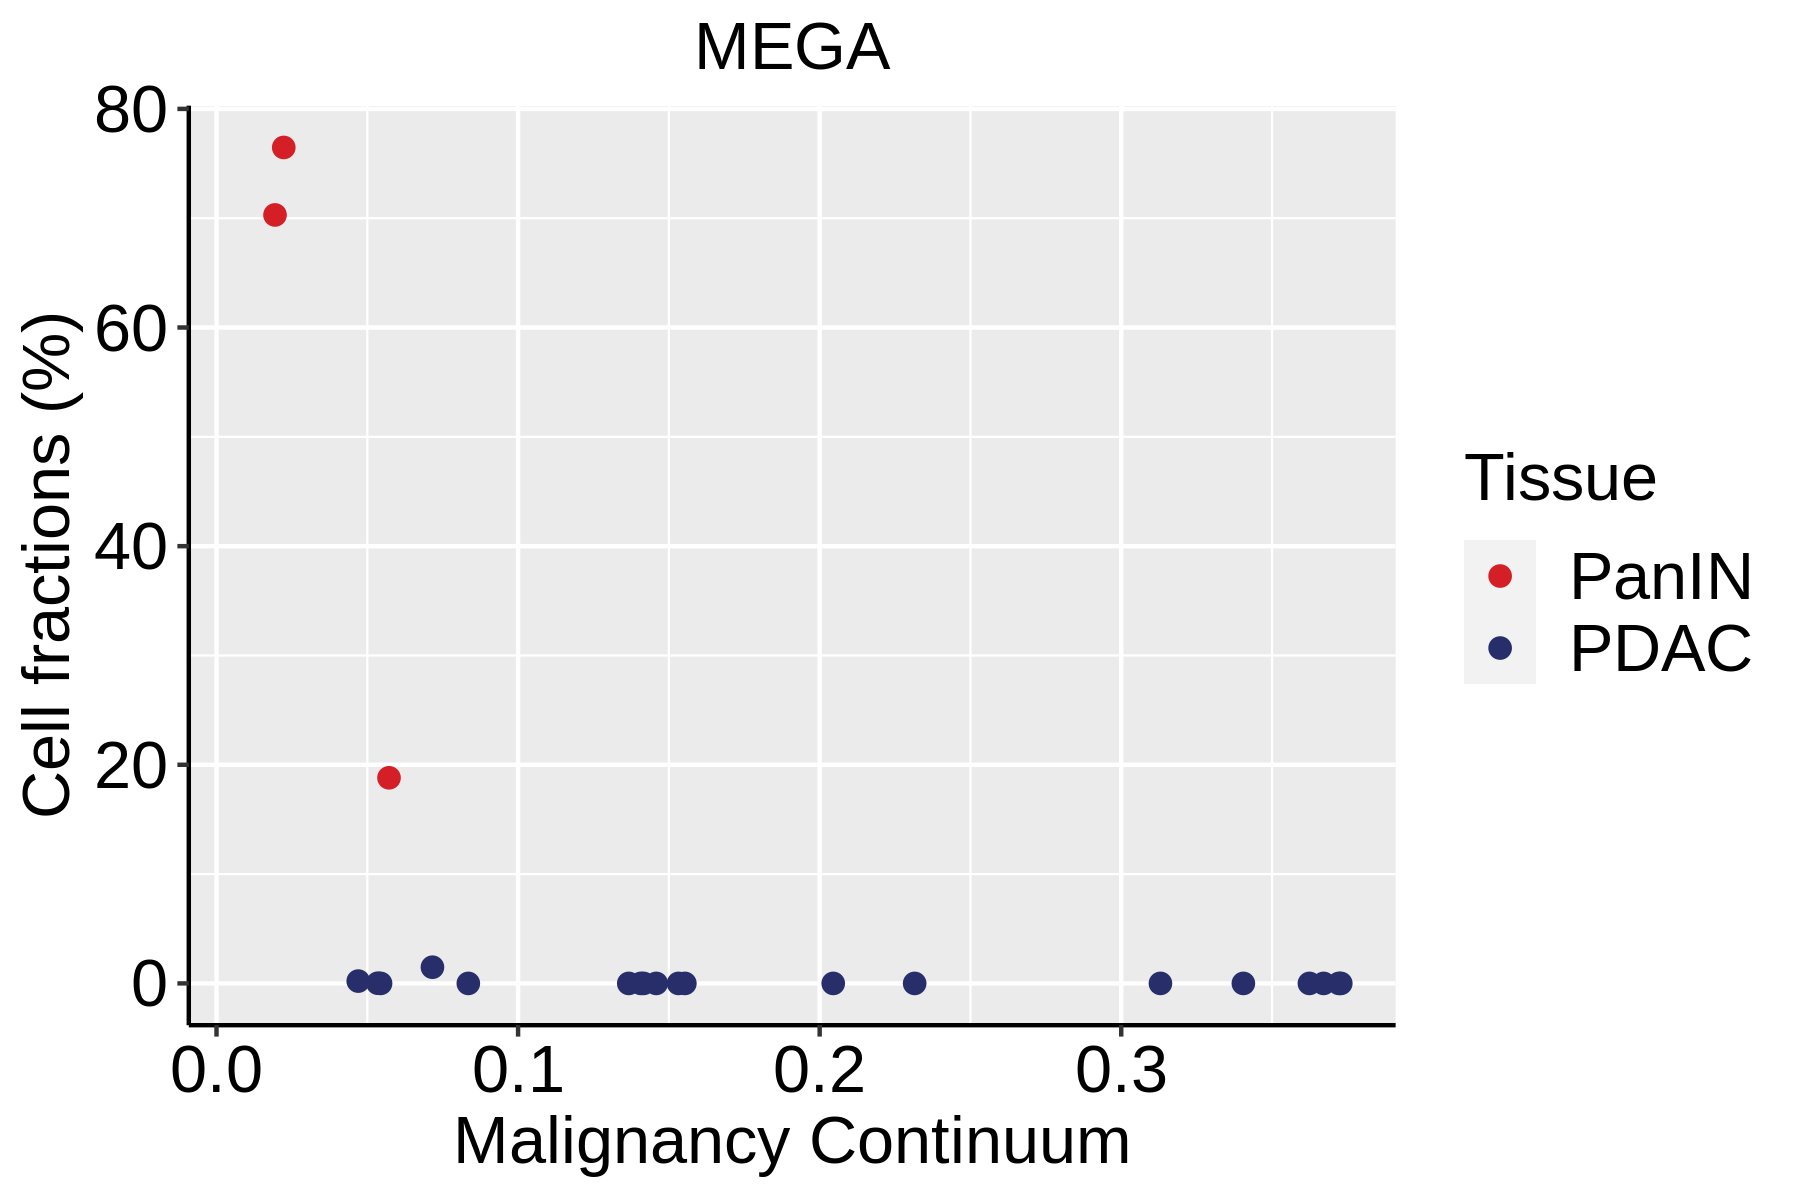 |
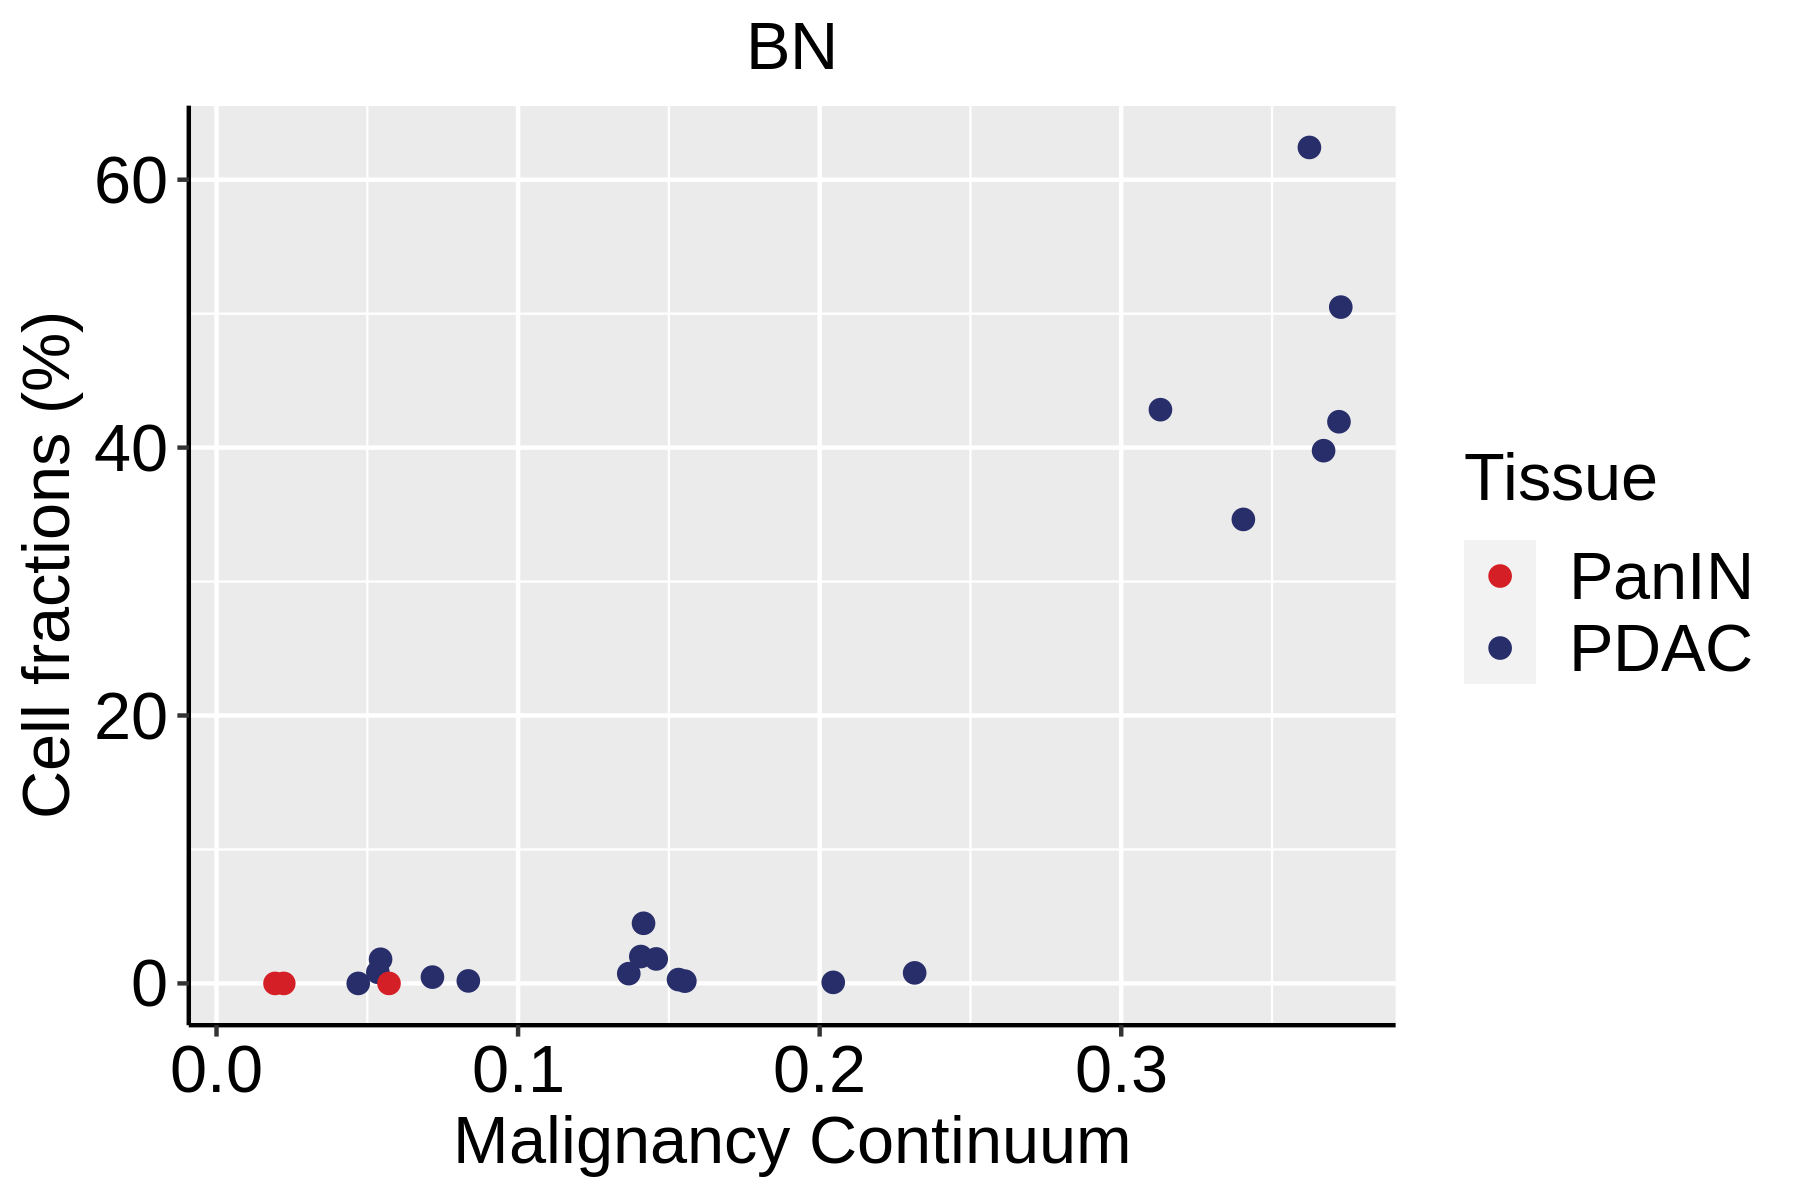 | 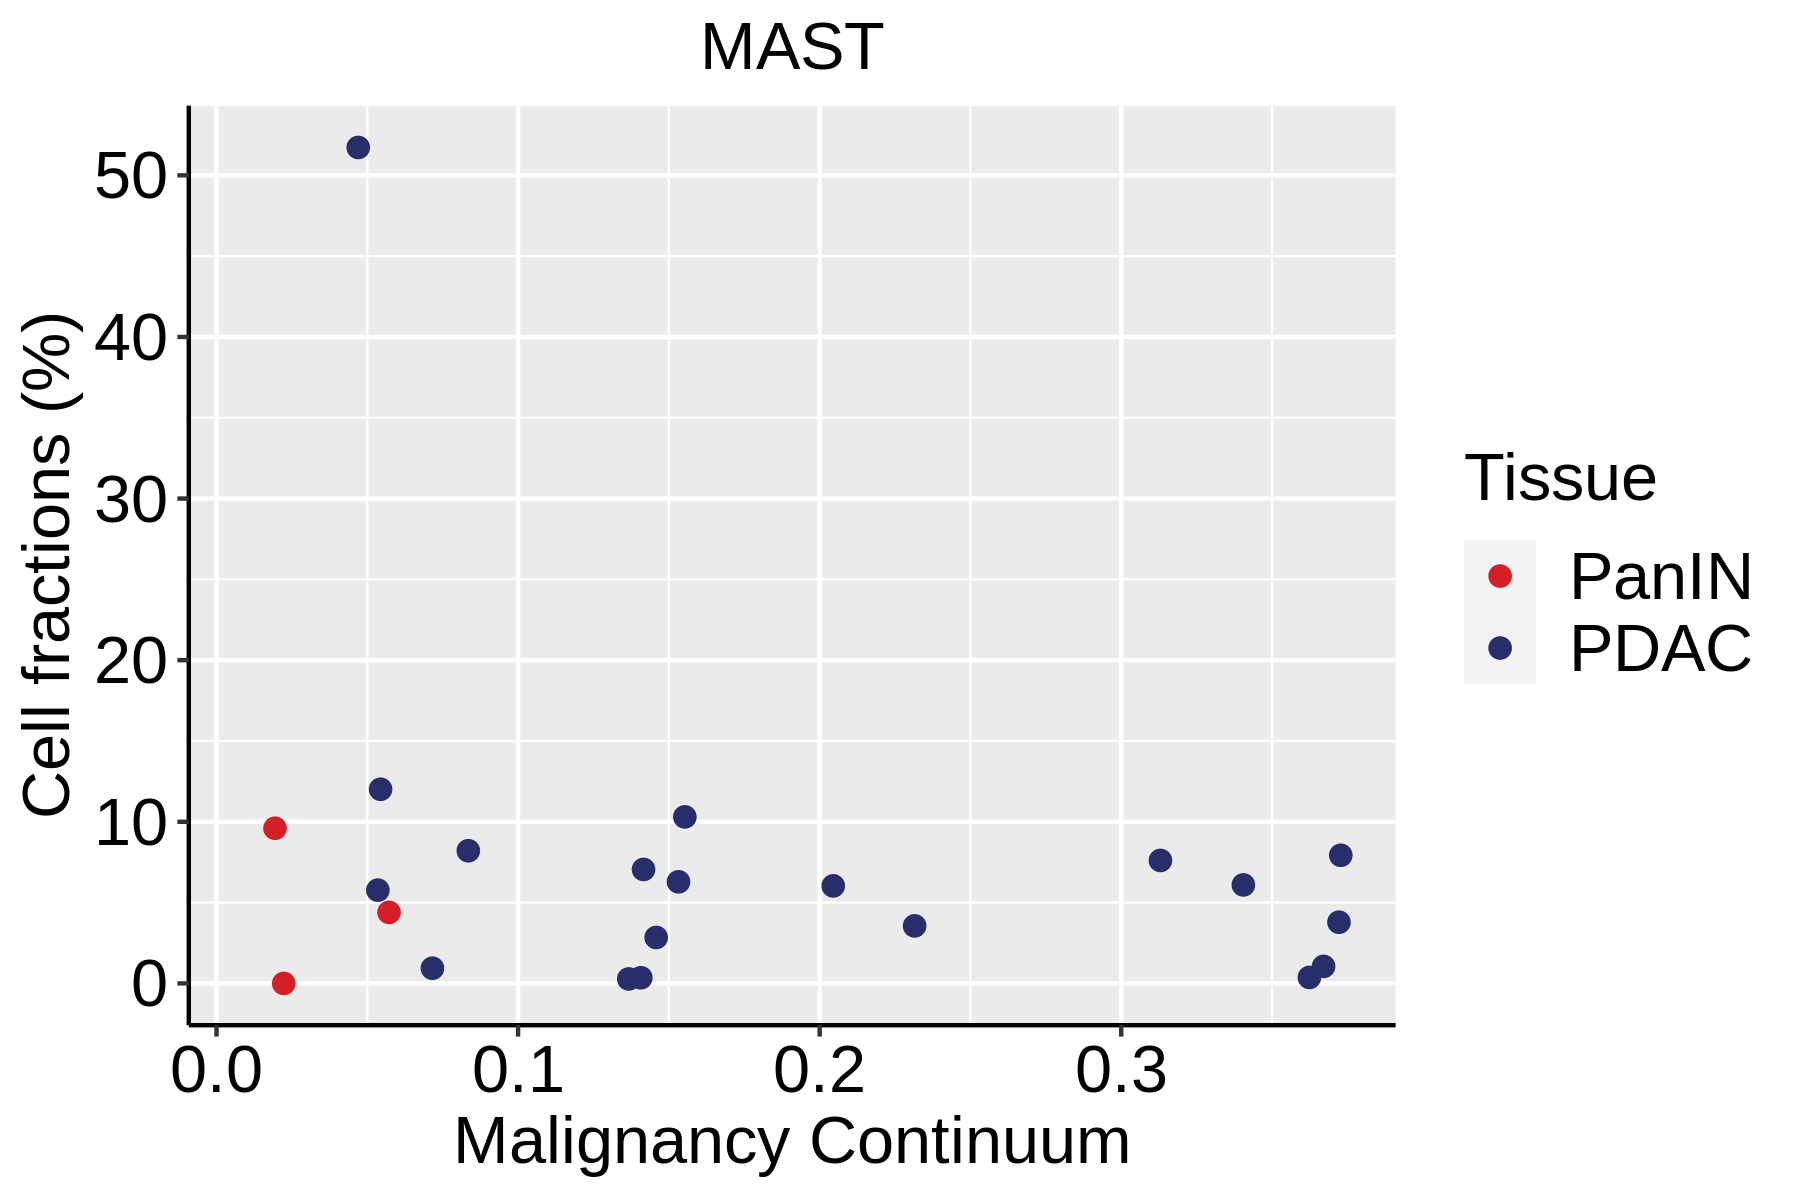 | 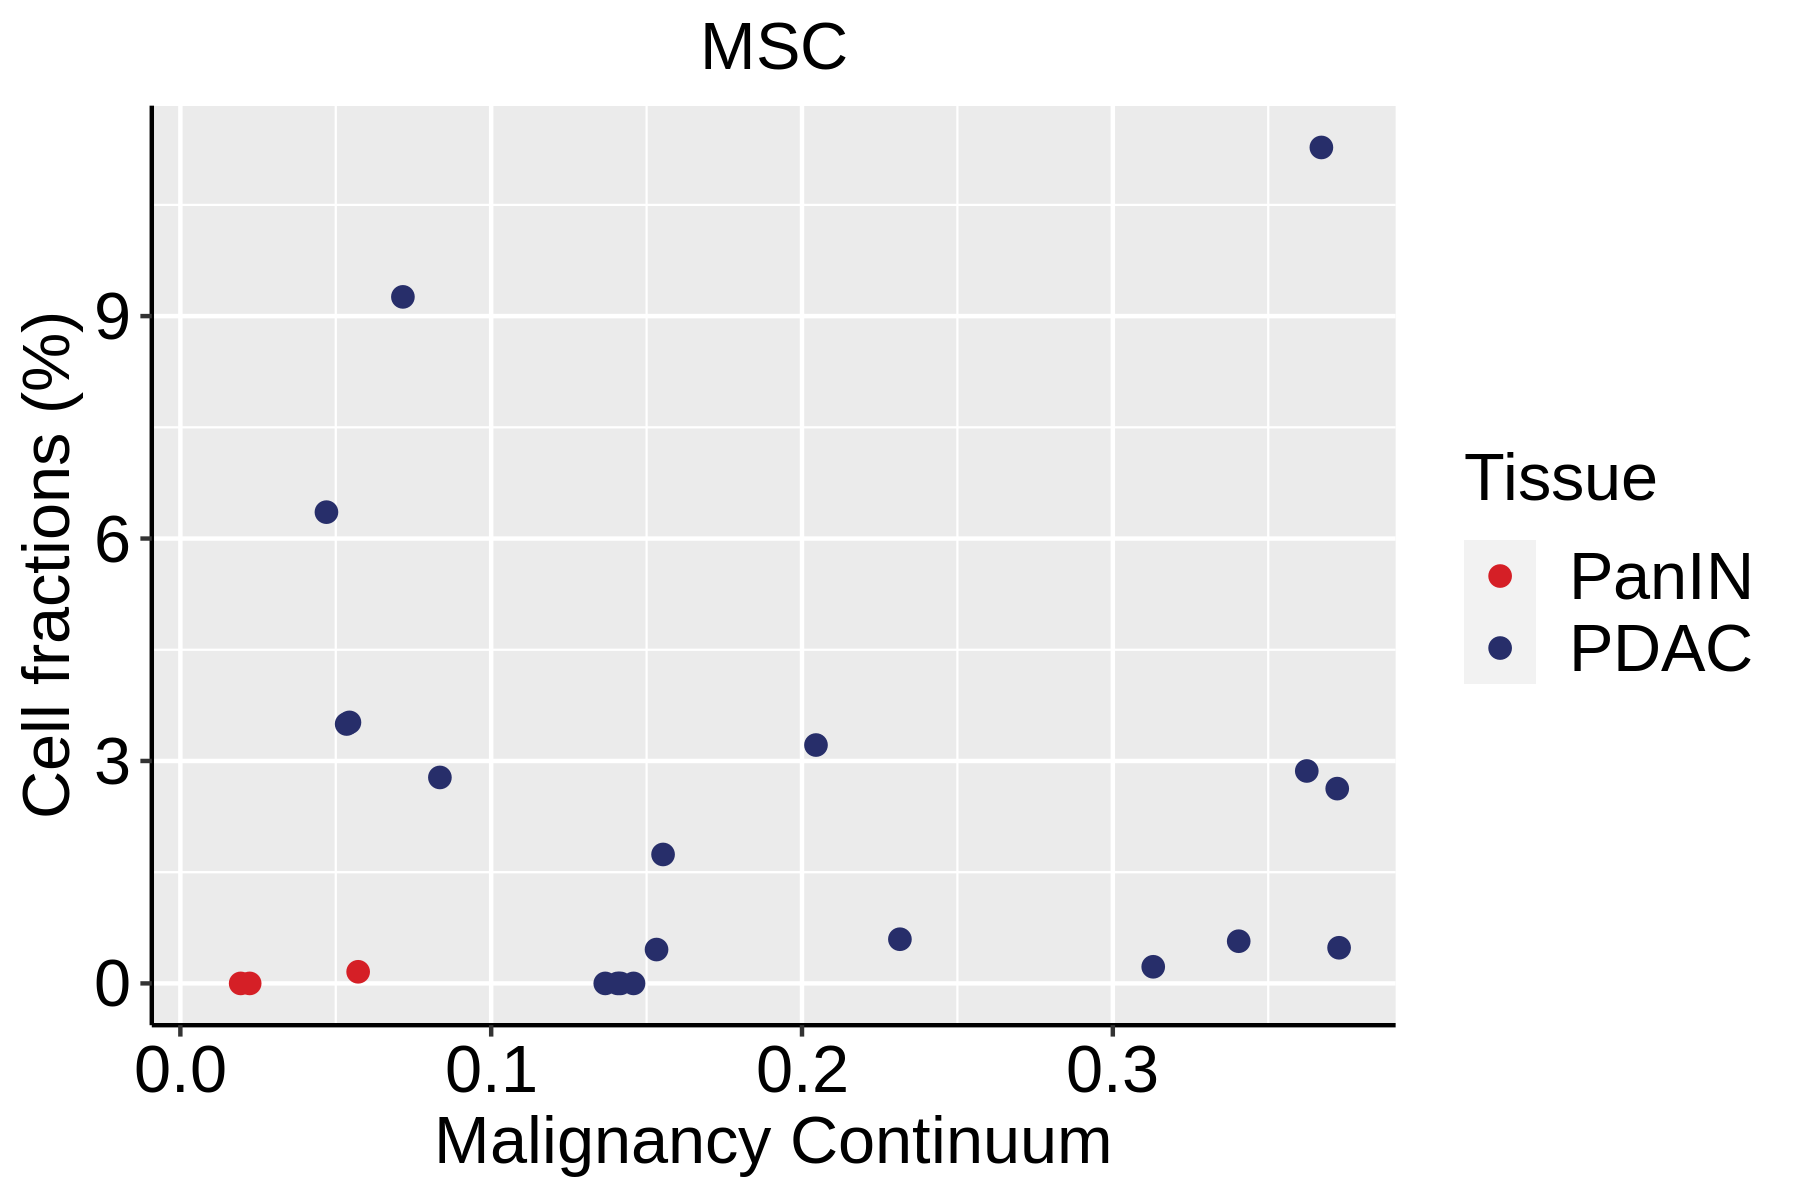 |
 |  |  |
 | 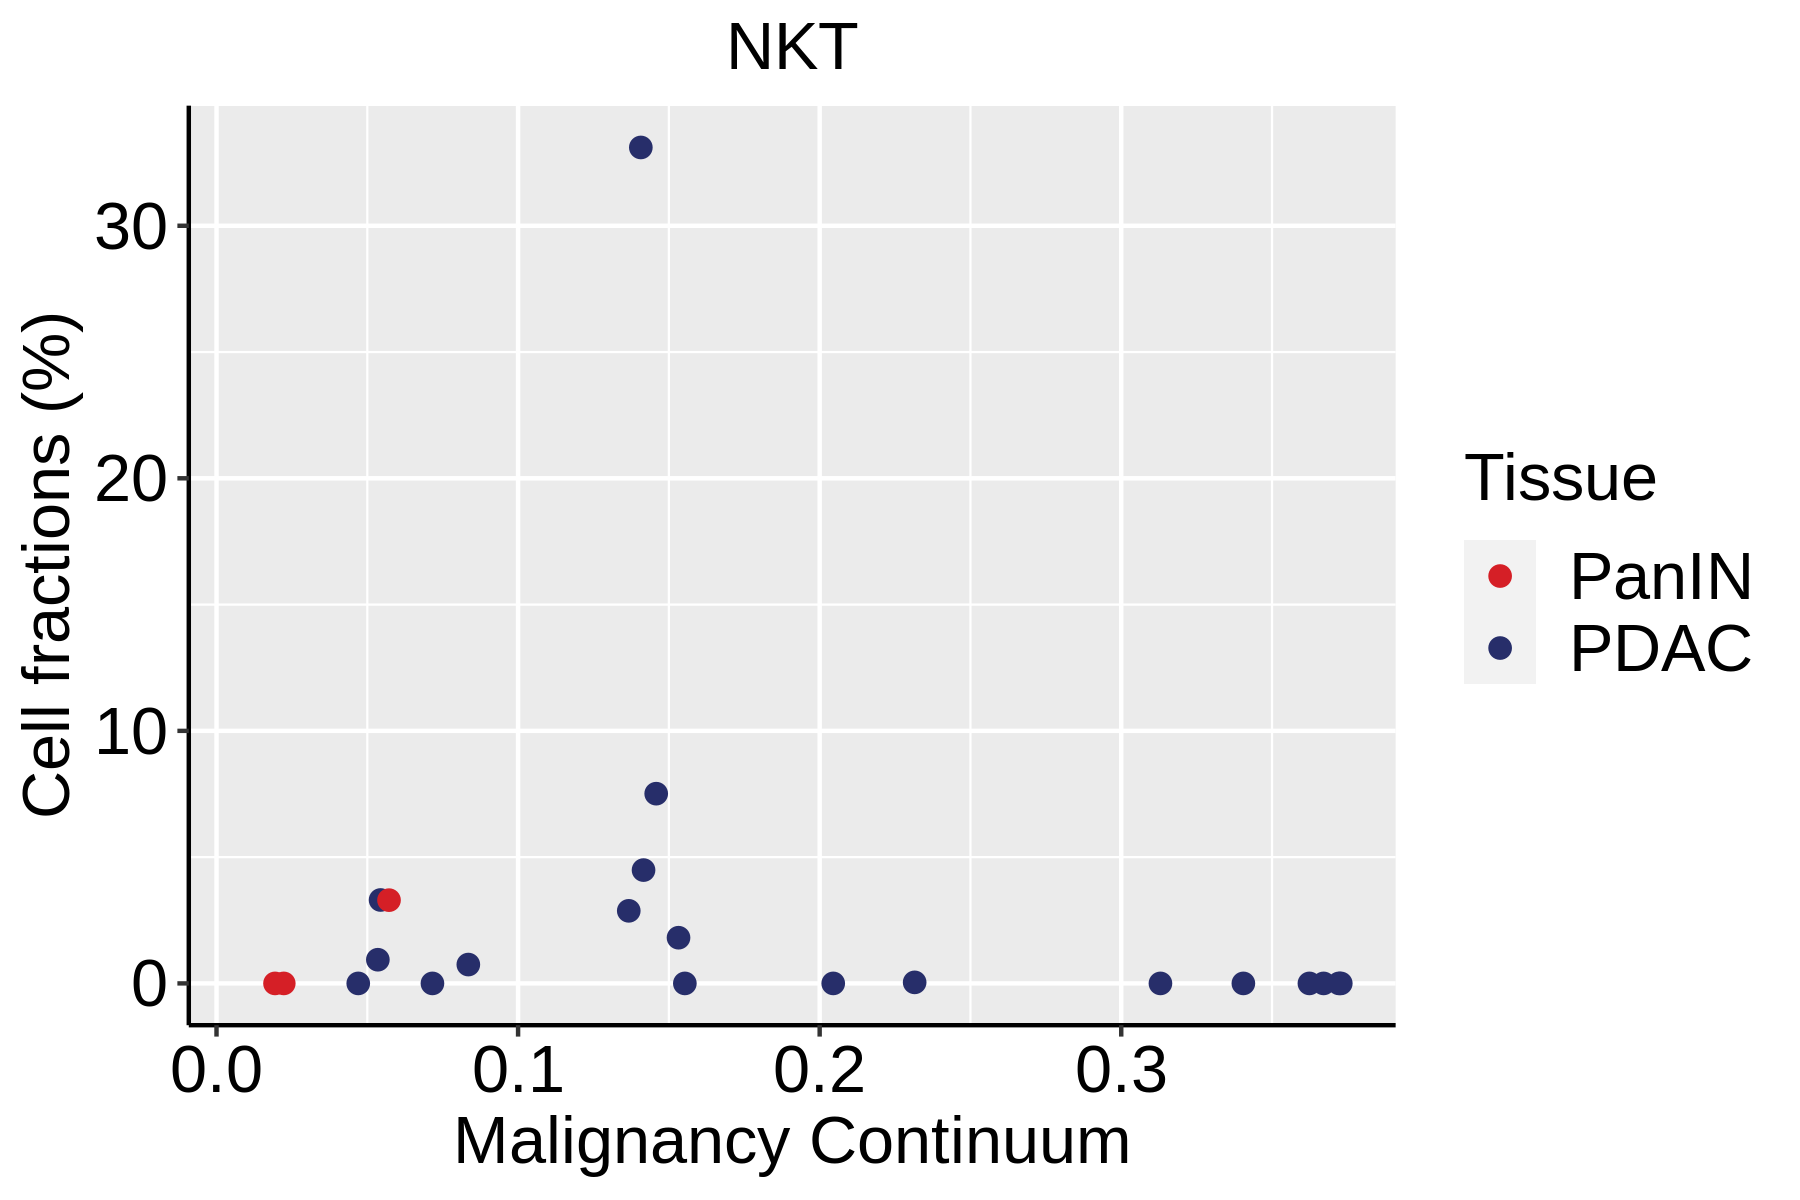 | 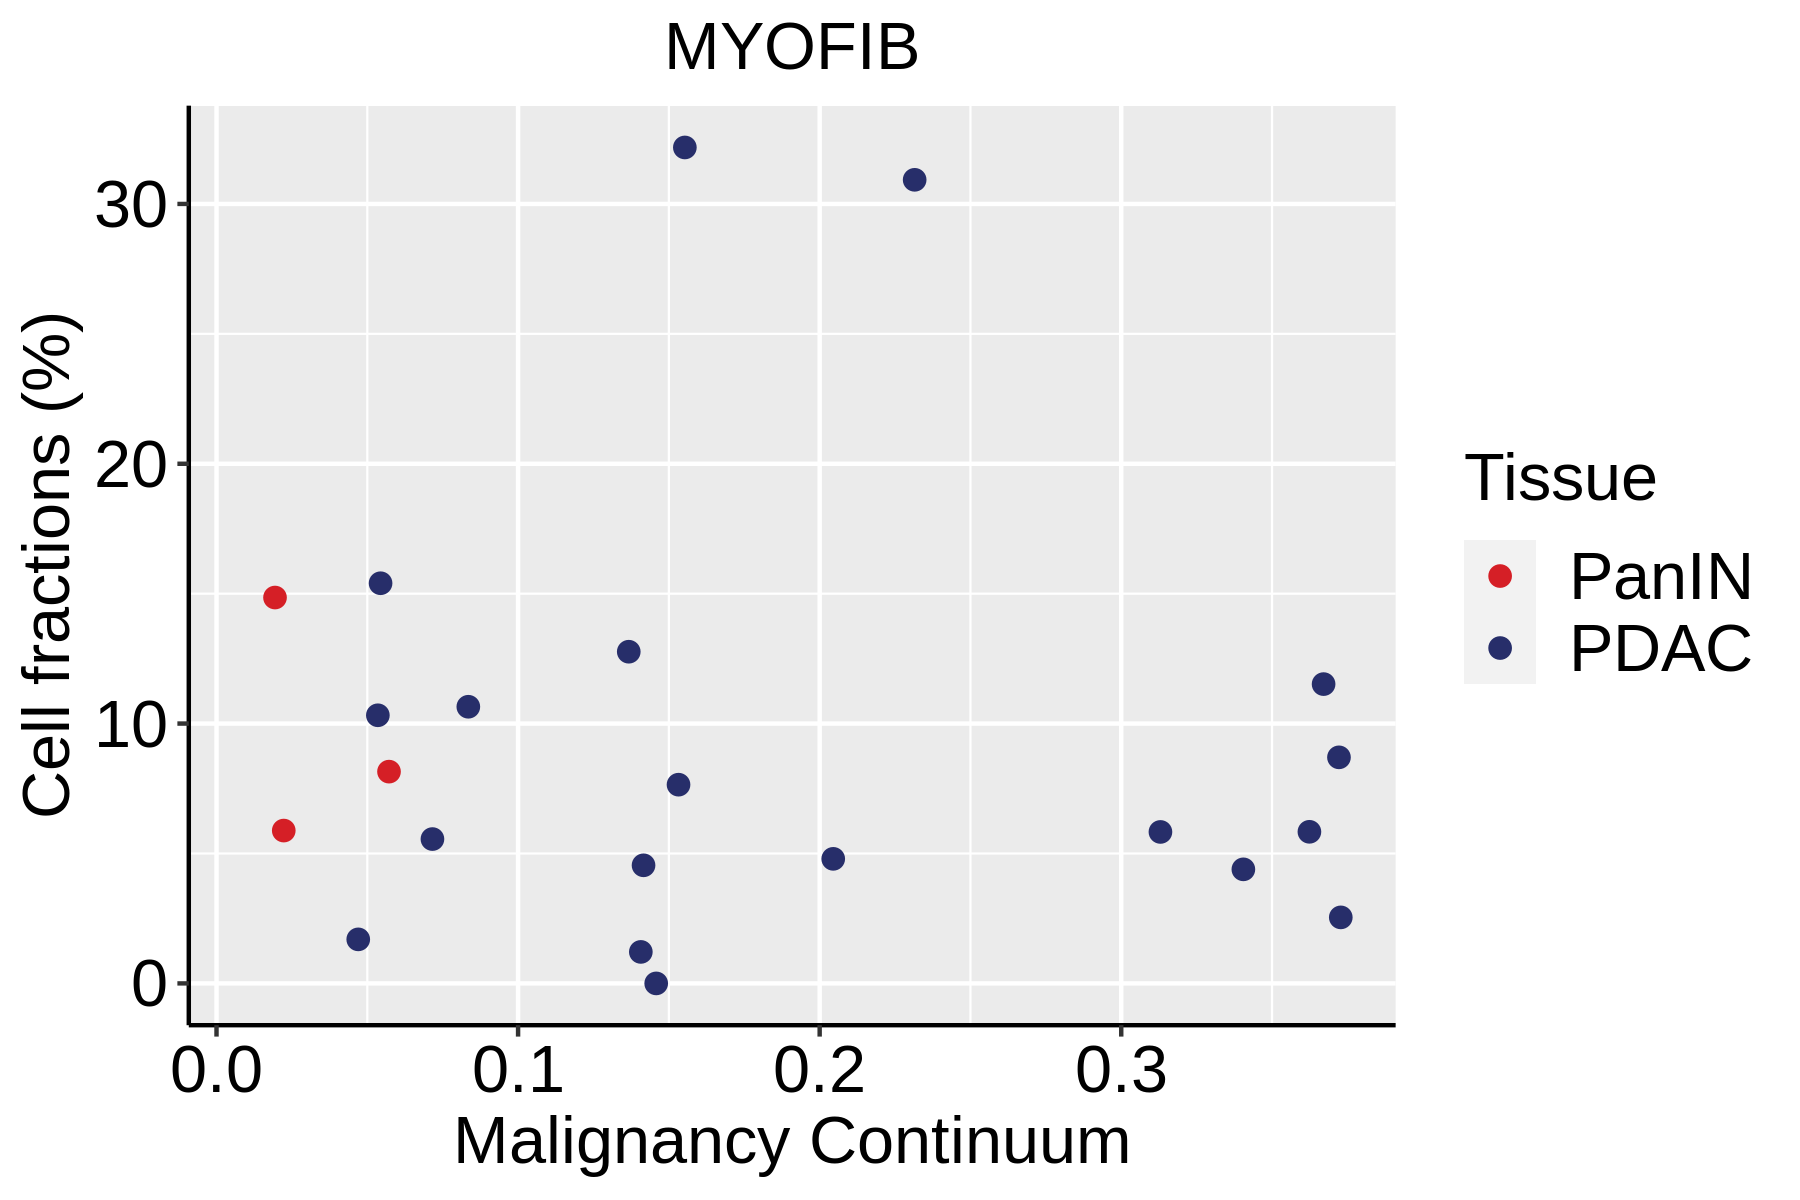 |
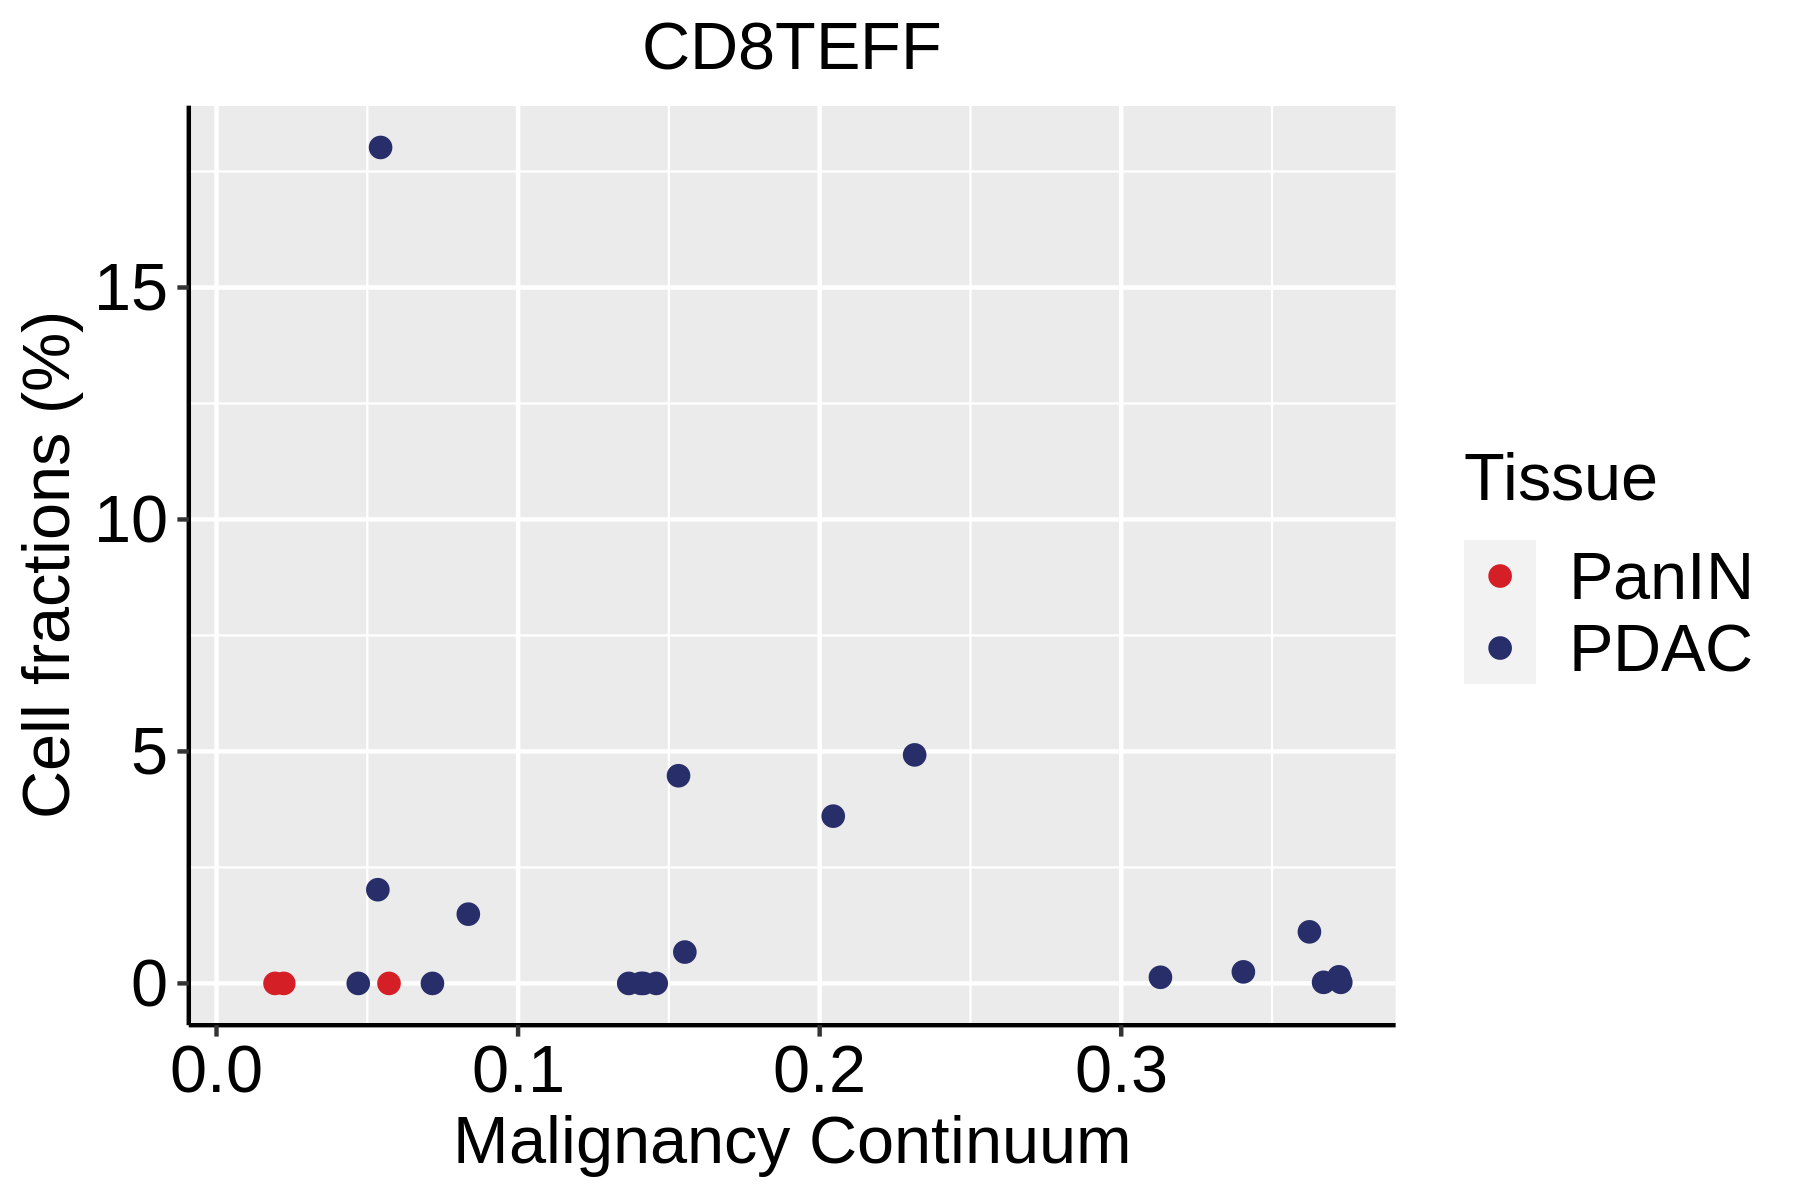 | 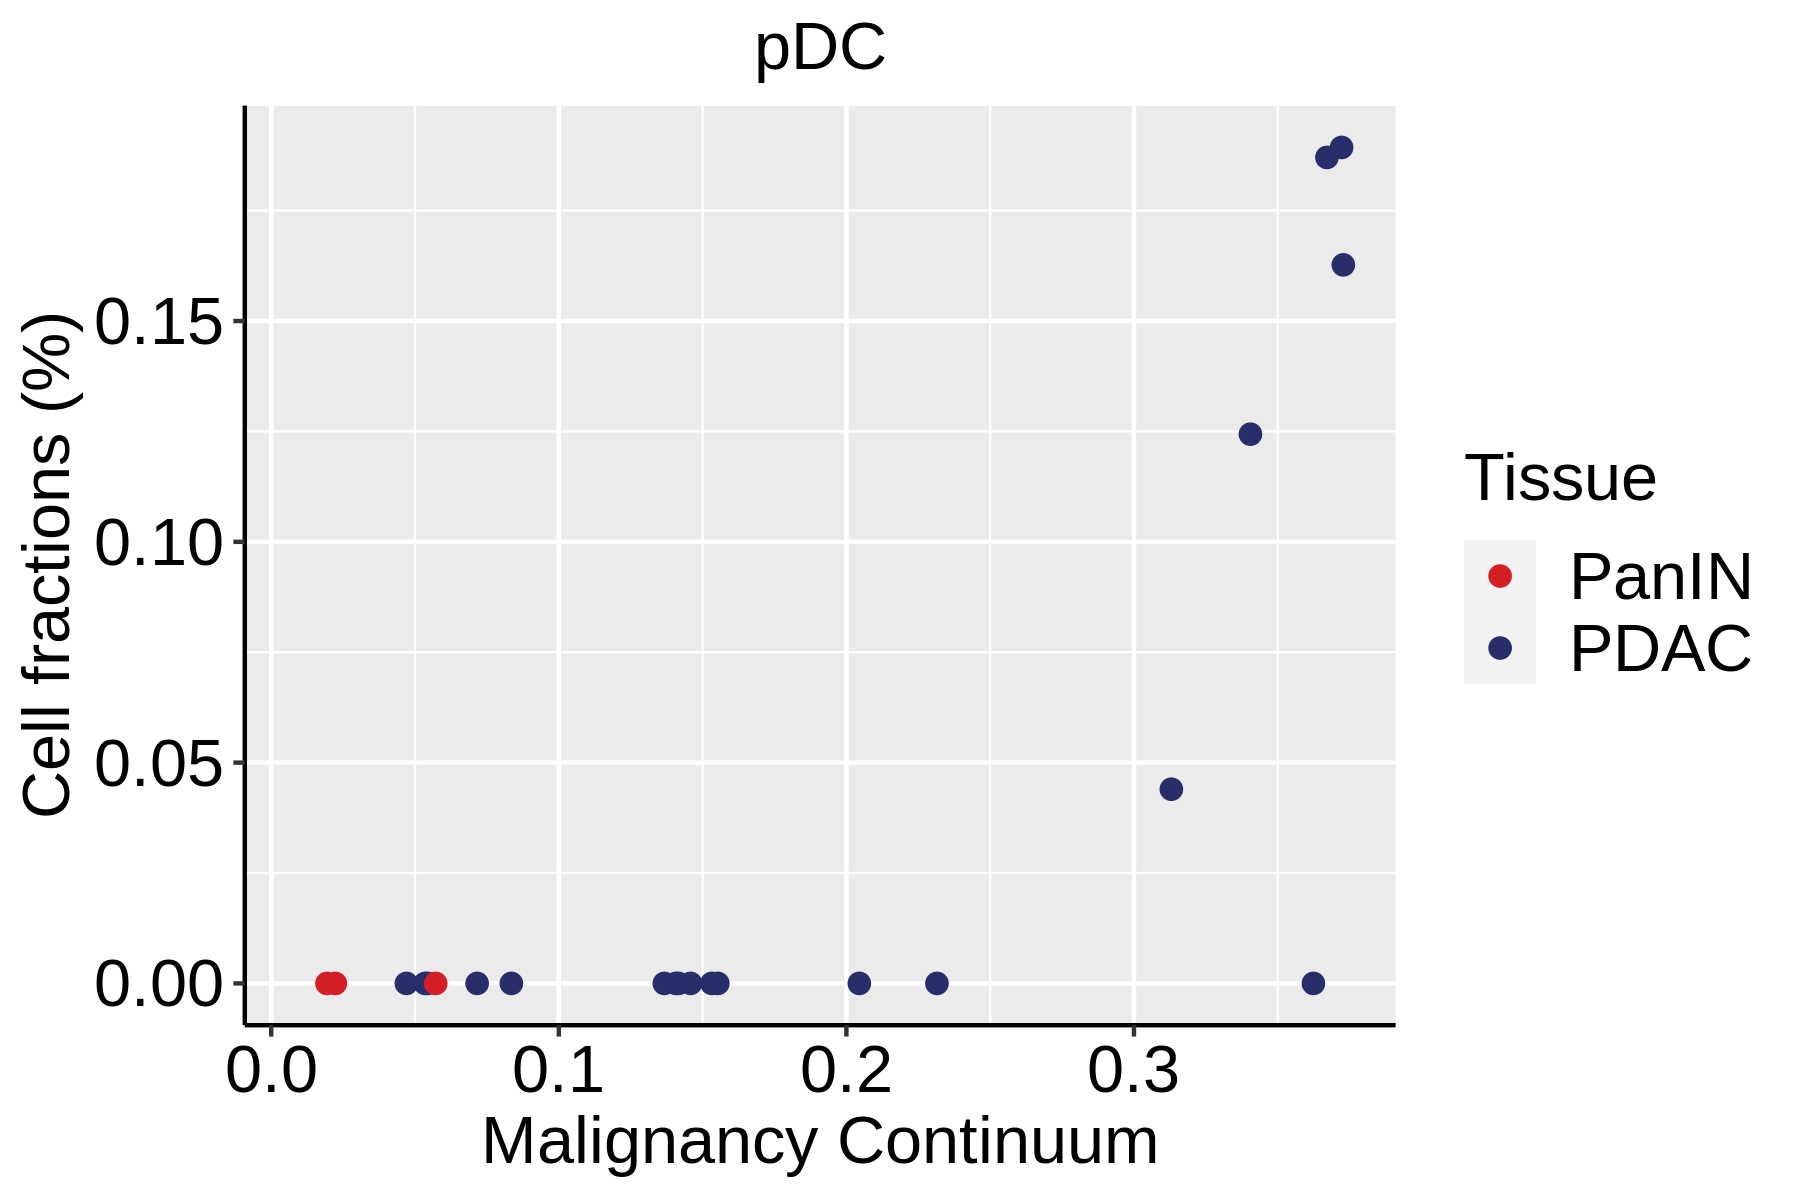 |  |
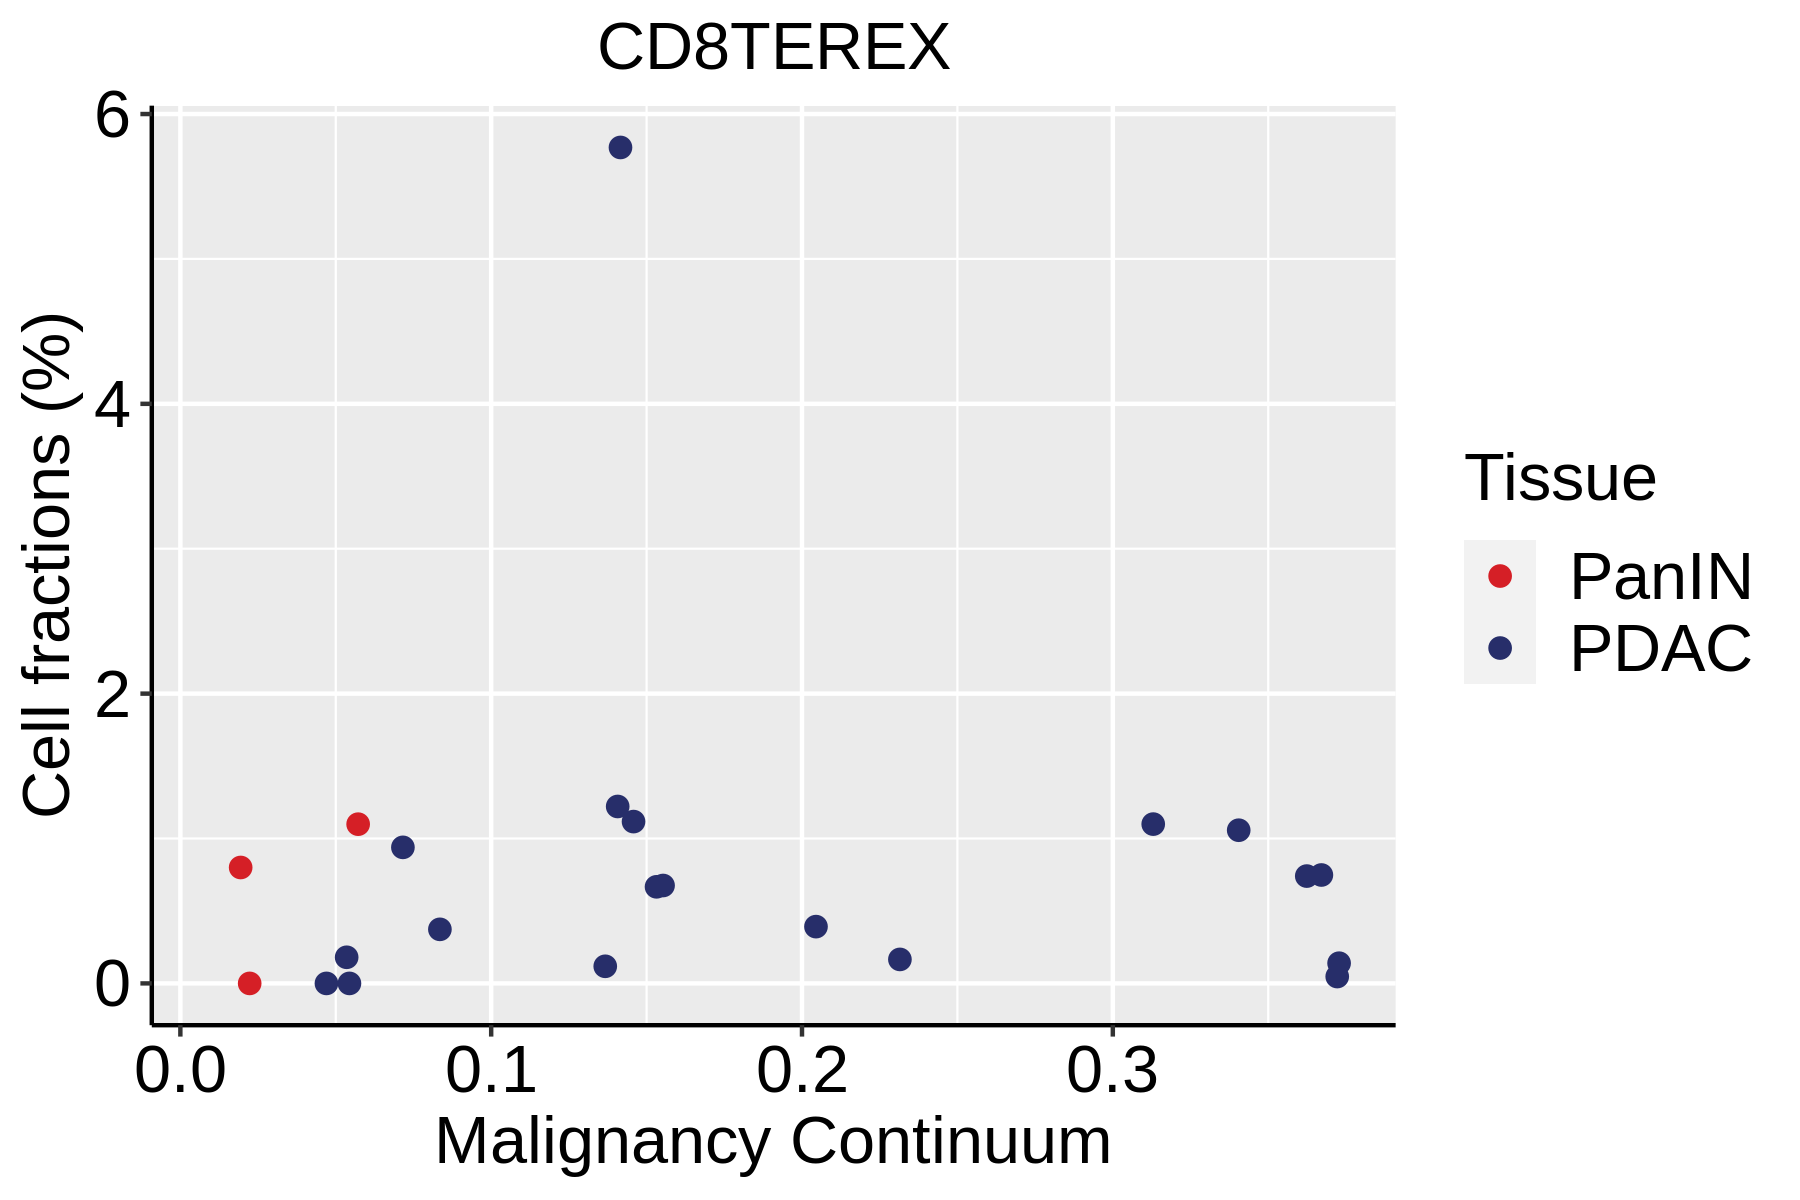 | 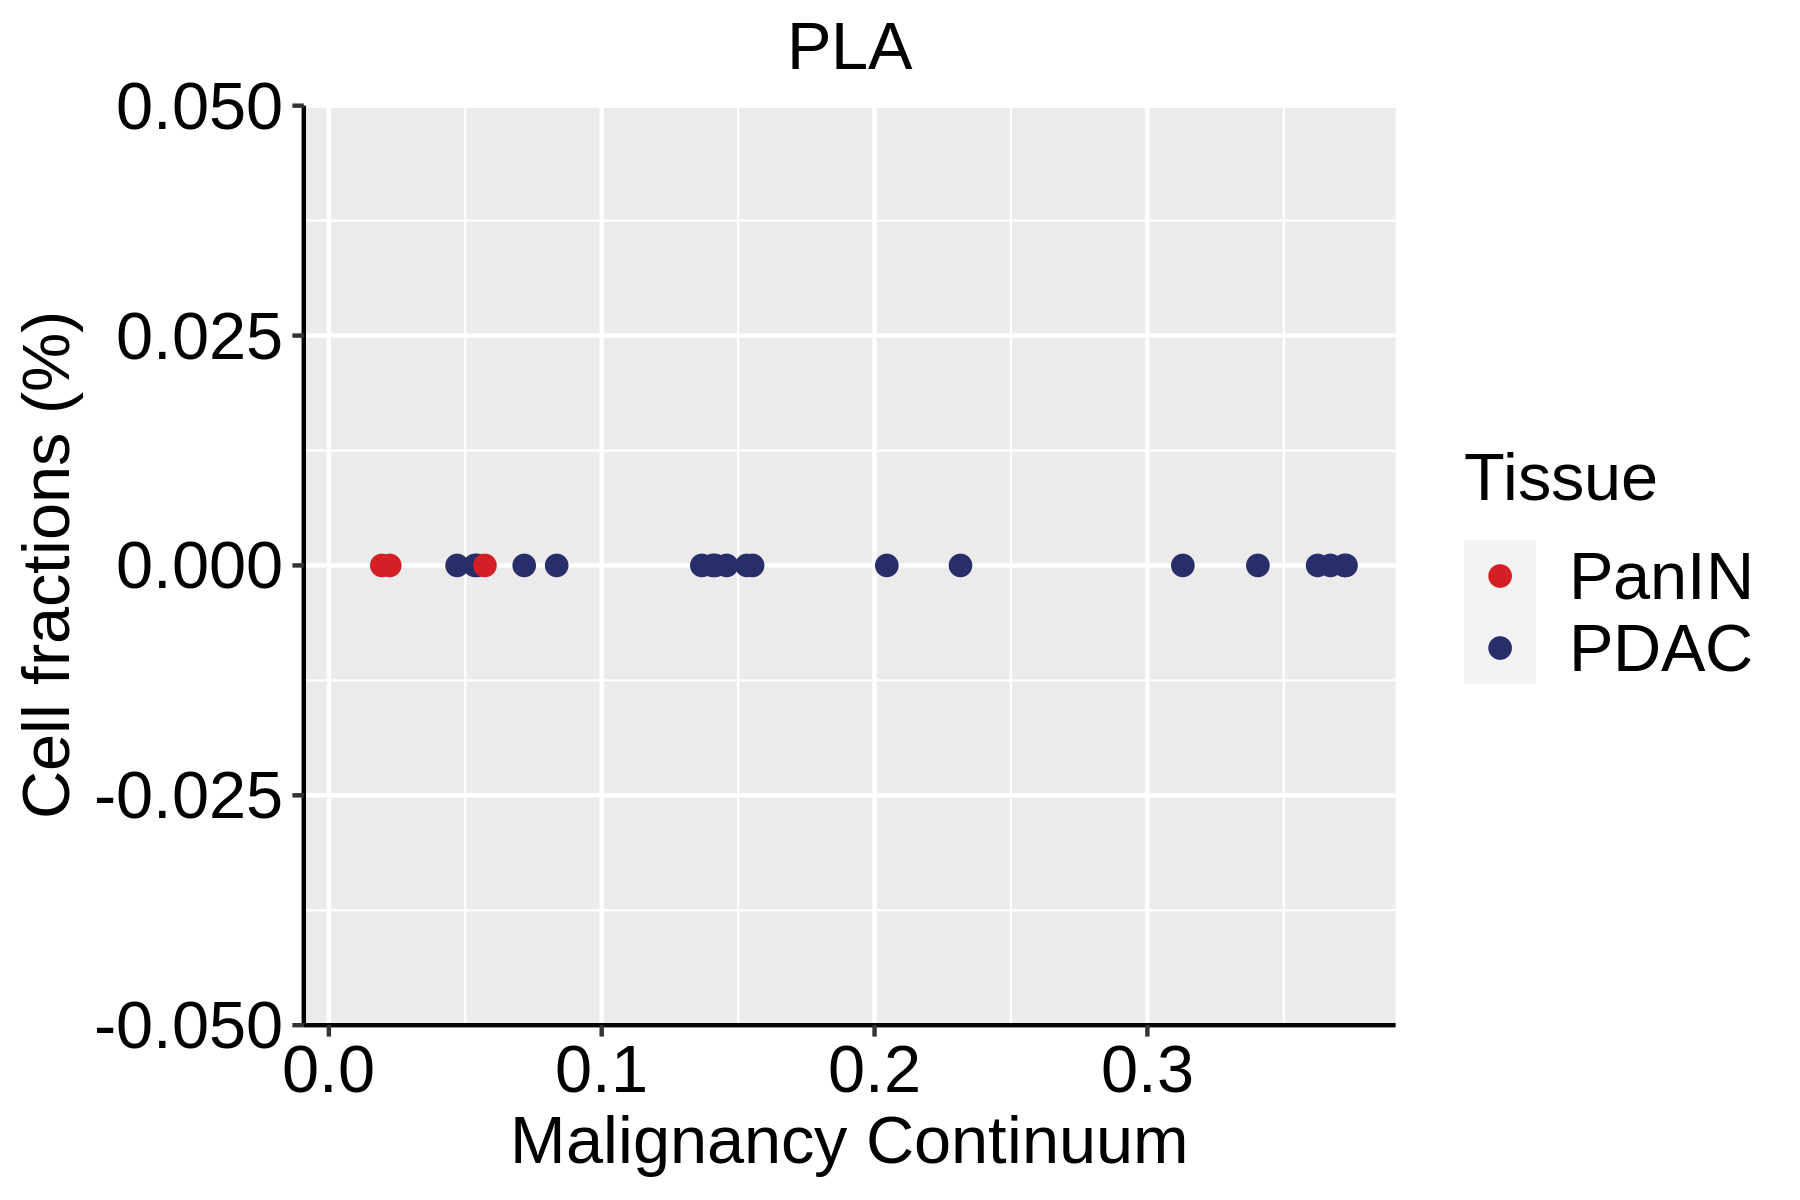 | 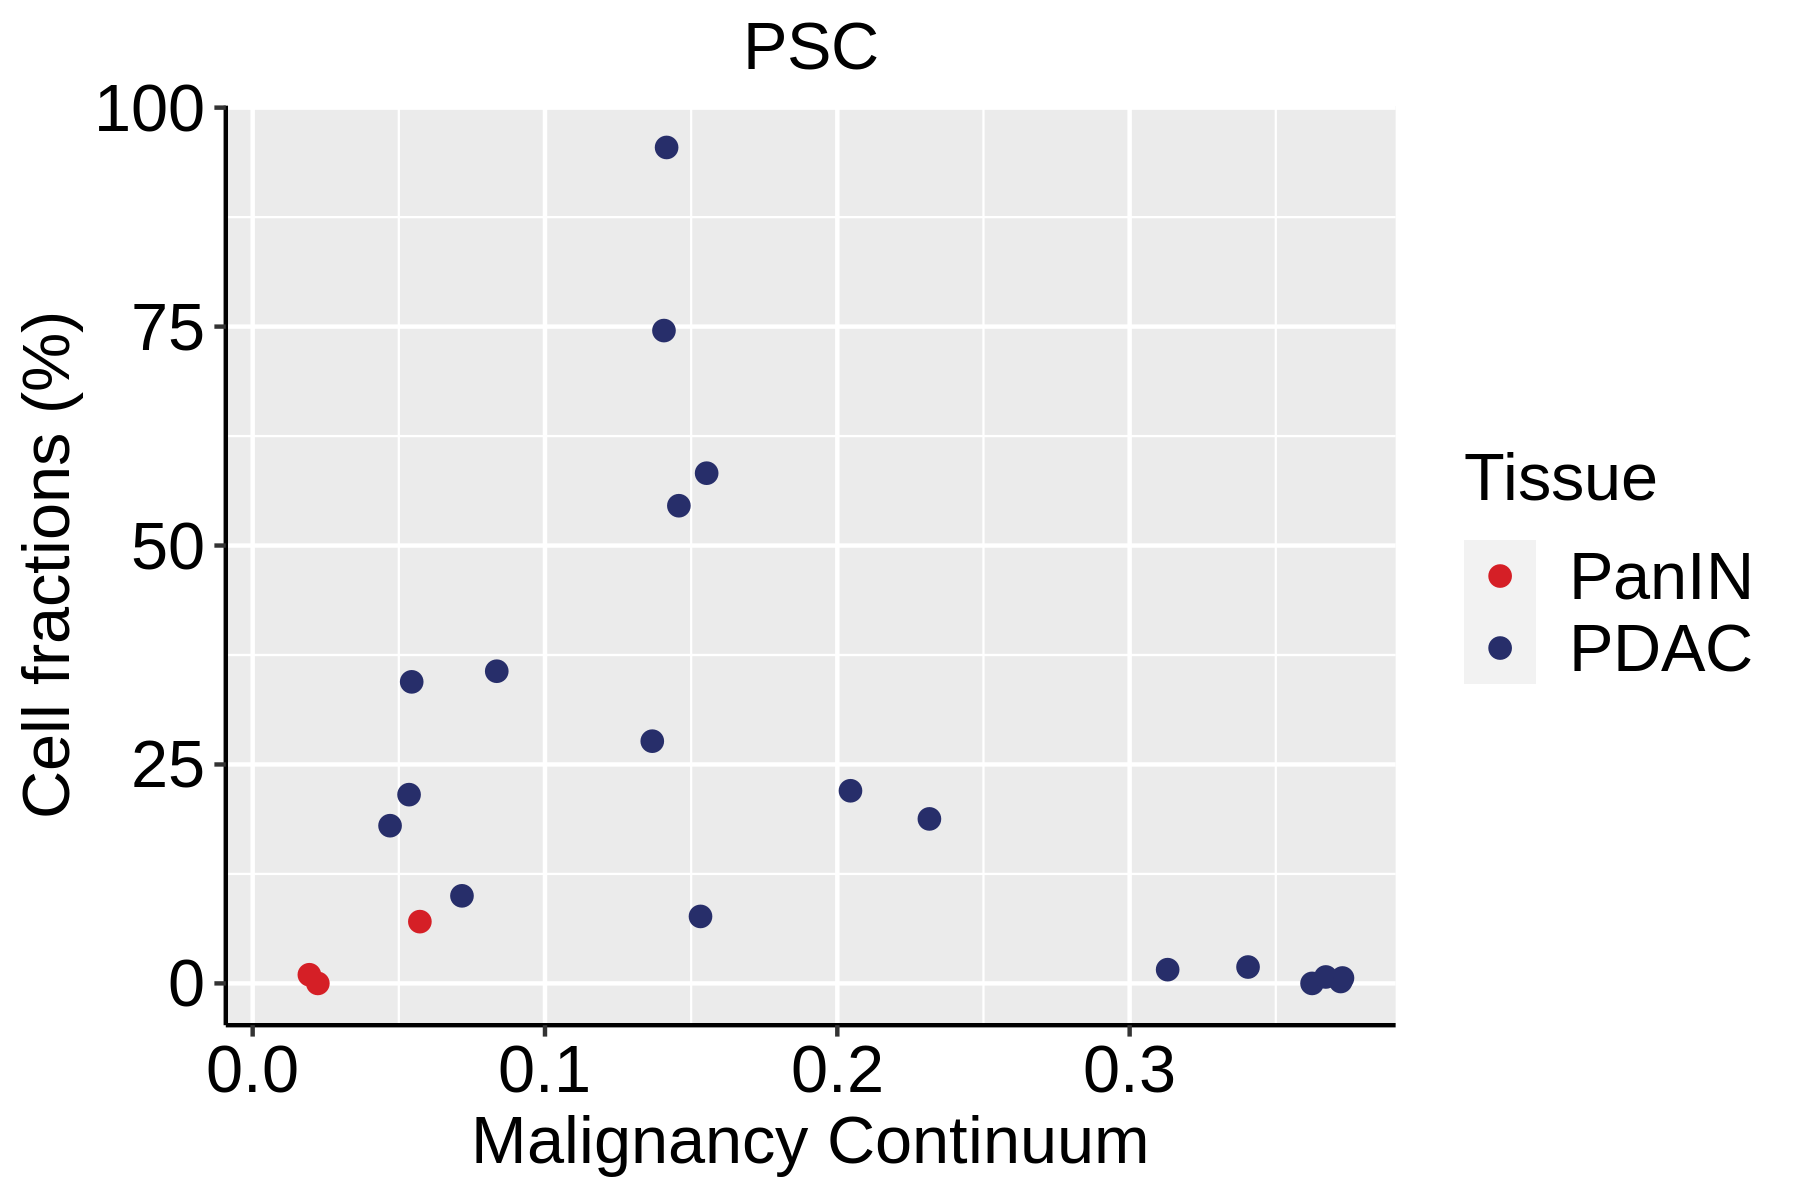 |
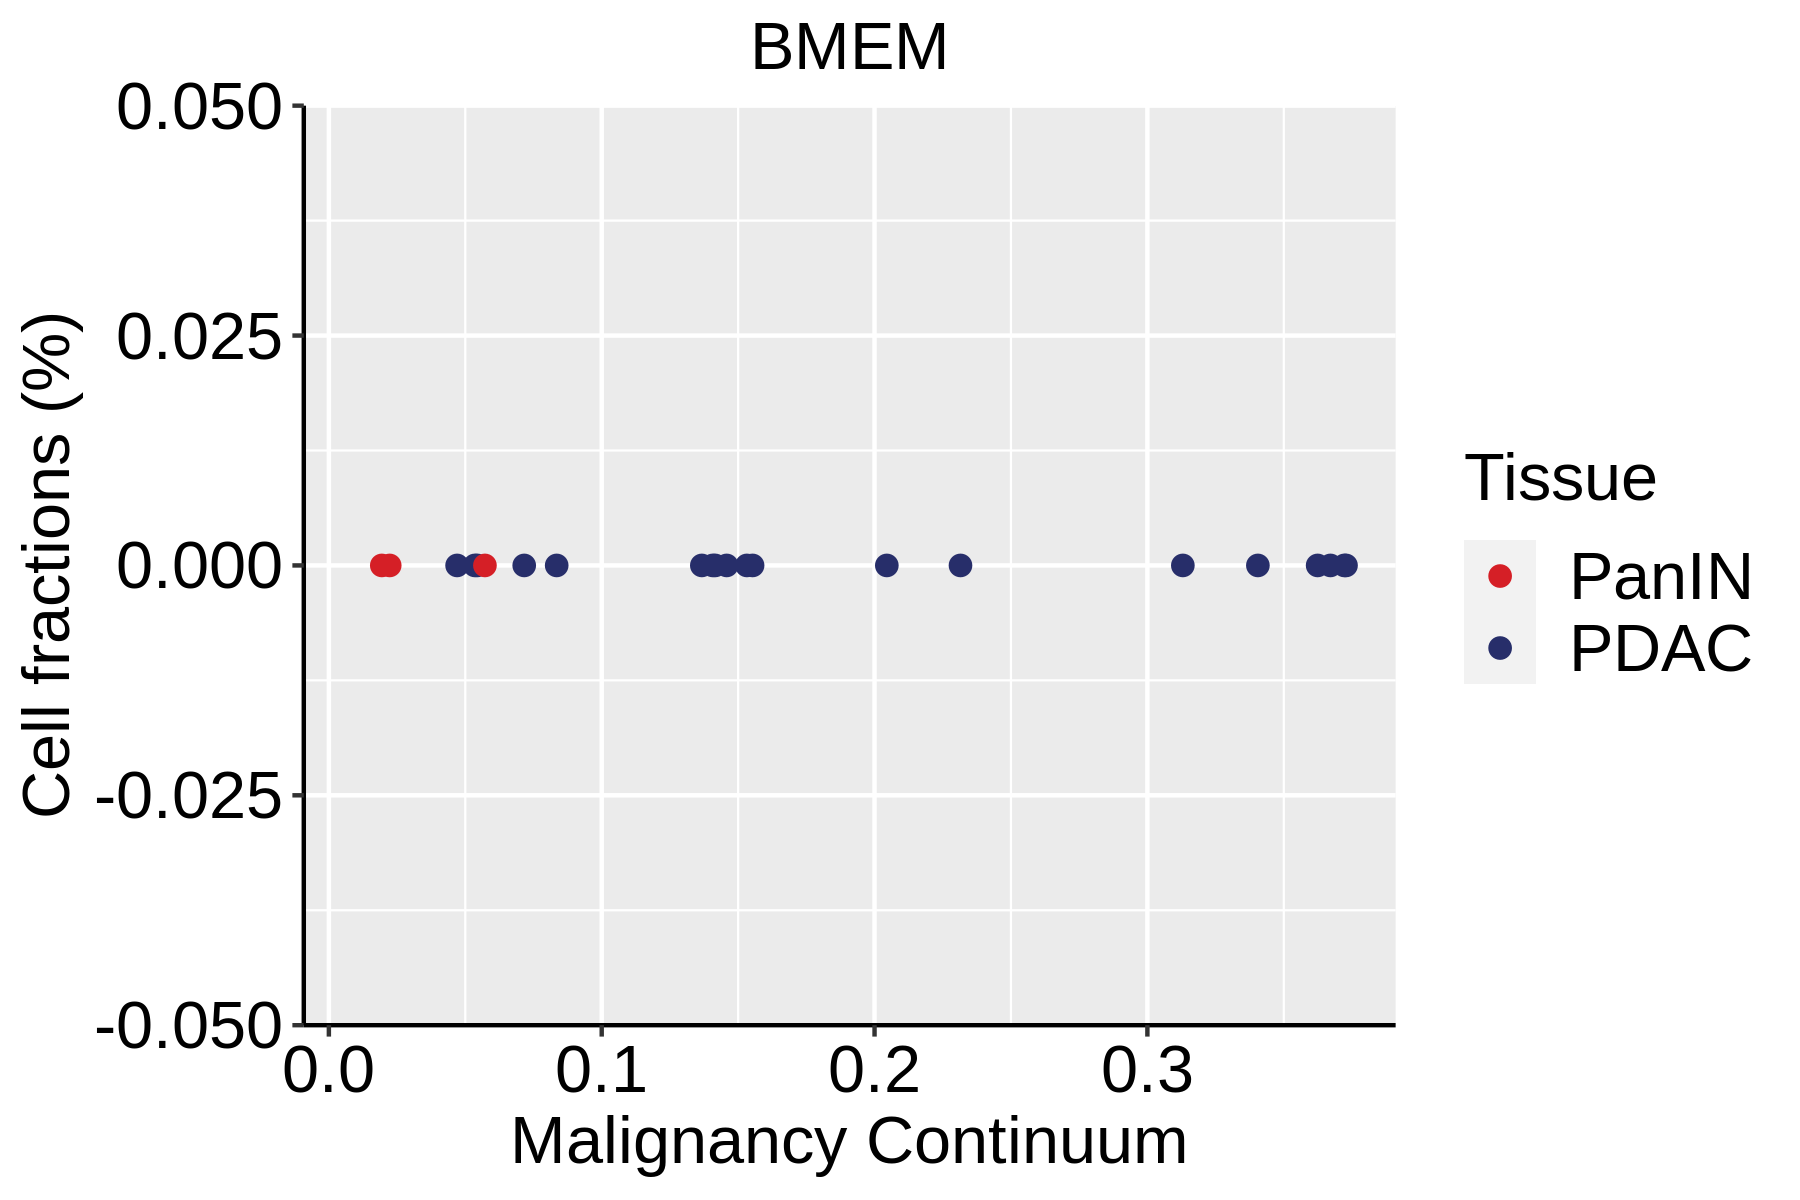
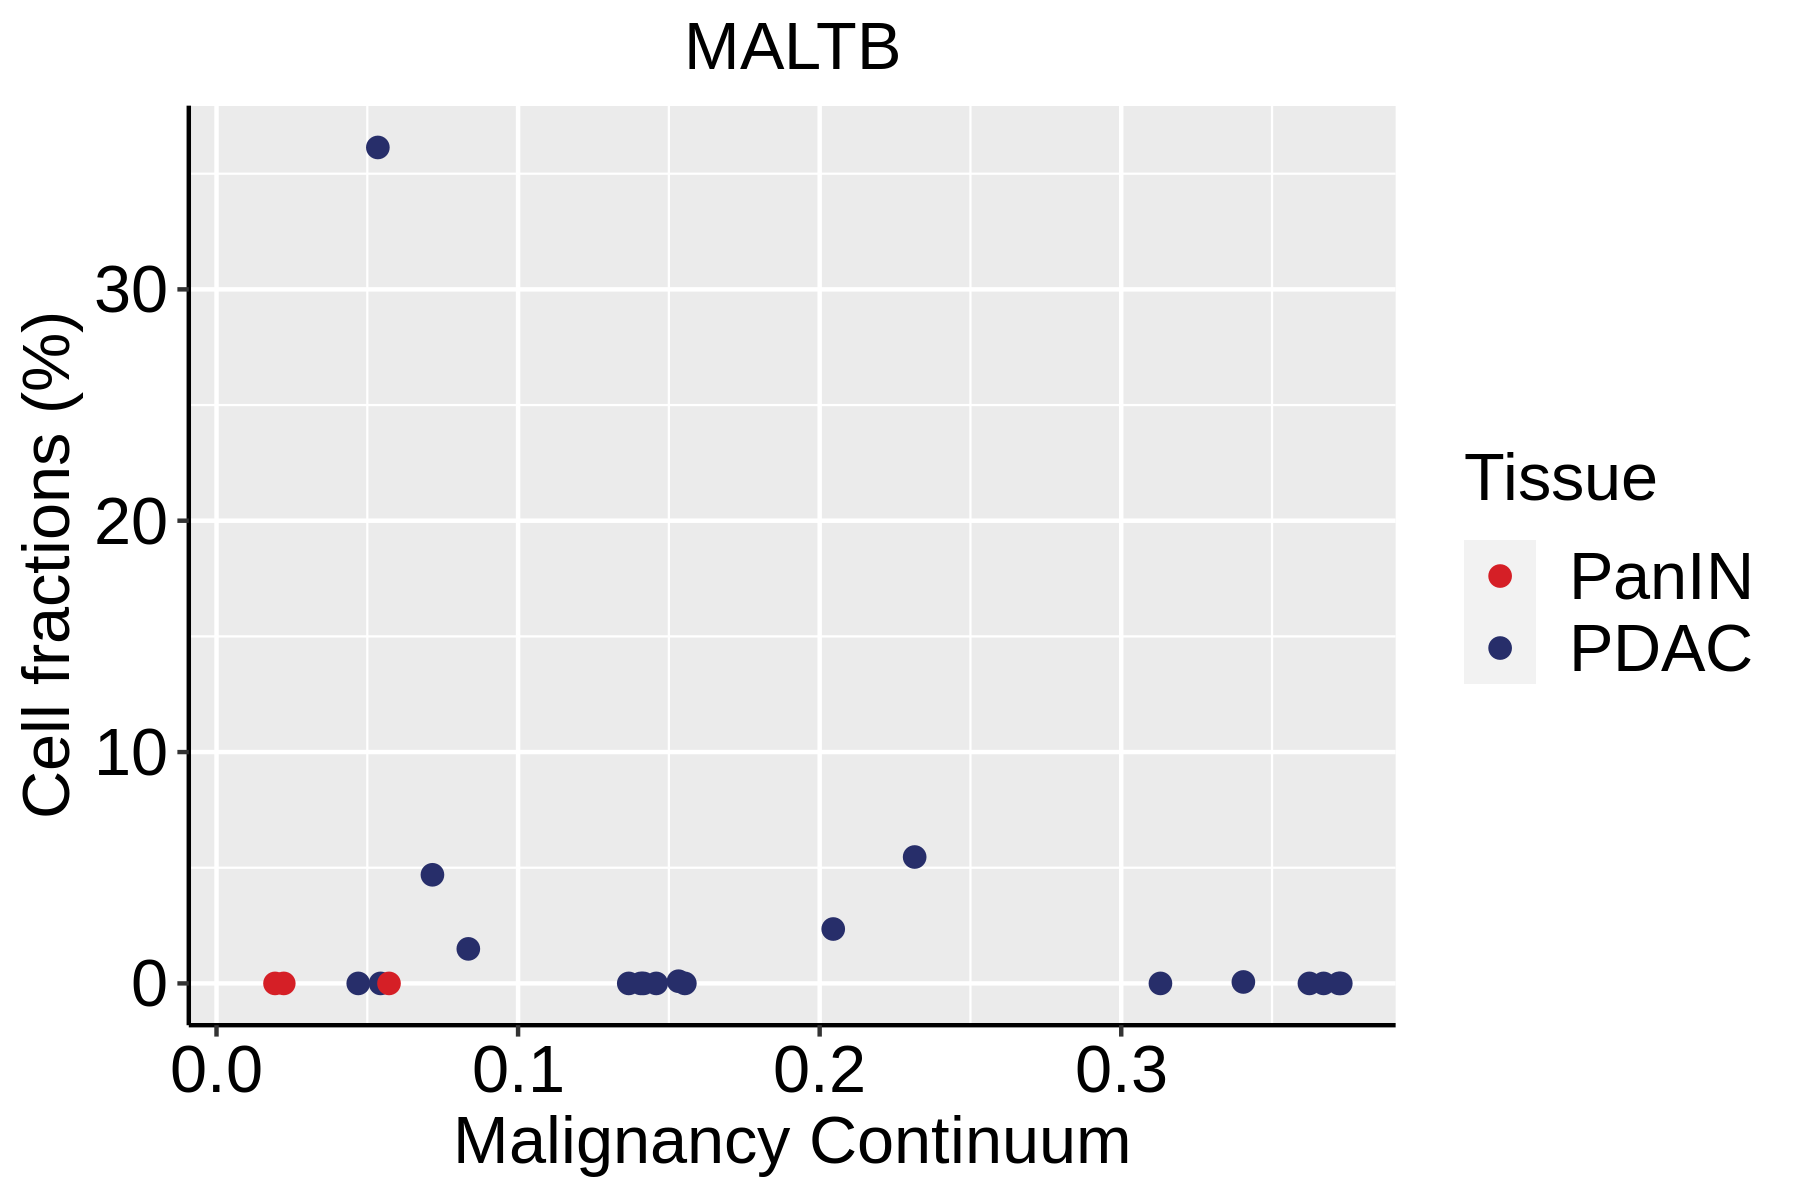
| ∗Fraction of cell type in each scRNA-seq sample plotted against position of the sample in the malignancy continuum for all cell types in Pancreas tissue. Samples are colored based on if they are derived from different Disease States. Cell fractions are computed by dividing the number of cells of a given cell type by the total number of cells in the compartment (epithelial versus immune versus stromal). |
| Page: 1 2 3 |
|