Schematic overview of the cellular and molecular mechanisms involved in the cancer progression, including the proposed cellular and molecular mechanisms in cancer cells trajectory. AT1: alveolar type 1 cells; AT2: alveolar type 2 cells; AAH: atypical adenomatous hyperplasia; AIS: adenocarcinoma in situ; MIA: minimally invasive adenocarcinoma; IA: invasive adenocarcinoma; EMT: epithelial-mesenchymal transition

Home

Download

Statistics

Help

Contact

Center for Computational Systems Medicine
leaf

Tissue samples summary

leaf

Annotation details for different cell compartments

leaf

Cell type statistics by disease state

leaf

Cell type dynamics in malignant transformation

leaf

Cell lineage trajectory inference

leaf

TF regulatory network analysis

leaf

Cell-cell interaction analysis

leaf

Stemness, Senescence, Metaplasia and NeoTCR signature analysis

Tissue: Prostate

Tissue samples summary

check button Cell type statistics by tissue samples.
EpitheliaImmuneStromal
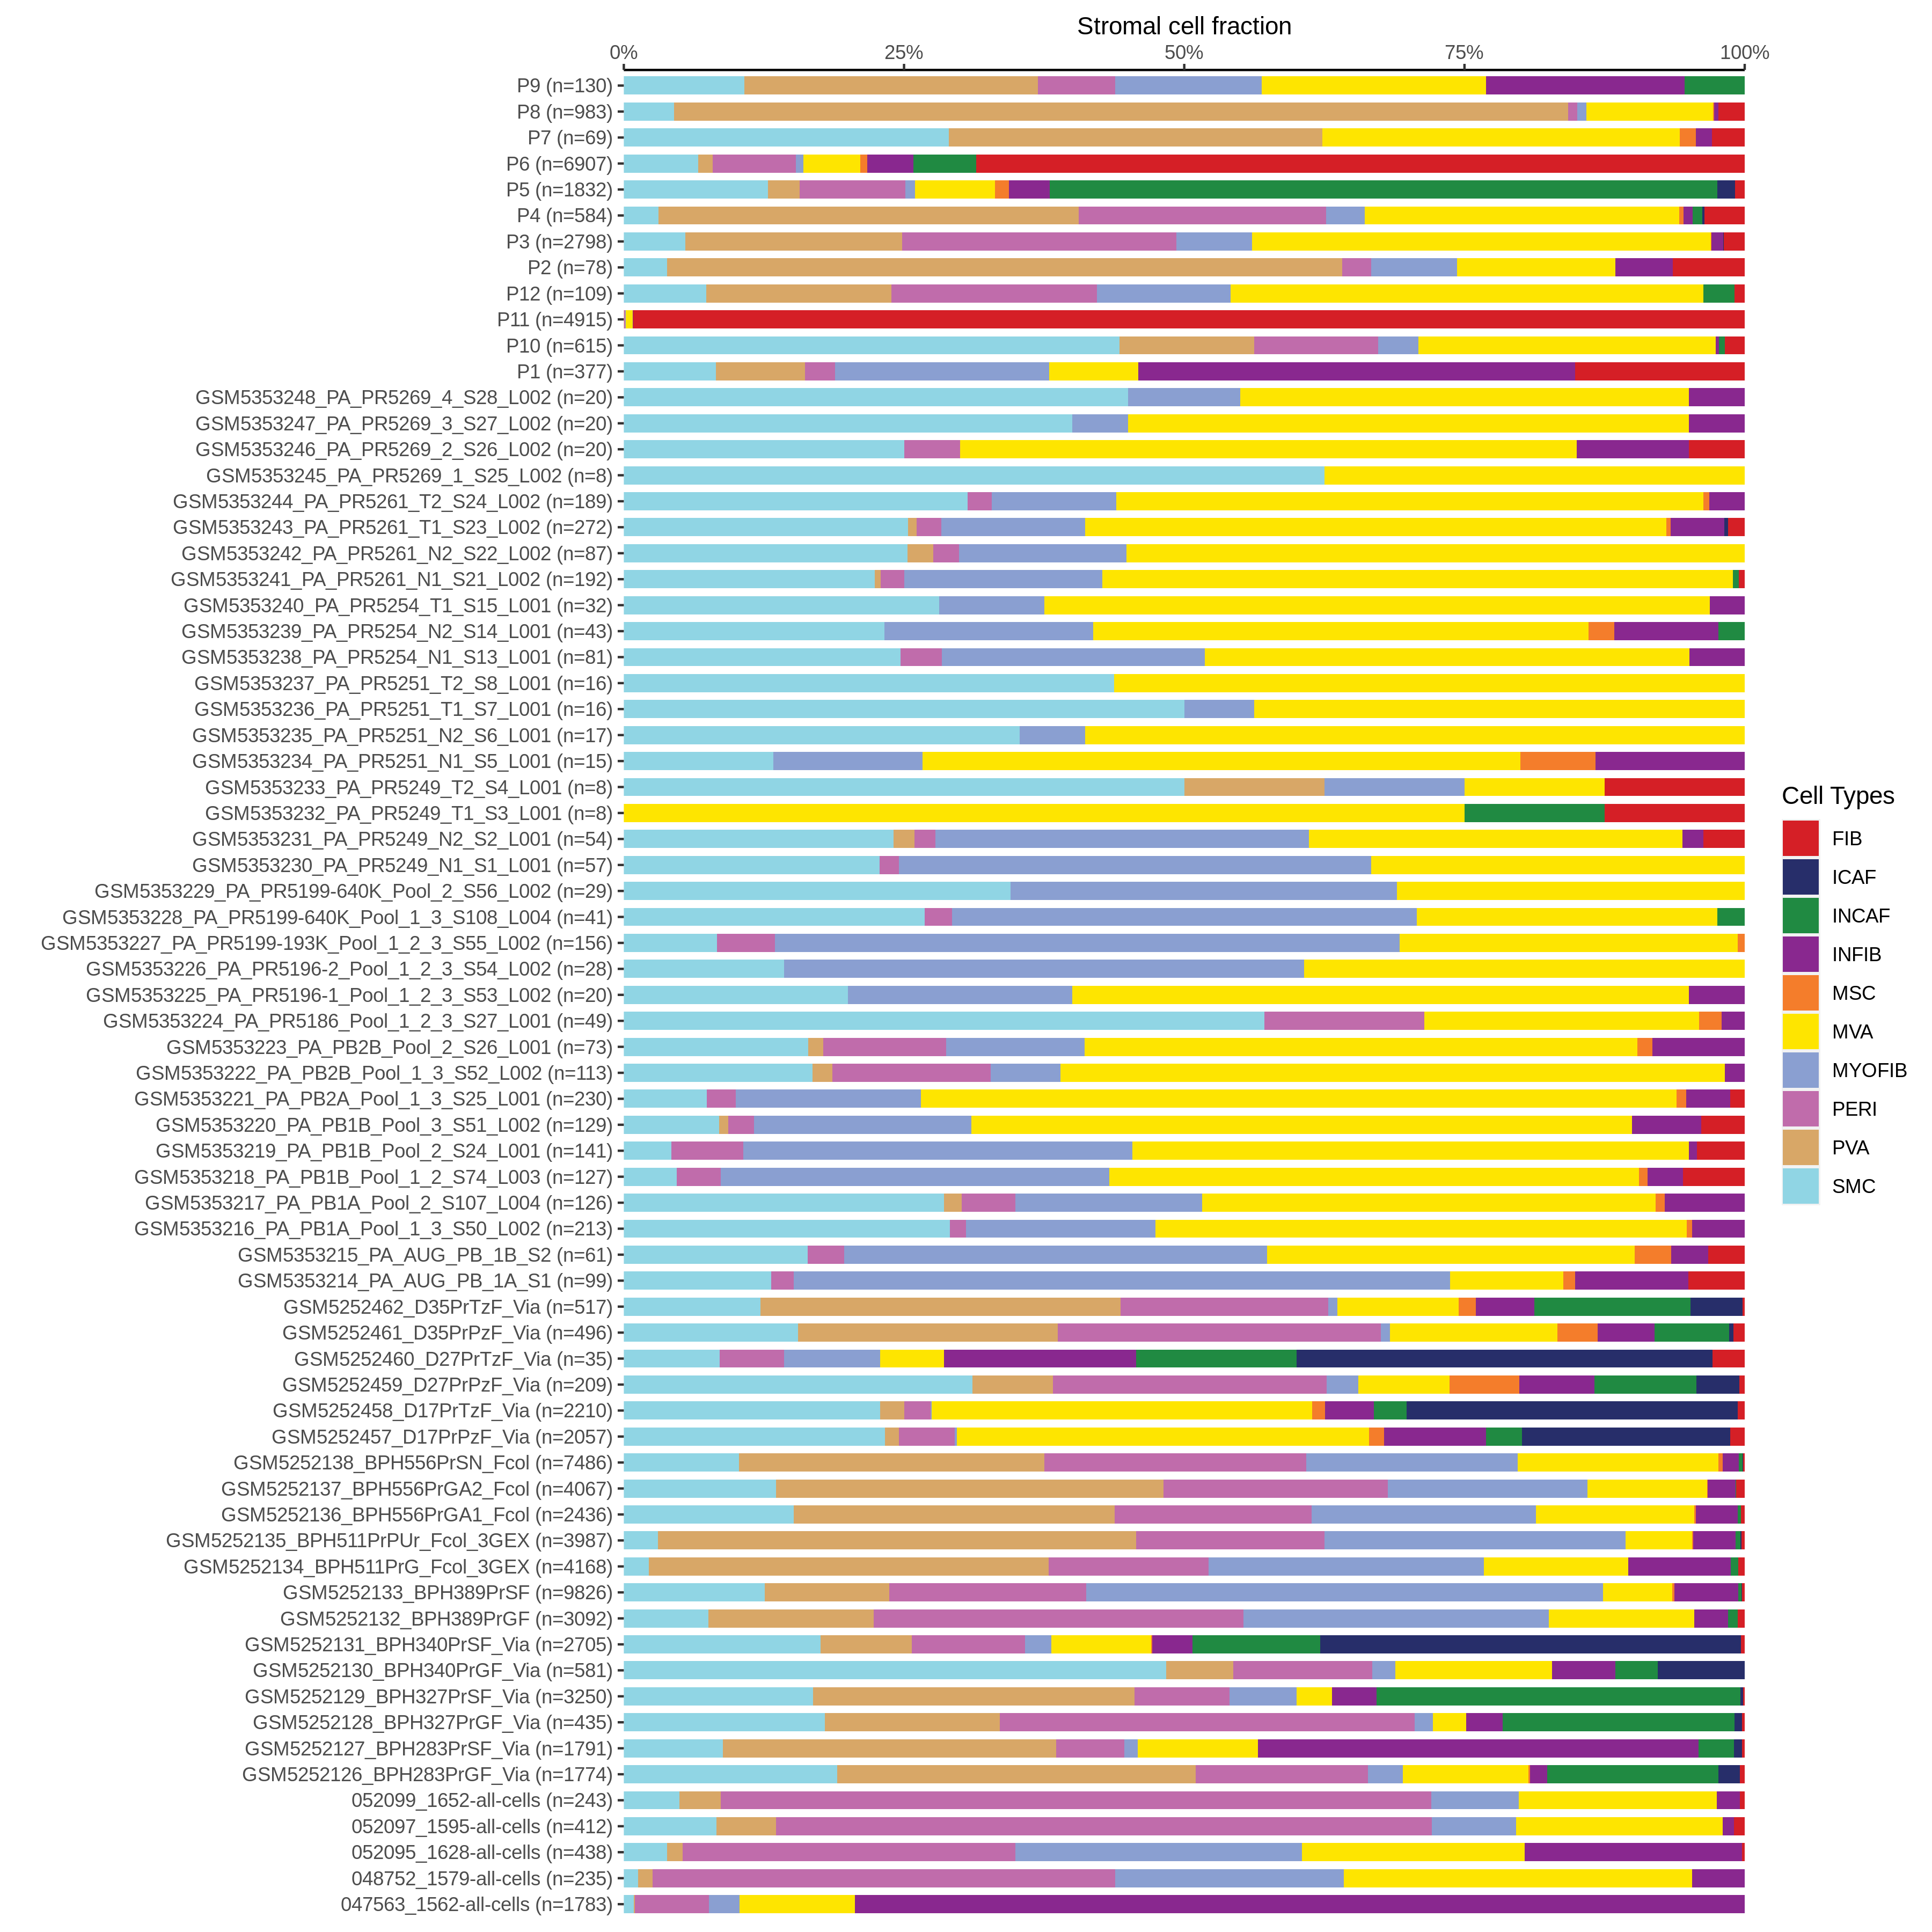
Bar plot representation of the fraction of all Epithelial cells in each sample composed of each cell type for the integrated scRNA-seq datasets of Breast tissues. Each row represents a single sample, with each color representing a different cell type present in the sample.Bar plot representation of the fraction of all Immune cells in each sample composed of each cell type for the integrated scRNA-seq datasets of Breast tissues. Each row represents a single sample, with each color representing a different cell type present in the sample.Bar plot representation of the fraction of all Stromal cells in each sample composed of each cell type for the integrated scRNA-seq datasets of Breast tissues. Each row represents a single sample, with each color representing a different cell type present in the sample.
∗Bar plot representation of the fraction of all Epithelial, Immune and Stromal cells in each sample composed of each cell type for the integrated scRNA-seq datasets of Prostate tissue. Each row represents a single sample, with each color representing a different cell type present in the sample.

check button Tissue summary table.
TissueDisease StateReplicatesEpithelia UMAPPMIDSourcePlatform
ProstateBPHGSM5252126_BPH283PrGF_ViaProjection

34173975

GSE172357

10X Genomics
ProstateBPHGSM5252127_BPH283PrSF_ViaProjection

34173975

GSE172357

10X Genomics
ProstateBPHGSM5252128_BPH327PrGF_ViaProjection

34173975

GSE172357

10X Genomics
ProstateBPHGSM5252129_BPH327PrSF_ViaProjection

34173975

GSE172357

10X Genomics
ProstateBPHGSM5252130_BPH340PrGF_ViaProjection

34173975

GSE172357

10X Genomics
ProstateBPHGSM5252131_BPH340PrSF_ViaProjection

34173975

GSE172357

10X Genomics
ProstateBPHGSM5252132_BPH389PrGFProjection

34173975

GSE172357

10X Genomics
ProstateBPHGSM5252133_BPH389PrSFProjection

34173975

GSE172357

10X Genomics
ProstateBPHGSM5252134_BPH511PrG_Fcol_3GEXProjection

34173975

GSE172357

10X Genomics
ProstateBPHGSM5252135_BPH511PrPUr_Fcol_3GEXProjection

34173975

GSE172357

10X Genomics
ProstateBPHGSM5252136_BPH556PrGA1_FcolProjection

34173975

GSE172357

10X Genomics
ProstateBPHGSM5252137_BPH556PrGA2_FcolProjection

34173975

GSE172357

10X Genomics
ProstateBPHGSM5252138_BPH556PrSN_FcolProjection

34173975

GSE172357

10X Genomics
ProstateBPH047563_1562-all-cellsProjection

35440548

GSE183676

10X Genomics
ProstateBPH048752_1579-all-cellsProjection

35440548

GSE183676

10X Genomics
ProstateBPH052095_1628-all-cellsProjection

35440548

GSE183676

10X Genomics
ProstateBPH052097_1595-all-cellsProjection

35440548

GSE183676

10X Genomics
ProstateBPH052099_1652-all-cellsProjection

35440548

GSE183676

10X Genomics
ProstatePRADDong_P1Projection

33328604

GSE137829

10X Genomics
ProstatePRADDong_P2Projection

33328604

GSE137829

10X Genomics
∗Projection of epithelial scRNA-seq cells from Prostate diseased tissue samples into the manifold of normal tissue epithelial cells. Projected cells are colored by nearest normal cells in the projection and normal epithelial cells are colored gray.
Page: 1 2 3 4 

Top

Annotation details for different cell compartments

check button Single-cell atlas of expresion.
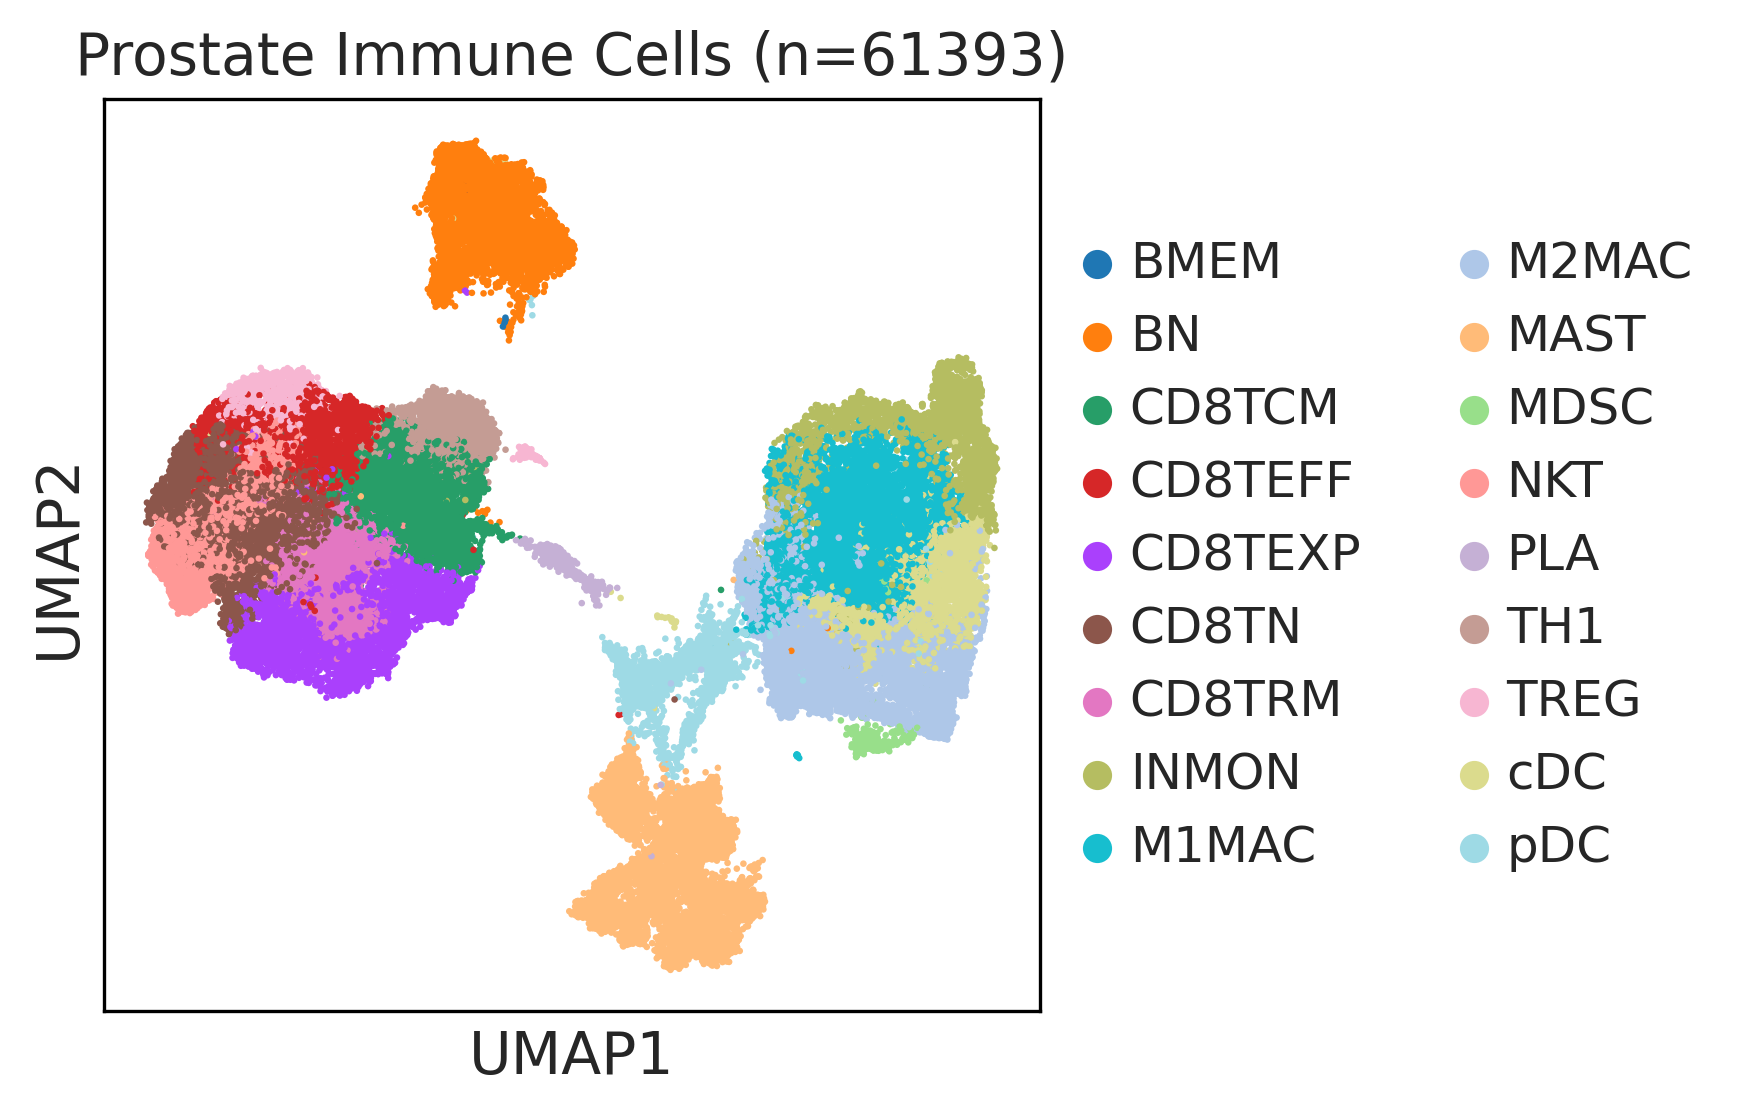
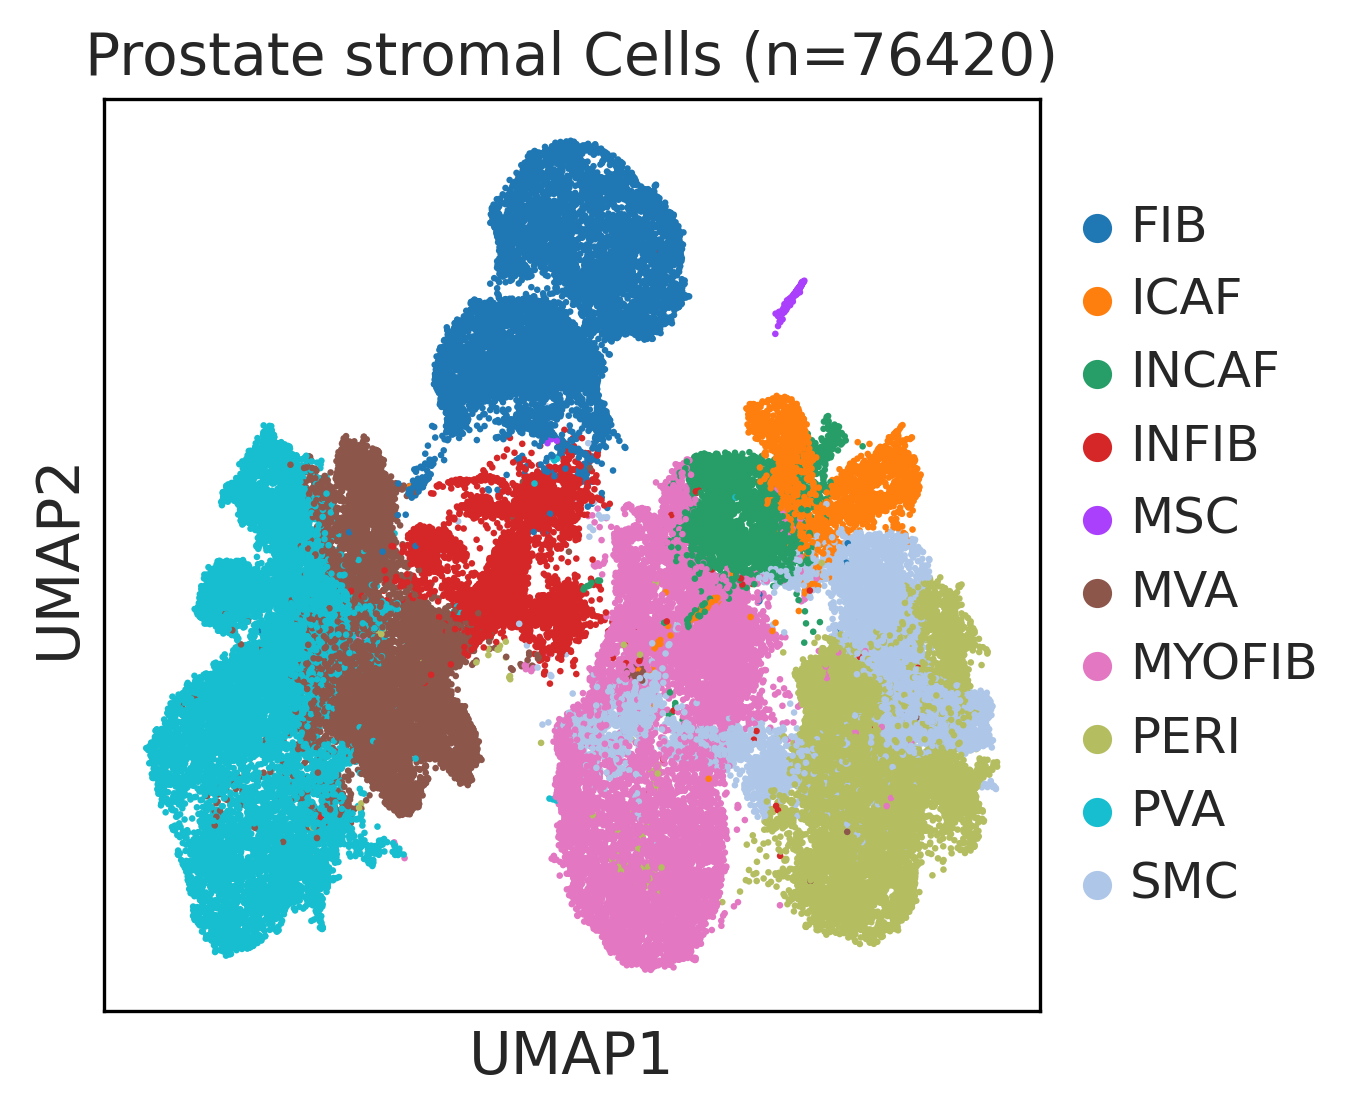
UMAP representations and annotations of Epithelial cells in the integrated scRNA-seq data of the selected tissue.UMAP representations and annotations of Immune cells in the integrated scRNA-seq data of the selected tissue.UMAP representations and annotations of Stromal cells in the integrated scRNA-seq data of the selected tissue.
∗UMAP representations and annotations of Epithelial, Immune, Stromal cells in the integrated scRNA-seq data of Prostate tissue. Colors represent cell types of each compartment.

check button Cell markers.
TissueMajor Cell TypeMinor Cell TypeFull NameMarkers
ProstateEpiSTMStem-like cellsITGB1,DLL1,LAMC2,TP63,VIM
ProstateEpiBASBasal cellsKRT14,ITGB4,KRT15,KRT5
ProstateEpiLUMEnteroendocrineKLK3,KLK2,ACPP,MSMB,NKX3-1,AR,KRT8,KRT18,TACSTD2
ProstateEpiUROUrothelial-like cells UPK1A,GATA3
ProstateEpiNUERNeuroendocrine cellsSYP,KRT4,LY6D
ProstateEpiTRANSTransit-amplifying cellsMKI67,KRT5,MYC
ProstateImmMASTMast cellsTPSAB1,CPA3,HDC,CTSG,TPSB2,CMA1,MS4A2
ProstateImmcDCConventinal dendritic cellsHLA-DQA1,HLA-DQB1,CLEC10A,CLEC9A,FCER1A,CST3,CD1C
ProstateImmpDCPlasmacytoid dendritic cellsIL3RA,CLEC4C,NRP1,KLRD1
ProstateImmNKTNatural killer T cellsCD3D,CD3E,NCAM1,KLRB1
ProstateImmMDSCMyeloid-derived suppressor cellsITGAM,LY6G6C,IL4R,ARG1
ProstateImmM1MACM1 macrophagesFOLR2,FABP3,PLA2G2D,ITGAM,ITGAX,CSF1R,CD68,CD163,THBD
ProstateImmINMONInflamotory monocytesCD14,CLEC9A,FCGR1A,LILRB2,CD209,CD1E,FCN1,VCAN,S100A8,S100A9
ProstateImmM2MACM2 macrophagesCSF1R,CSF3R,MRC1,IL10,CCL18,VSIG4,CHI3L1
ProstateImmBNNaive B cellsCD19,IGHD,IGLL1,CD27,CD38
ProstateImmBMEMMemory B cellsPAX5,MS4A1,CD19,IGLL5,VPREB3,CD79A,CD79B,IGKC,CD74,HLA-DRA,CD37,CD22
ProstateImmPLAPlasma cellsSSR4,IGLL5,IGLL1,AMPD1,IGHA1,IGHA2,JCHAIN,CD38,TNFRSF17,SDC1,IGHG1,MZB1
ProstateImmTH1T-helper 1CXCL13,IFNG,CXCR3,BHLHE40,GZMB,PDCD1,HAVCR2,ICOS,IGFLR1,ITGAE
ProstateImmTREGRegulatory T cellsBATF,TNFRSF4,FOXP3,CTLA4,LAIR2,IL2RA
ProstateImmCD8TEXPProgenitor exhausted CD8+ T cellsPDCD1,IL7R,GPR183,NR4A3,REL,TCF7
ProstateImmCD8TNNaive CD8+ T cellsCCR7,CD28,ETS1,LEF1,SELL,TCF7,CD27,CD28,S1PR1
ProstateImmCD8TCMCentral memory CD8+ T cellsCCR7,SELL,IL7R,CD27,CD28,PRF1,GZMA,CCL5,GPR183,S1PR1
ProstateImmCD8TRMCD8+ tissue resident memory T cellsCD6,XCL1,XCL2,MYADM,CAPG,RORA,NR4A1,NR4A2,NR4A3,CD69,ITGAE
ProstateImmCD8TEFFEffector CD8+ T cellsCX3CR1,FCGR3A,FGFBP2,PRF1,GZMH,TBX21,EOMES,S1PR1
ProstateStrMSCMesenchymal stem cellsNT5E,THY1,ENG,CD44,ITGB1,MCAM,ENDOD1
ProstateStrFIBFibroblastsTGFB1,BMP7,MAP3K2,COL6A1,CD36,CD44,FAP,CBLN2,SPOCK1,ACSS3,COL1A1,FN1,COL1A2,COL3A1,BGN,DCN,POSTN,C1R,ACTA2,MMP2,FGF7,MME,CD47
ProstateStrSMCSmooth muscle cellsACTA2,CNN1,MYH11,TAGLN,CALD1,TAGLN2
ProstateStrMYOFIBMyofibroblastsSYT10,SOSTDC1,DES,TAGLN,MYH11,TPM4
ProstateStrPERIPericytesPDGFRA,CSPG4,RGS5,MCAM,COX4I2,KCNJ8,HIGD1B,NOTCH3,HEYL,FAM162B
ProstateStrINFIBInflammatory fibroblastsCHI3L1,MMP3,PLAU,MMP1,TRAFD1,GBP1
ProstateStrPVAPost capillary venulesSELP,ZNF385D,FAM155A,GALNT15,MADCAM1,CORT
ProstateStrMVAMicrovascular cellsPLVAP,CD36,DYSF,NRP1,SH3BP5,EXOC3L2,FABP5,VWA1,BAALC,PRSS23,RAPGEF4,APLN,HTRA1
ProstateStrINCAFIntermediate cancer-associated fibroblastsPDGFRA,POSTN,ID1,ID3
ProstateStrICAFInflammatory cancer-associated fibroblastsTWIST1,WNT2,FAP,CXCL1,CXCL2,CYR61,IL1B,IL6,HGF

Top

Cell type statistics by disease state

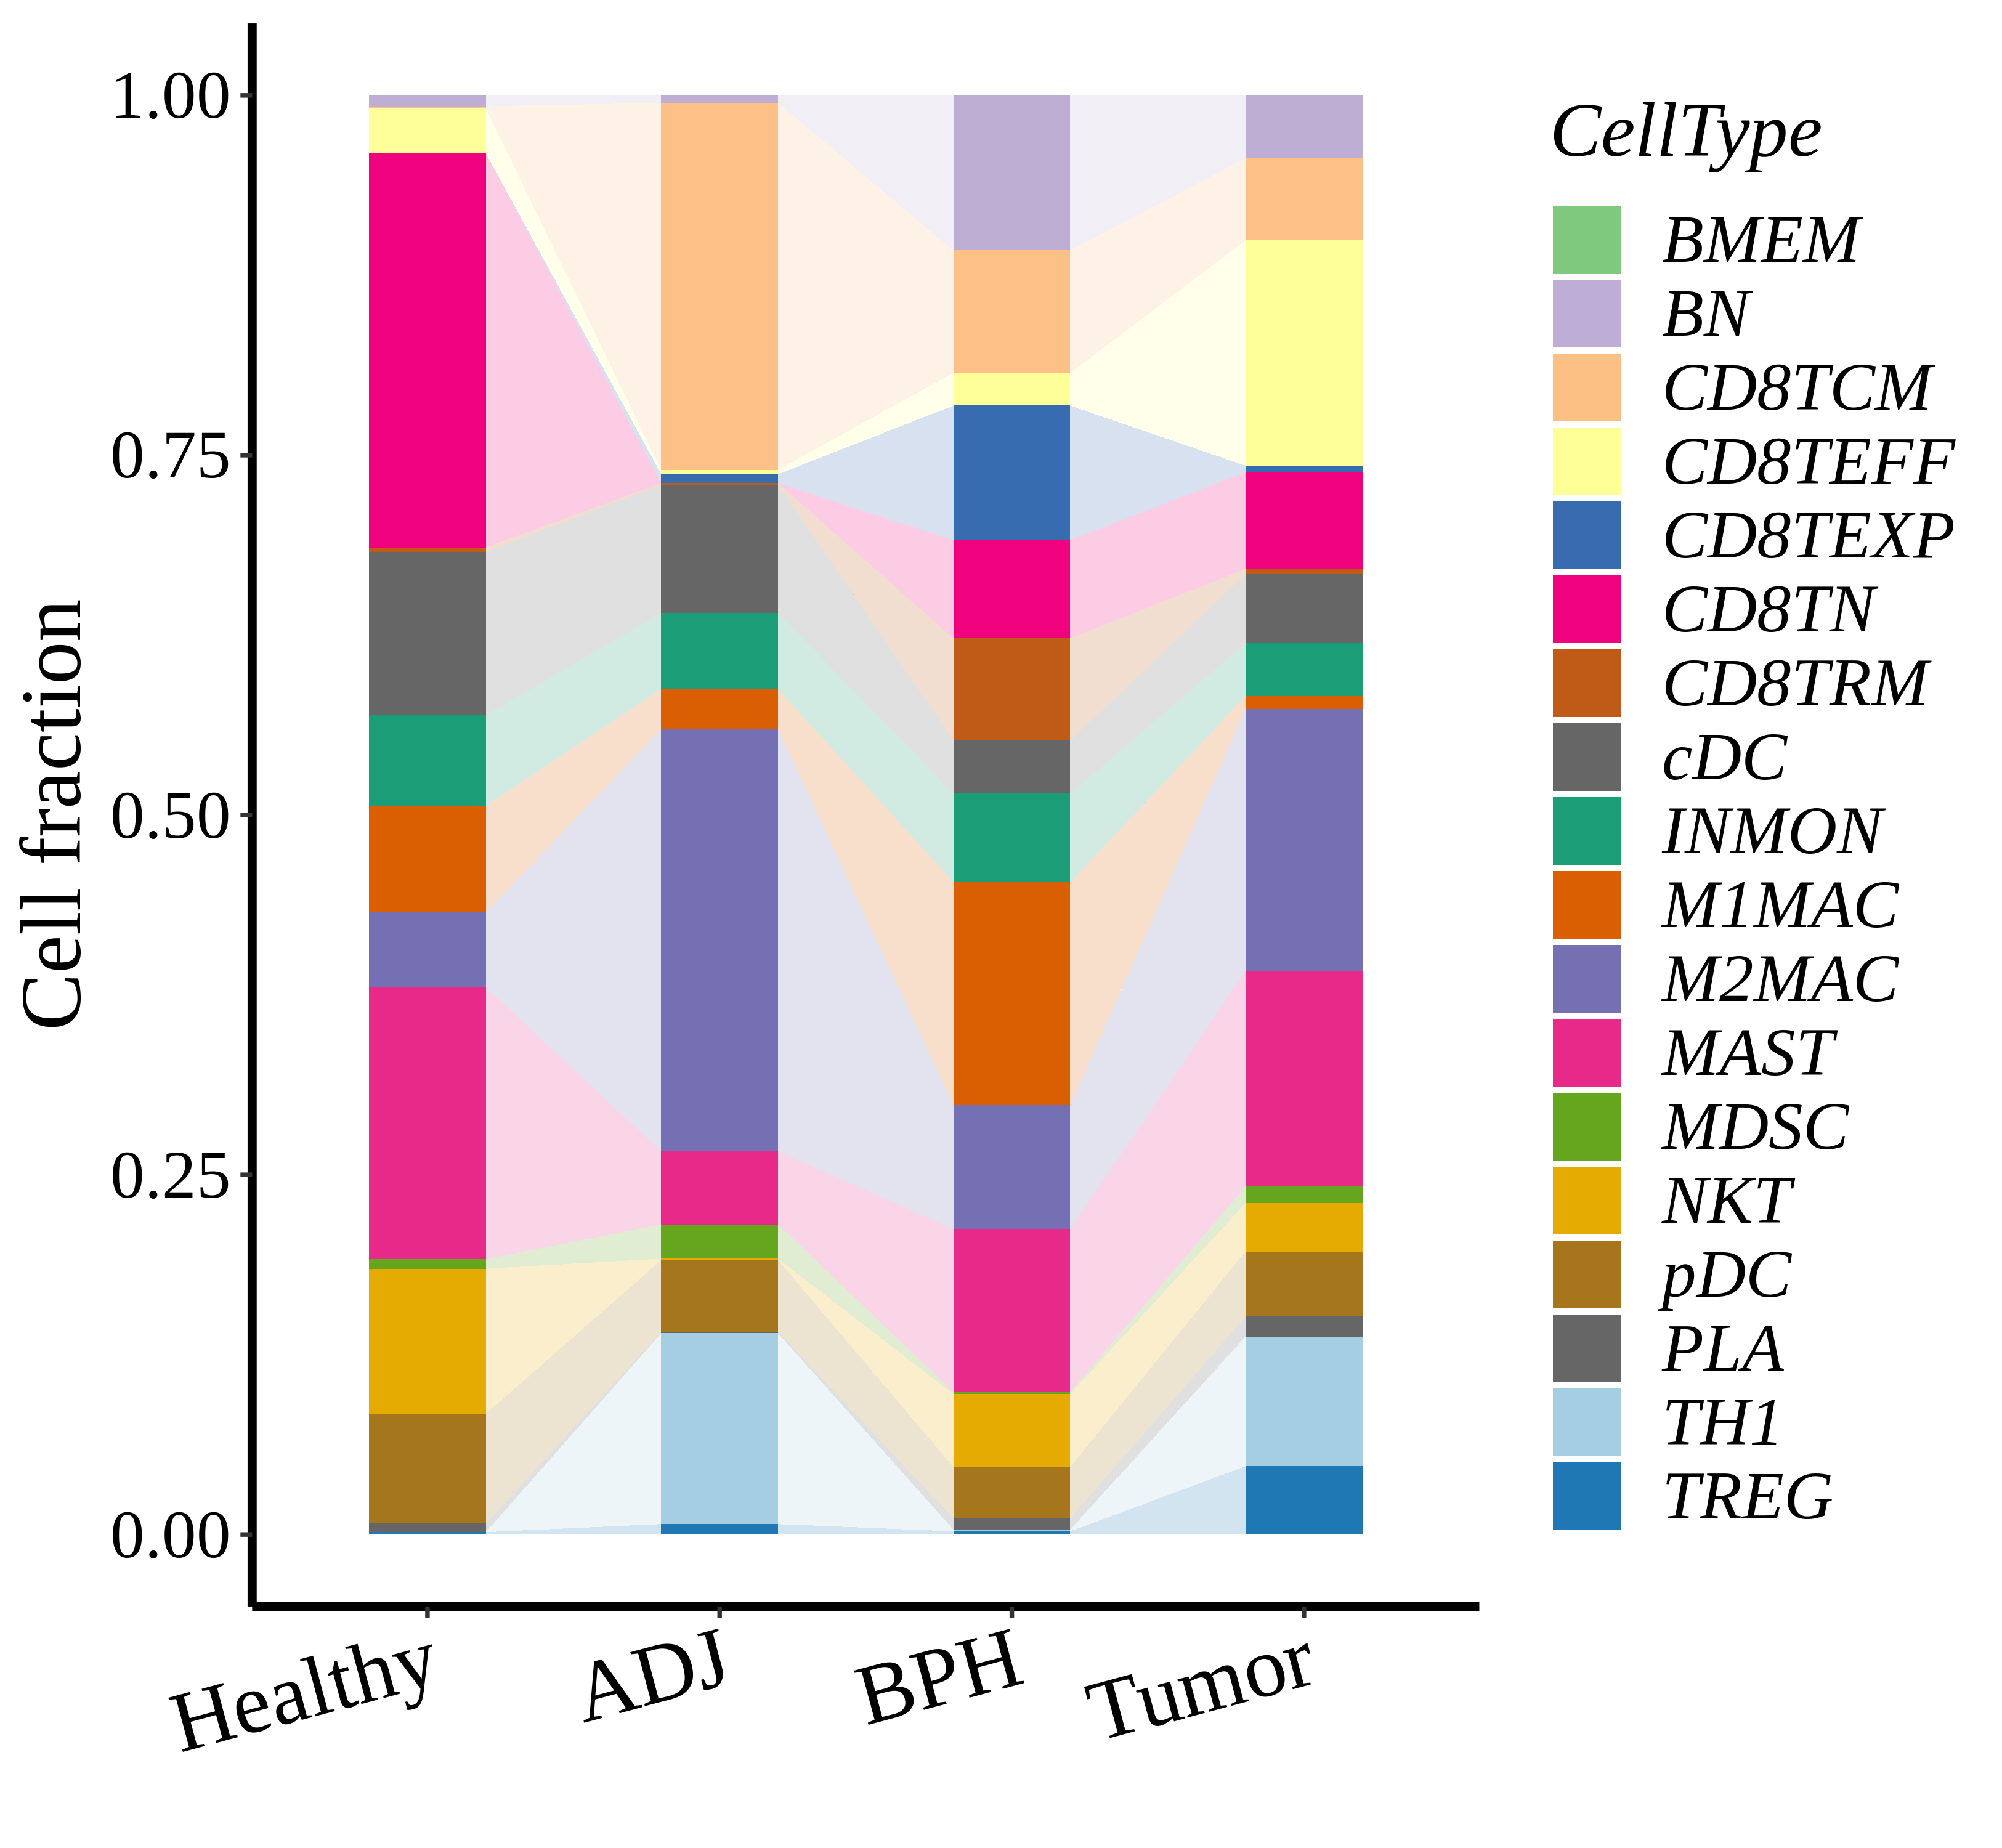
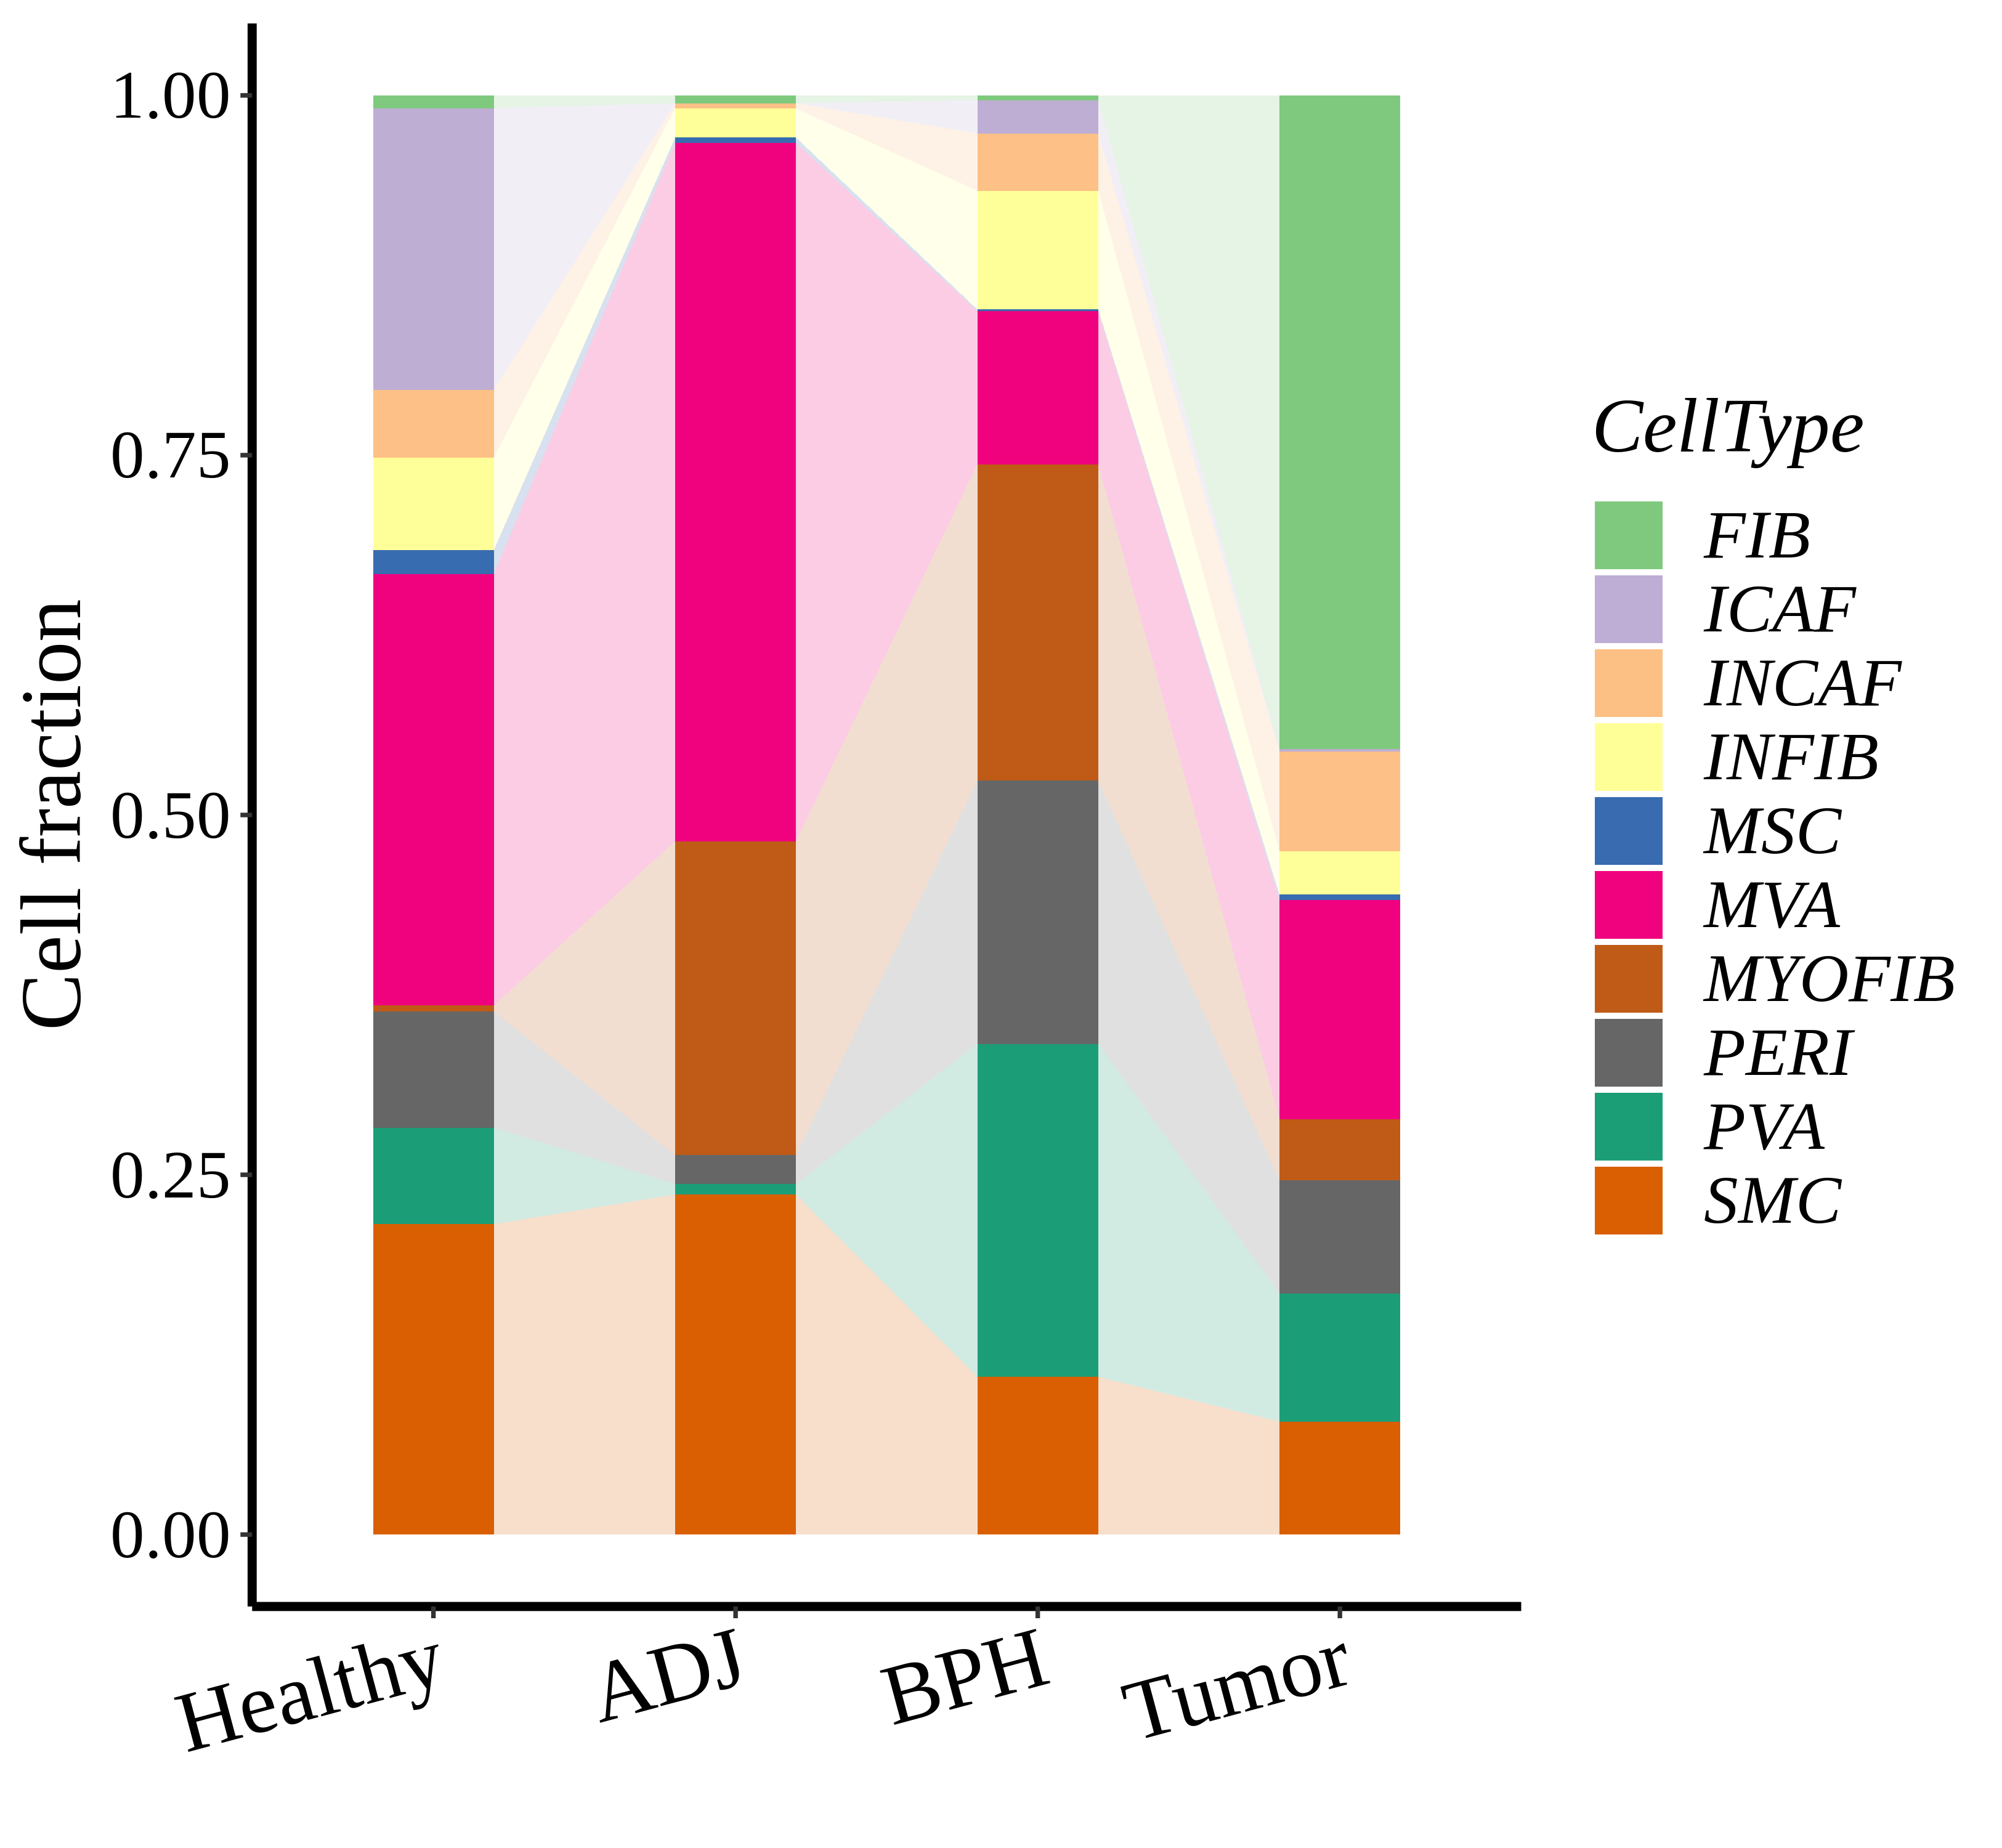
Stacked bar graph representation of the fraction of each epithelial cell type derived from samples with different Disease States in the integrated dataset of the selected tissue. Cells from each Disease State sample have a different color.Stacked bar graph representation of the fraction of each immune cell type derived from samples with different Disease States in the integrated dataset of the selected tissue. Cells from each Disease State sample have a different color.Stacked bar graph representation of the fraction of each stromal cell type derived from samples with different Disease States in the integrated dataset of the selected tissue. Cells from each Disease State sample have a different color.
∗Stacked bar graph representation of the fraction of each epithelial cell type derived from samples with different Disease States in the integrated dataset of Prostate tissue. Cells from each Disease State sample have a different color.

Top

Cell type dynamics in malignant transformation

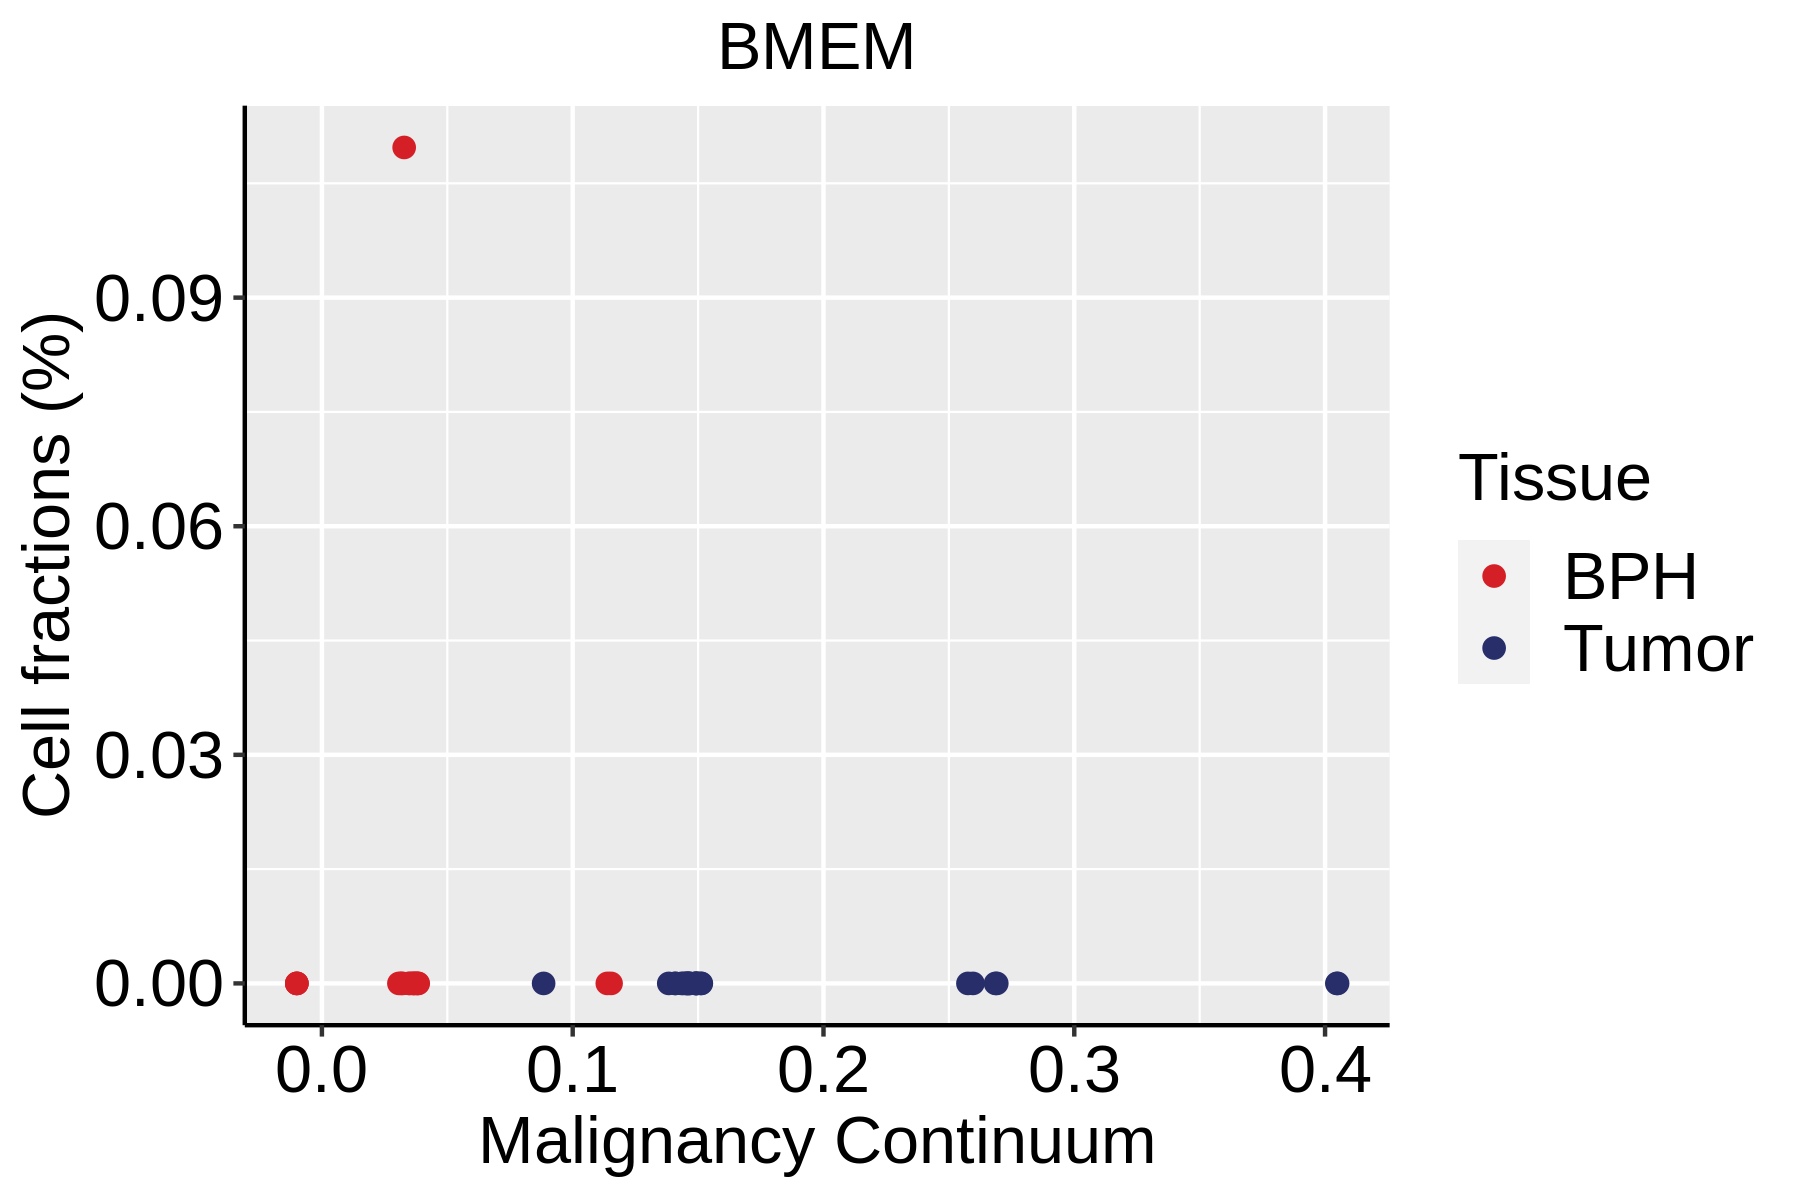
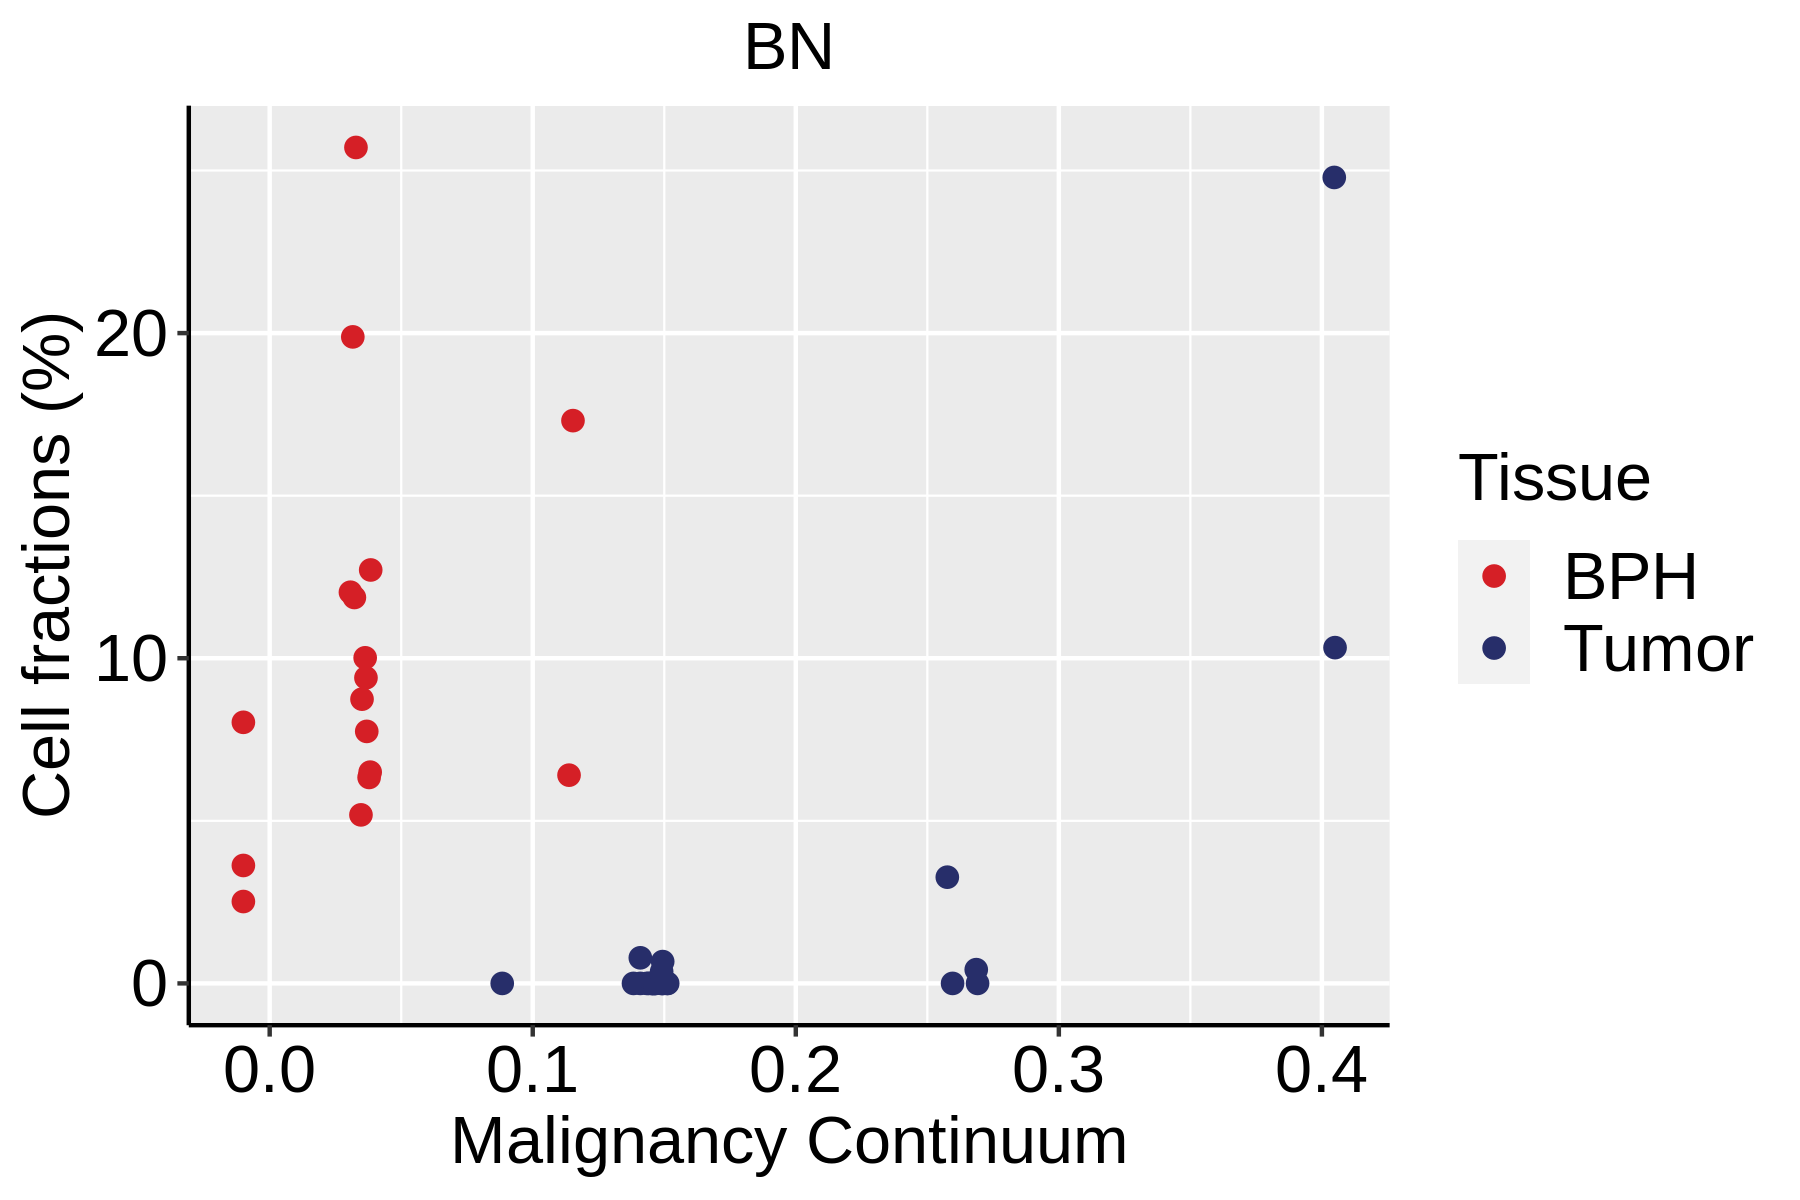
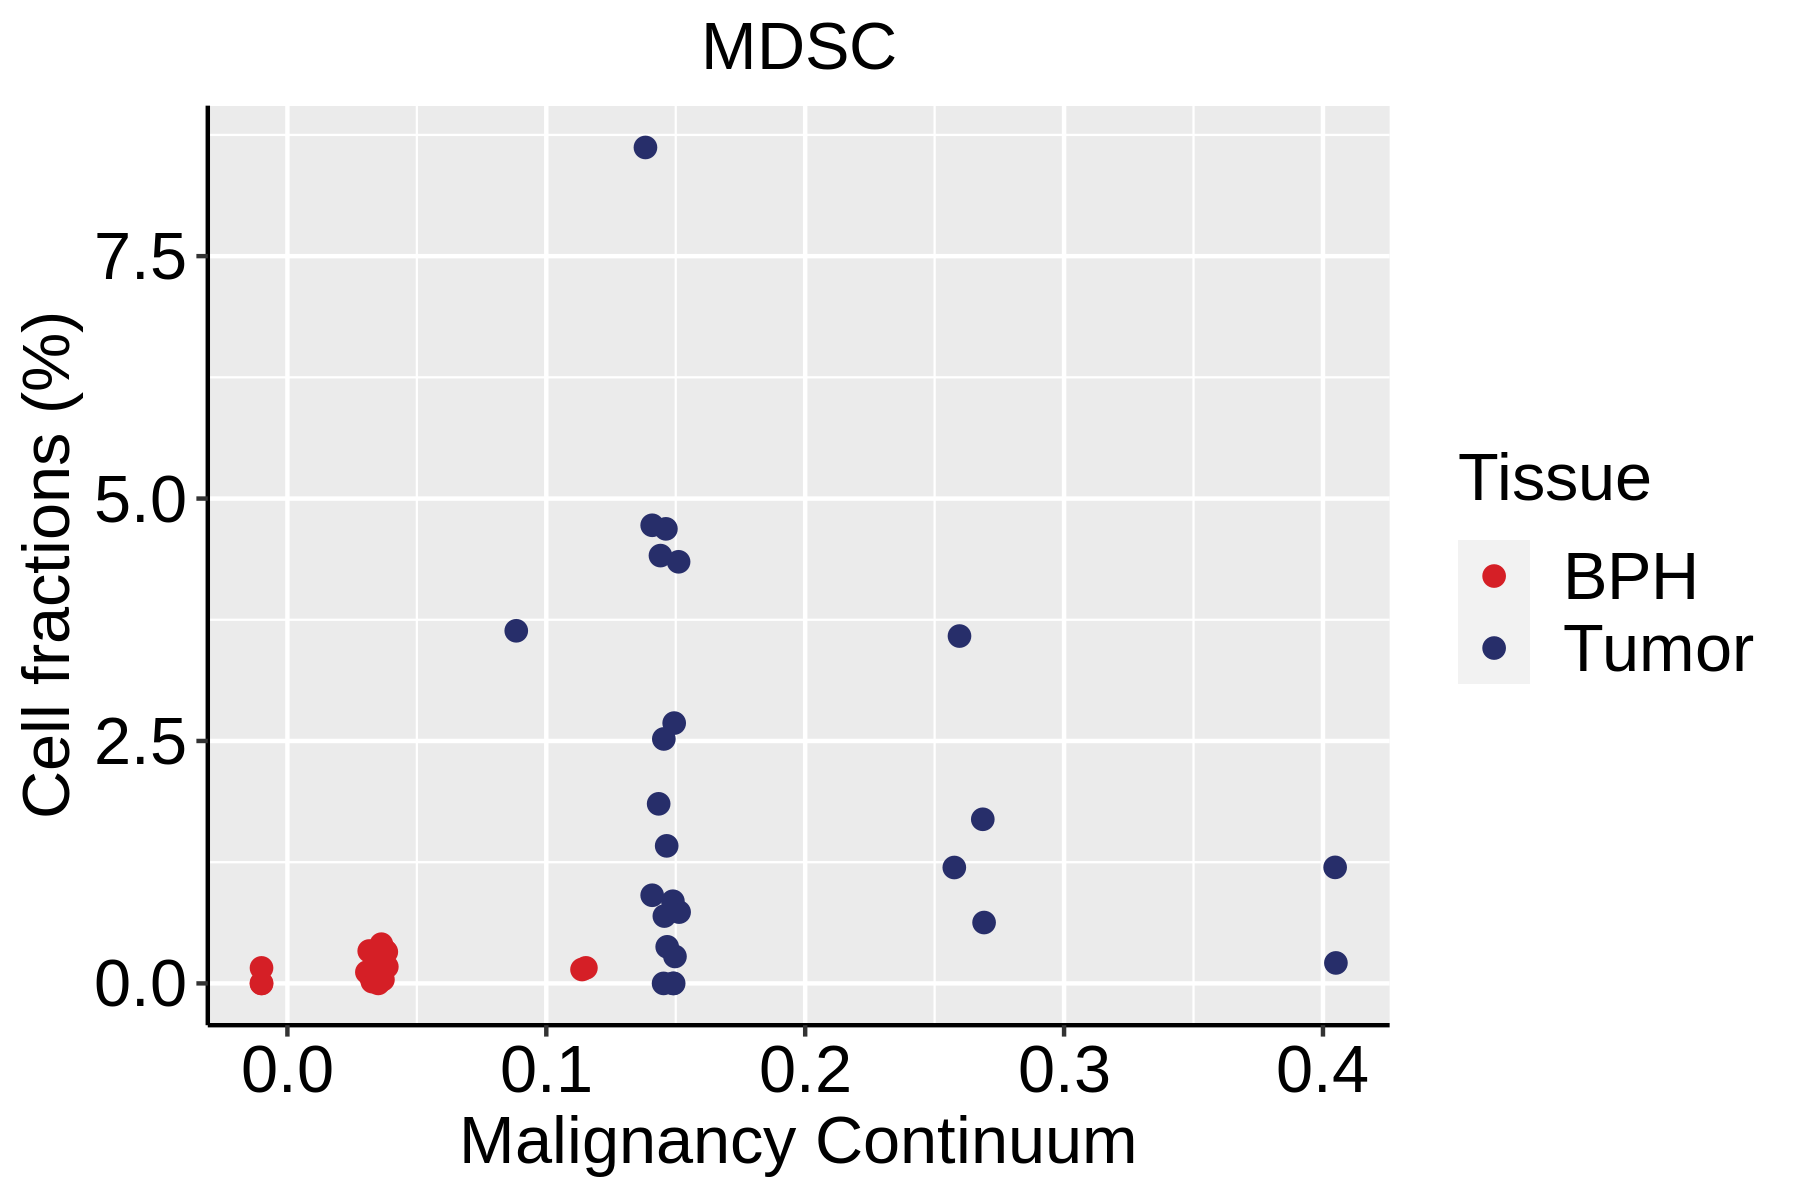
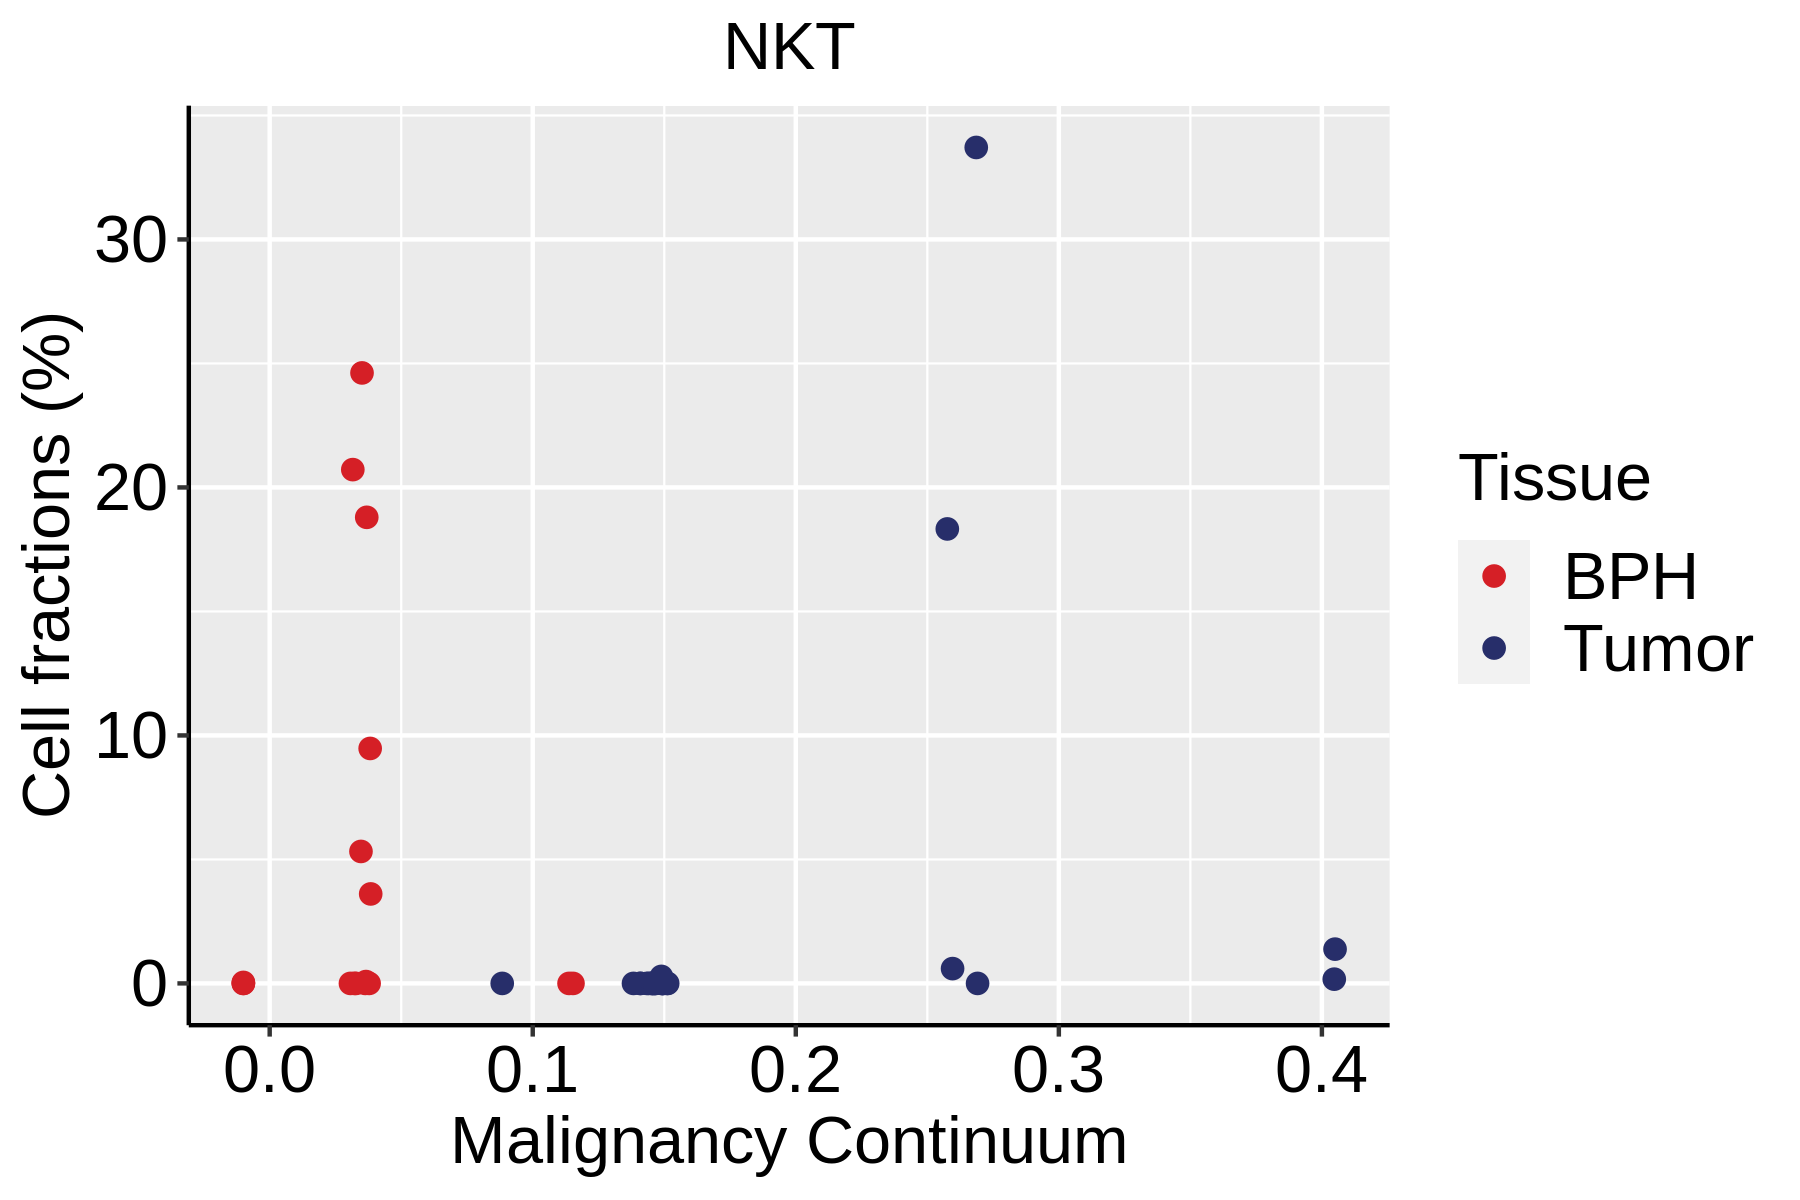
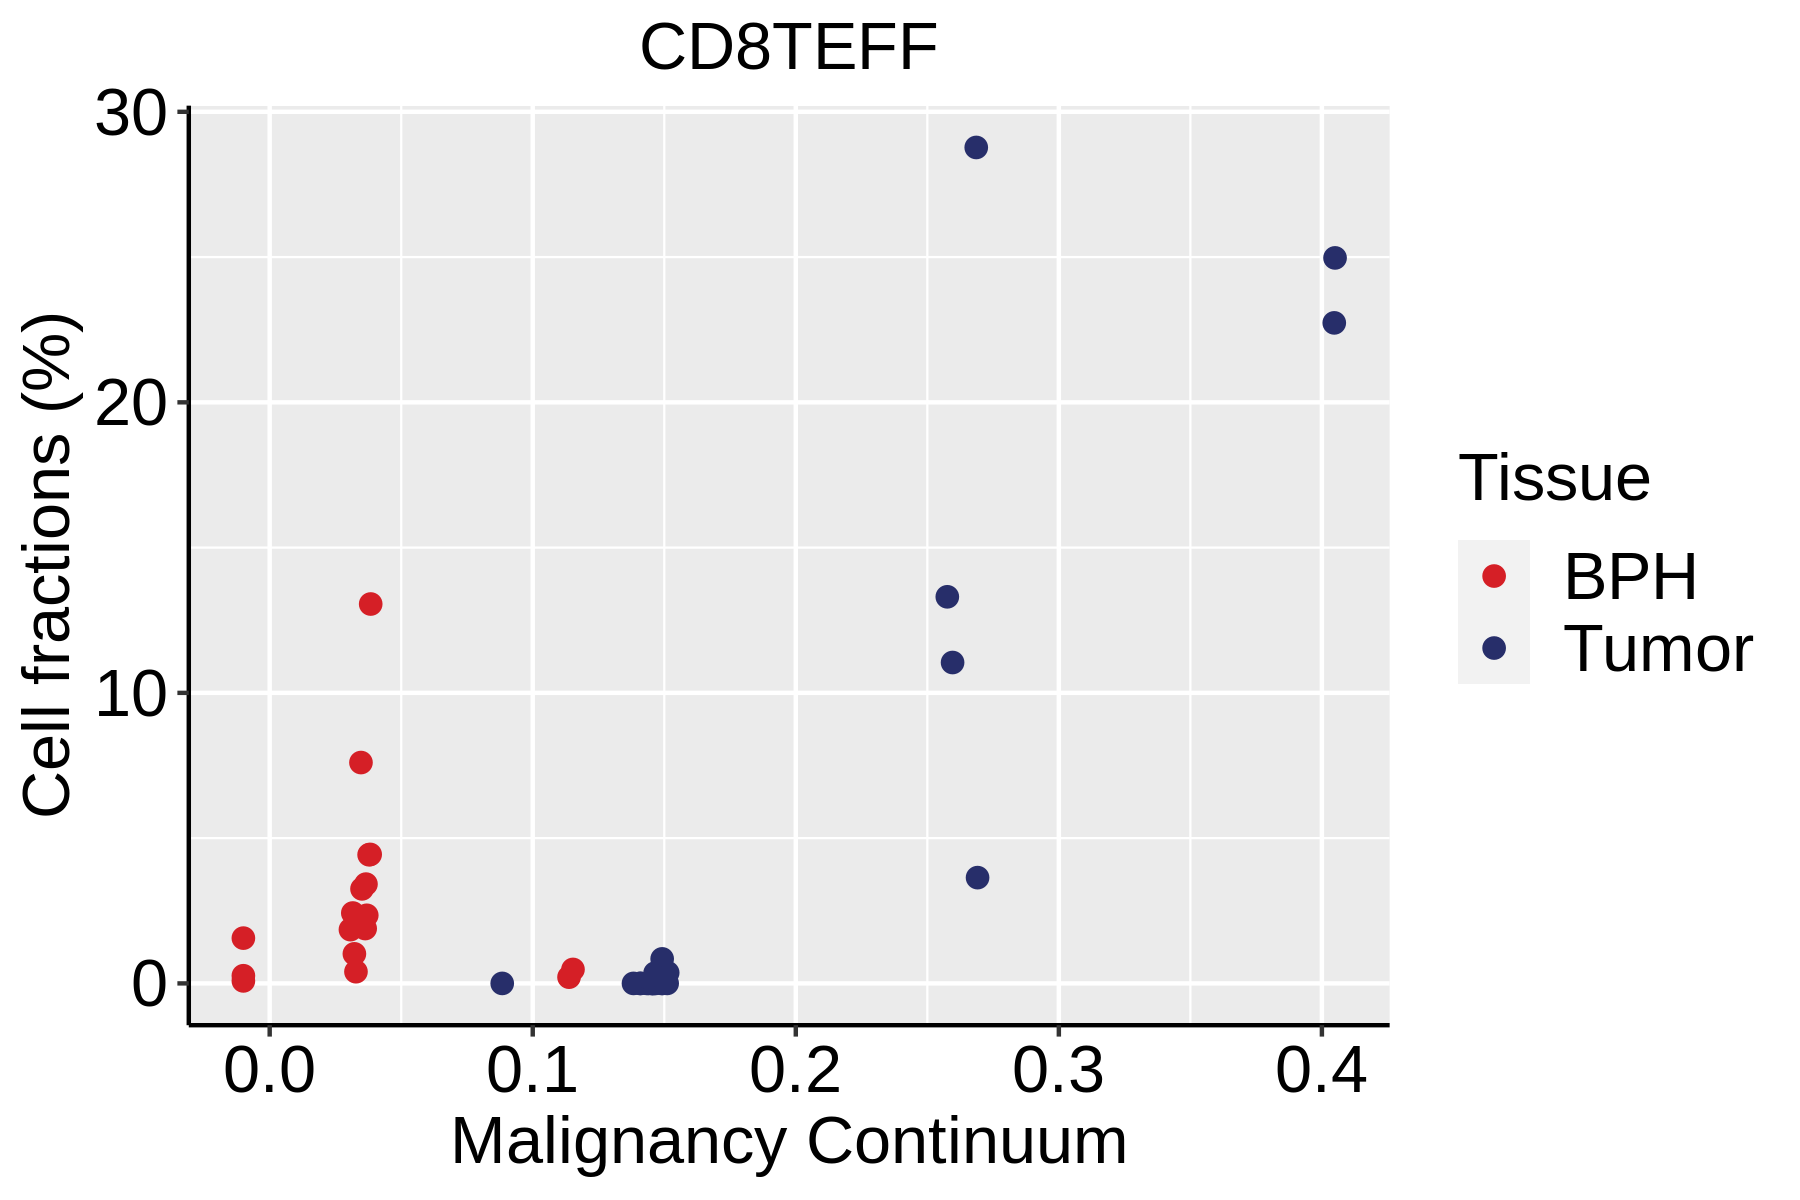
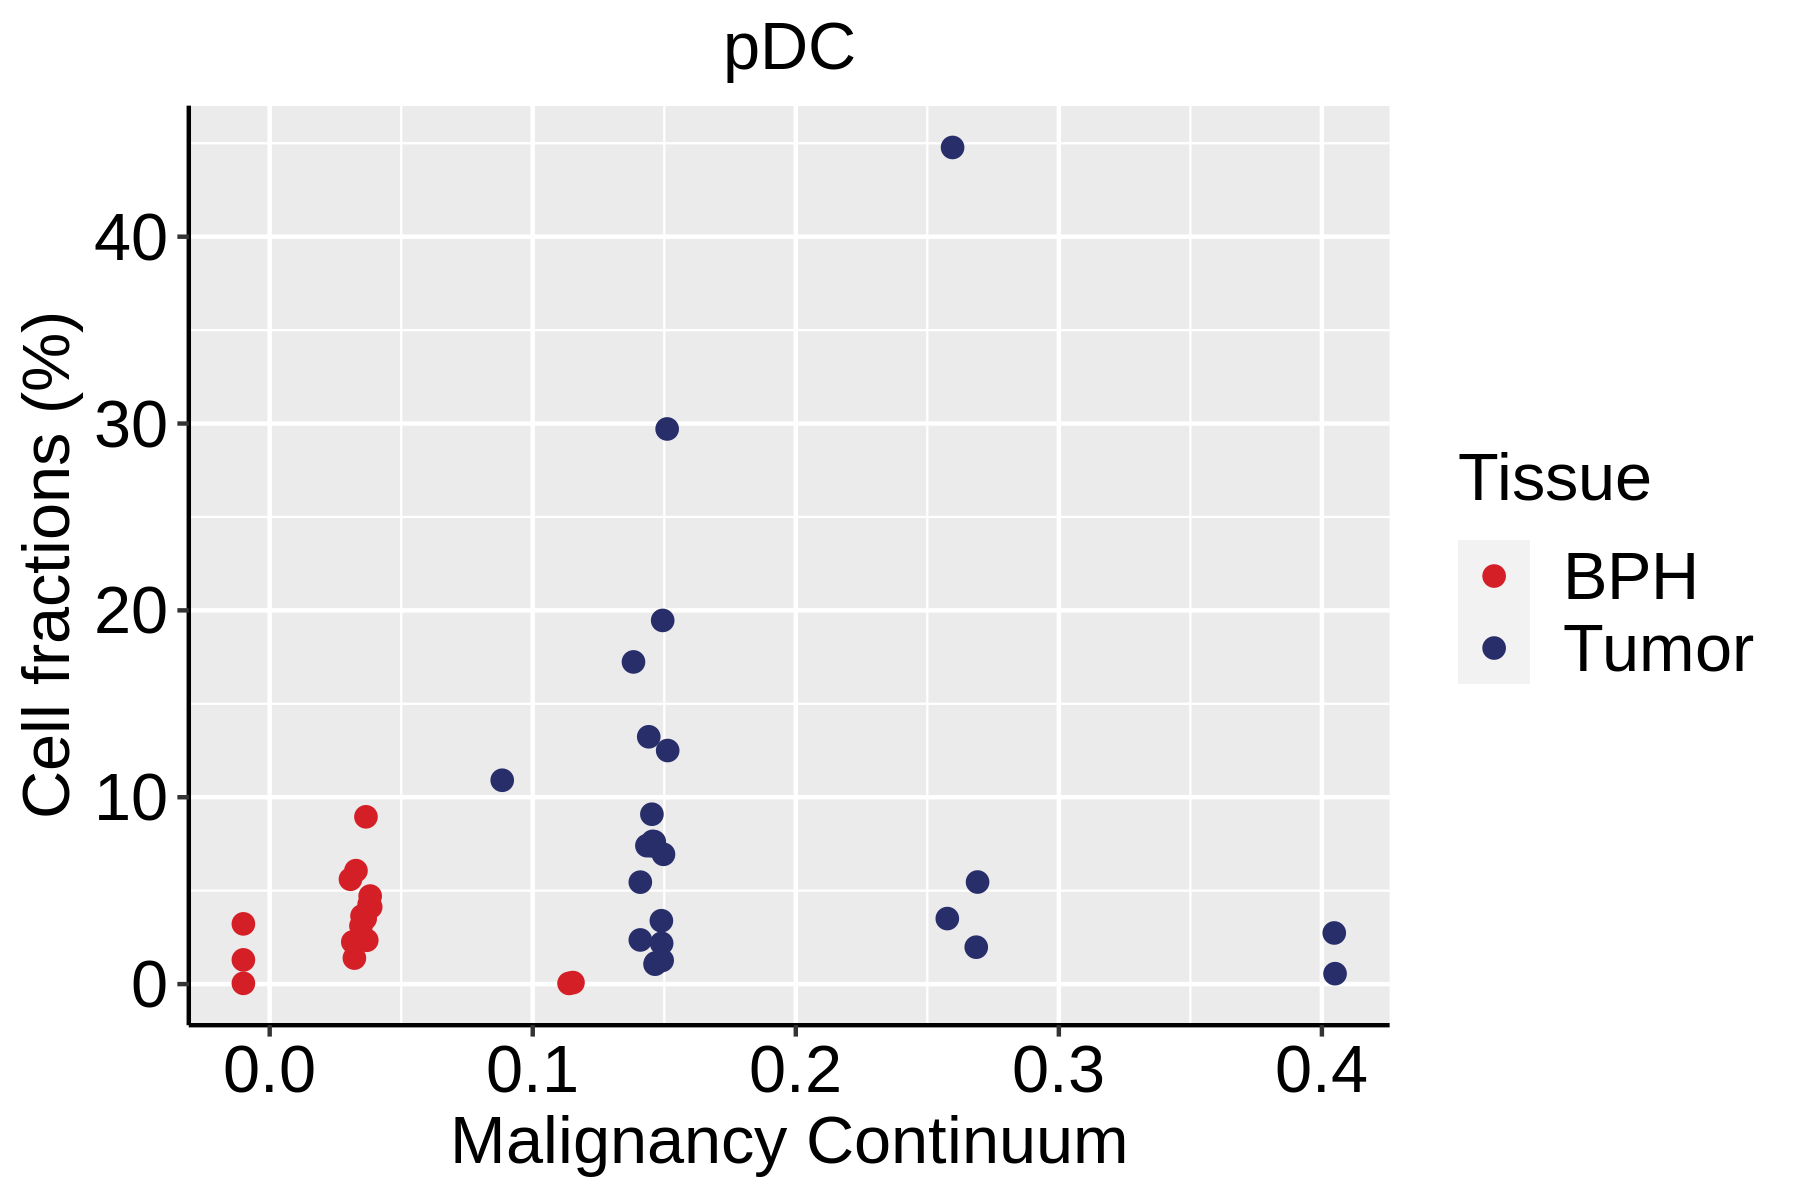
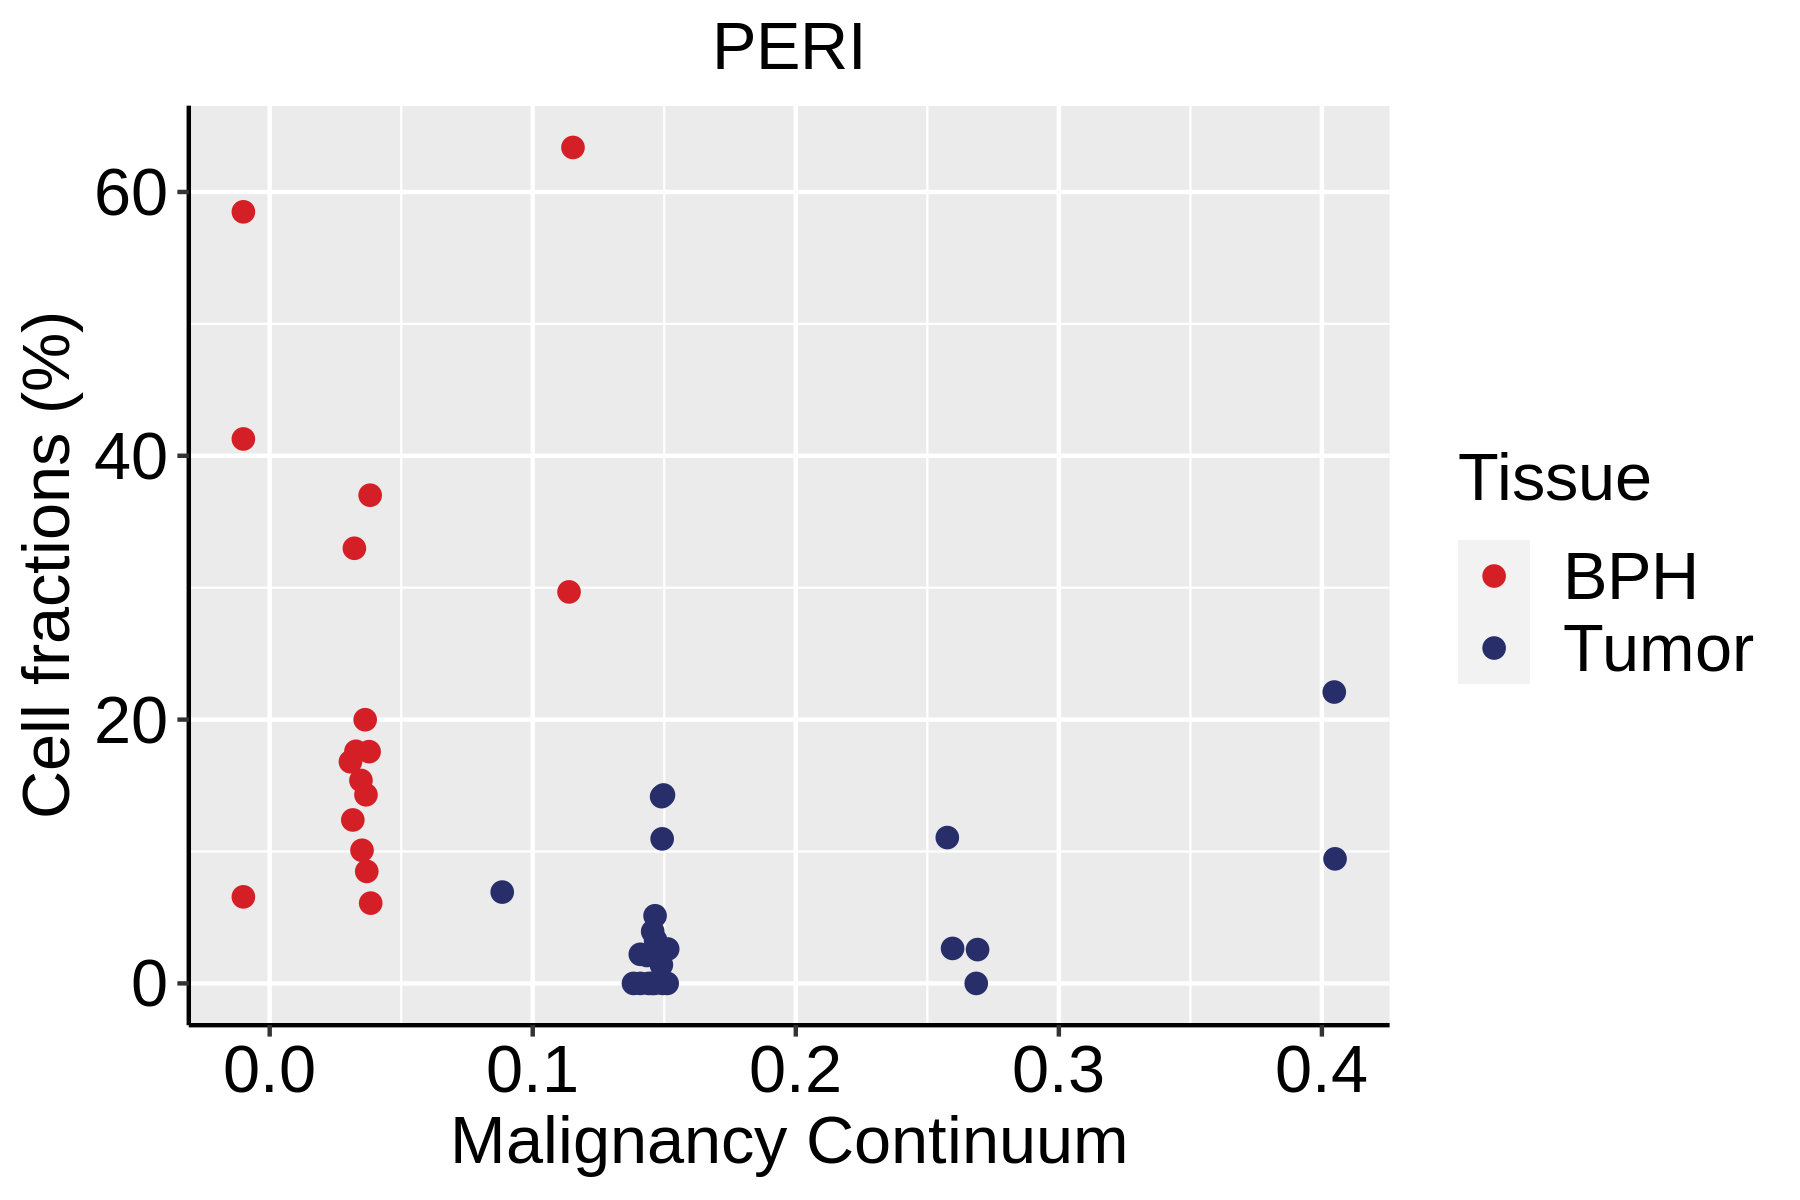
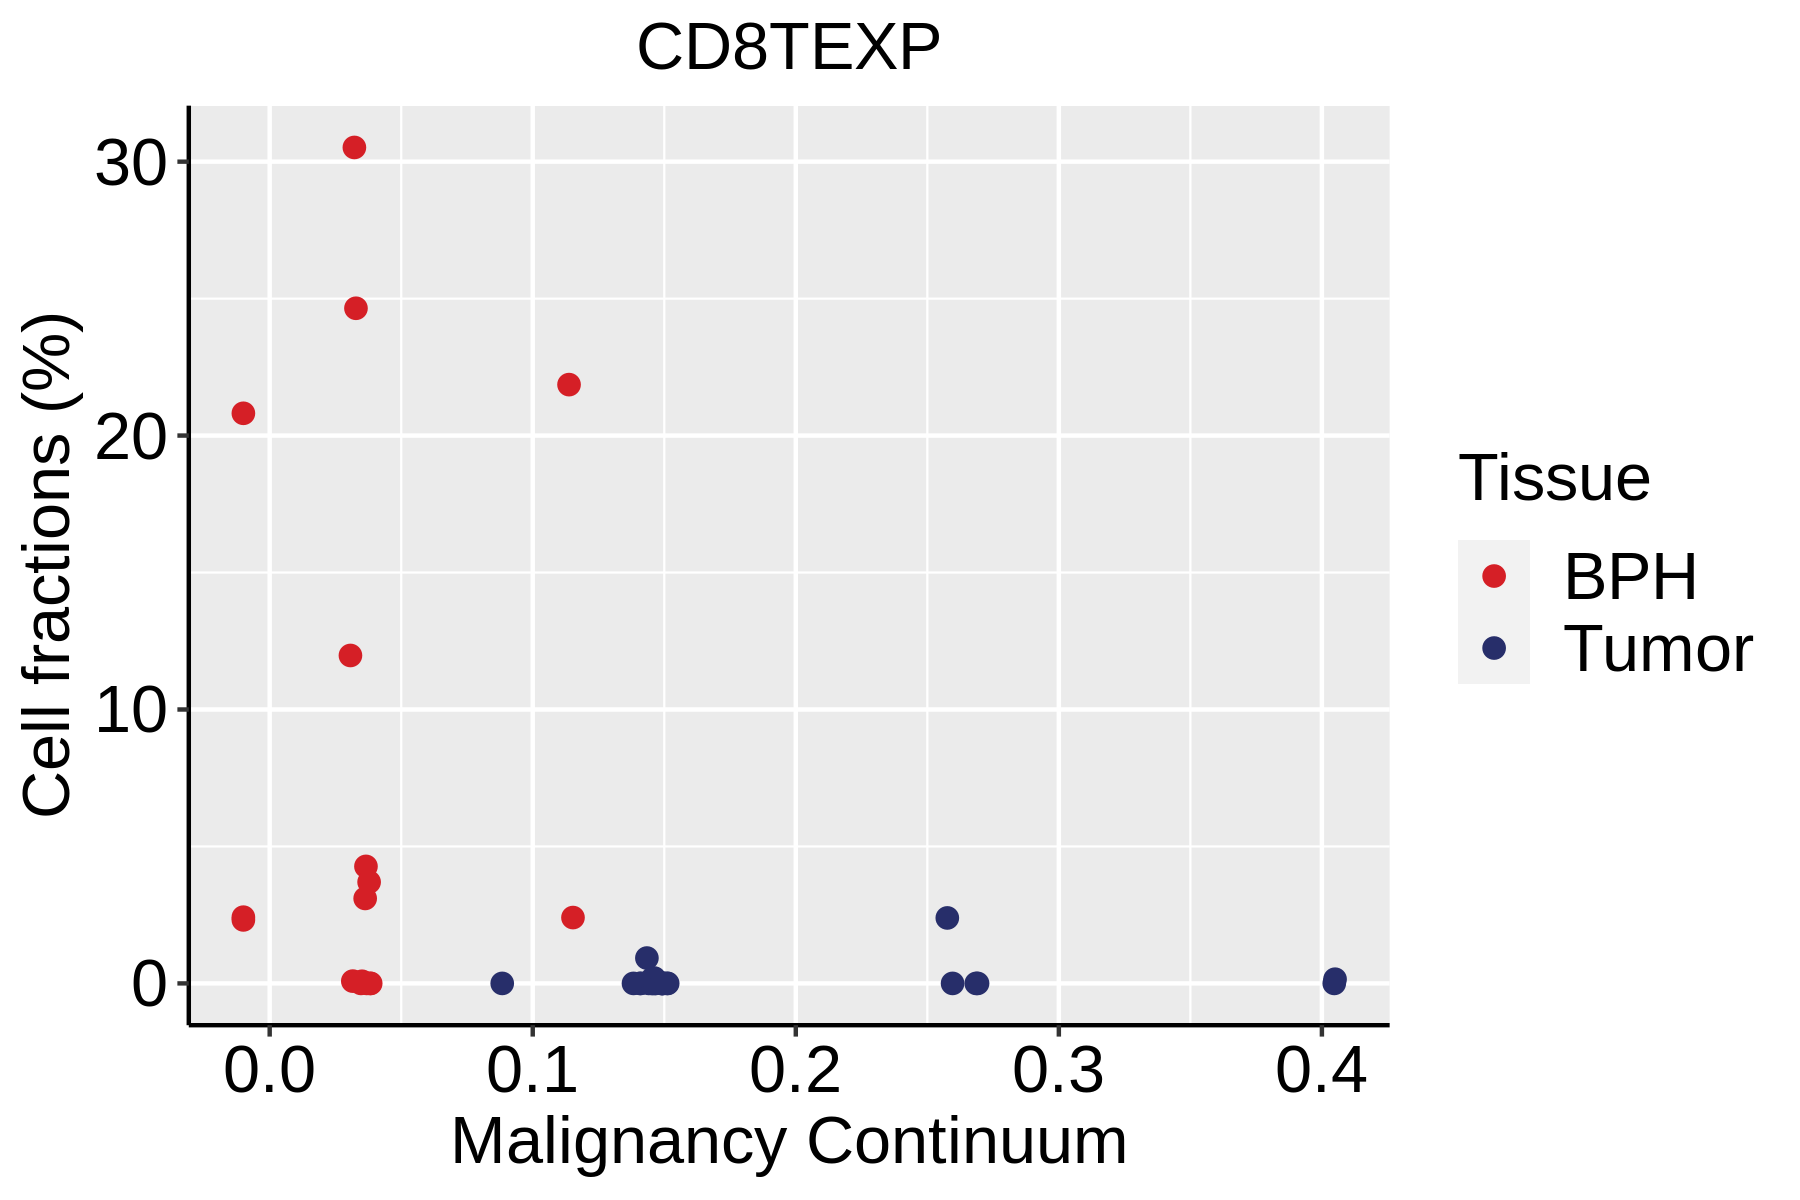
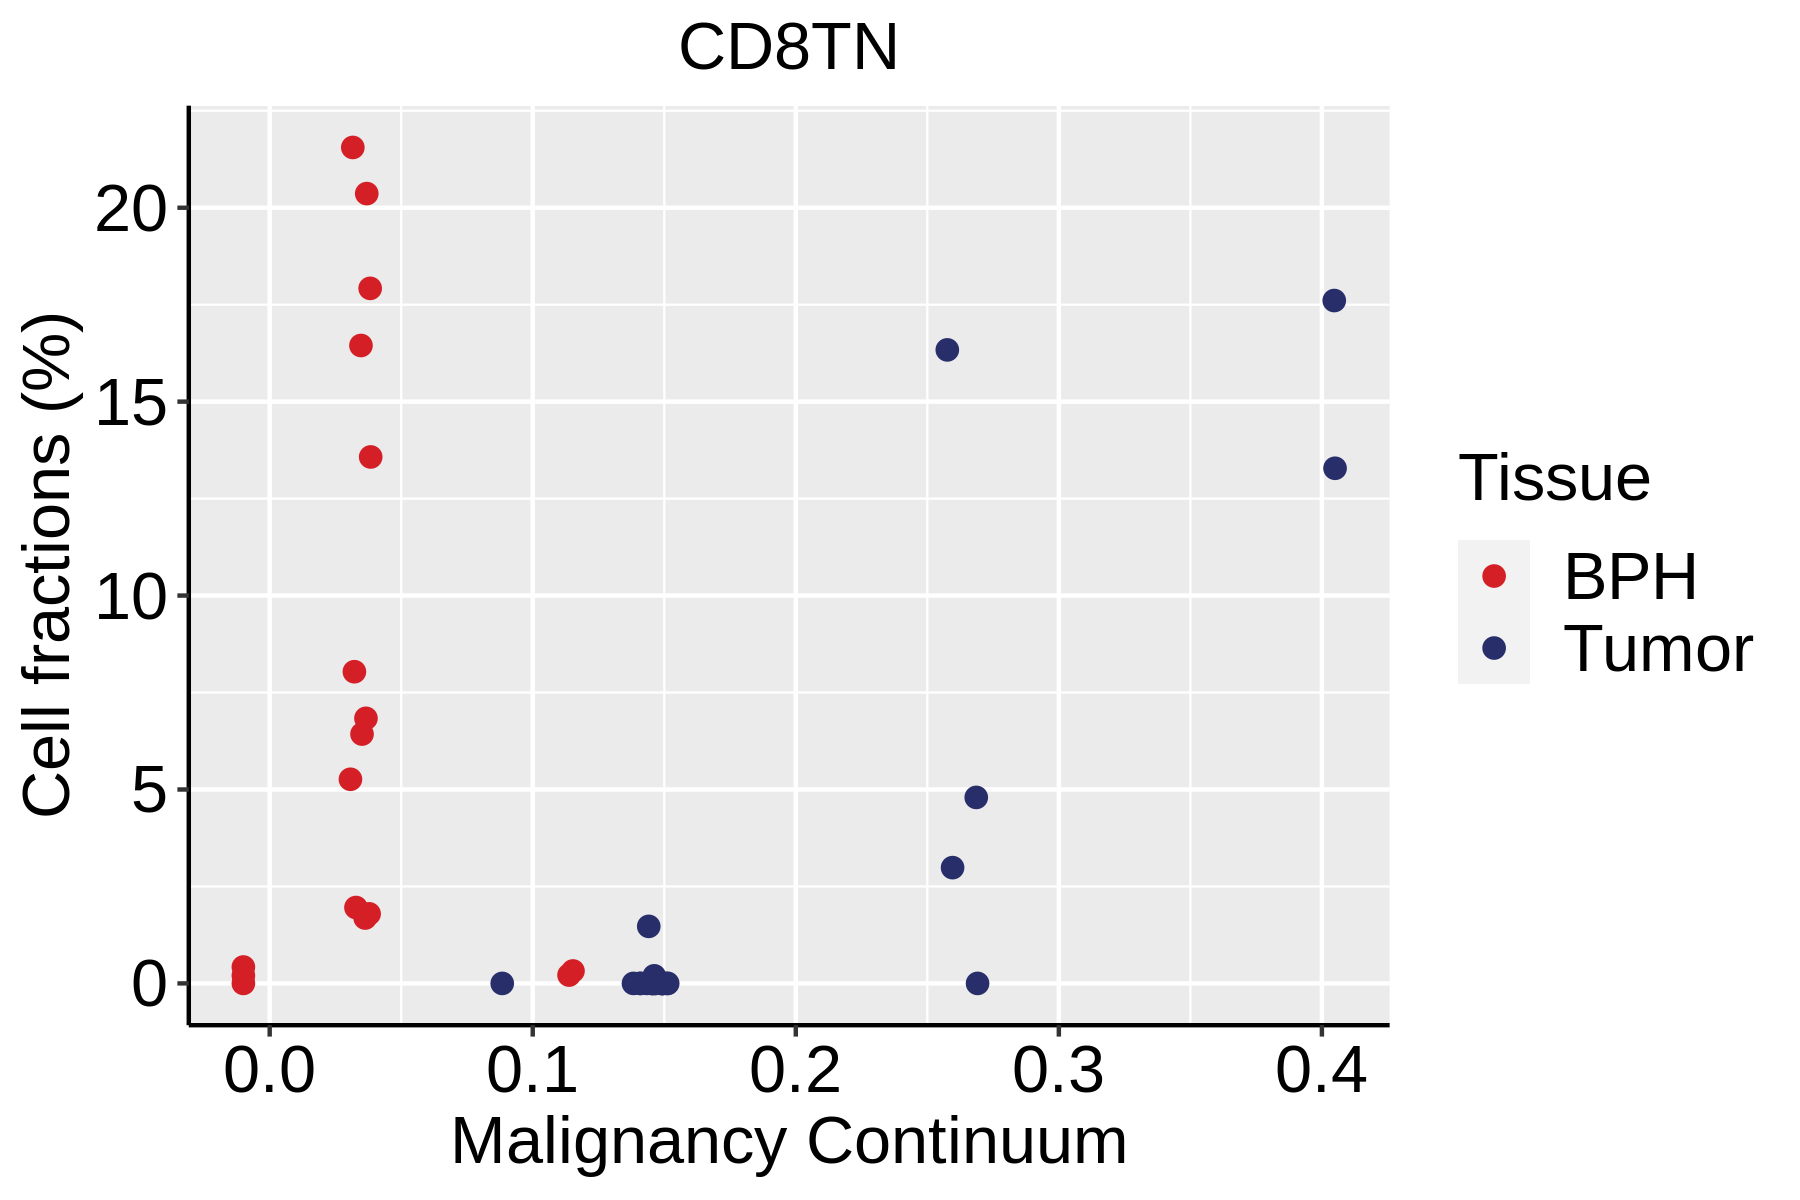
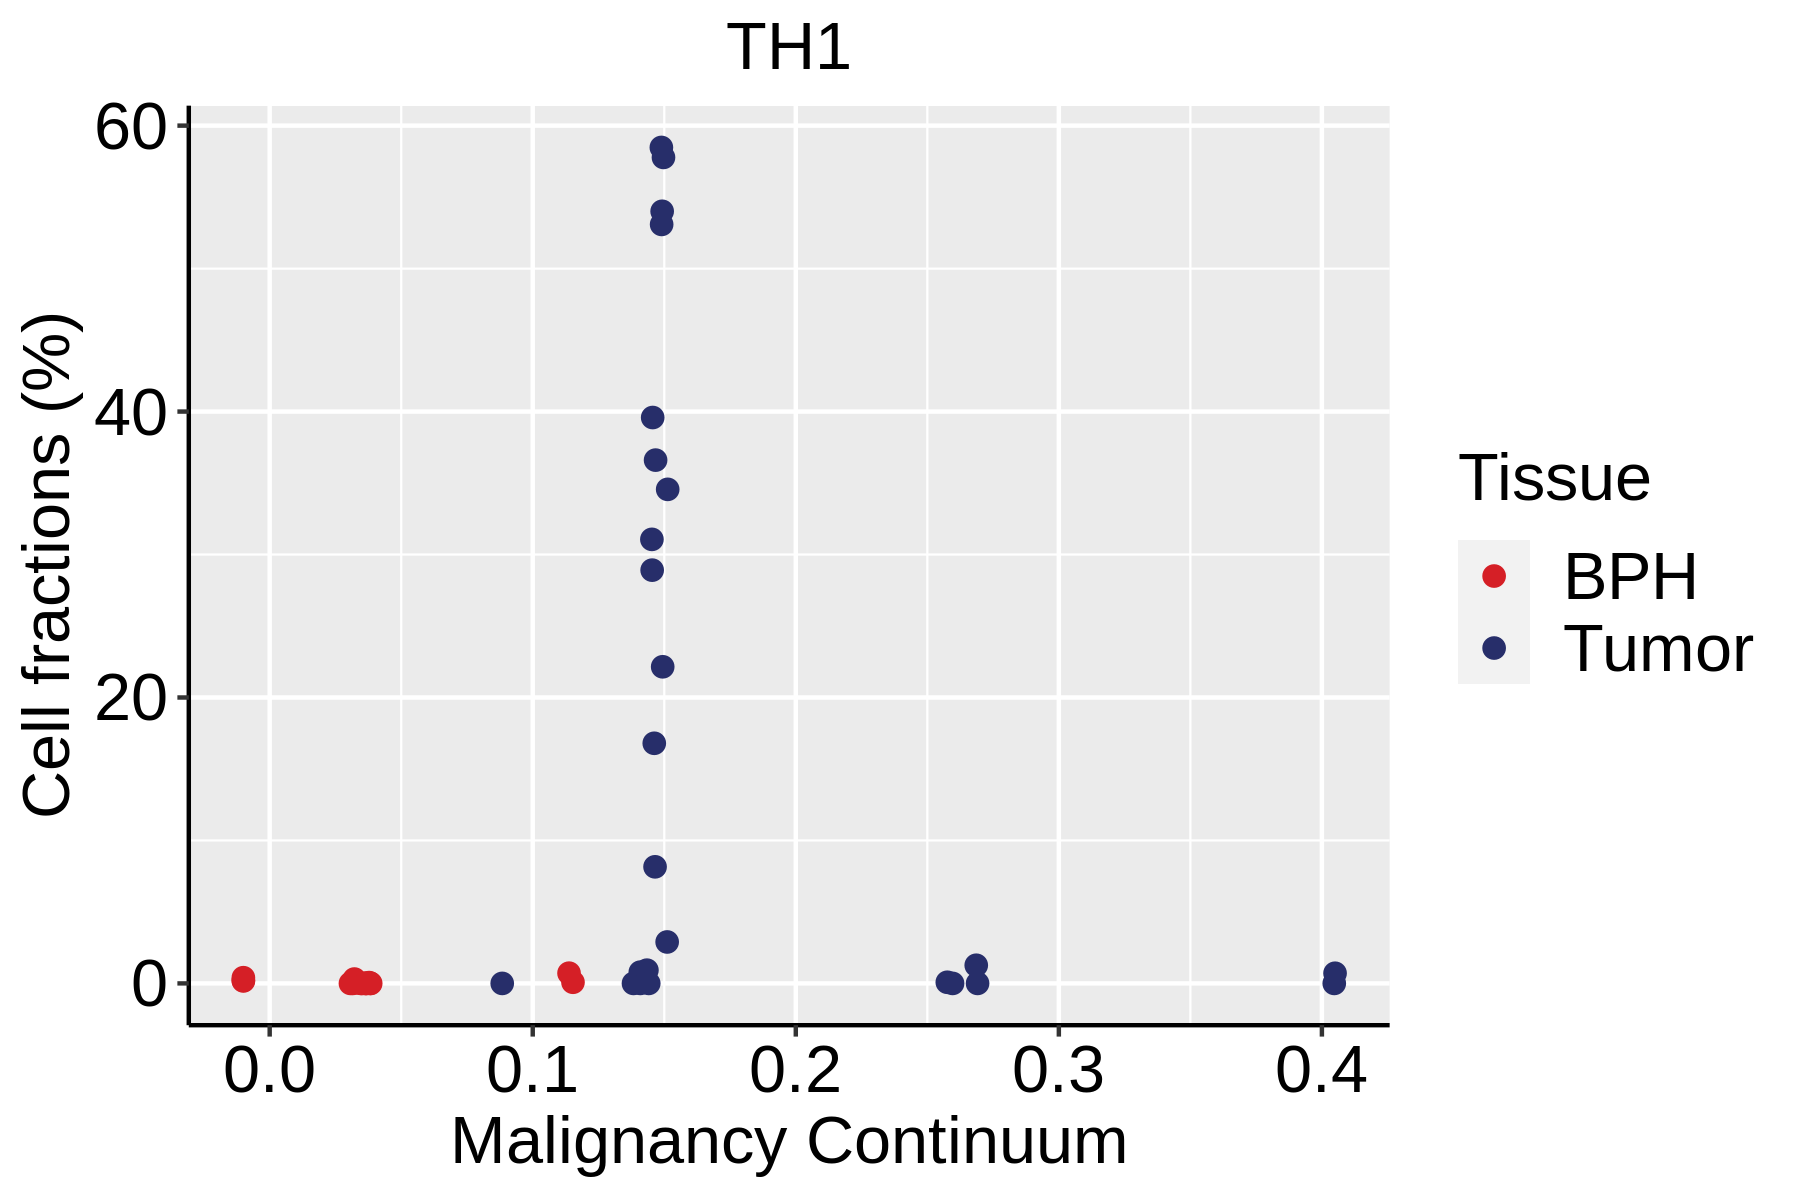
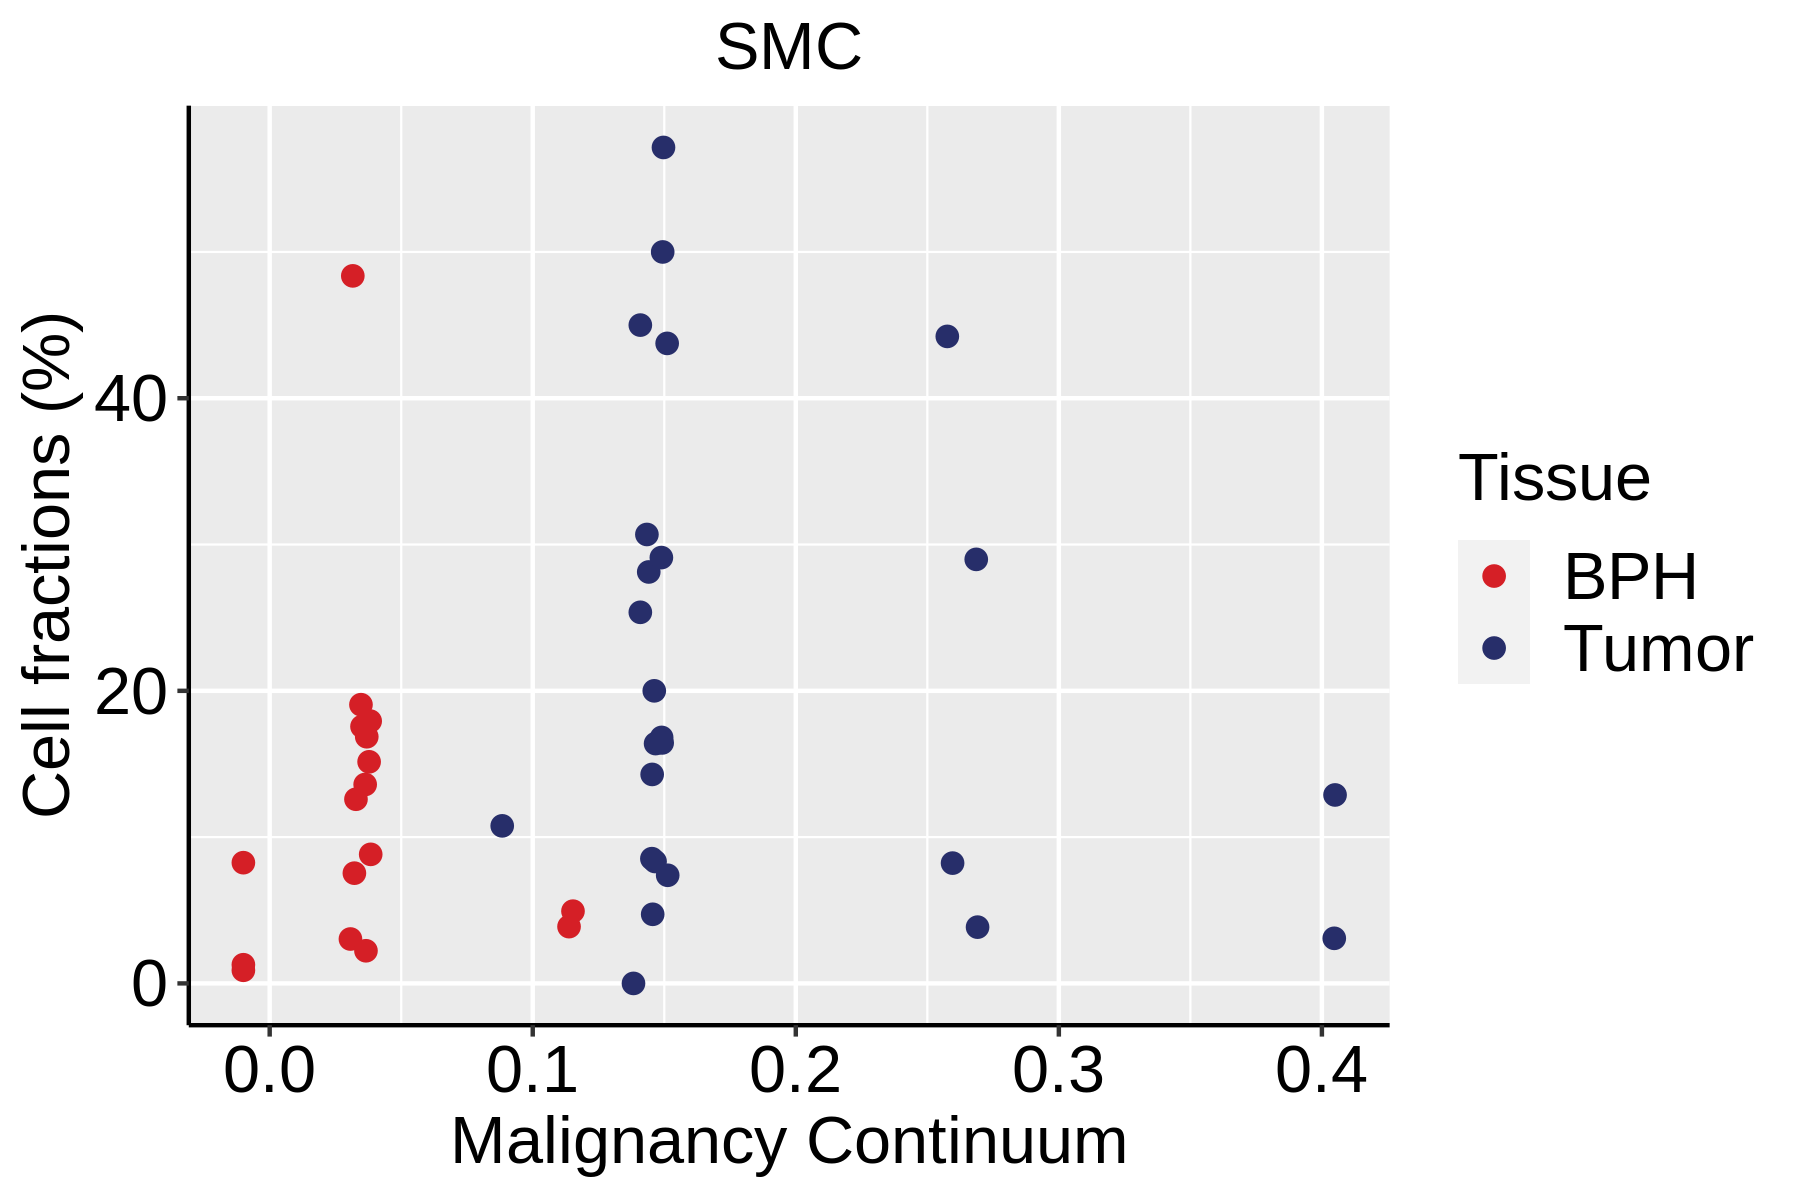
Fraction of cell type in each scRNA-seq sample plotted against position of the sample in the malignancy continuum for all cell types in the selected tissue. Samples are colored based on if they are derived from different Disease States.Fraction of cell type in each scRNA-seq sample plotted against position of the sample in the malignancy continuum for all cell types in the selected tissue. Samples are colored based on if they are derived from different Disease States.Fraction of cell type in each scRNA-seq sample plotted against position of the sample in the malignancy continuum for all cell types in the selected tissue. Samples are colored based on if they are derived from different Disease States.
∗Fraction of cell type in each scRNA-seq sample plotted against position of the sample in the malignancy continuum for all cell types in Prostate tissue. Samples are colored based on if they are derived from different Disease States. Cell fractions are computed by dividing the number of cells of a given cell type by the total number of cells in the compartment (epithelial versus immune versus stromal).
Page: 1 2 

Top

Cell lineage trajectory inference

Disease StateEpitheliaImmuneStromal
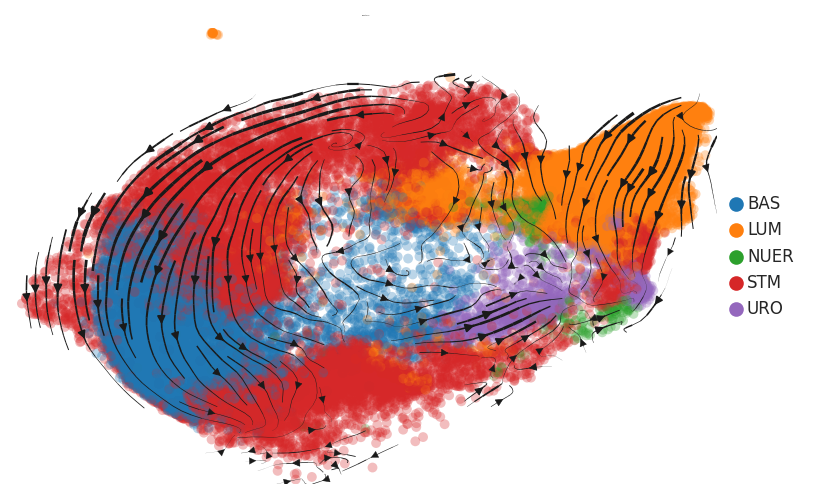
BPHTrajectory analysis of cells of epithelial compartment in BPH-derived samples of Prostate tissue by using scvelo package in Python.Trajectory analysis of cells of immune compartment in BPH-derived samples of Prostate tissue by using scvelo package in Python.Trajectory analysis of cells of stromal compartment in BPH-derived samples of Prostate tissue by using scvelo package in Python.
∗RNA velocity maps for epithelial, immune and stromal compartments of Prostate tissue with different disease states.

Top

TF regulatory network analysis

Disease StateEpitheliaImmuneStromal
HealthyHeatmap representation of significantly different TFs among all cell types of epithelial compartment in Healthy-derived samples of Prostate tissue by comparing their average AUC by using pySCENIC in Python.Heatmap representation of significantly different TFs among all cell types of immune compartment in Healthy-derived samples of Prostate tissue by comparing their average AUC by using pySCENIC in Python.Heatmap representation of significantly different TFs among all cell types of stromal compartment in Healthy-derived samples of Prostate tissue by comparing their average AUC by using pySCENIC in Python.
TF target networkTF target networkTF target network
ADJHeatmap representation of significantly different TFs among all cell types of epithelial compartment in ADJ-derived samples of Prostate tissue by comparing their average AUC by using pySCENIC in Python.Heatmap representation of significantly different TFs among all cell types of immune compartment in ADJ-derived samples of Prostate tissue by comparing their average AUC by using pySCENIC in Python.Heatmap representation of significantly different TFs among all cell types of stromal compartment in ADJ-derived samples of Prostate tissue by comparing their average AUC by using pySCENIC in Python.
TF target networkTF target networkTF target network
BPHHeatmap representation of significantly different TFs among all cell types of epithelial compartment in BPH-derived samples of Prostate tissue by comparing their average AUC by using pySCENIC in Python.Heatmap representation of significantly different TFs among all cell types of immune compartment in BPH-derived samples of Prostate tissue by comparing their average AUC by using pySCENIC in Python.Heatmap representation of significantly different TFs among all cell types of stromal compartment in BPH-derived samples of Prostate tissue by comparing their average AUC by using pySCENIC in Python.
TF target networkTF target networkTF target network
TumorHeatmap representation of significantly different TFs among all cell types of epithelial compartment in Tumor-derived samples of Prostate tissue by comparing their average AUC by using pySCENIC in Python.Heatmap representation of significantly different TFs among all cell types of immune compartment in Tumor-derived samples of Prostate tissue by comparing their average AUC by using pySCENIC in Python.Heatmap representation of significantly different TFs among all cell types of stromal compartment in Tumor-derived samples of Prostate tissue by comparing their average AUC by using pySCENIC in Python.
TF target networkTF target networkTF target network
∗Heatmap: Heatmap representation of significantly different TFs among all cell types of epithelial compartment in Healthy-derived samples of Prostate tissue by comparing their average AUC by using pySCENIC in Python. Regulon specific score for each cell type is colored.
∗Network: TF target network created from Healthy-derived samples of Prostate tissue using Top 50 predicted target genes of each regulon. Edge lengths are the inferred TF-target weightings.

Top

Cell-cell interaction analysis

Disease StateCell TypeCircleSourceTarget
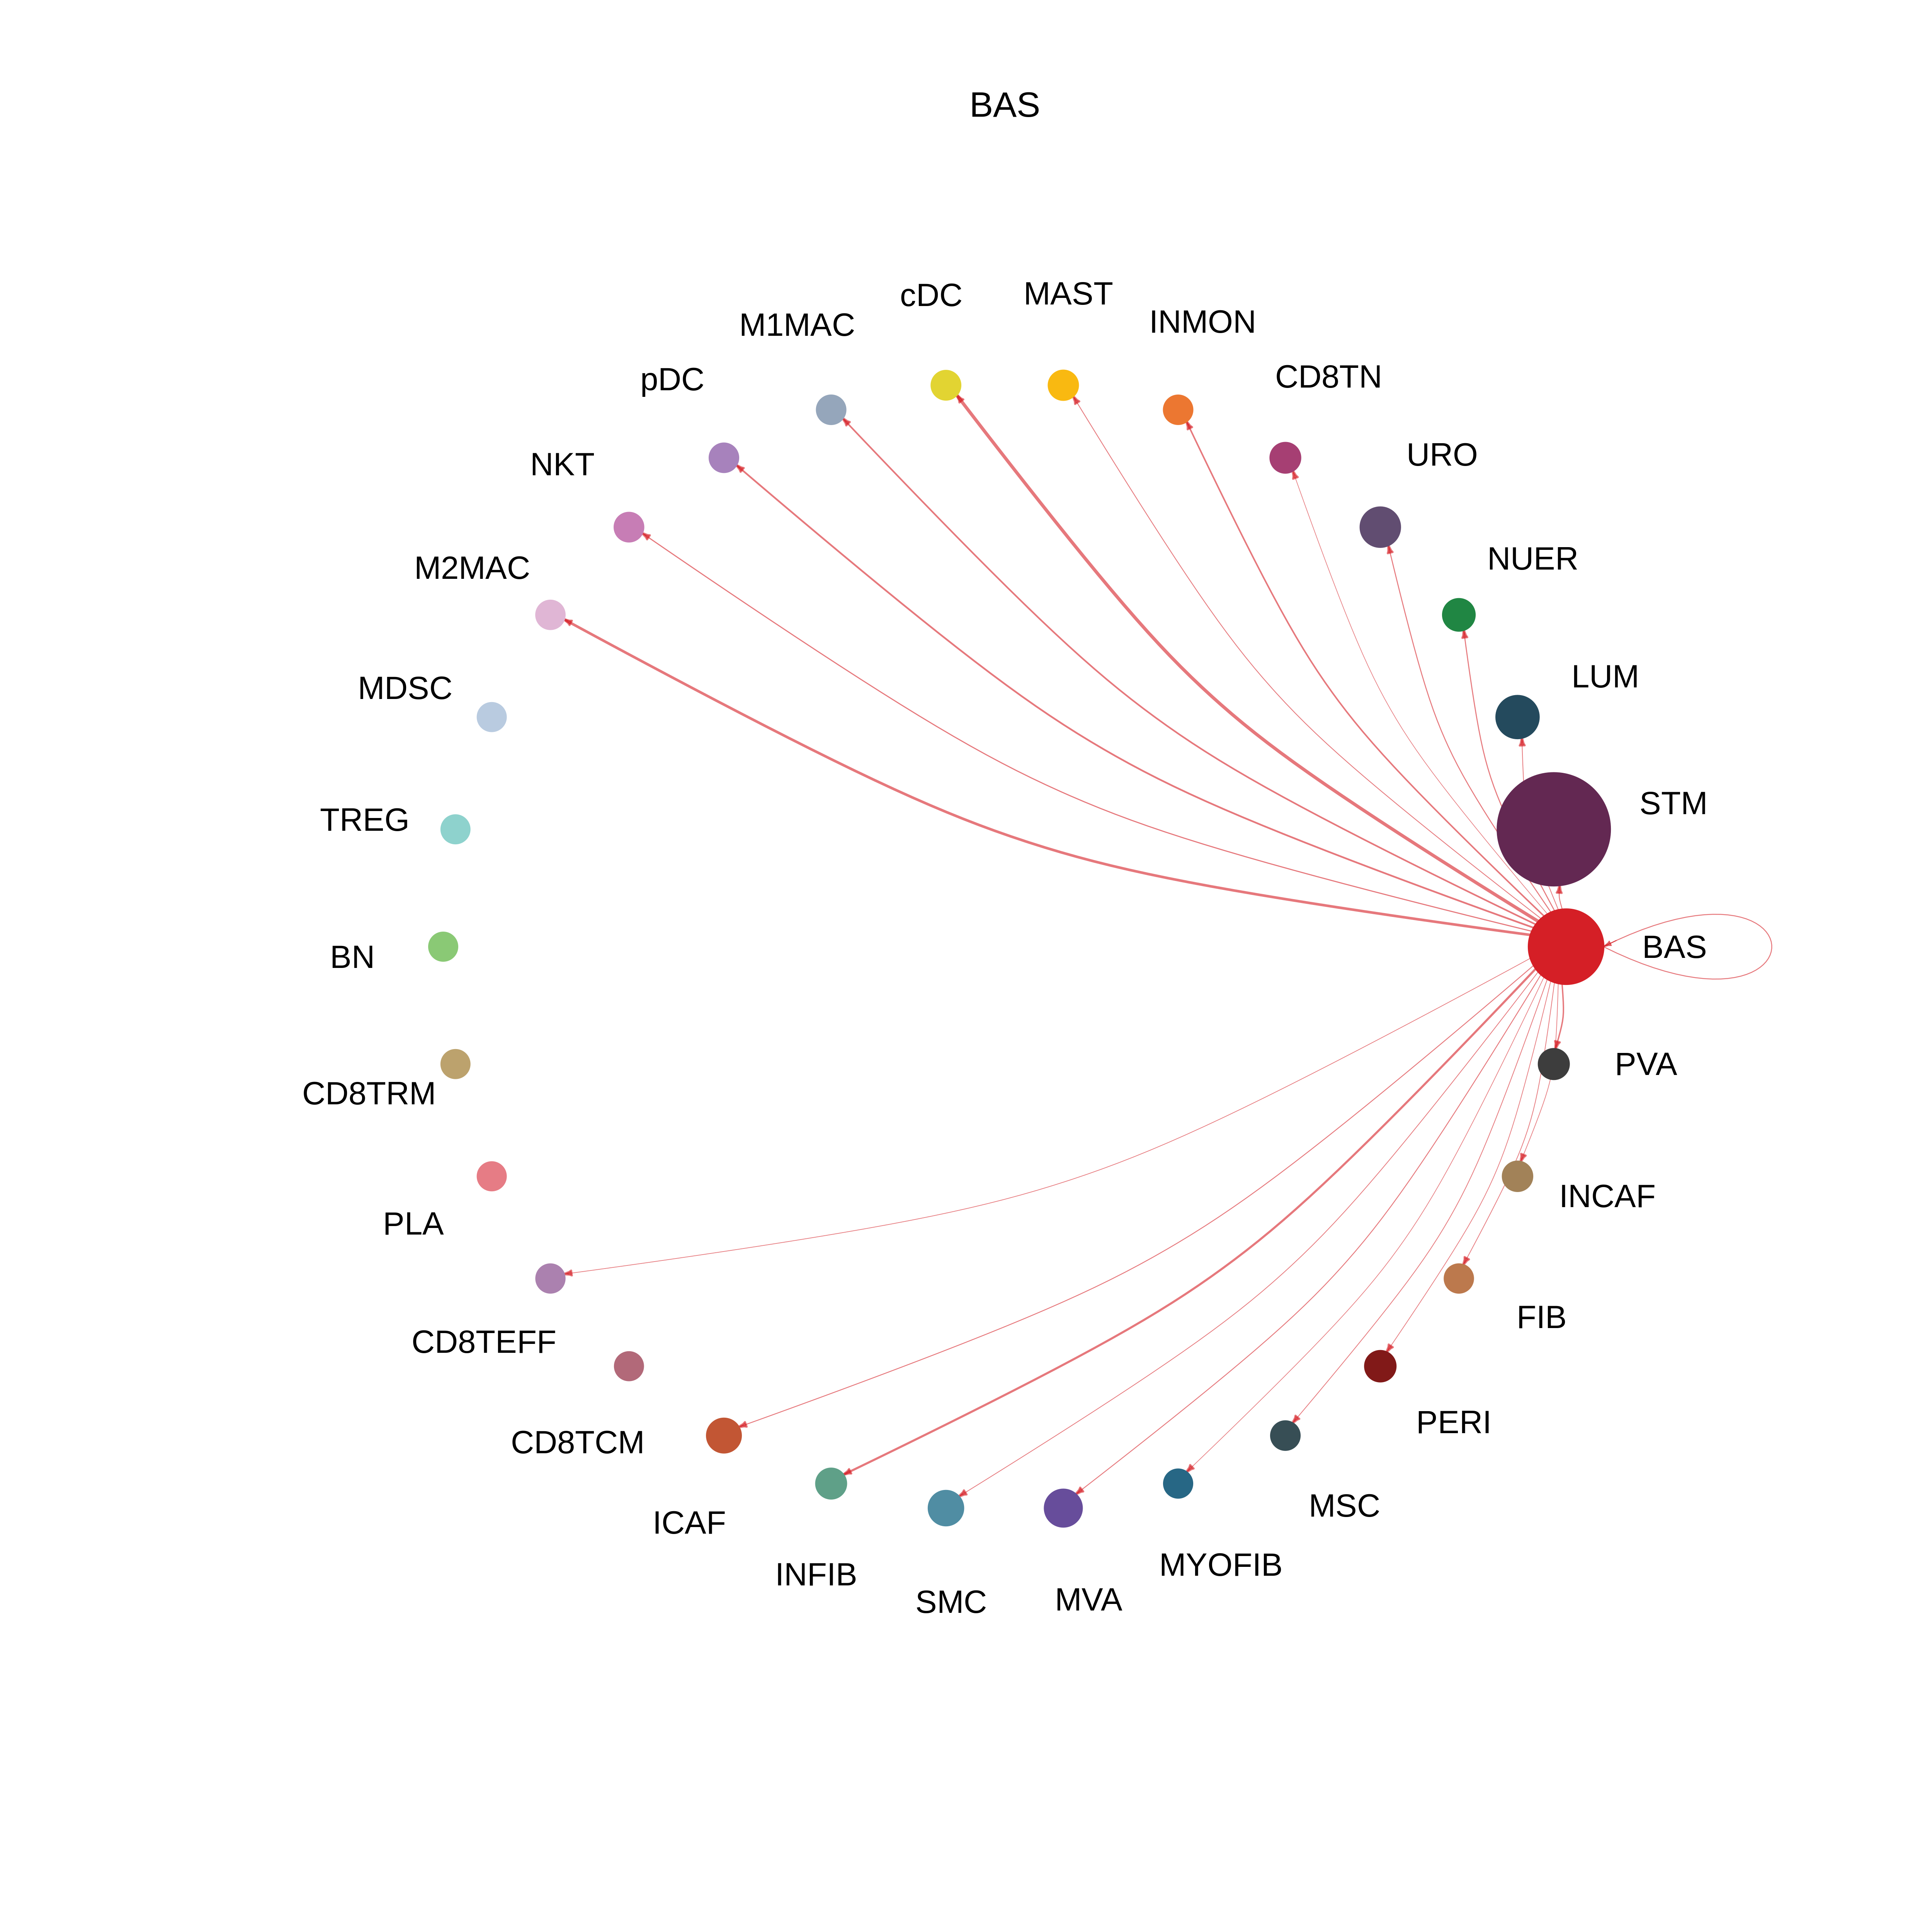
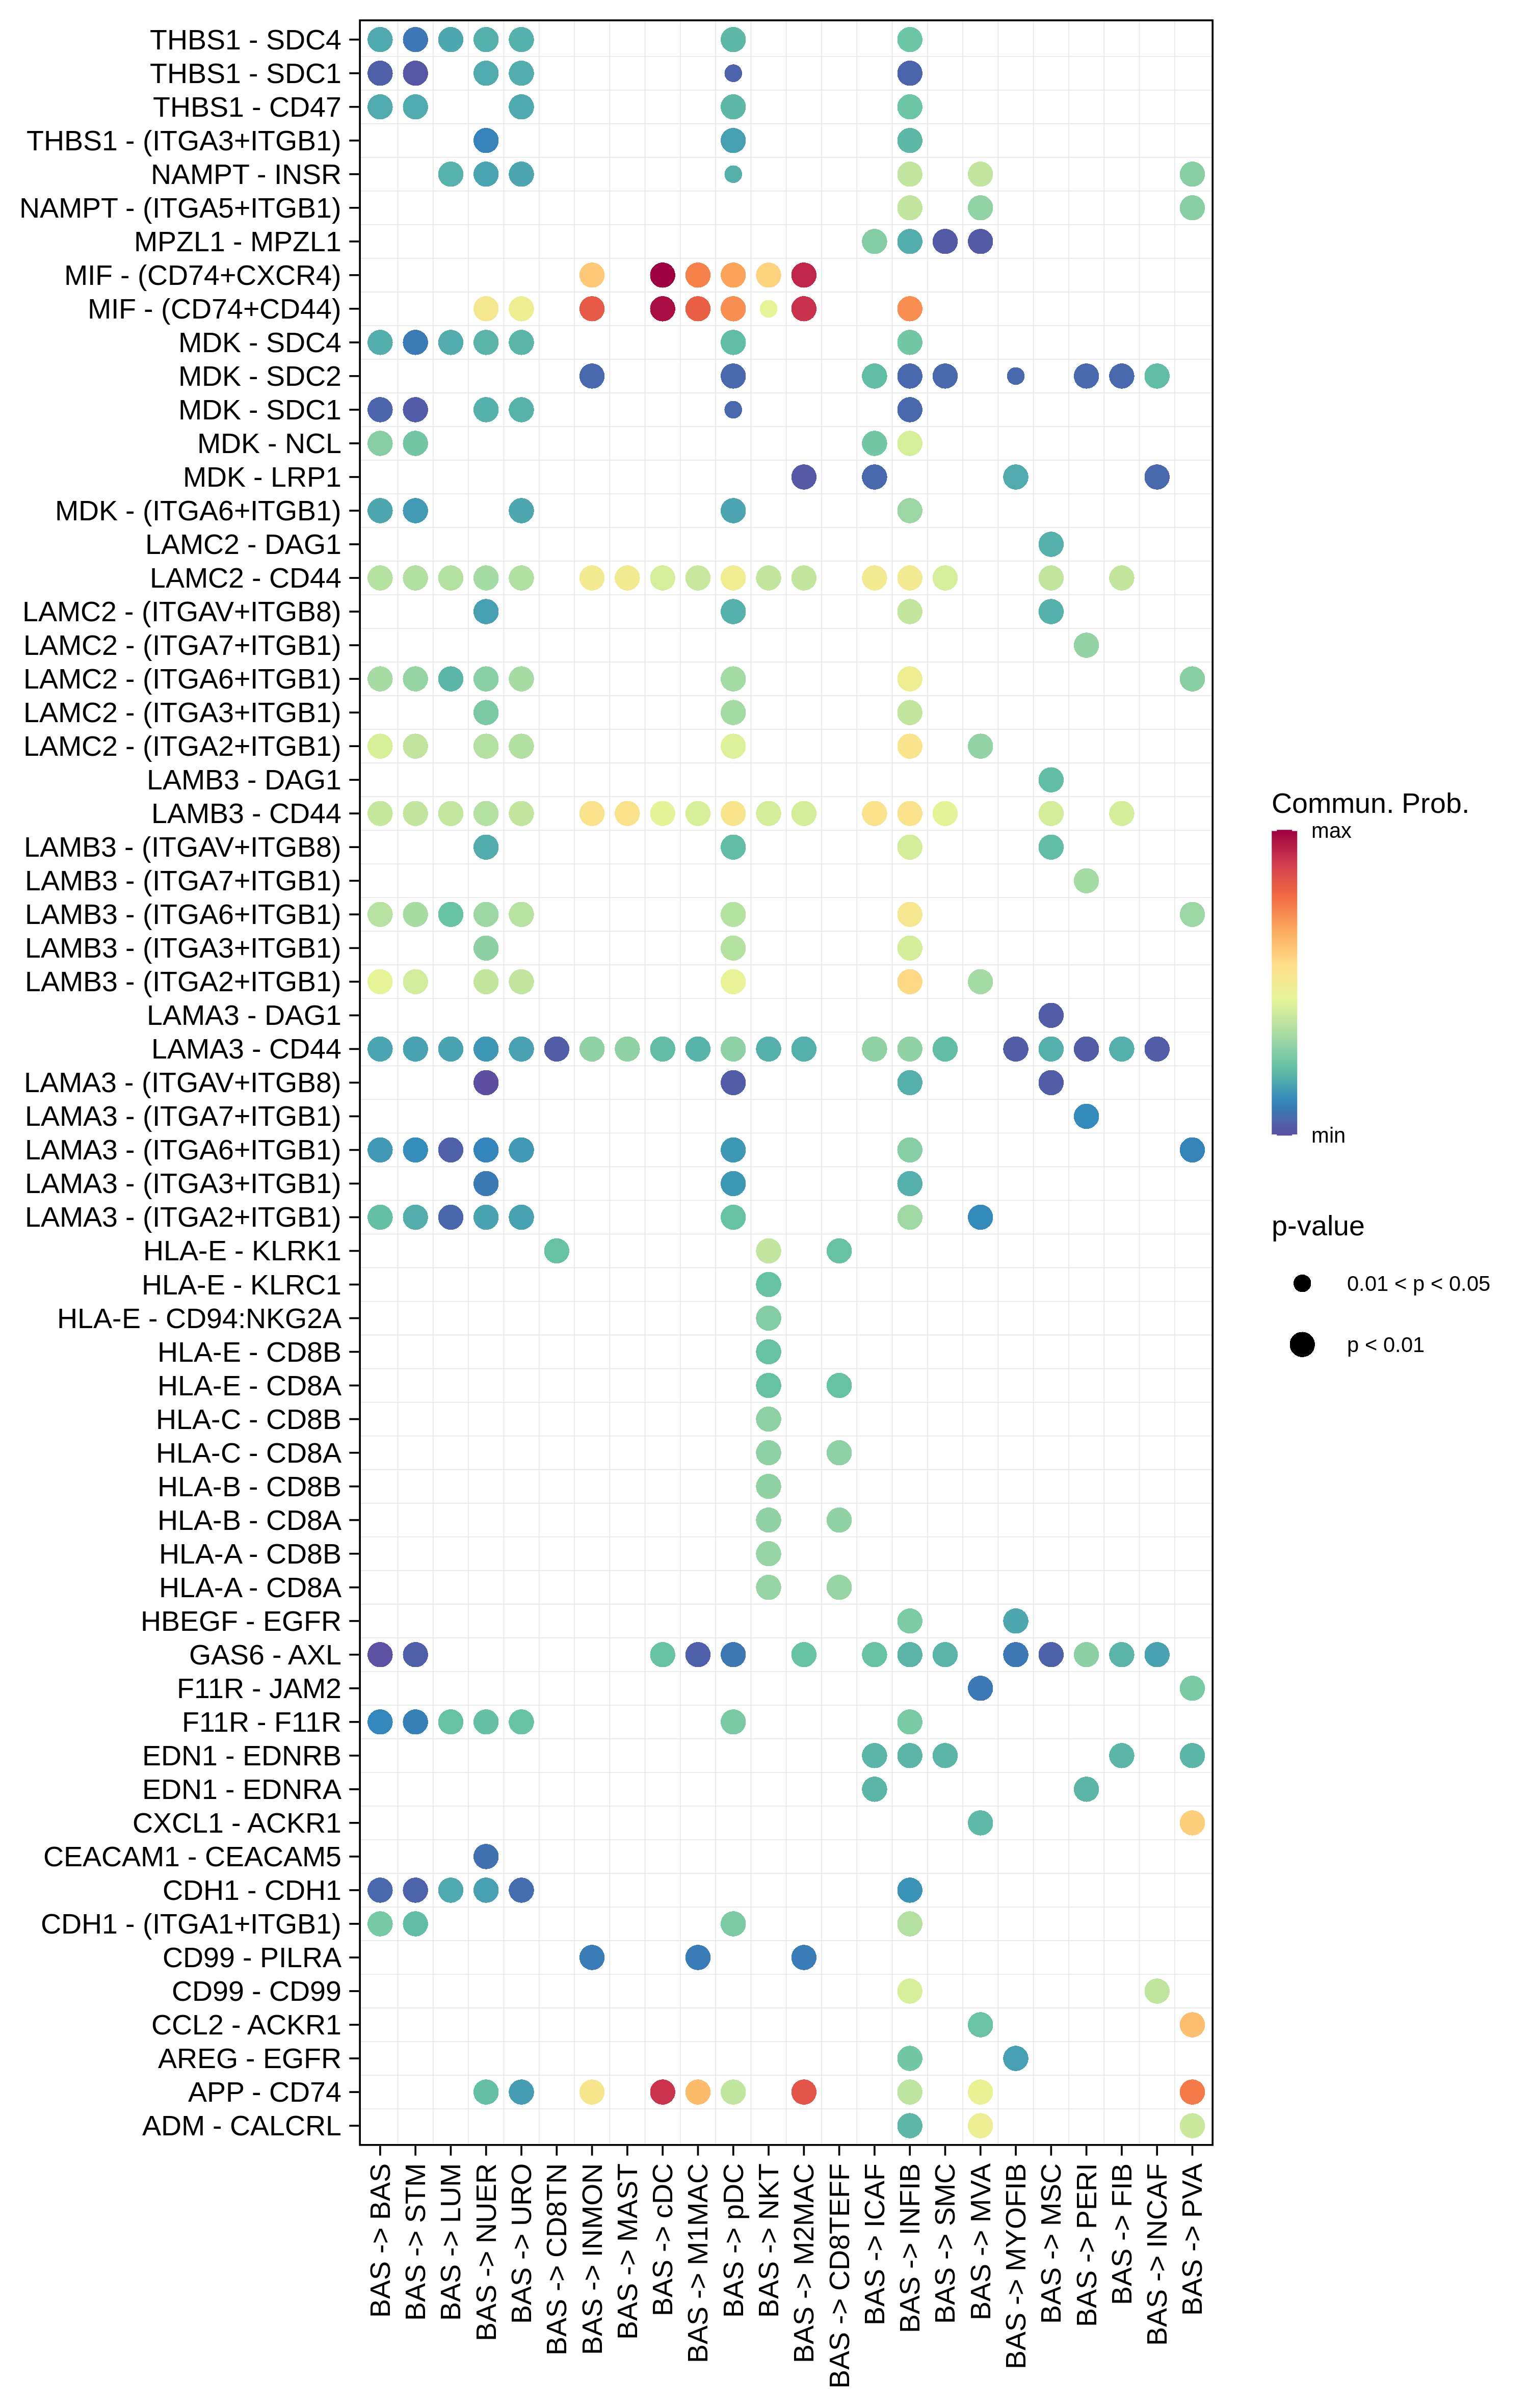
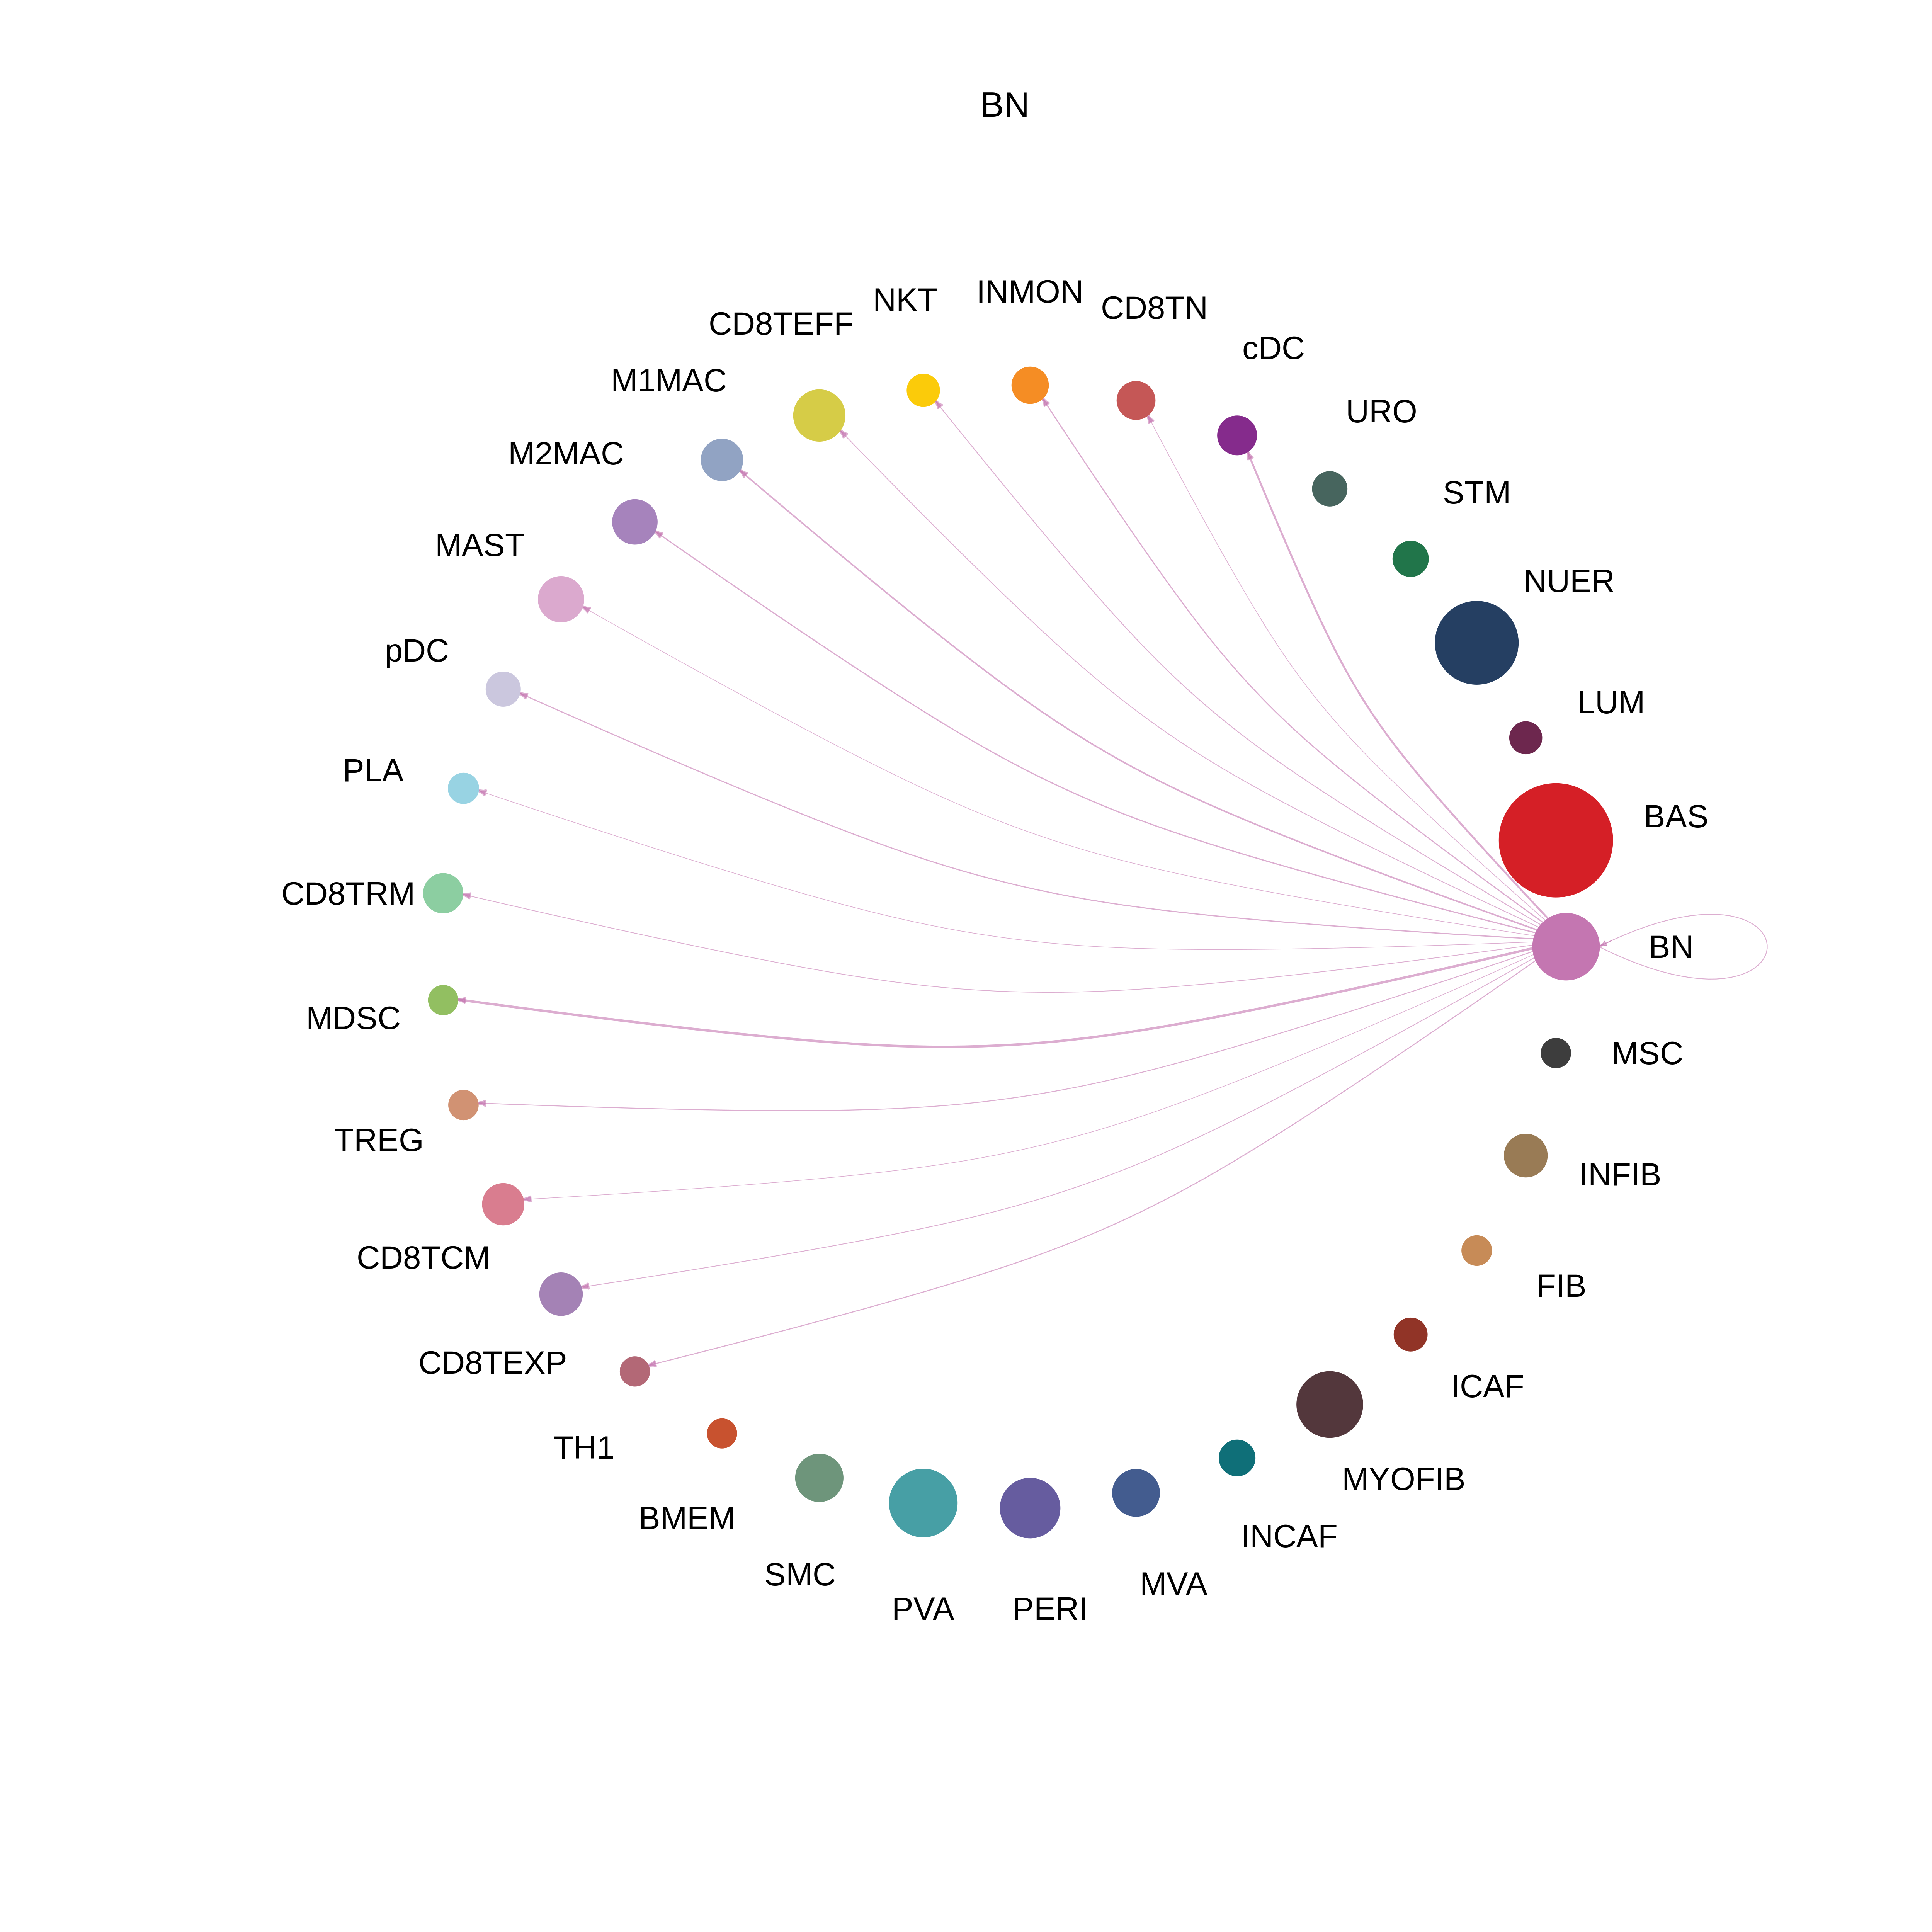
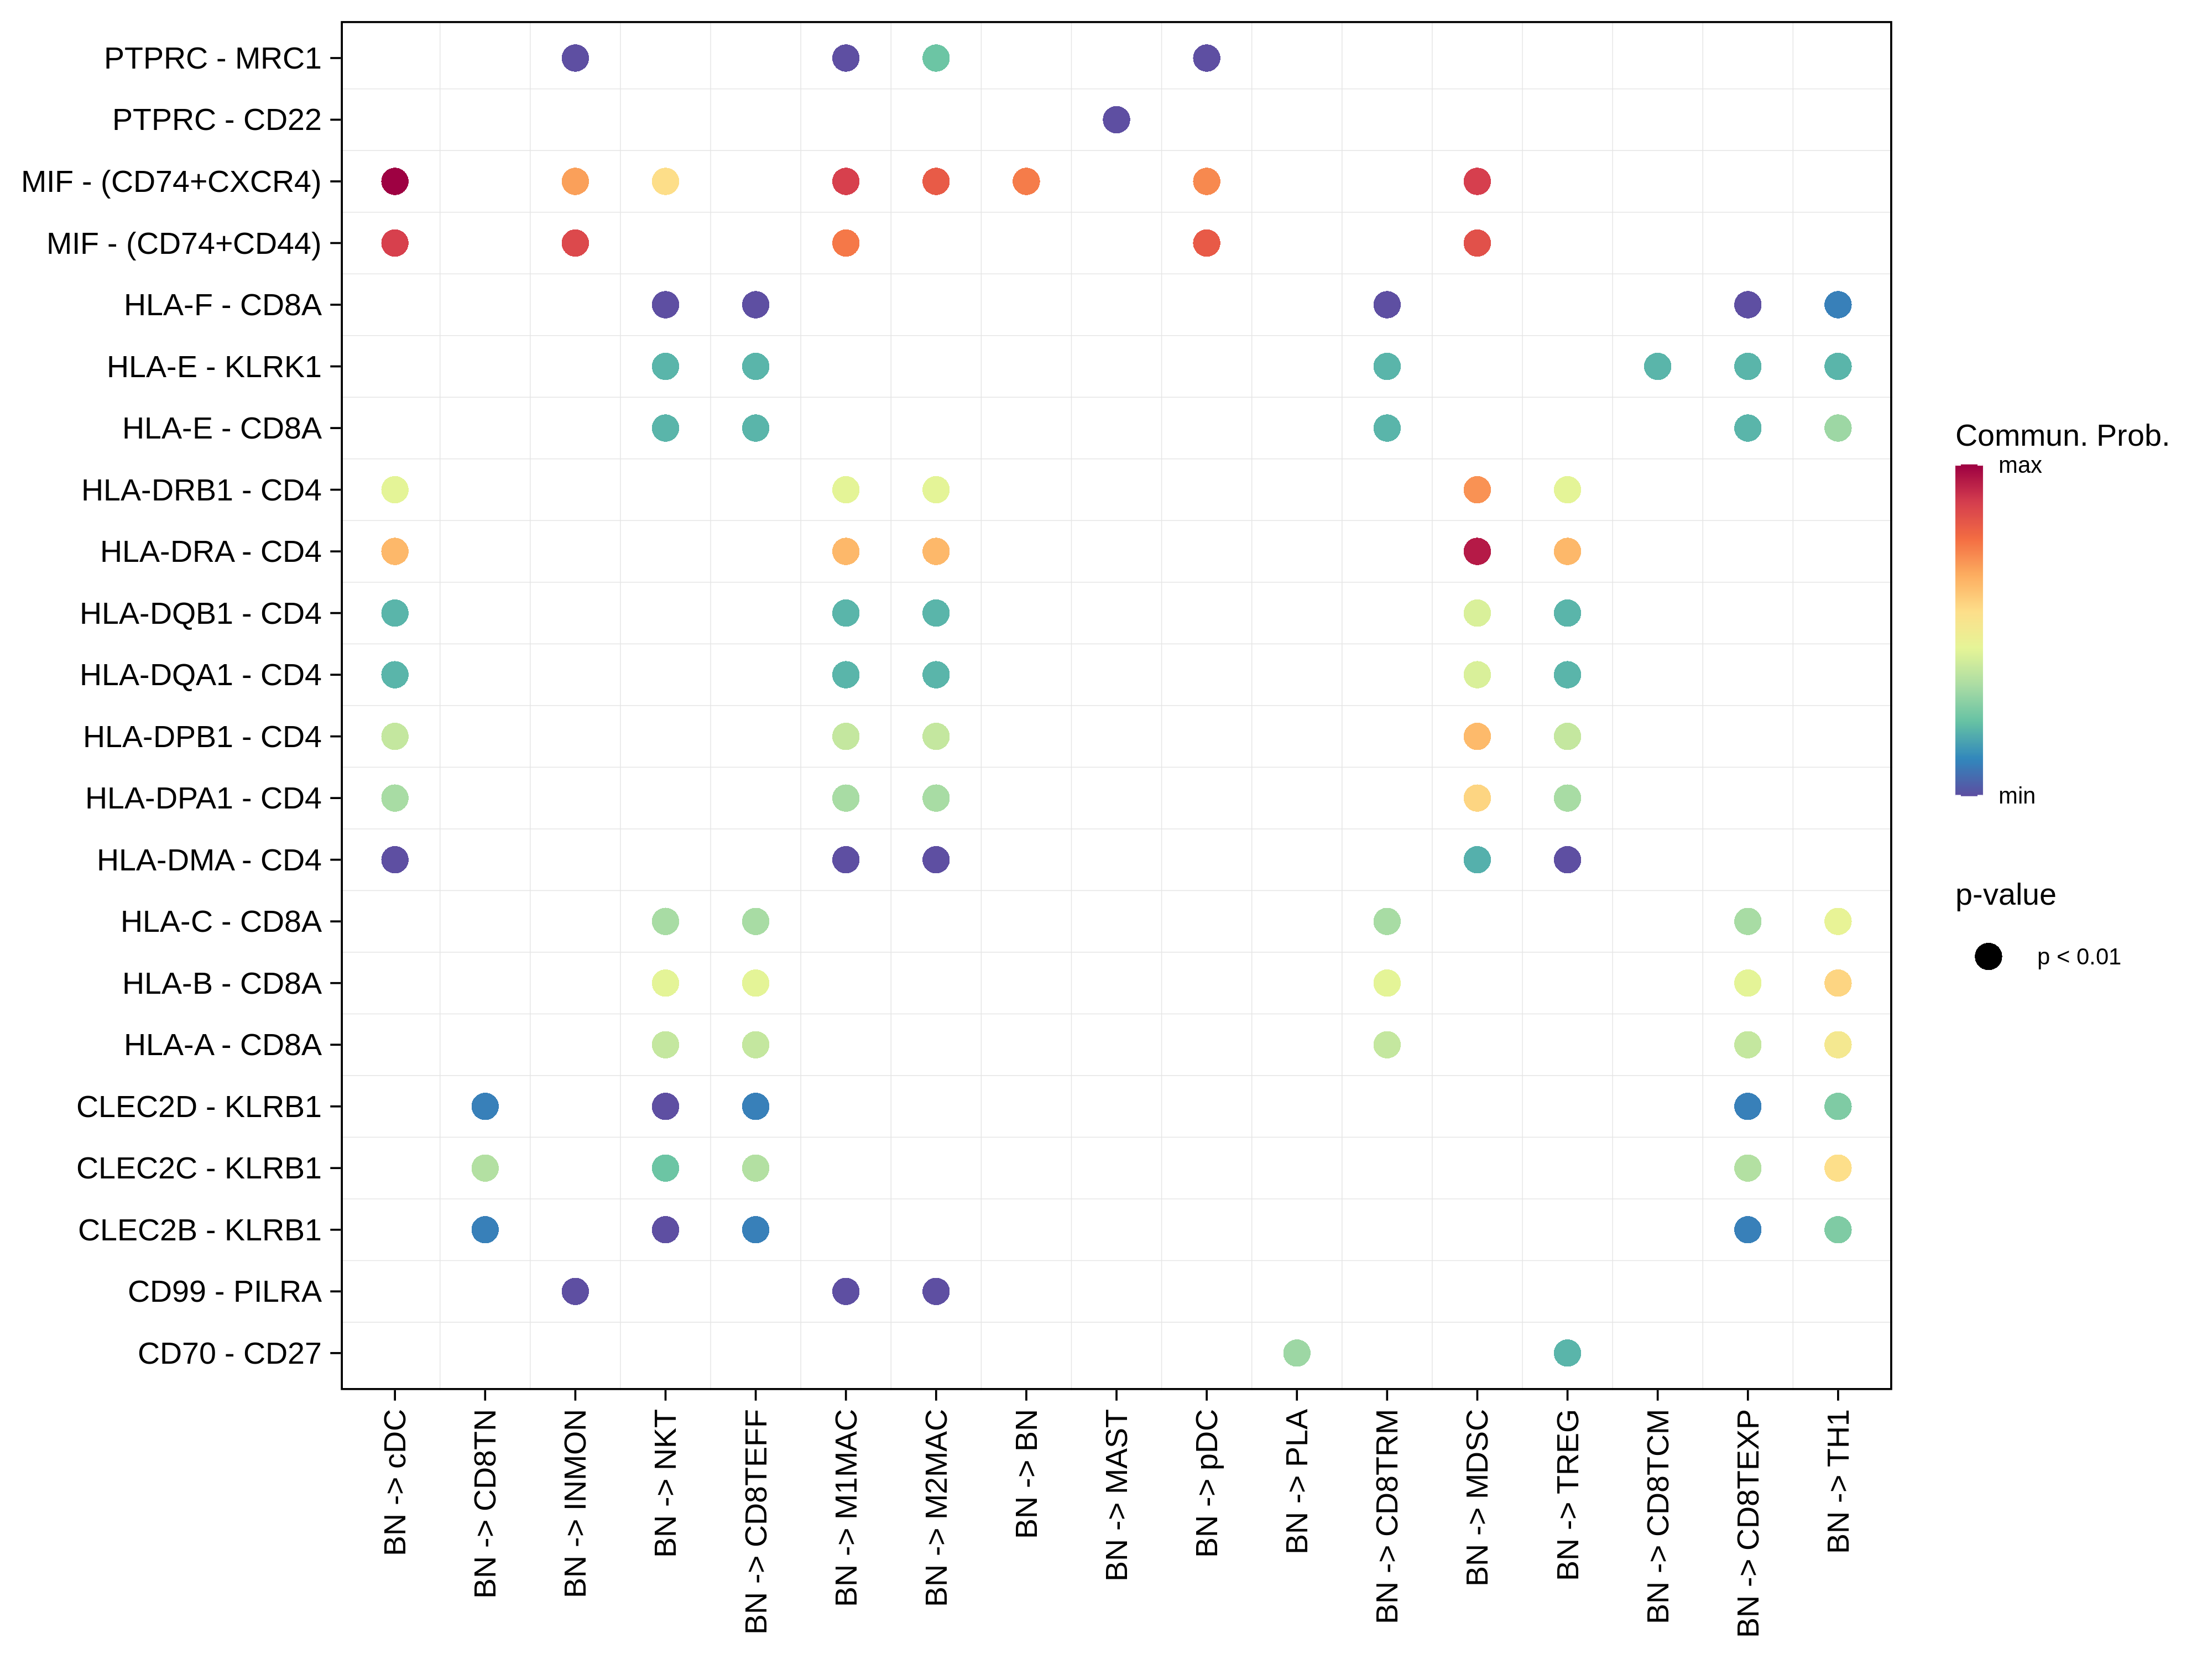
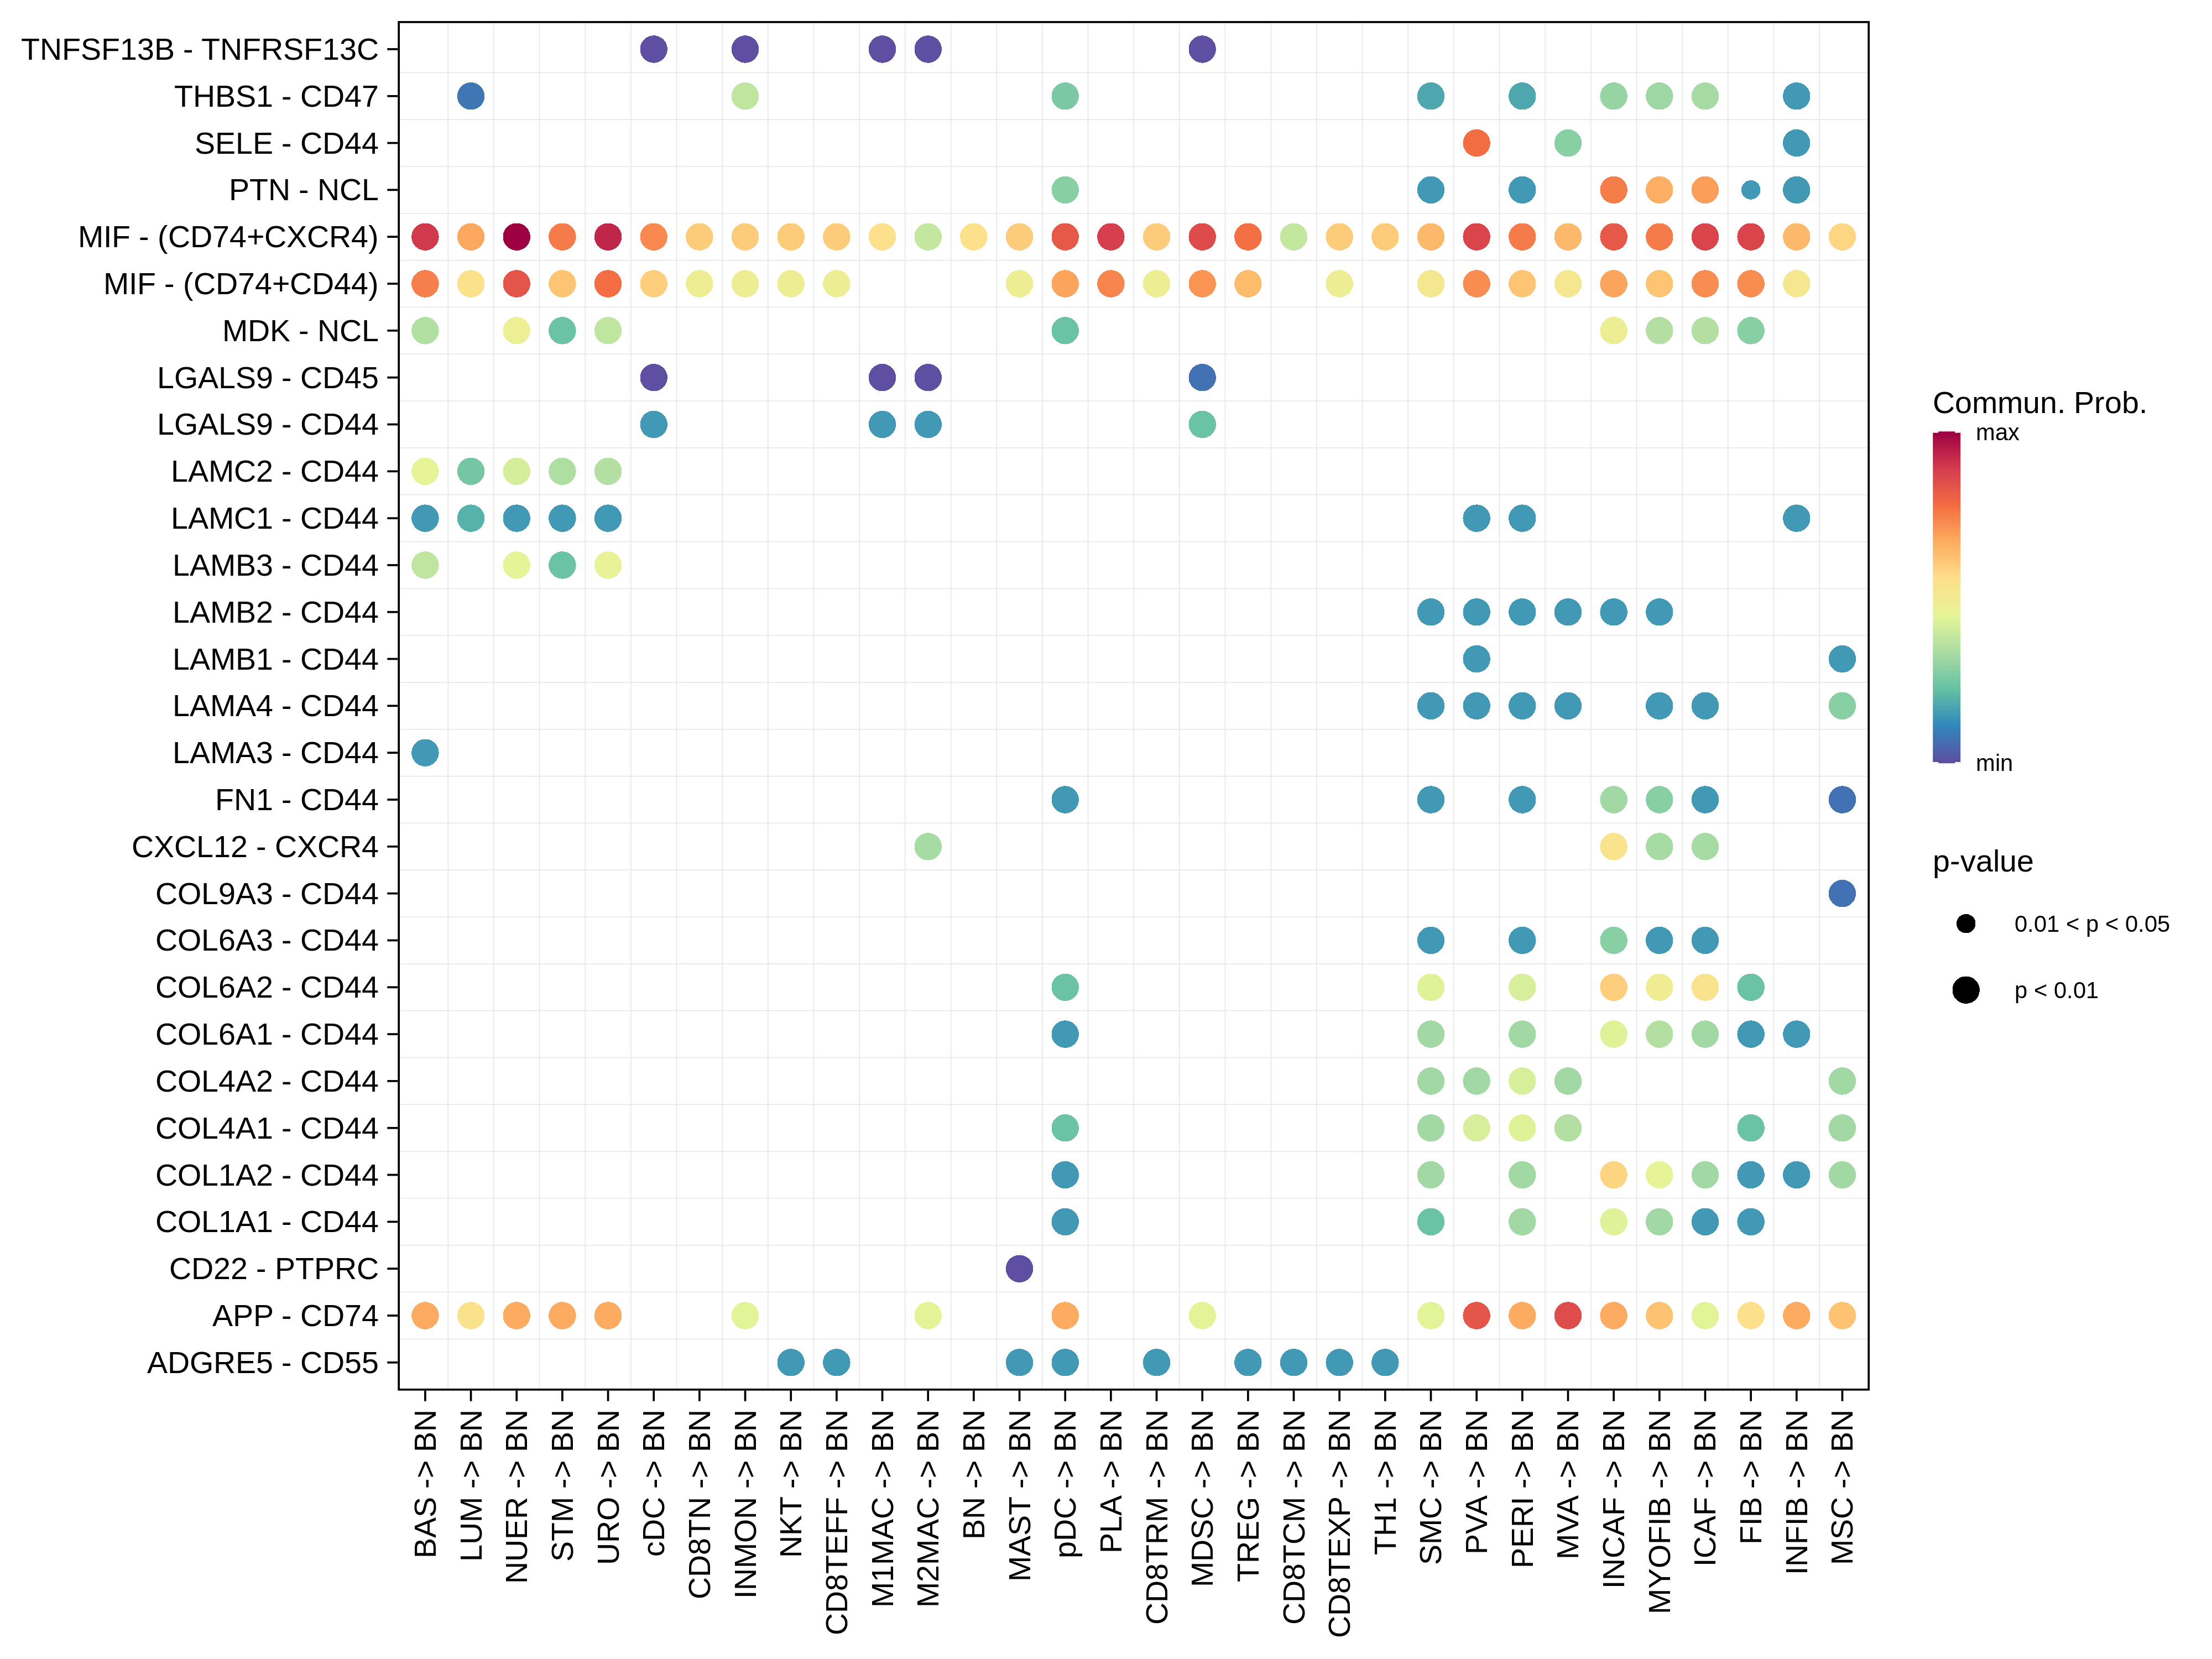
HealthyBASThe cell-cell communications between each two interacting cell types in Healthy-derived samples of the selected tissue. Different colors in the circle plot represent different cell groups and the edge width is proportional to the indicated number of ligand-receptor pairs.Bubble plot of proportion to the communication probability in significant signaling pathways between this cell type and its source cell population in Healthy-derived samples of the selected tissue. Each row represents the significant ligand and receptor gene pairs.Bubble plot of proportion to the communication probability in significant signaling pathways between this cell type and its target cell population in Healthy-derived samples of the selected tissue. Each row represents the significant ligand and receptor gene pairs.
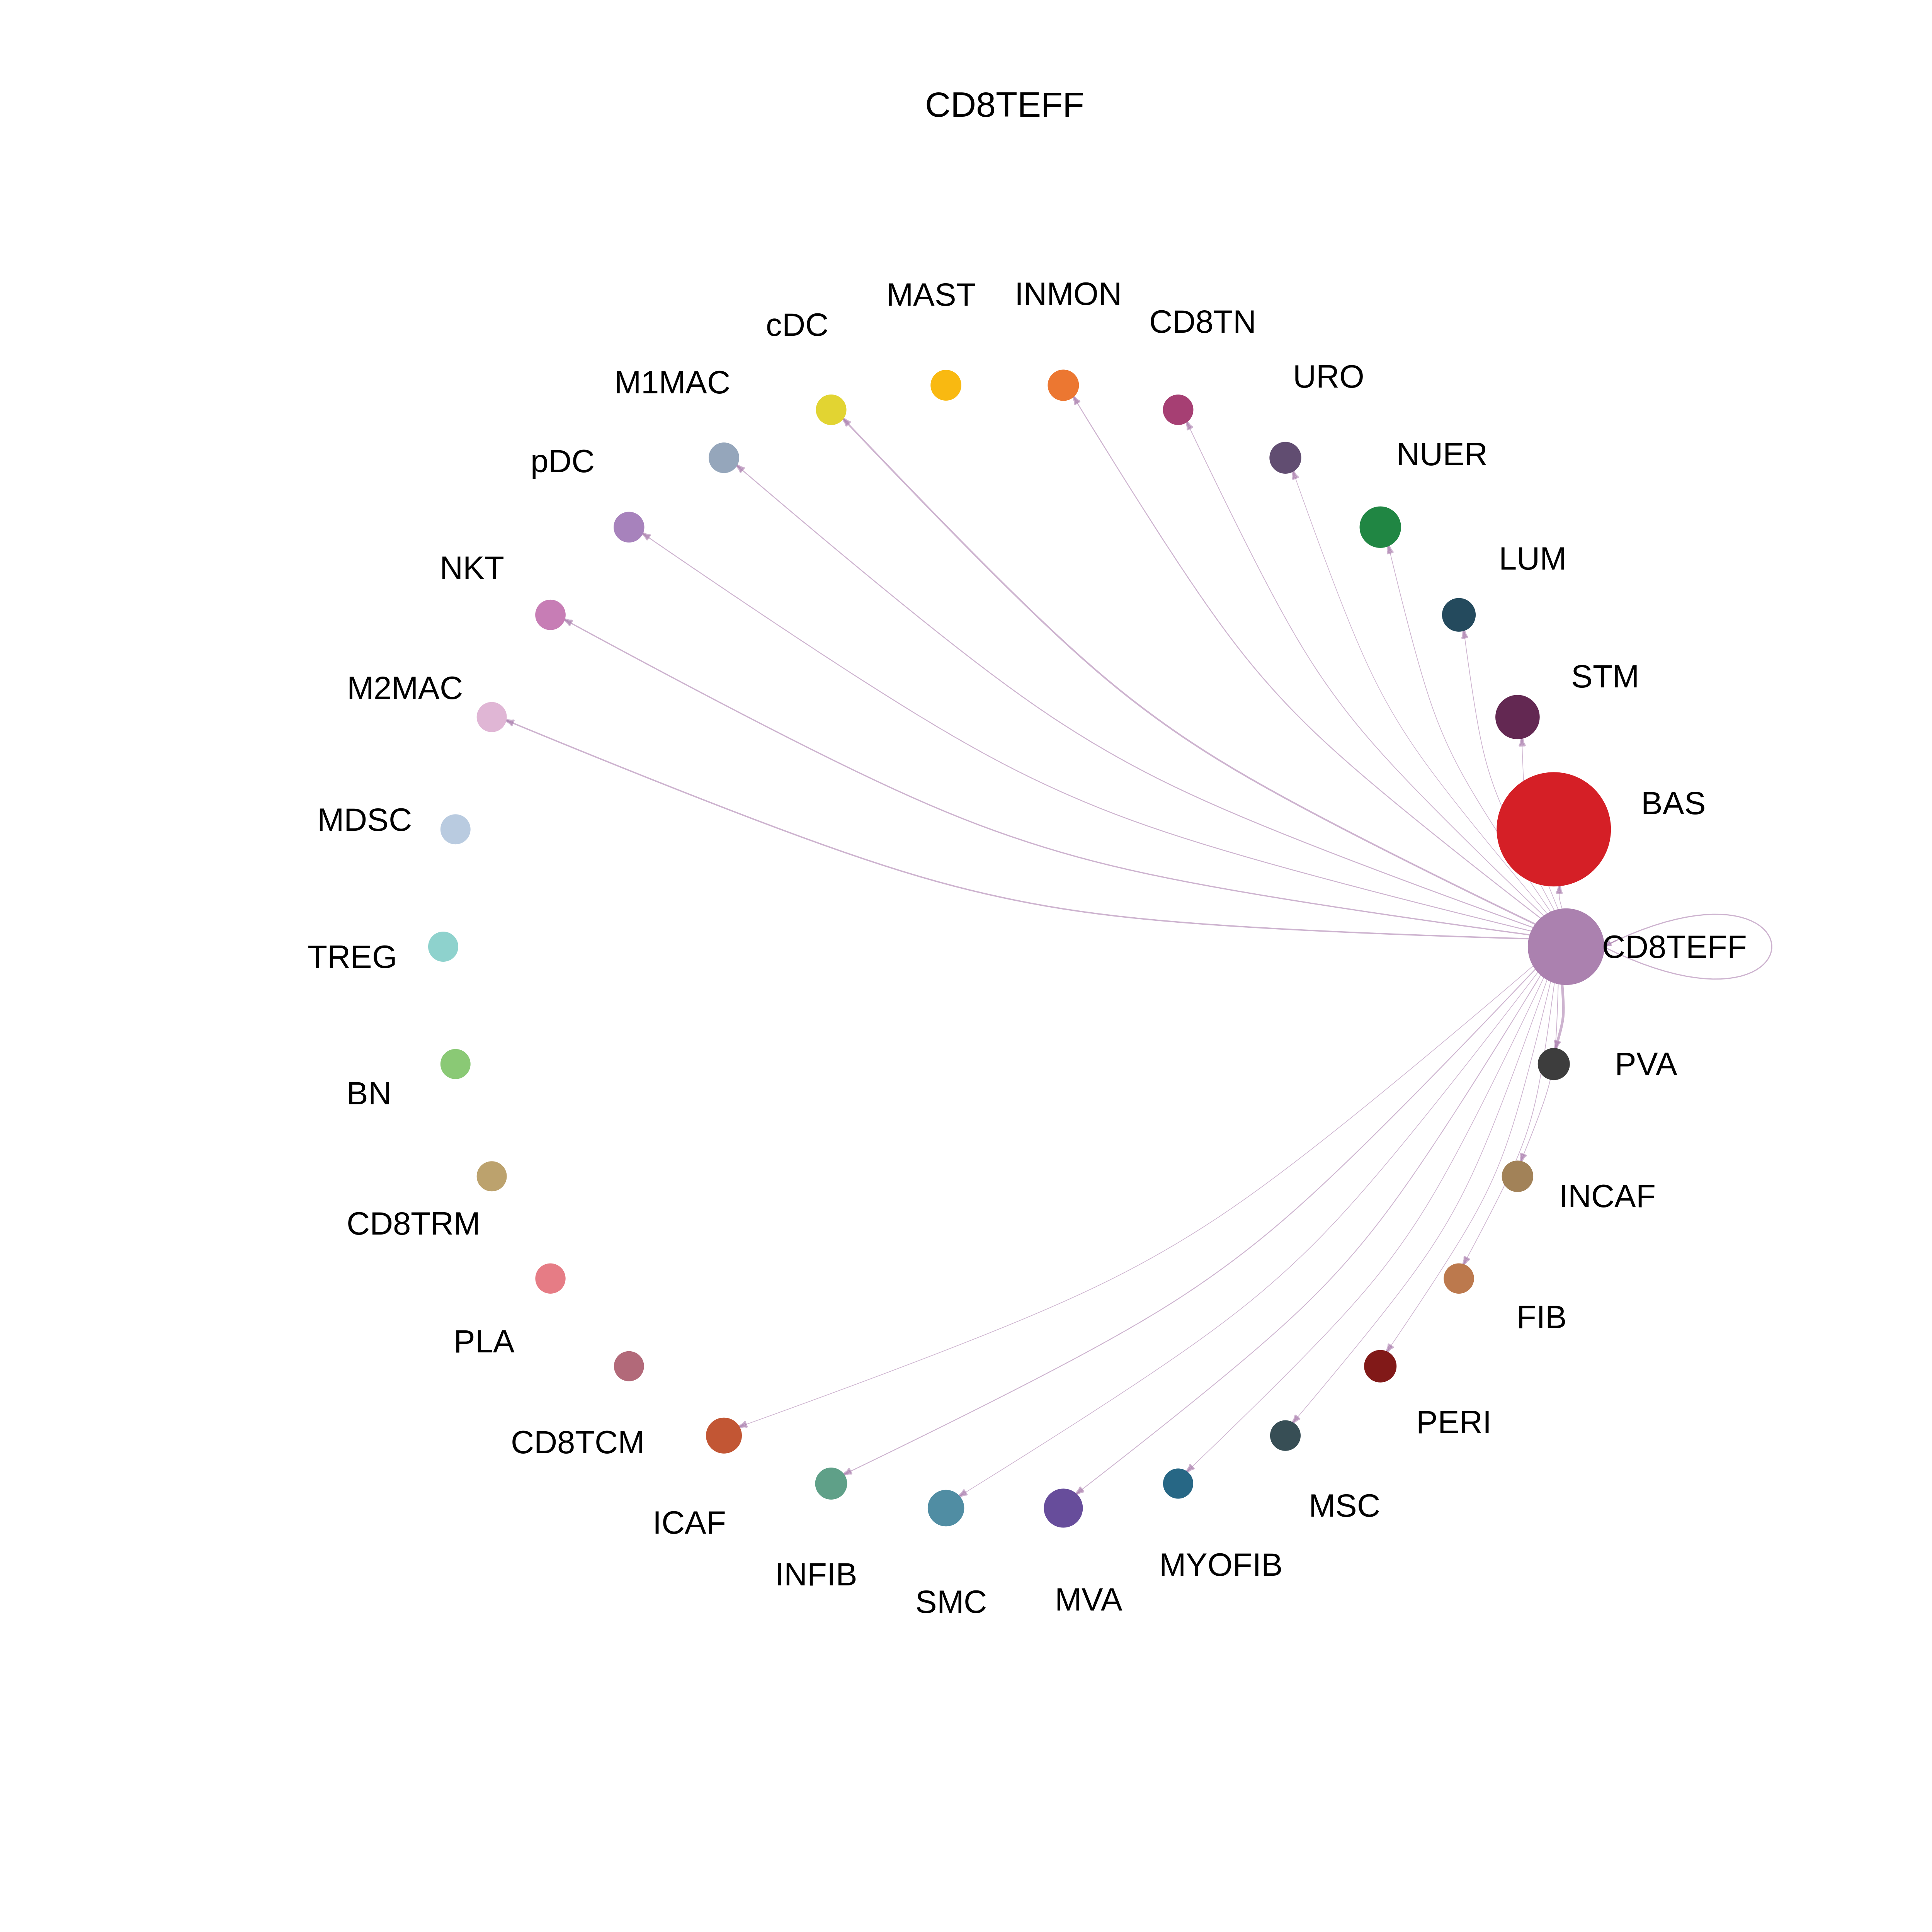
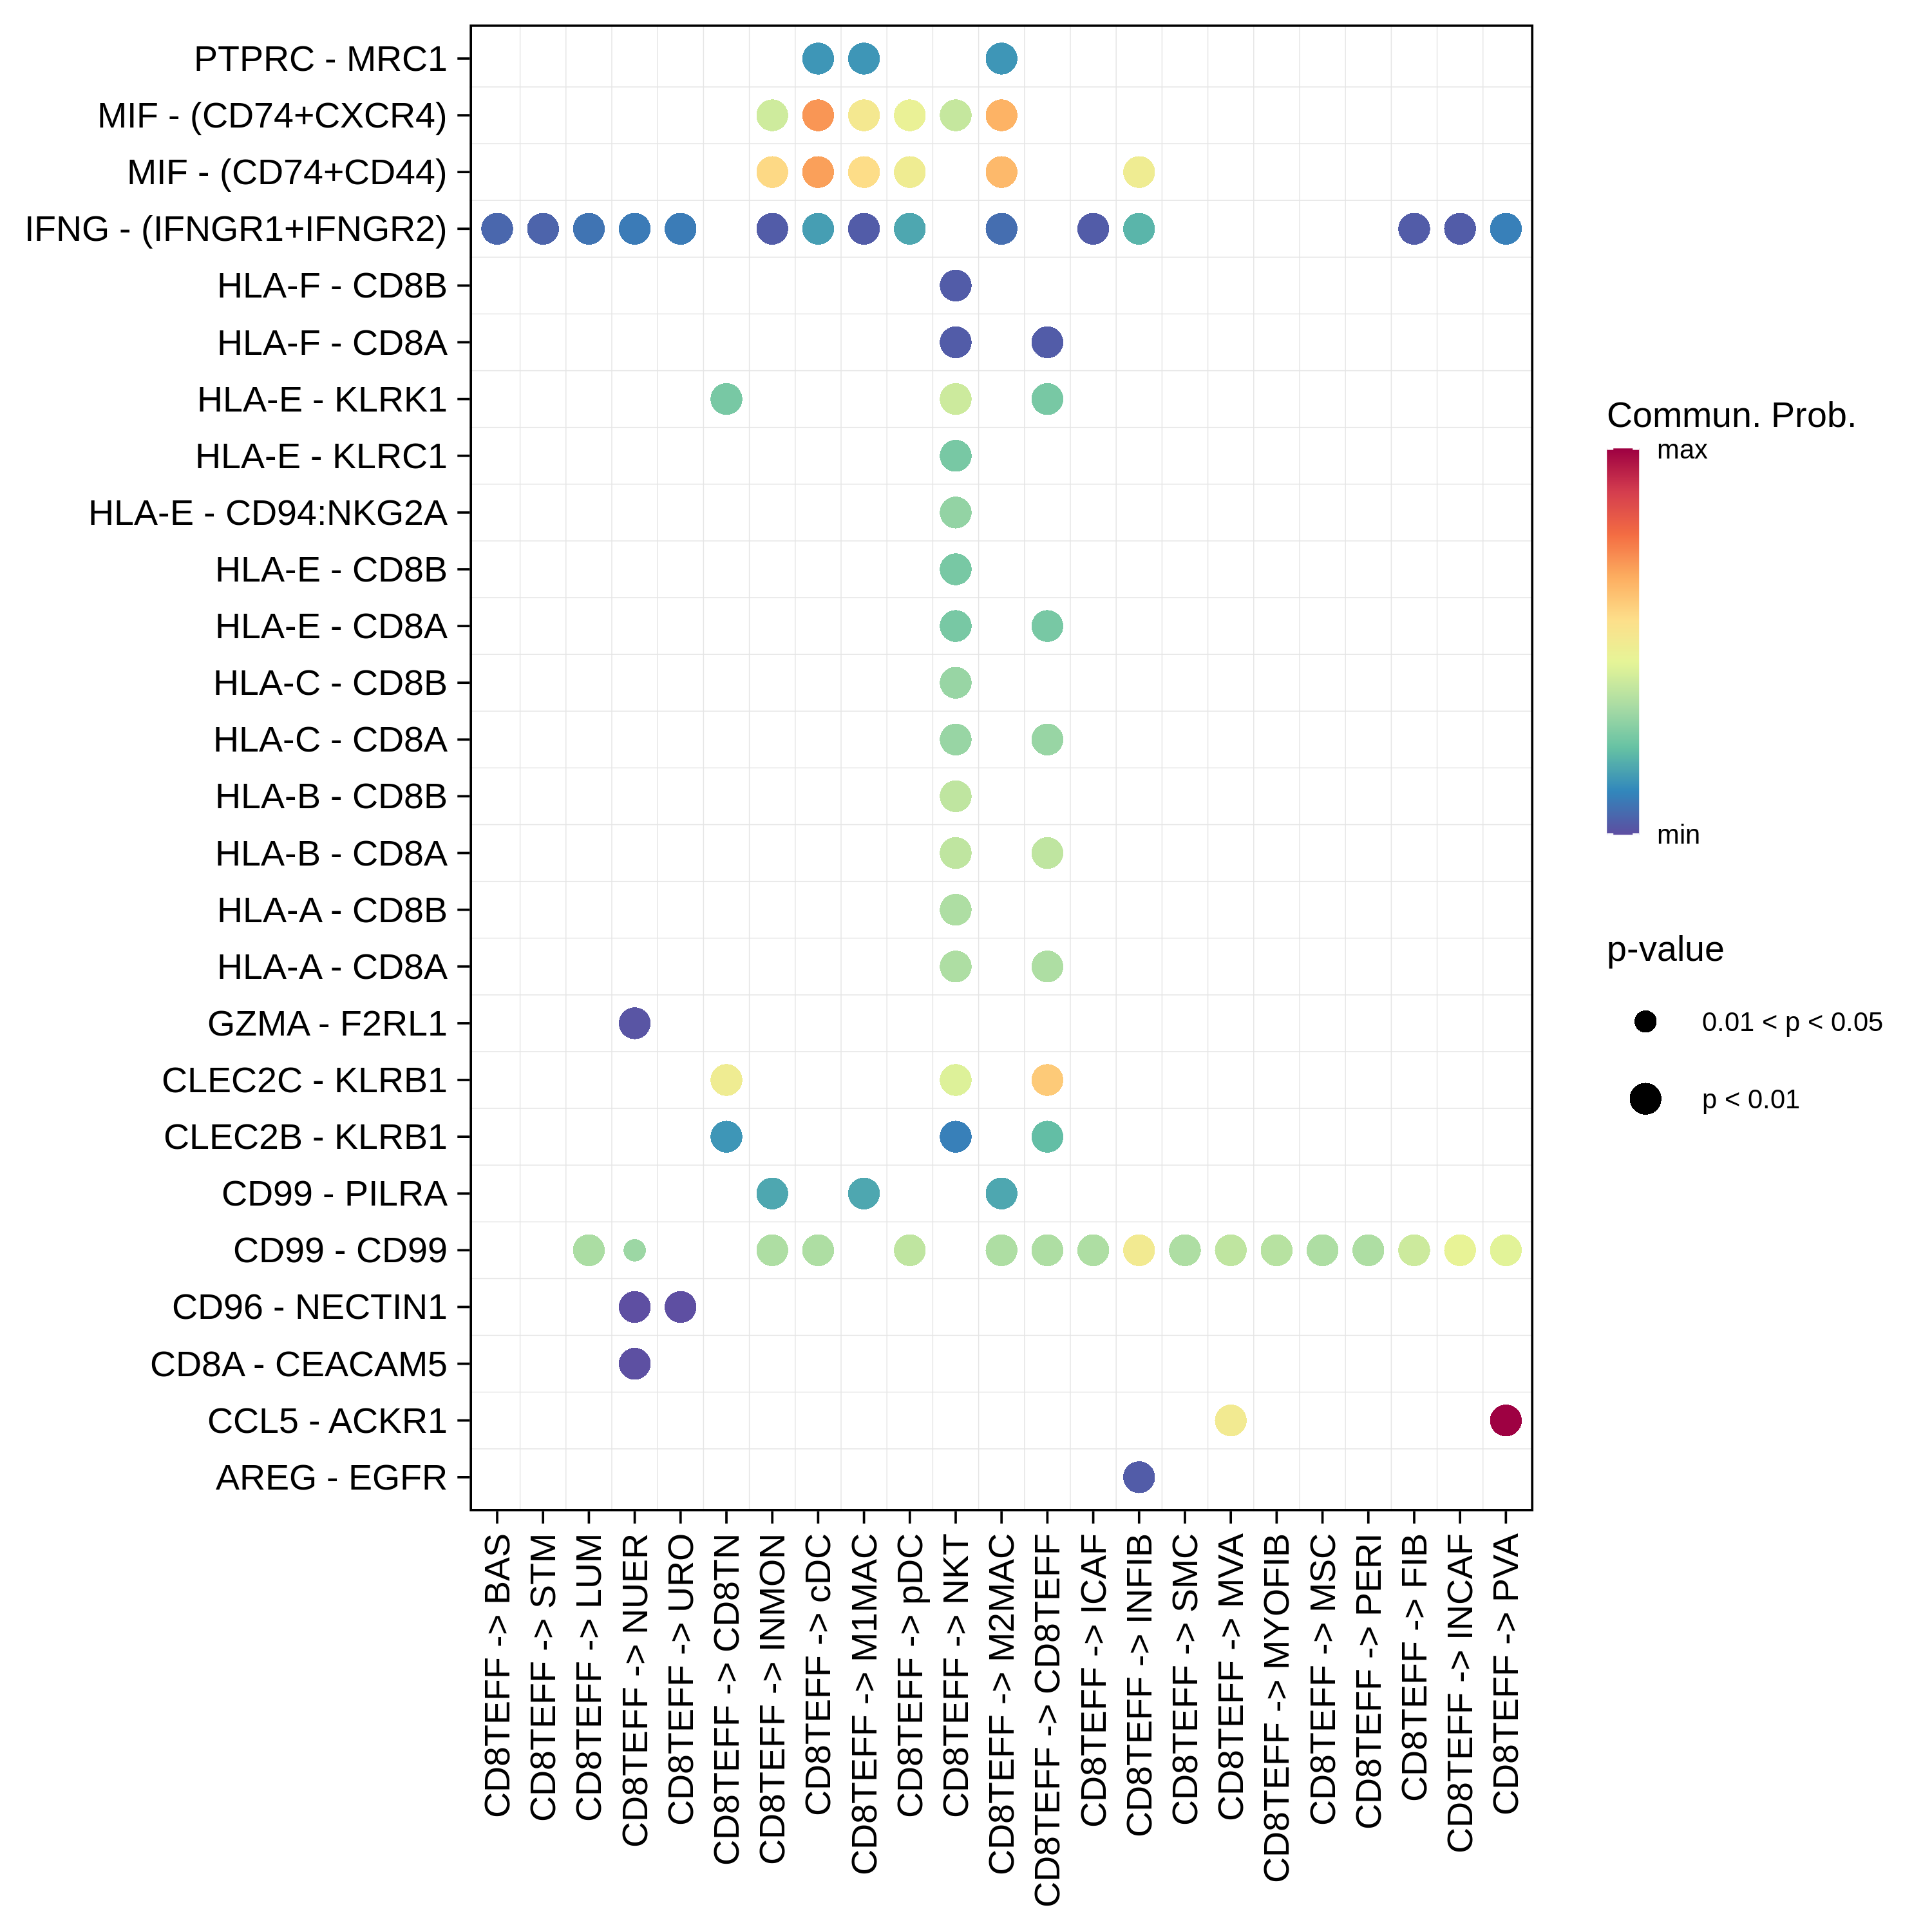
CD8TEFFThe cell-cell communications between each two interacting cell types in Healthy-derived samples of the selected tissue. Different colors in the circle plot represent different cell groups and the edge width is proportional to the indicated number of ligand-receptor pairs.Bubble plot of proportion to the communication probability in significant signaling pathways between this cell type and its source cell population in Healthy-derived samples of the selected tissue. Each row represents the significant ligand and receptor gene pairs.Bubble plot of proportion to the communication probability in significant signaling pathways between this cell type and its target cell population in Healthy-derived samples of the selected tissue. Each row represents the significant ligand and receptor gene pairs.
Page: 1 2 3 4 5 6 7 8 9 10 11 12 

Disease StateCell TypeCircleSourceTarget
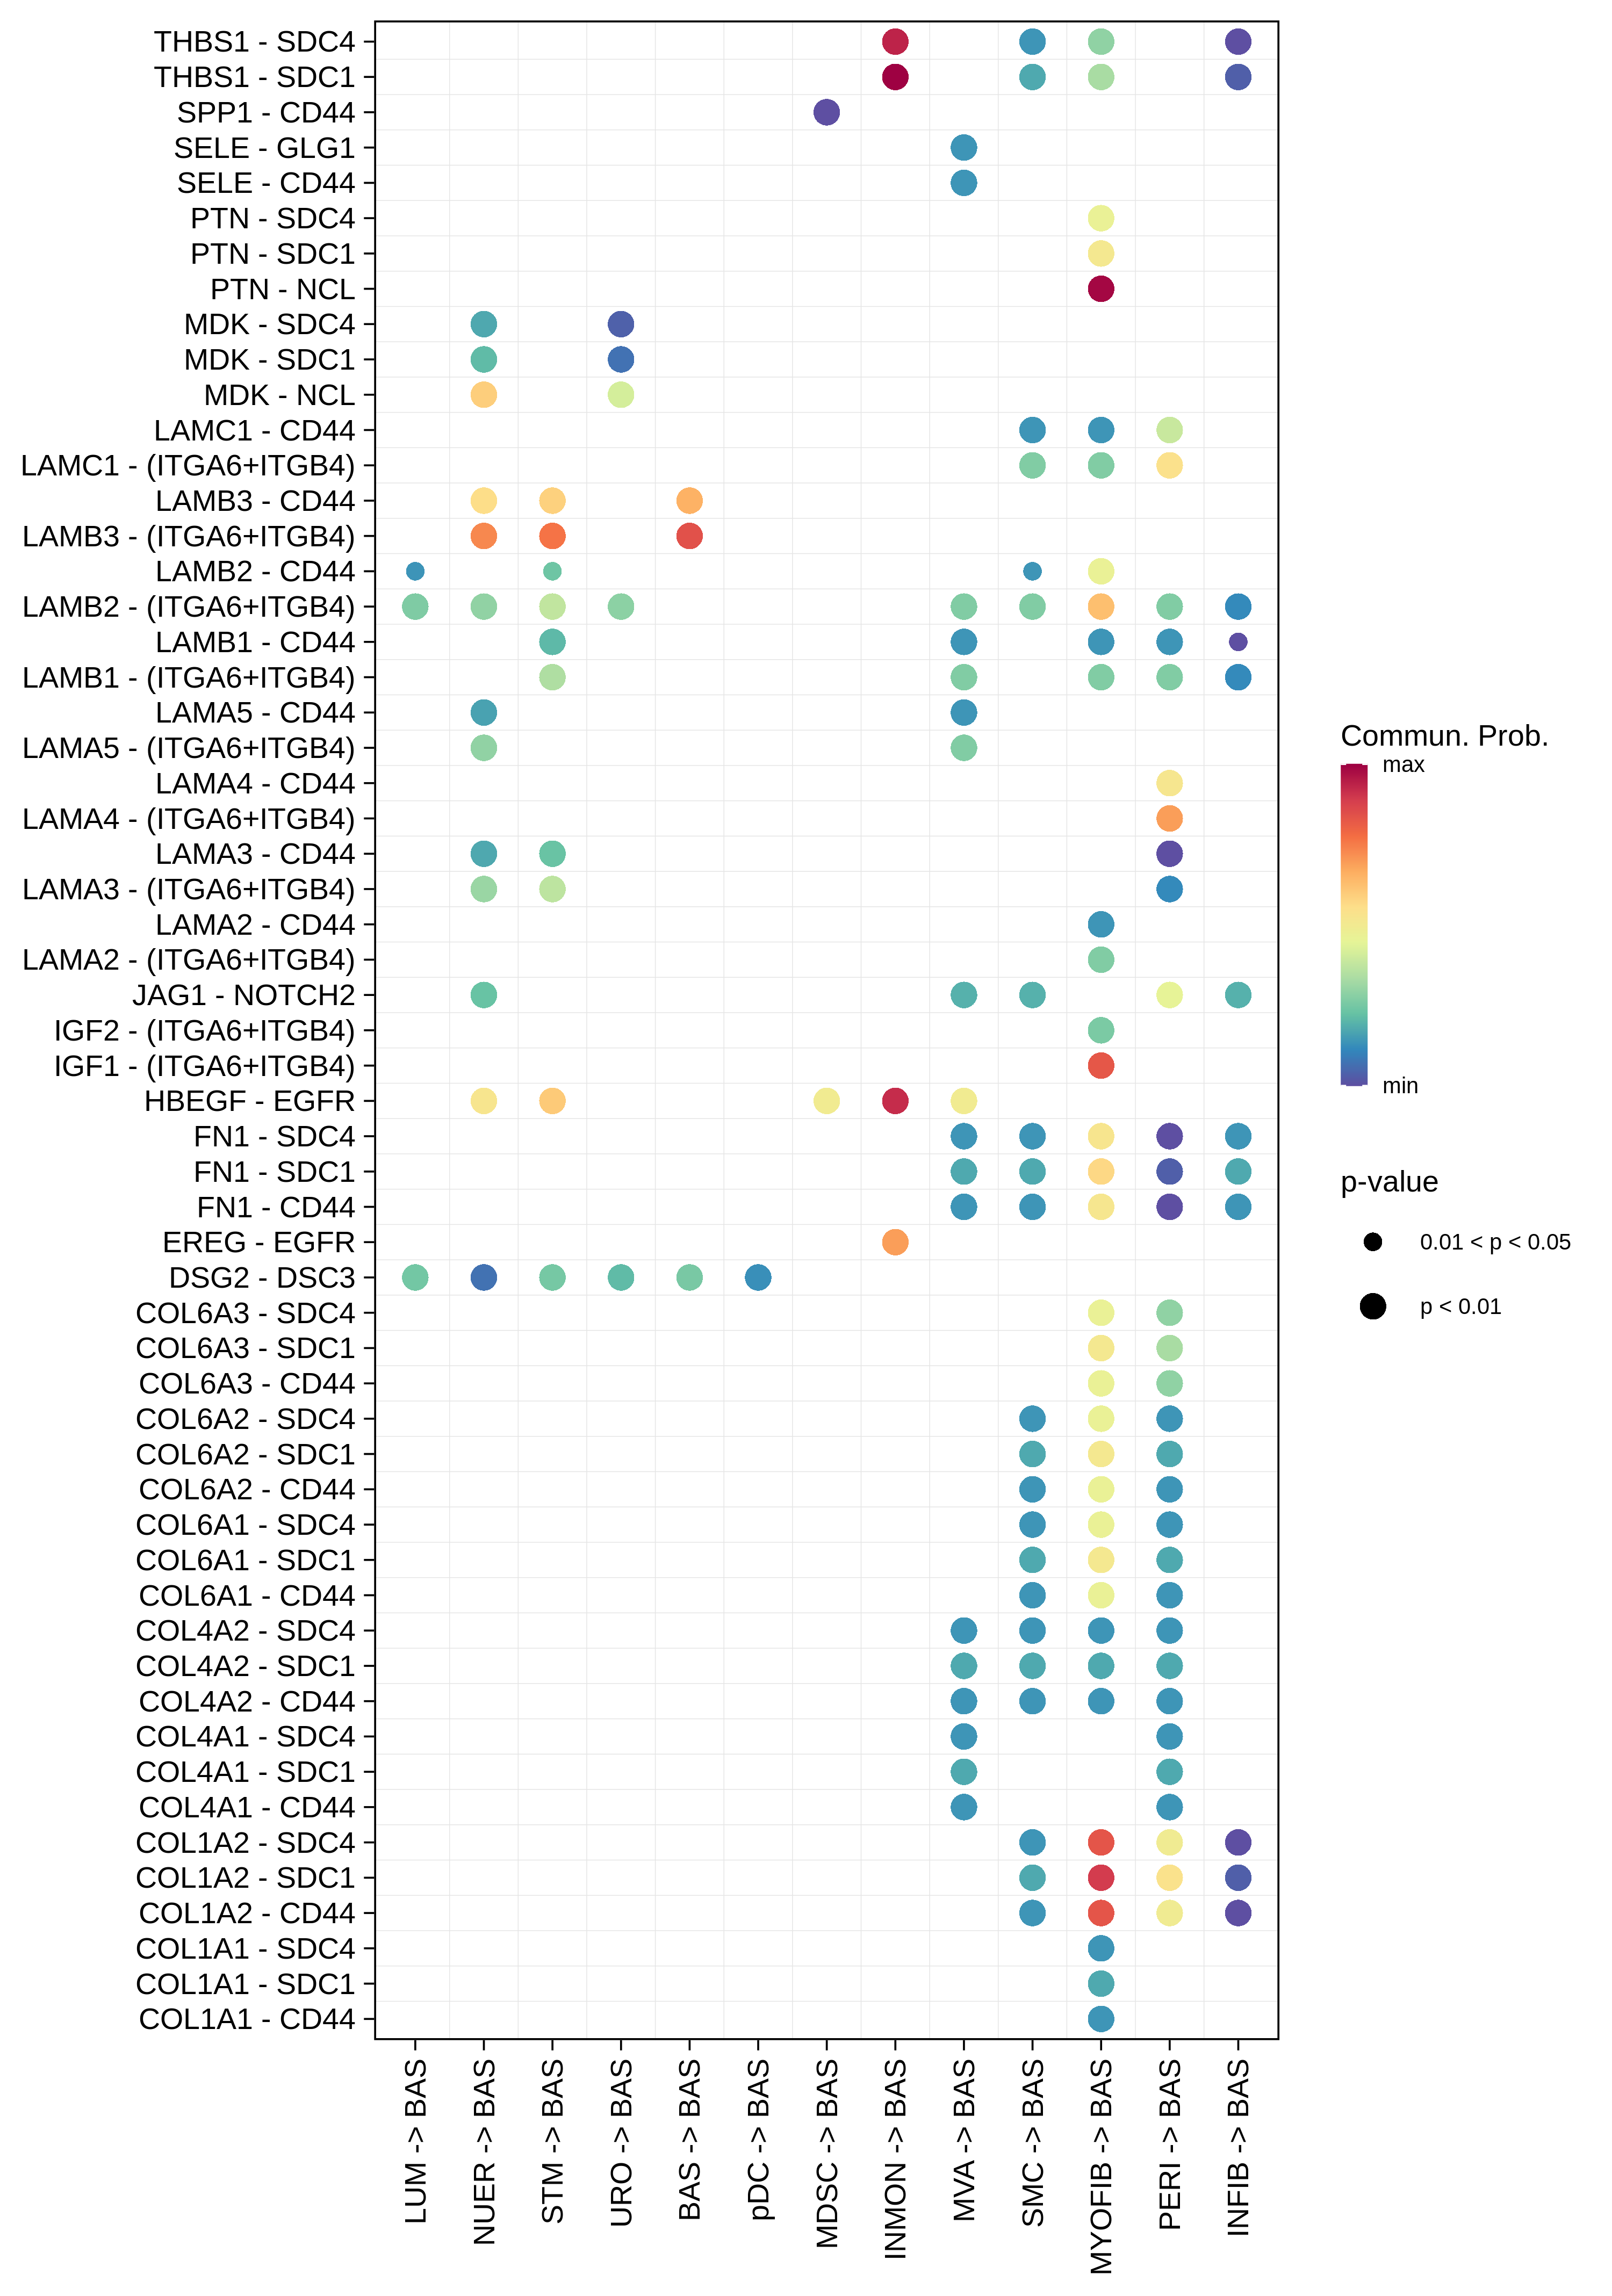
ADJBASThe cell-cell communications between each two interacting cell types in ADJ-derived samples of the selected tissue. Different colors in the circle plot represent different cell groups and the edge width is proportional to the indicated number of ligand-receptor pairs. Bubble plot of proportion to the communication probability in significant signaling pathways between this cell type and its source cell population in ADJ-derived samples of the selected tissue. Each row represents the significant ligand and receptor gene pairs.Bubble plot of proportion to the communication probability in significant signaling pathways between this cell type and its target cell population in ADJ-derived samples of the selected tissue. Each row represents the significant ligand and receptor gene pairs.
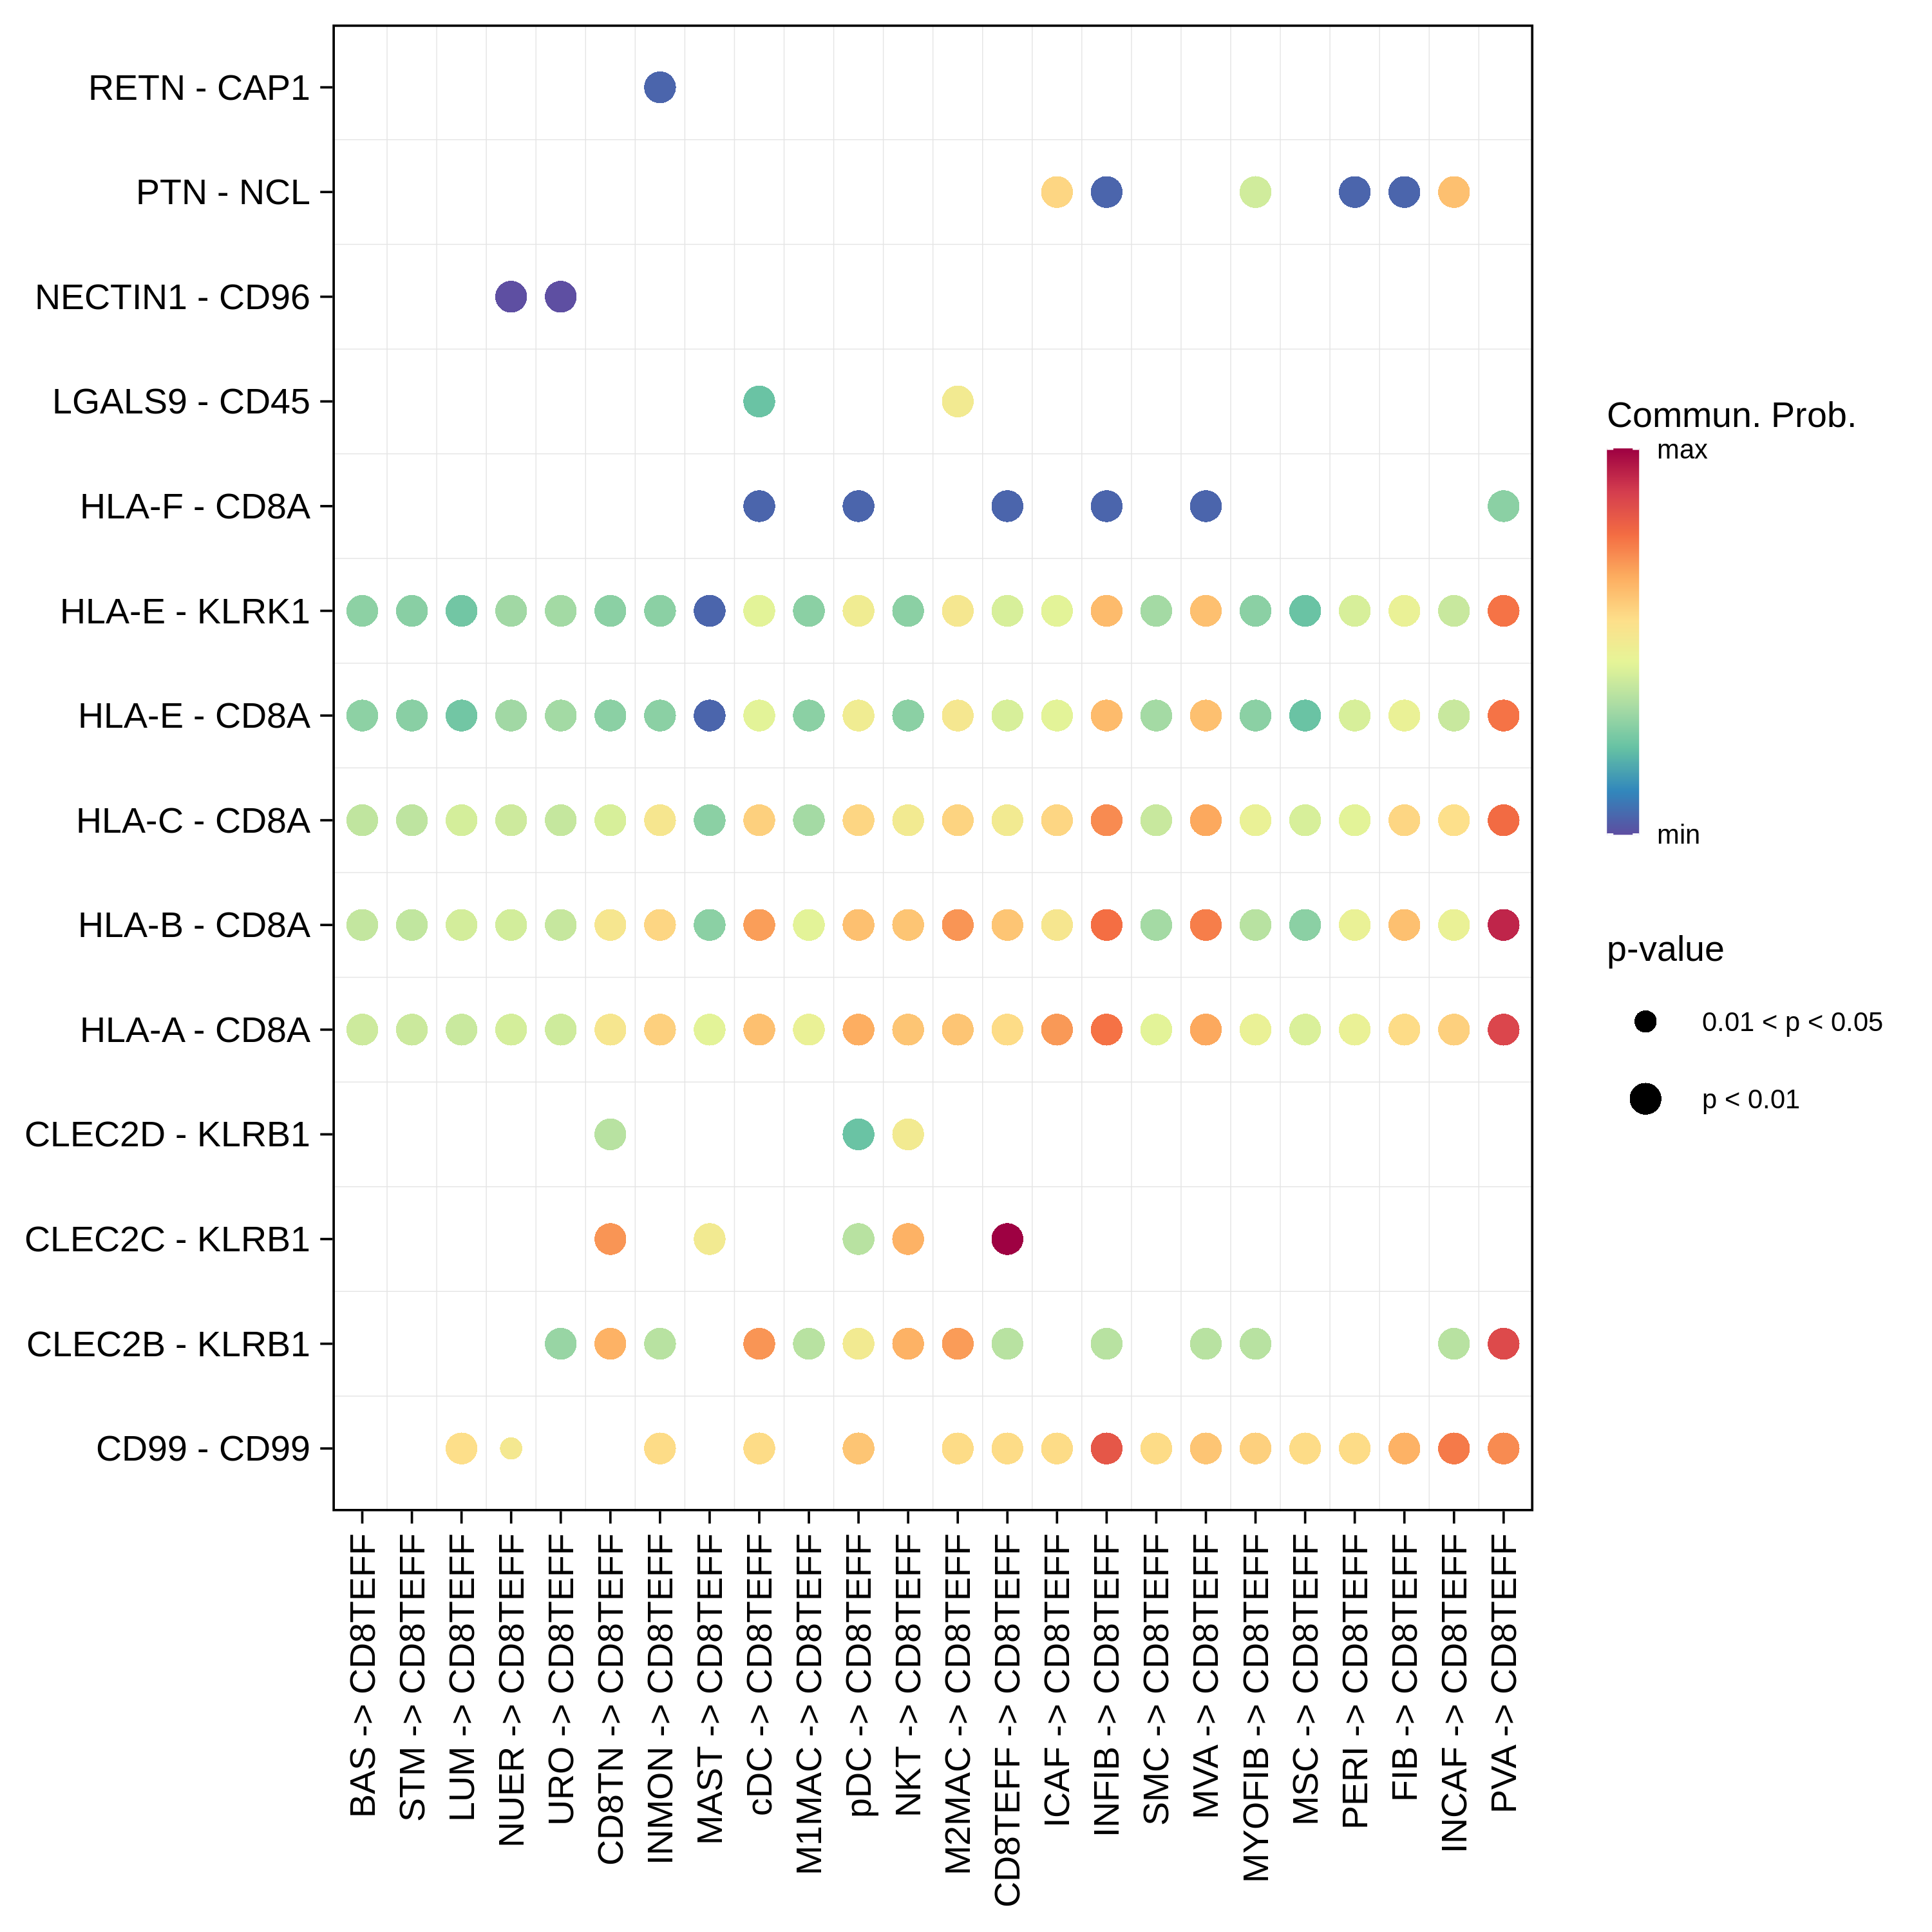
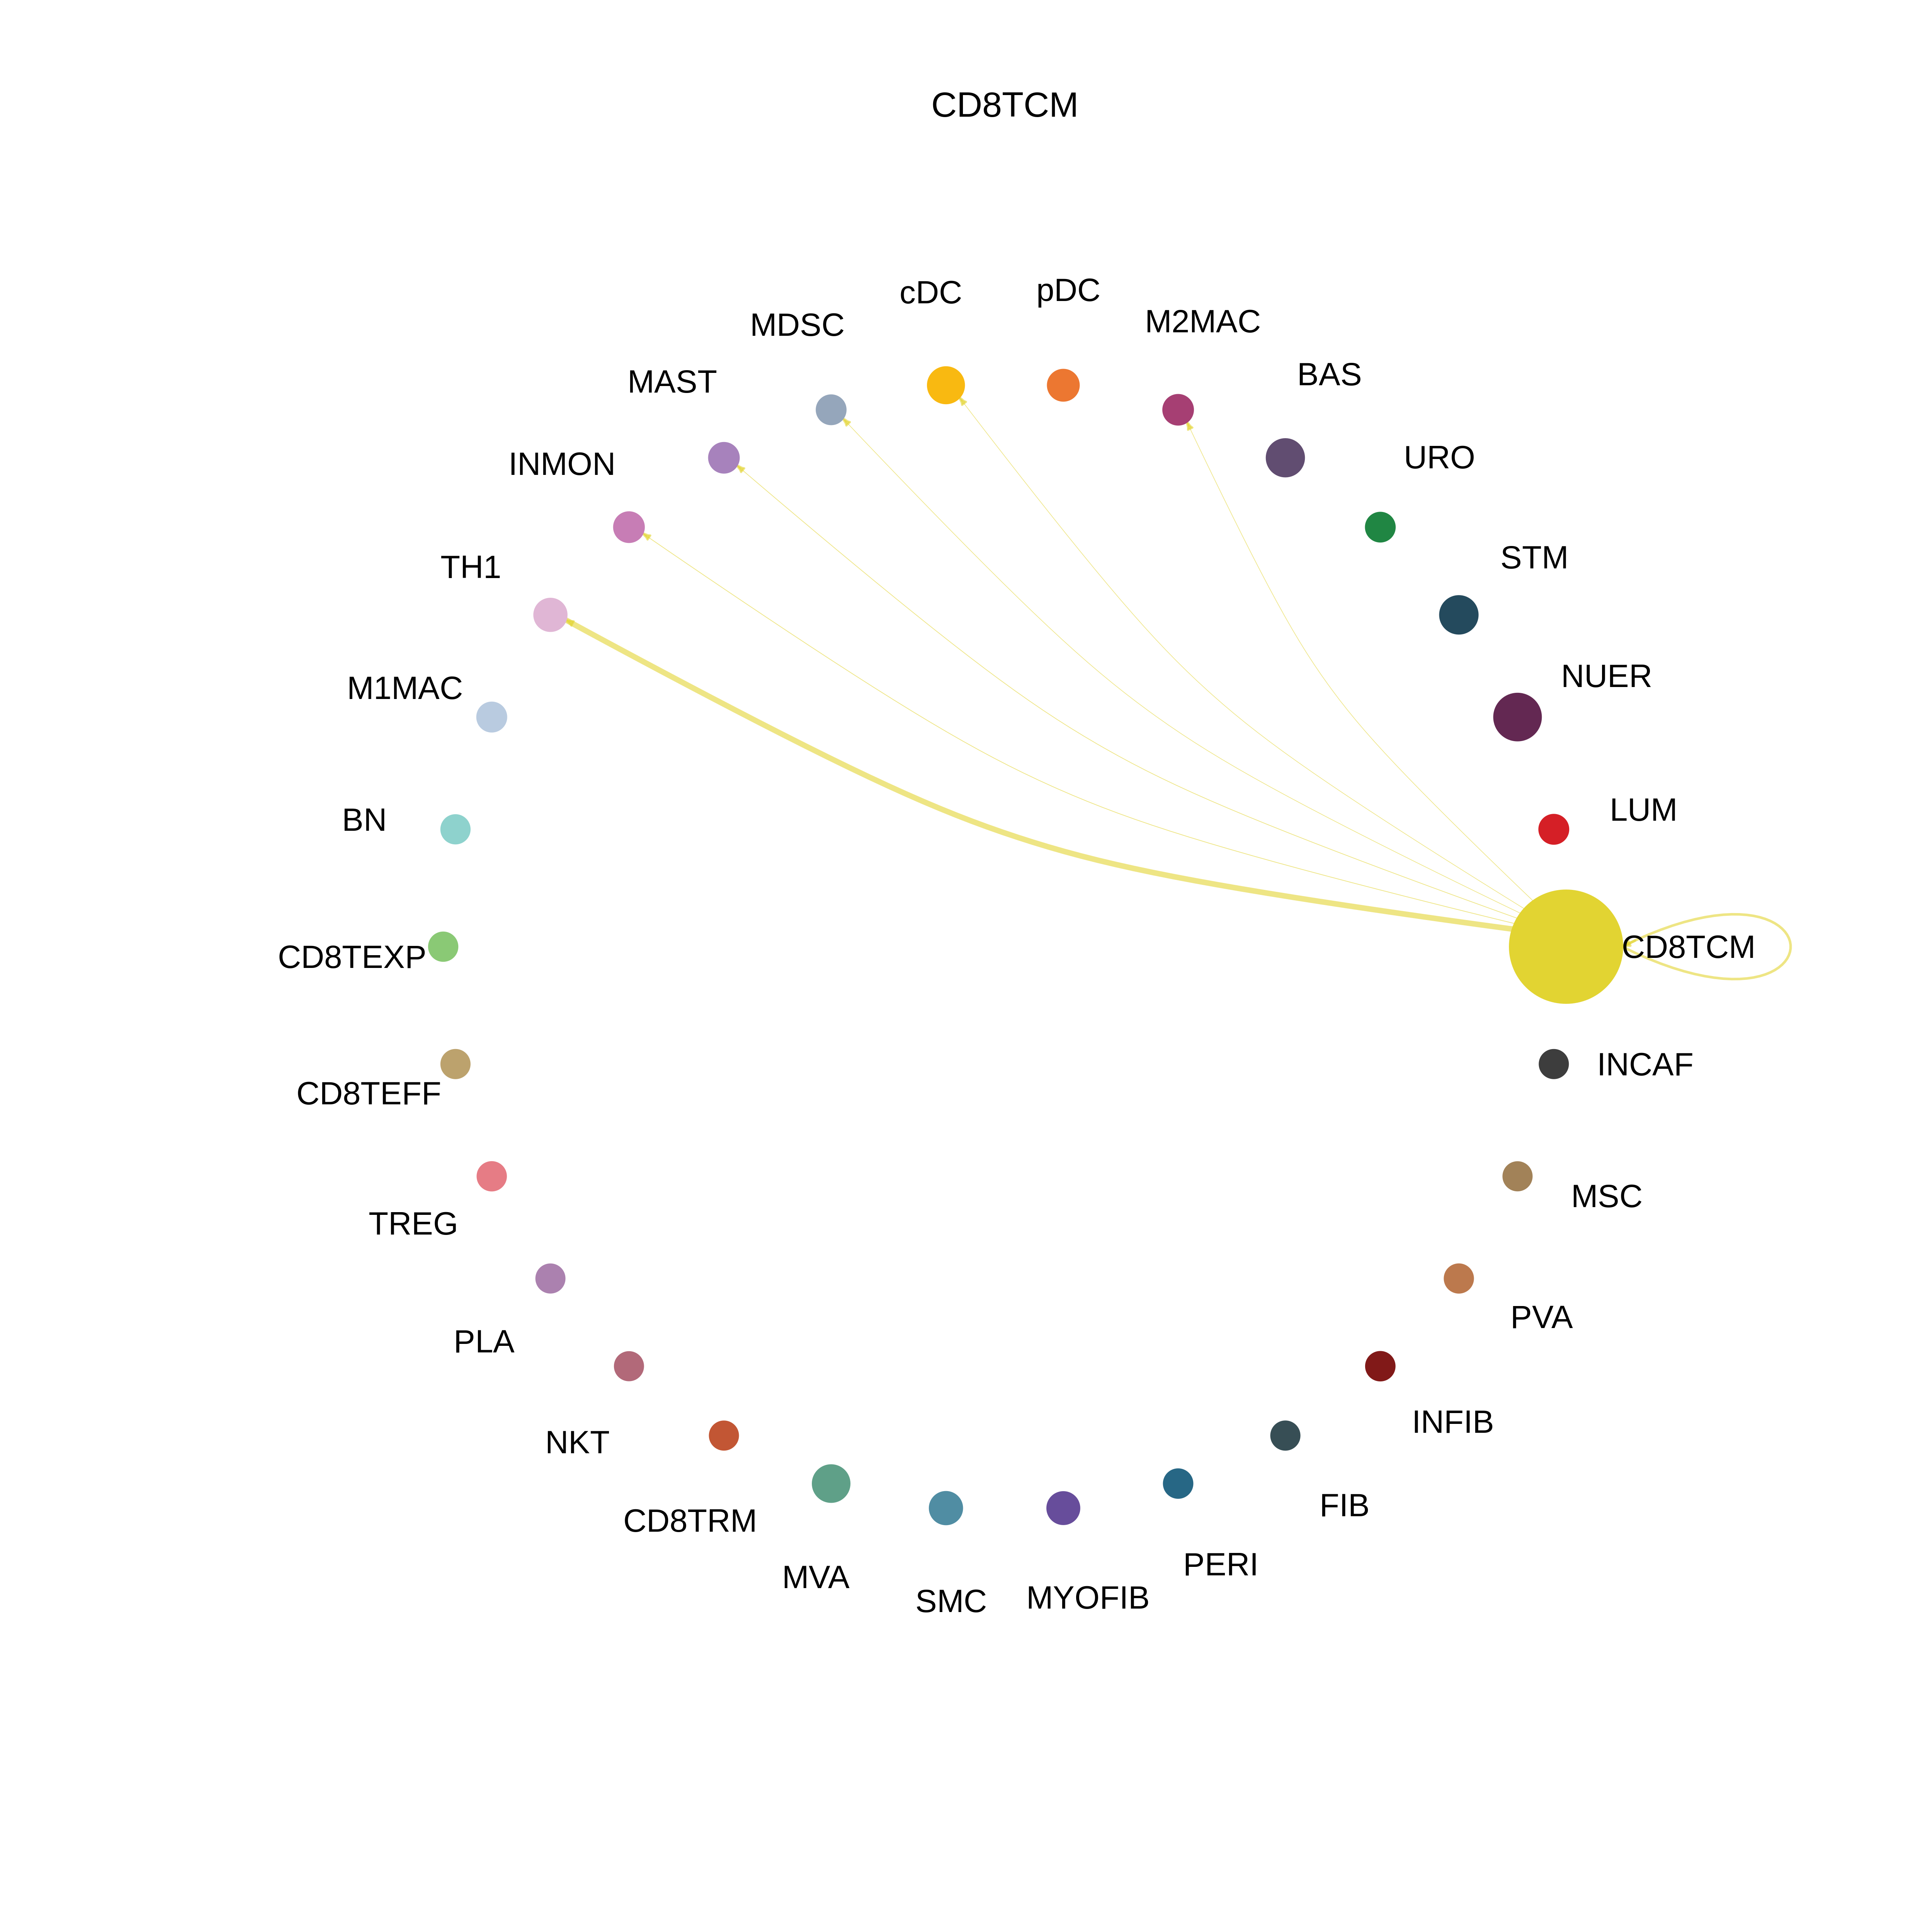
CD8TCMThe cell-cell communications between each two interacting cell types in ADJ-derived samples of the selected tissue. Different colors in the circle plot represent different cell groups and the edge width is proportional to the indicated number of ligand-receptor pairs. Bubble plot of proportion to the communication probability in significant signaling pathways between this cell type and its source cell population in ADJ-derived samples of the selected tissue. Each row represents the significant ligand and receptor gene pairs.Bubble plot of proportion to the communication probability in significant signaling pathways between this cell type and its target cell population in ADJ-derived samples of the selected tissue. Each row represents the significant ligand and receptor gene pairs.
Page: 1 2 3 4 5 6 7 8 9 10 

Disease StateCell TypeCircleSourceTarget
BPHBASThe cell-cell communications between each two interacting cell types in BPH-derived samples of Prostate tissue. Different colors in the circle plot represent different cell groups and the edge width is proportional to the indicated number of ligand-receptor pairs.Bubble plot of proportion to the communication probability in significant signaling pathways between this cell type and its source cell population in BPH-derived samples of Prostate tissue. Each row represents the significant ligand and receptor gene pairs.Bubble plot of proportion to the communication probability in significant signaling pathways between this cell type and its target cell population in BPH-derived samples of Prostate tissue. Each row represents the significant ligand and receptor gene pairs.
BNThe cell-cell communications between each two interacting cell types in BPH-derived samples of Prostate tissue. Different colors in the circle plot represent different cell groups and the edge width is proportional to the indicated number of ligand-receptor pairs.Bubble plot of proportion to the communication probability in significant signaling pathways between this cell type and its source cell population in BPH-derived samples of Prostate tissue. Each row represents the significant ligand and receptor gene pairs.Bubble plot of proportion to the communication probability in significant signaling pathways between this cell type and its target cell population in BPH-derived samples of Prostate tissue. Each row represents the significant ligand and receptor gene pairs.
Page: 1 2 3 4 5 6 7 8 9 10 11 12 13 14 15 16 

Disease StateCell TypeCircleSourceTarget
TumorBASThe cell-cell communications between each two interacting cell types in Tumor-derived samples of Prostate tissue. Different colors in the circle plot represent different cell groups and the edge width is proportional to the indicated number of ligand-receptor pairs.Bubble plot of proportion to the communication probability in significant signaling pathways between this cell type and its source cell population in Tumor-derived samples of Prostate tissue. Each row represents the significant ligand and receptor gene pairs.Bubble plot of proportion to the communication probability in significant signaling pathways between this cell type and its target cell population in Tumor-derived samples of Prostate tissue. Each row represents the significant ligand and receptor gene pairs.
BNThe cell-cell communications between each two interacting cell types in Tumor-derived samples of Prostate tissue. Different colors in the circle plot represent different cell groups and the edge width is proportional to the indicated number of ligand-receptor pairs.Bubble plot of proportion to the communication probability in significant signaling pathways between this cell type and its source cell population in Tumor-derived samples of Prostate tissue. Each row represents the significant ligand and receptor gene pairs.Bubble plot of proportion to the communication probability in significant signaling pathways between this cell type and its target cell population in Tumor-derived samples of Prostate tissue. Each row represents the significant ligand and receptor gene pairs.
∗The cell-cell communications between each two interacting cell types in different states-derived samples of Prostate tissue. Different colors in the circle plot represent different cell groups and the edge width is proportional to the indicated number of ligand-receptor pairs.
∗Bubble plot of proportion to the communication probability in significant signaling pathways between this cell type and its source and target cell population. Each row represents the significant ligand and receptor gene pairs.
Page: 1 2 3 4 5 6 7 8 9 10 11 12 13 14 15 16 

Top

Stemness, Senescence, Metaplasia and NeoTCR signature analysis

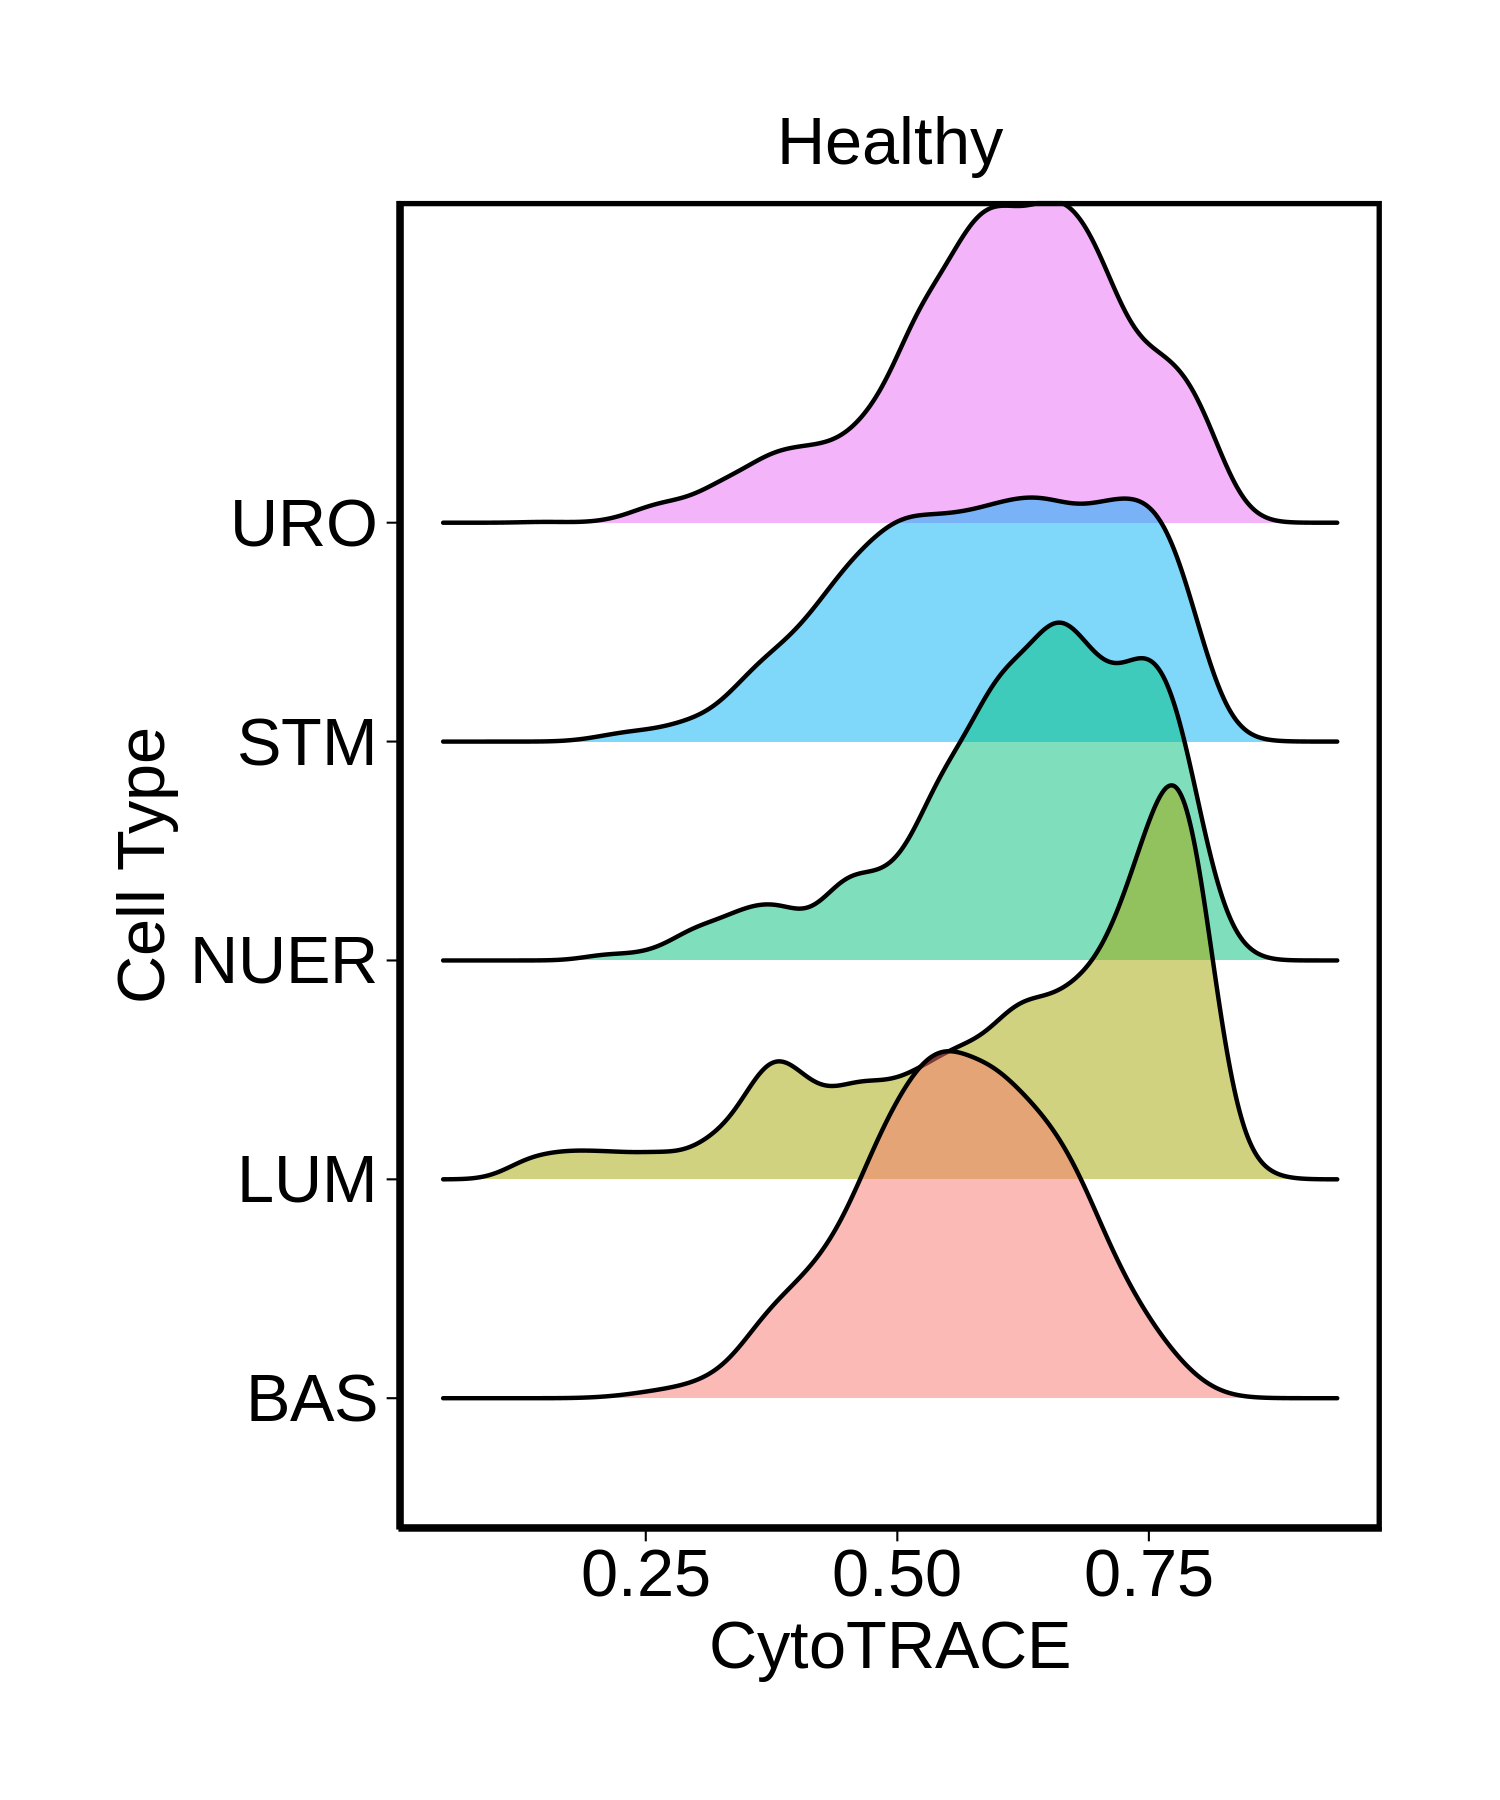
check button Developmental potential inference using CytoTRACE.
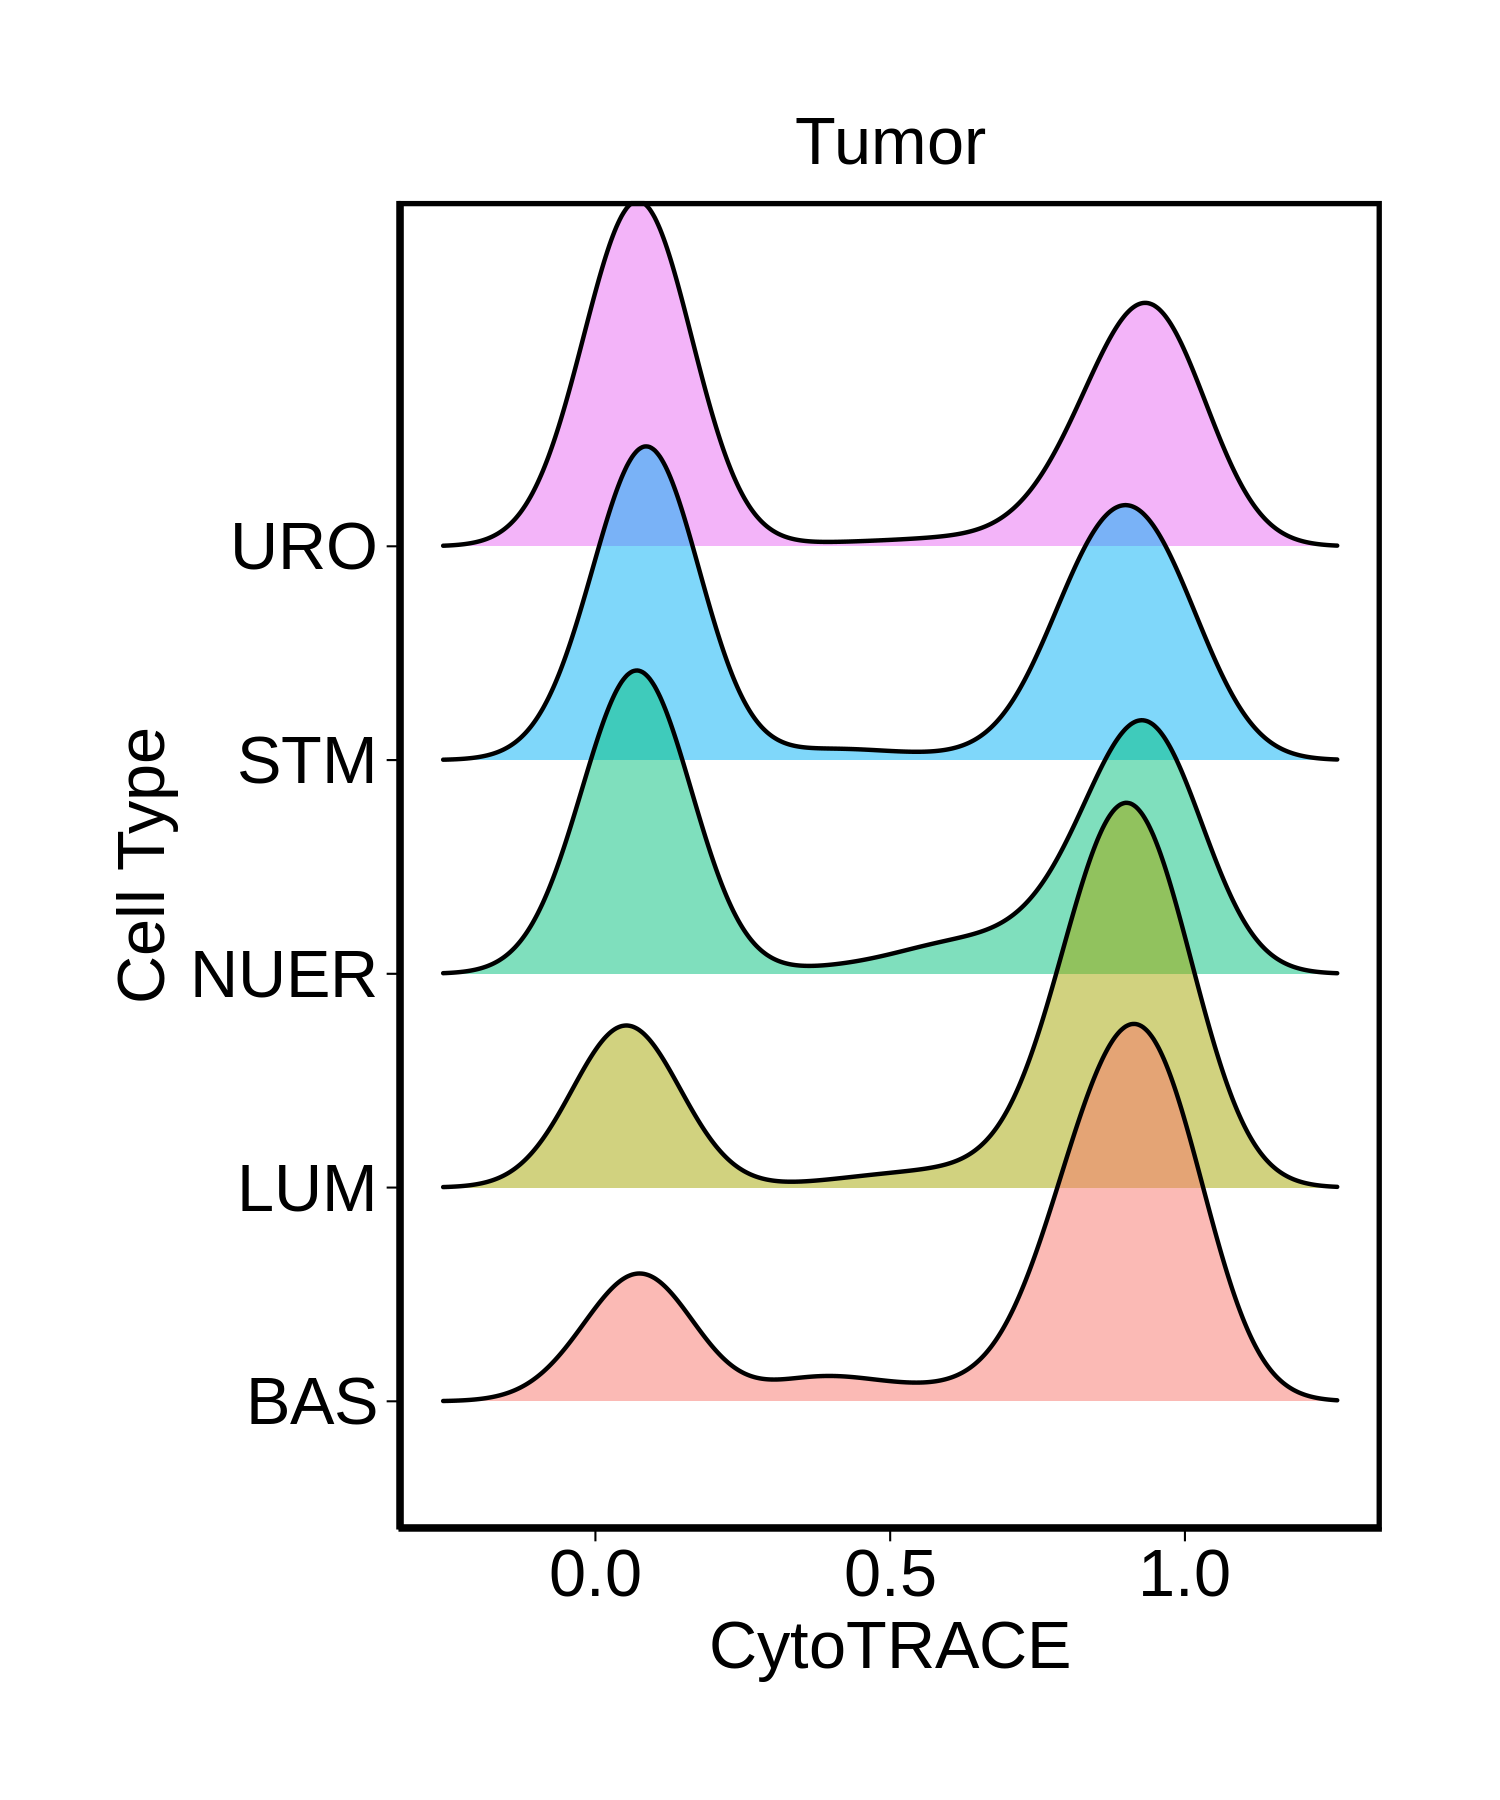
1_developmental_potential_in_Healthy.png shows the analysis results of stemness, senescence, and metaplasia signatures2_developmental_potential_in_BPH.png shows the analysis results of stemness, senescence, and metaplasia signatures3_developmental_potential_in_Tumor.png shows the analysis results of stemness, senescence, and metaplasia signatures
∗Ridge plots of CytoTRACE score distributions for epithelial cells.

check button Cellular senescence signature (for three compartments).
Disease StateEpitheliaImmuneStromal
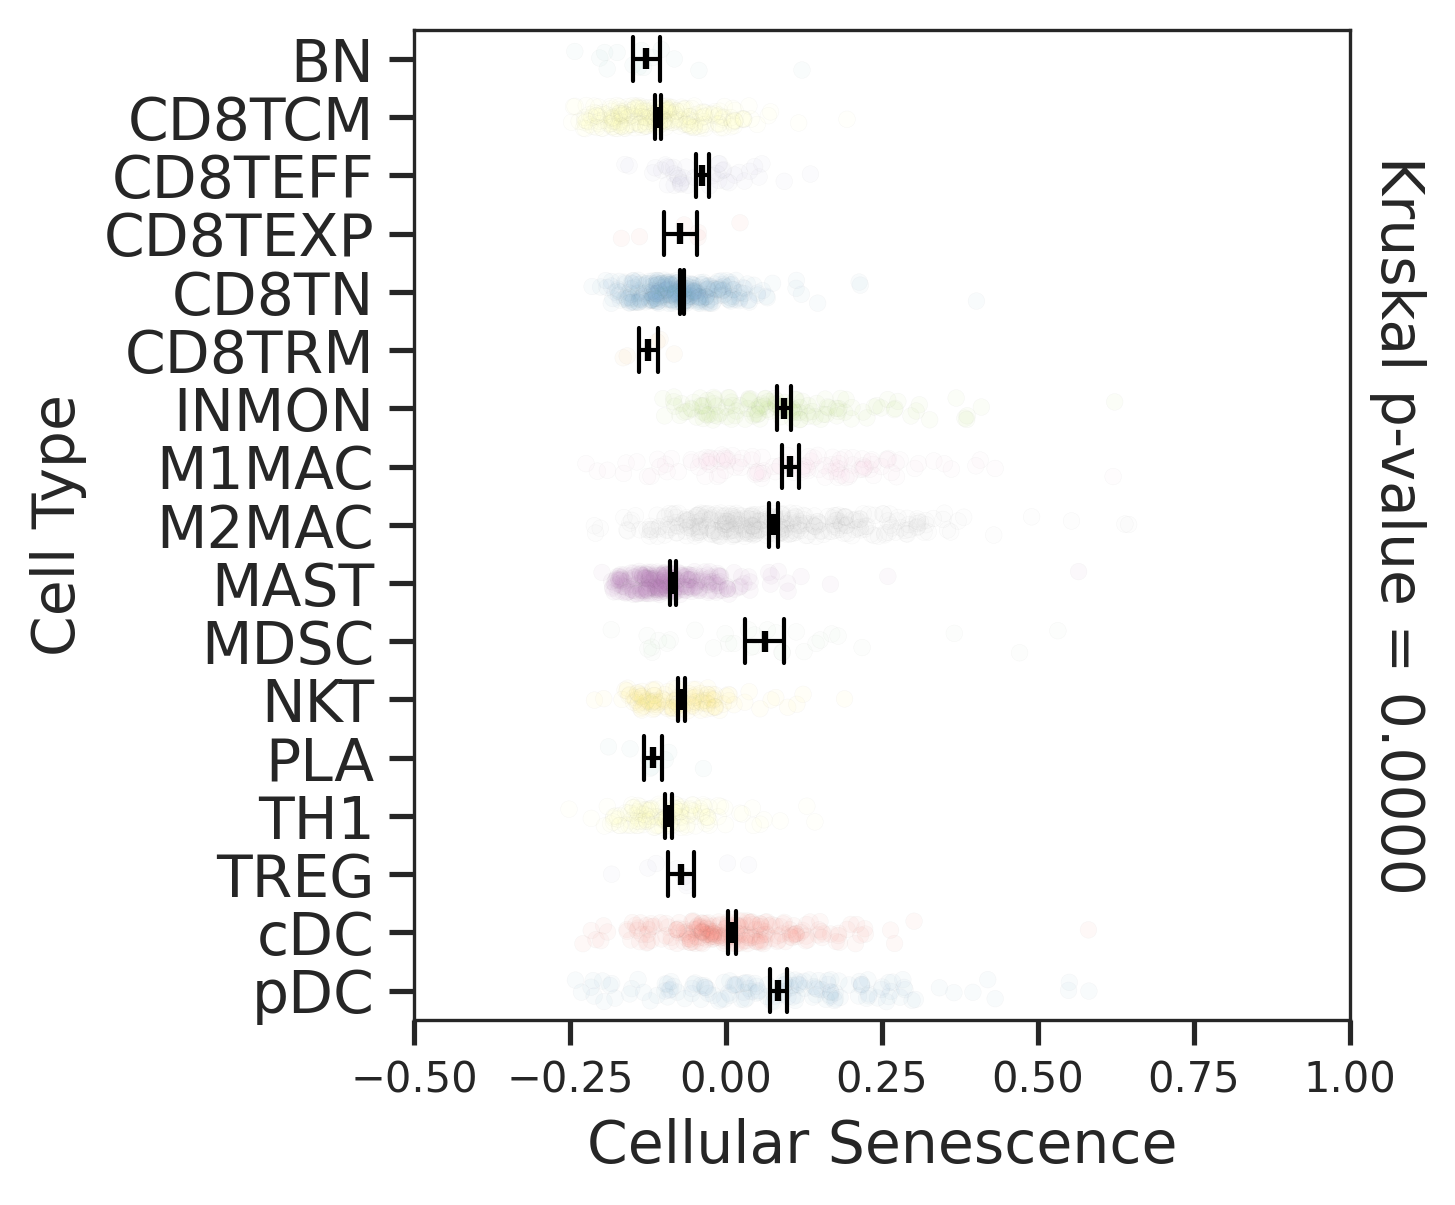
HealthyComparisons for degree of cellular senescence of epithelial compartment in Healthy-derived samples of Lung tissue.Comparisons for degree of cellular senescence of immune compartment in Healthy-derived samples of Lung tissue.Comparisons for degree of cellular senescence of stromal compartment in Healthy-derived samples of Lung tissue.
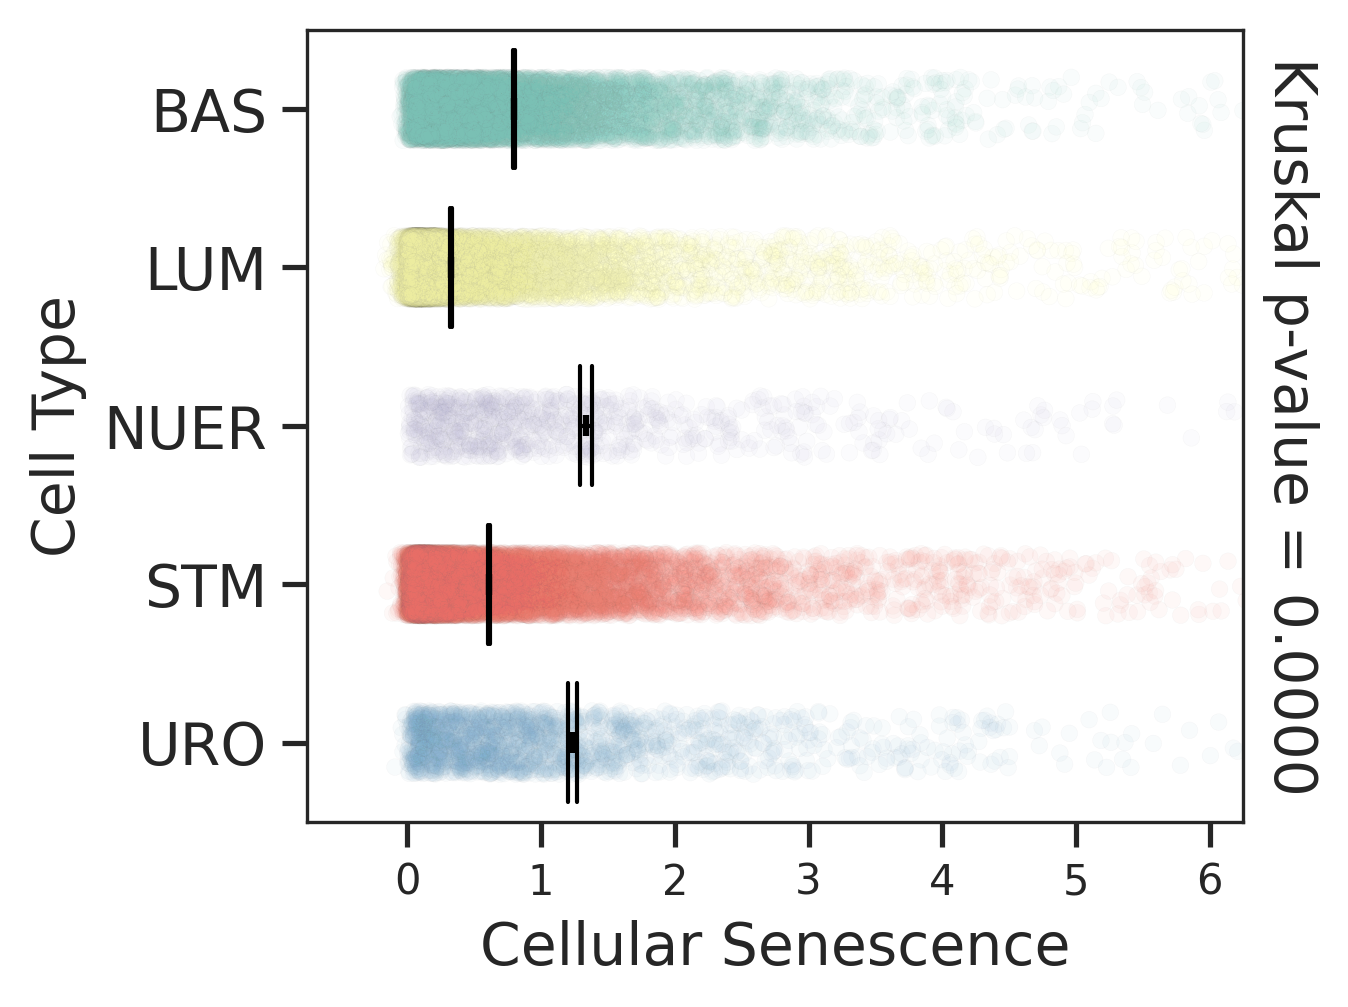
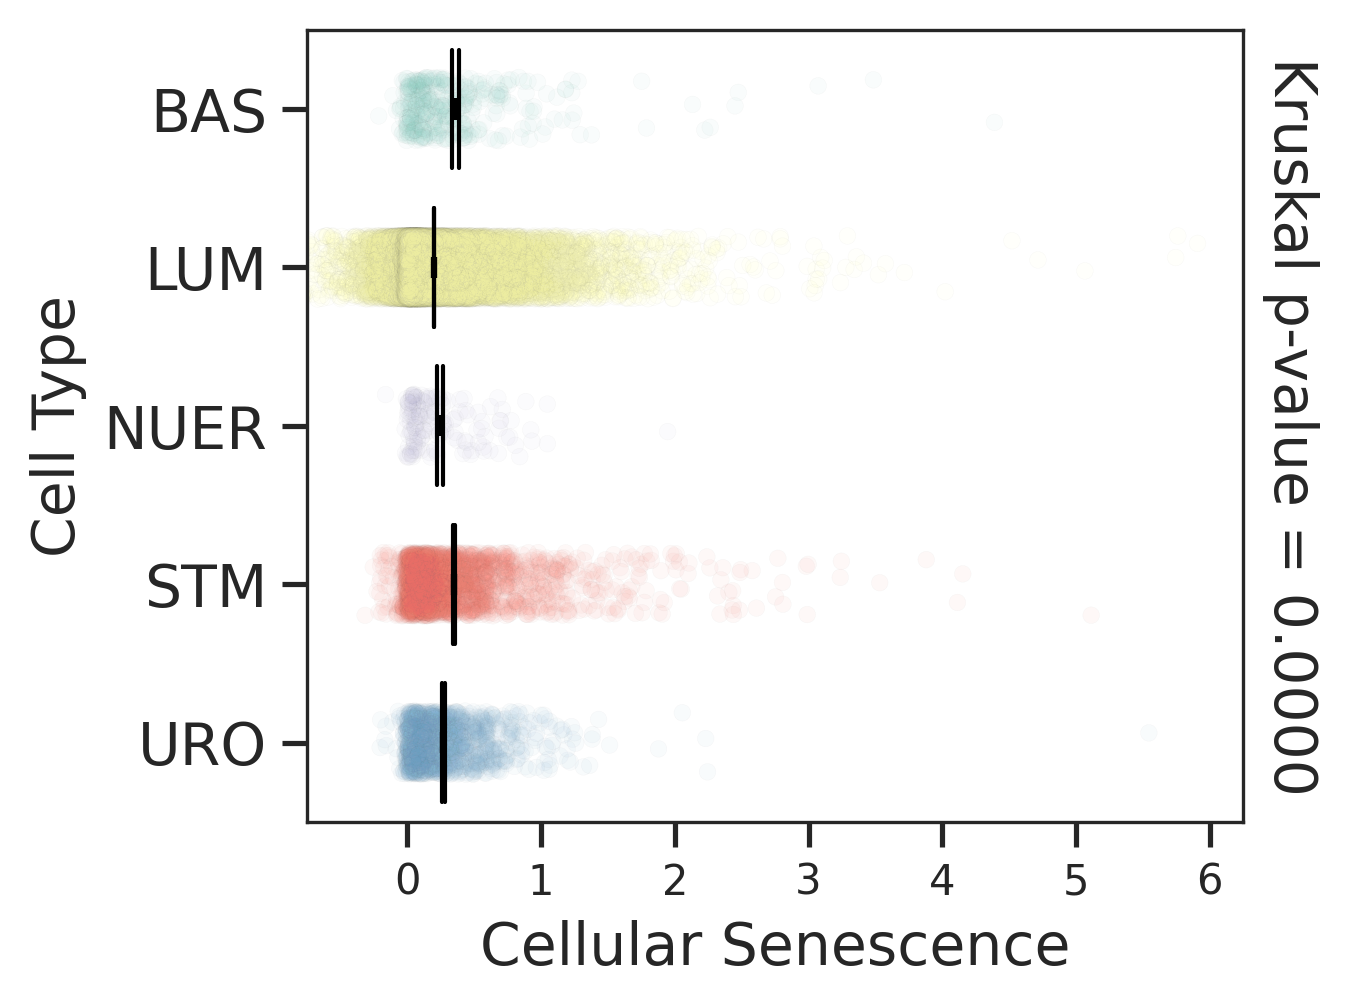
BPHComparisons for degree of cellular senescence of epithelial compartment in BPH-derived samples of Prostate tissue.Comparisons for degree of cellular senescence of immune compartment in BPH-derived samples of Prostate tissue.Comparisons for degree of cellular senescence of stromal compartment in BPH-derived samples of Prostate tissue.
TumorComparisons for degree of cellular senescence of epithelial compartment in BPH-derived samples of Prostate tissue.Comparisons for degree of cellular senescence of immune compartment in BPH-derived samples of Prostate tissue.Comparisons for degree of cellular senescence of stromal compartment in BPH-derived samples of Prostate tissue.
∗Comparisons for degree of cellular senescence among epithelial, immune and stromal cell populations of Prostate tissue with different disease states.

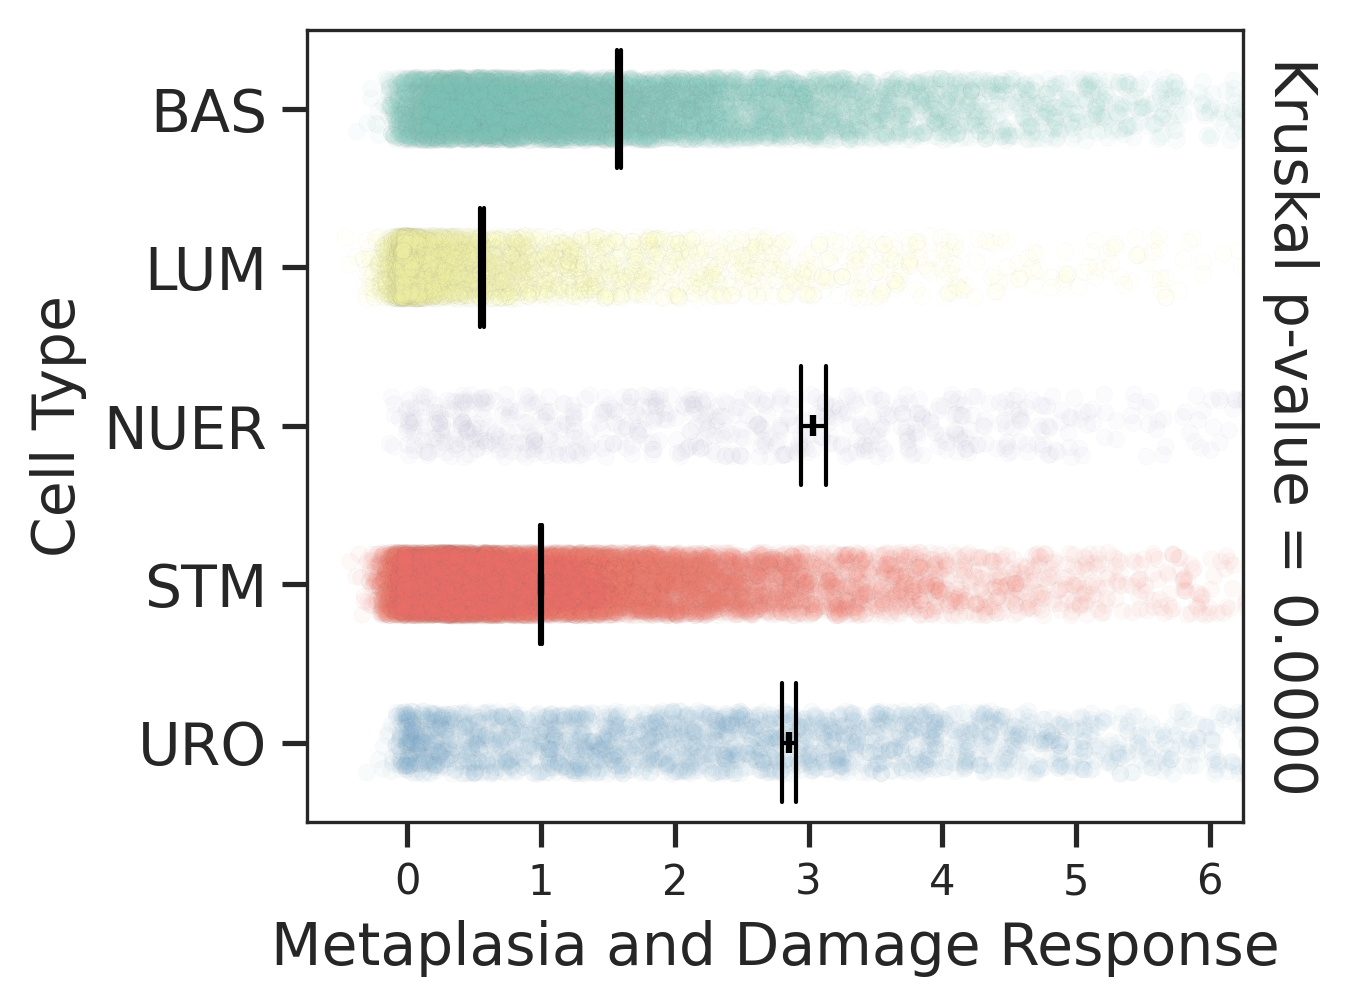
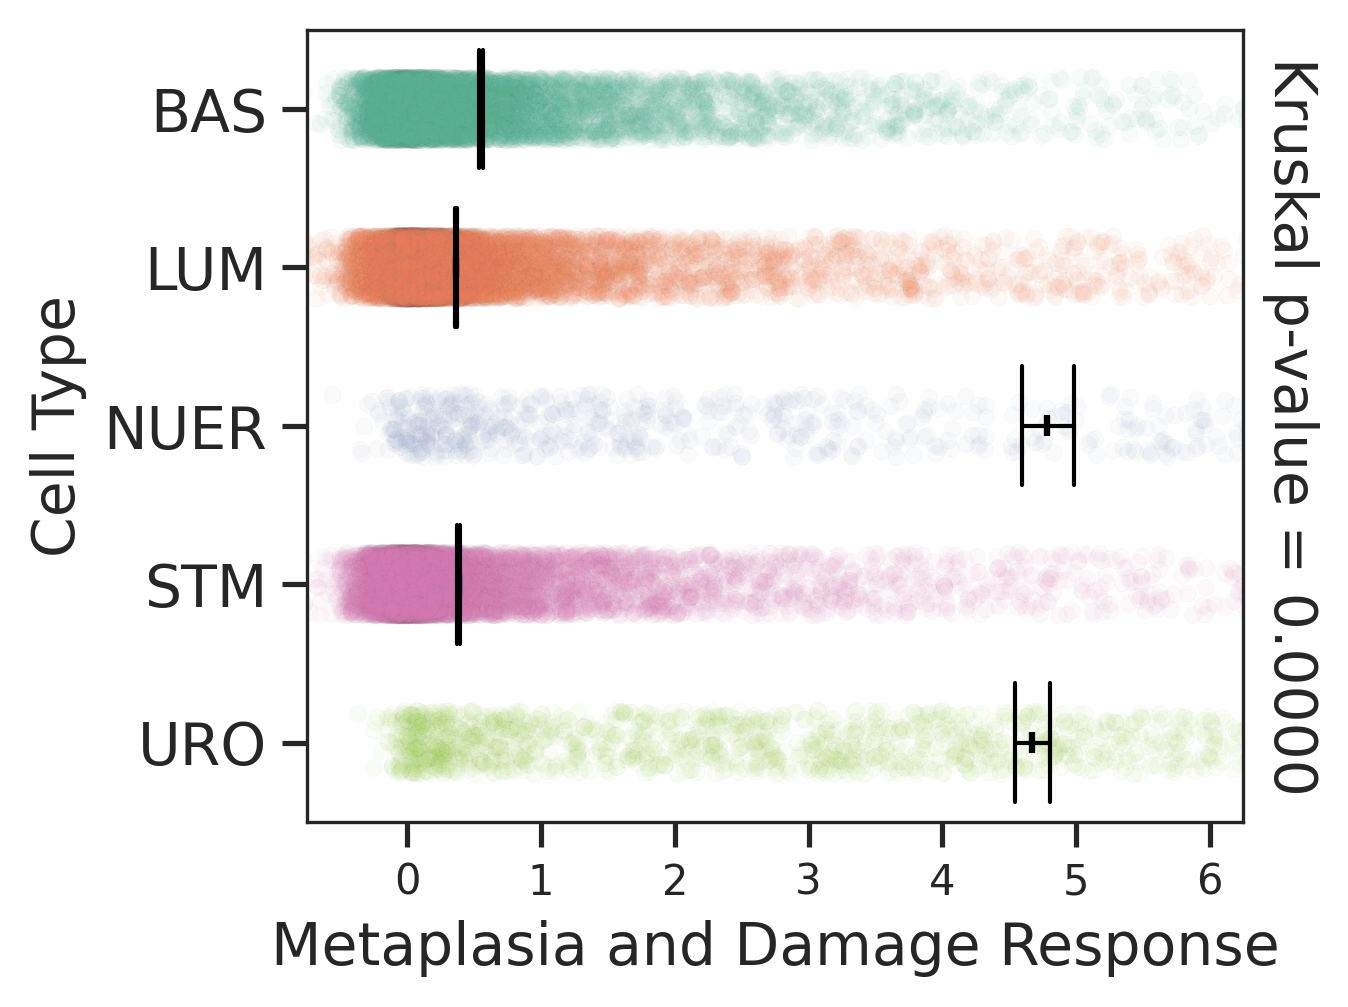
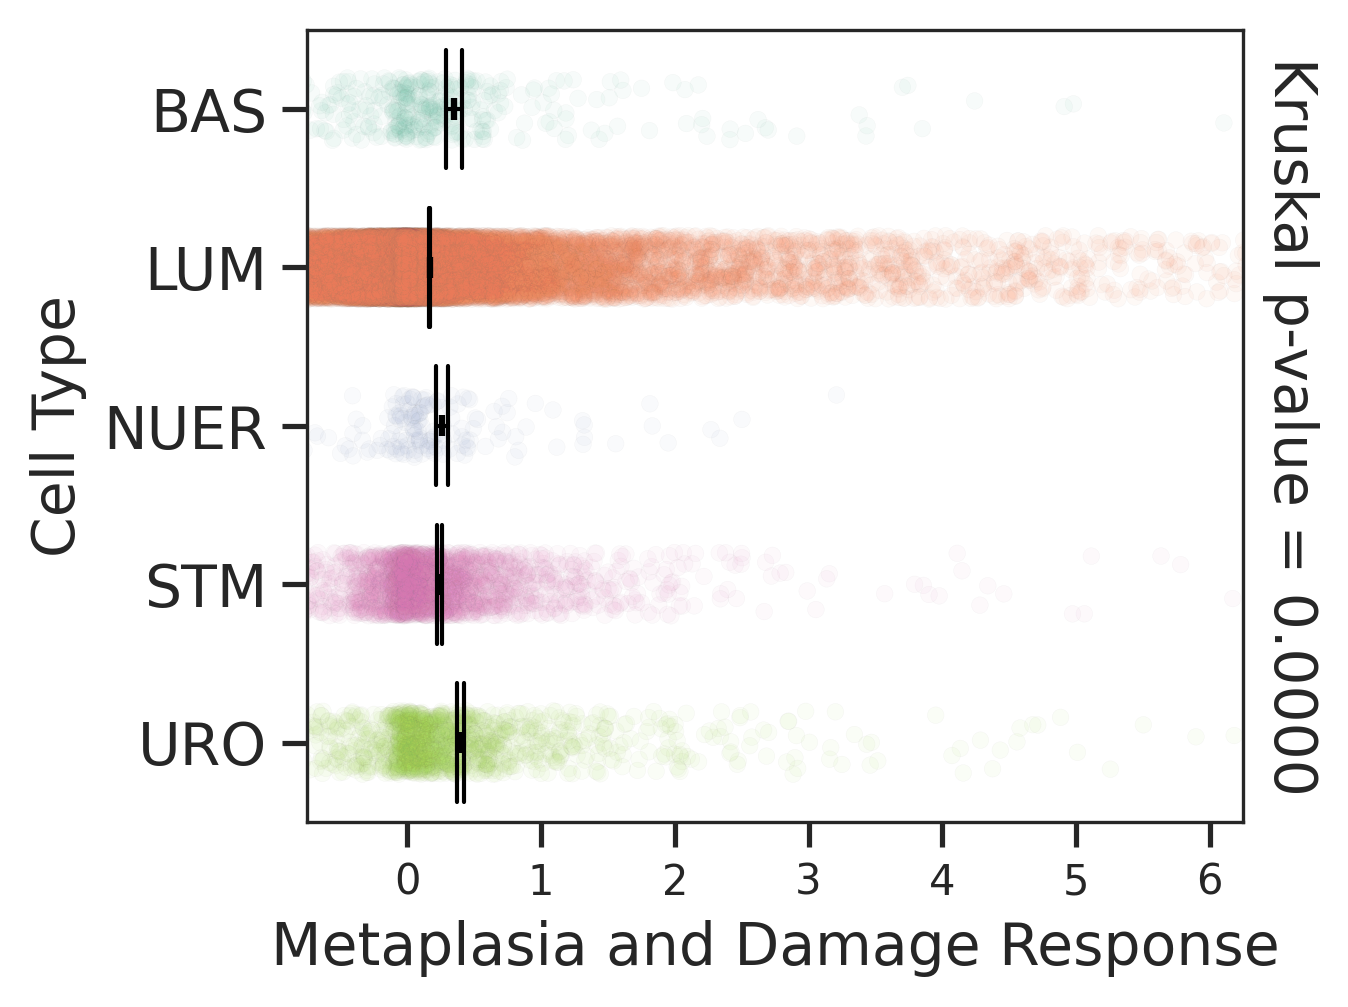
check button Metaplasia and damage response signature (for epithelial cells).
HealthyBPHTumor
Comparisons of Metaplasia-associated damage scores among epithelial cell subpopulations.Comparisons of Metaplasia-associated damage scores among epithelial cell subpopulations.Comparisons of Metaplasia-associated damage scores among epithelial cell subpopulations.
∗Comparisons of Metaplasia-associated damage scores among epithelial cell subpopulations.

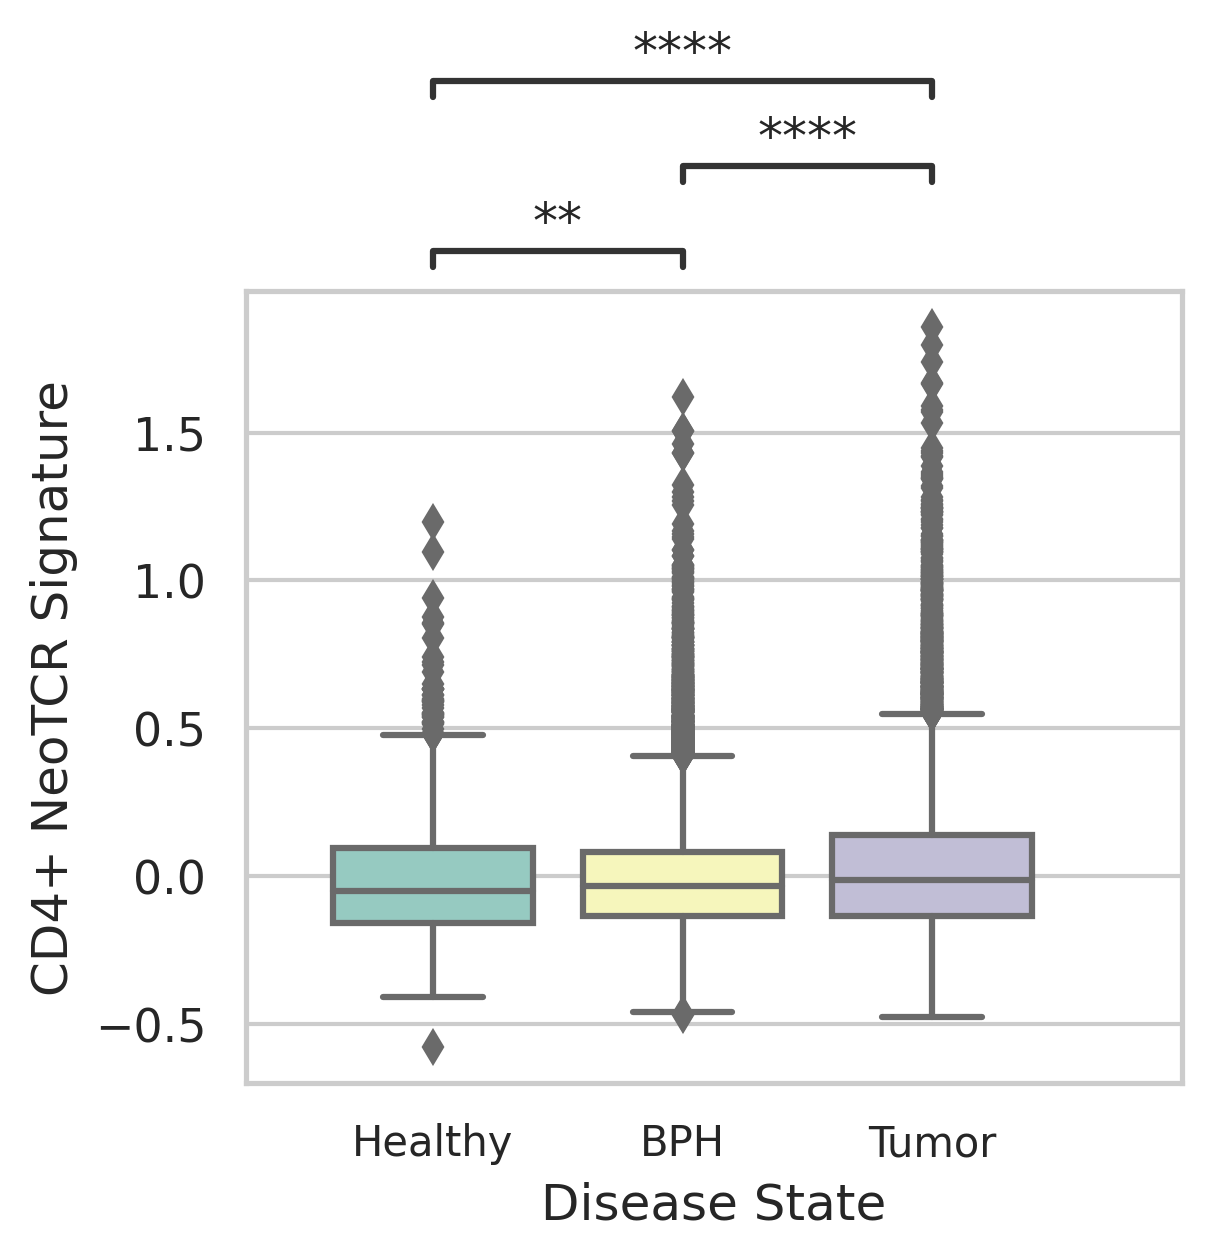
check button Neoantigen-specific TCR clonotypes (NeoTCR) signature.
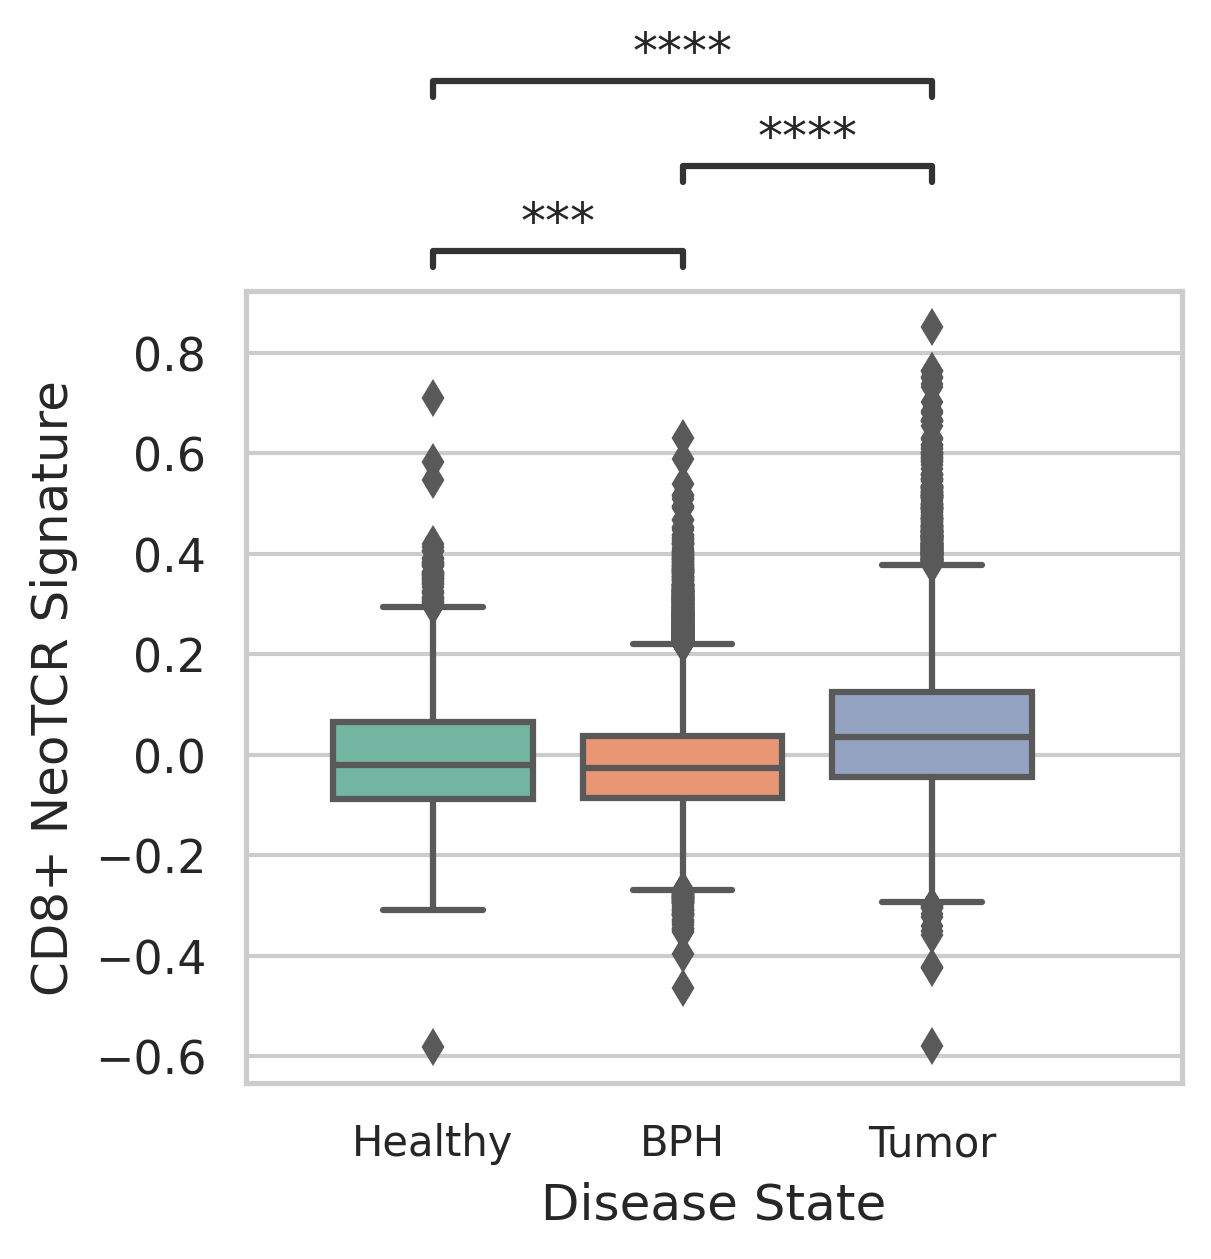
Comparisons of CD4+ and CD8+ NeoTCR signature scores among different disease states.Comparisons of CD4+ and CD8+ NeoTCR signature scores among different disease states.
∗Comparisons of CD4+ and CD8+ NeoTCR signature scores among different disease states.