
|
|||||
|
 | |
| |
| |
| |
| |
| |
|
Gene: ZZZ3 |
Gene summary for ZZZ3 |
| Gene information | Species | Human | Gene symbol | ZZZ3 | Gene ID | 26009 |
| Gene name | zinc finger ZZ-type containing 3 | |
| Gene Alias | ATAC1 | |
| Cytomap | 1p31.1 | |
| Gene Type | protein-coding | GO ID | GO:0006464 | UniProtAcc | Q8IYH5 |
Top |
Malignant transformation analysis |
| Identification of the aberrant gene expression in precancerous and cancerous lesions by comparing the gene expression of stem-like cells in diseased tissues with normal stem cells |
| Entrez ID | Symbol | Replicates | Species | Organ | Tissue | Adj P-value | Log2FC | Malignancy |
| 26009 | ZZZ3 | HTA11_3410_2000001011 | Human | Colorectum | AD | 7.05e-23 | 3.85e-01 | 0.0155 |
| 26009 | ZZZ3 | HTA11_2487_2000001011 | Human | Colorectum | SER | 3.08e-14 | 4.10e-01 | -0.1808 |
| 26009 | ZZZ3 | HTA11_2951_2000001011 | Human | Colorectum | AD | 2.49e-08 | 4.41e-01 | 0.0216 |
| 26009 | ZZZ3 | HTA11_1938_2000001011 | Human | Colorectum | AD | 2.77e-18 | 6.16e-01 | -0.0811 |
| 26009 | ZZZ3 | HTA11_78_2000001011 | Human | Colorectum | AD | 8.54e-30 | 7.85e-01 | -0.1088 |
| 26009 | ZZZ3 | HTA11_347_2000001011 | Human | Colorectum | AD | 5.07e-53 | 9.92e-01 | -0.1954 |
| 26009 | ZZZ3 | HTA11_411_2000001011 | Human | Colorectum | SER | 6.89e-14 | 9.04e-01 | -0.2602 |
| 26009 | ZZZ3 | HTA11_2112_2000001011 | Human | Colorectum | SER | 8.76e-08 | 4.53e-01 | -0.2196 |
| 26009 | ZZZ3 | HTA11_3361_2000001011 | Human | Colorectum | AD | 4.26e-13 | 3.40e-01 | -0.1207 |
| 26009 | ZZZ3 | HTA11_83_2000001011 | Human | Colorectum | SER | 4.06e-19 | 4.99e-01 | -0.1526 |
| 26009 | ZZZ3 | HTA11_696_2000001011 | Human | Colorectum | AD | 1.29e-28 | 5.17e-01 | -0.1464 |
| 26009 | ZZZ3 | HTA11_866_2000001011 | Human | Colorectum | AD | 4.96e-35 | 6.32e-01 | -0.1001 |
| 26009 | ZZZ3 | HTA11_1391_2000001011 | Human | Colorectum | AD | 3.14e-33 | 7.02e-01 | -0.059 |
| 26009 | ZZZ3 | HTA11_2992_2000001011 | Human | Colorectum | SER | 2.54e-11 | 5.26e-01 | -0.1706 |
| 26009 | ZZZ3 | HTA11_5212_2000001011 | Human | Colorectum | AD | 3.97e-04 | 2.59e-01 | -0.2061 |
| 26009 | ZZZ3 | HTA11_5216_2000001011 | Human | Colorectum | SER | 3.34e-04 | 3.08e-01 | -0.1462 |
| 26009 | ZZZ3 | HTA11_546_2000001011 | Human | Colorectum | AD | 4.57e-20 | 6.26e-01 | -0.0842 |
| 26009 | ZZZ3 | HTA11_7862_2000001011 | Human | Colorectum | AD | 3.18e-15 | 4.82e-01 | -0.0179 |
| 26009 | ZZZ3 | HTA11_866_3004761011 | Human | Colorectum | AD | 2.09e-17 | 4.25e-01 | 0.096 |
| 26009 | ZZZ3 | HTA11_4255_2000001011 | Human | Colorectum | SER | 1.51e-11 | 6.08e-01 | 0.0446 |
| Page: 1 2 3 4 5 6 7 8 |
| Tissue | Expression Dynamics | Abbreviation |
| Colorectum (GSE201348) |  | FAP: Familial adenomatous polyposis |
| CRC: Colorectal cancer | ||
| Colorectum (HTA11) |  | AD: Adenomas |
| SER: Sessile serrated lesions | ||
| MSI-H: Microsatellite-high colorectal cancer | ||
| MSS: Microsatellite stable colorectal cancer | ||
| Endometrium | 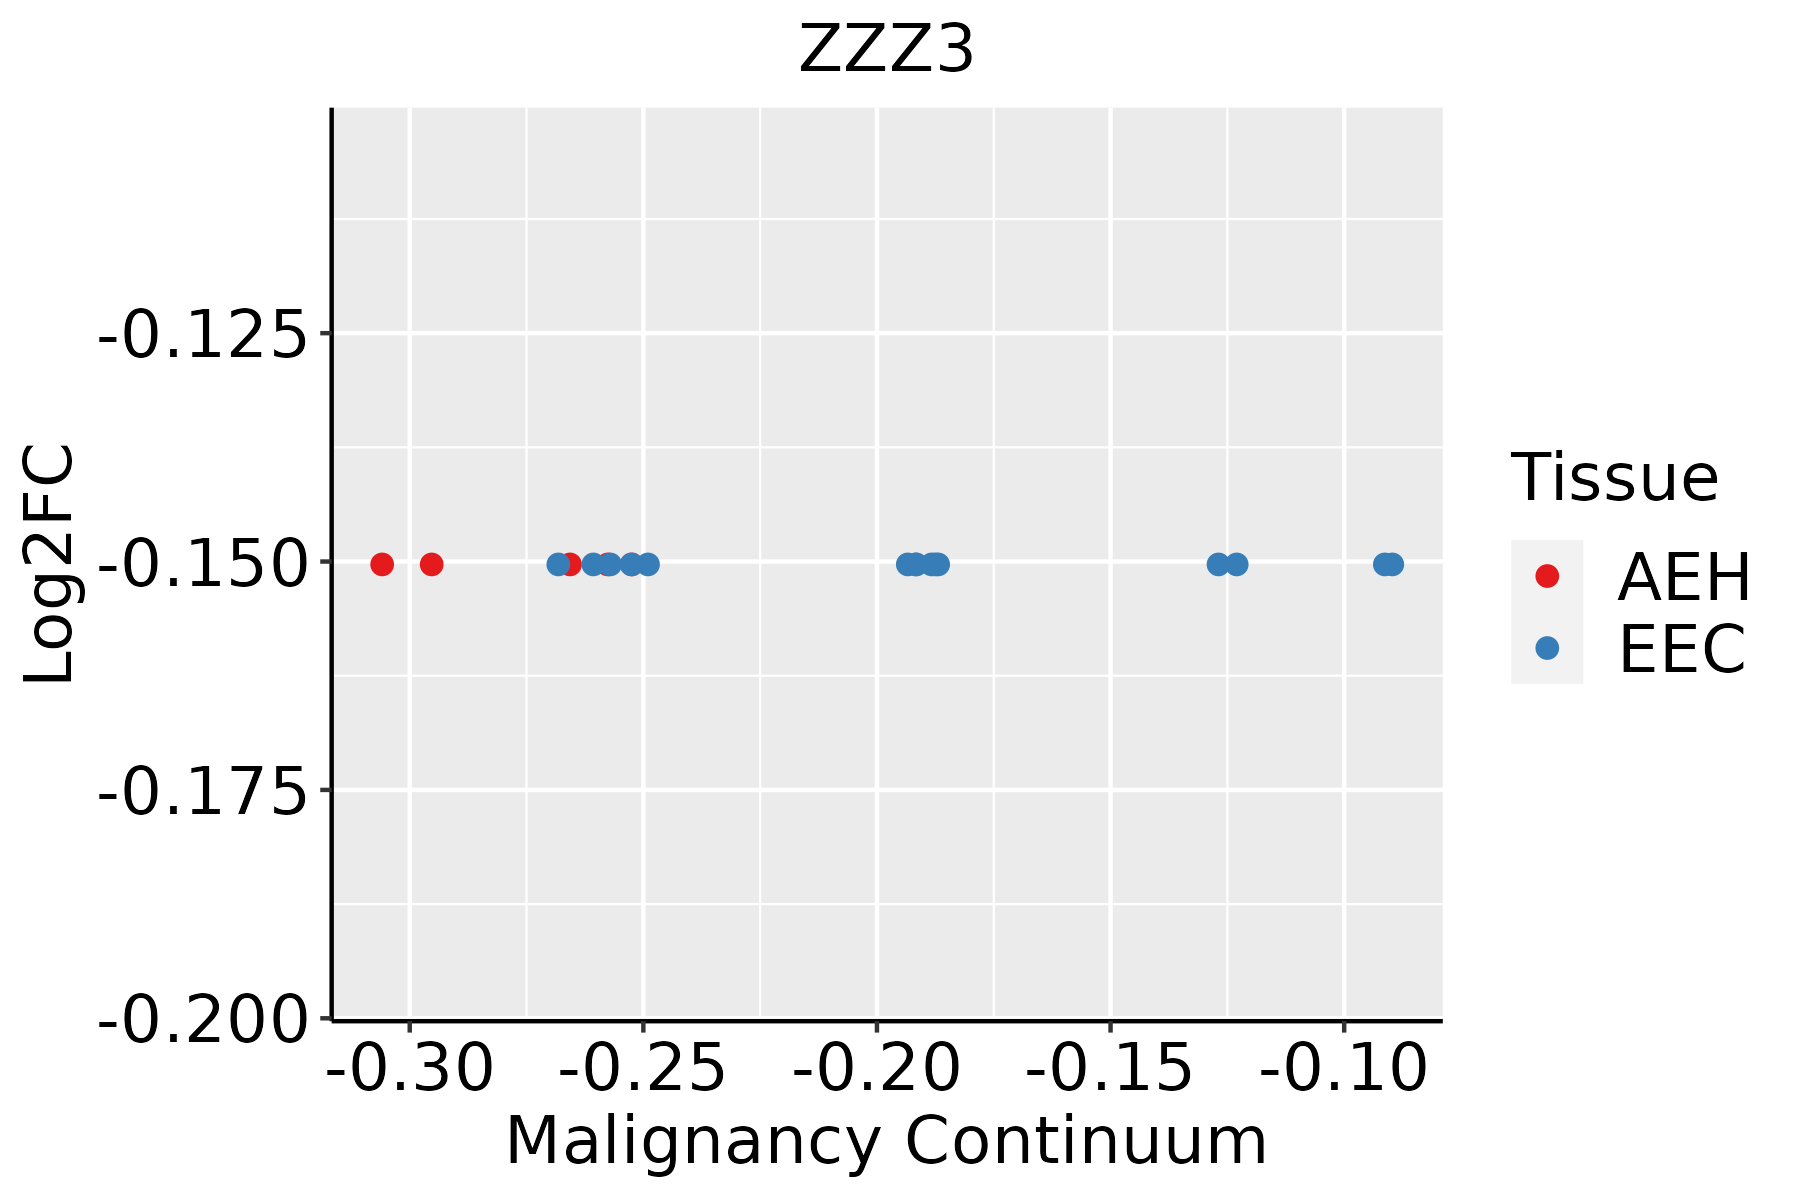 | AEH: Atypical endometrial hyperplasia |
| EEC: Endometrioid Cancer | ||
| Esophagus |  | ESCC: Esophageal squamous cell carcinoma |
| HGIN: High-grade intraepithelial neoplasias | ||
| LGIN: Low-grade intraepithelial neoplasias | ||
| Liver | 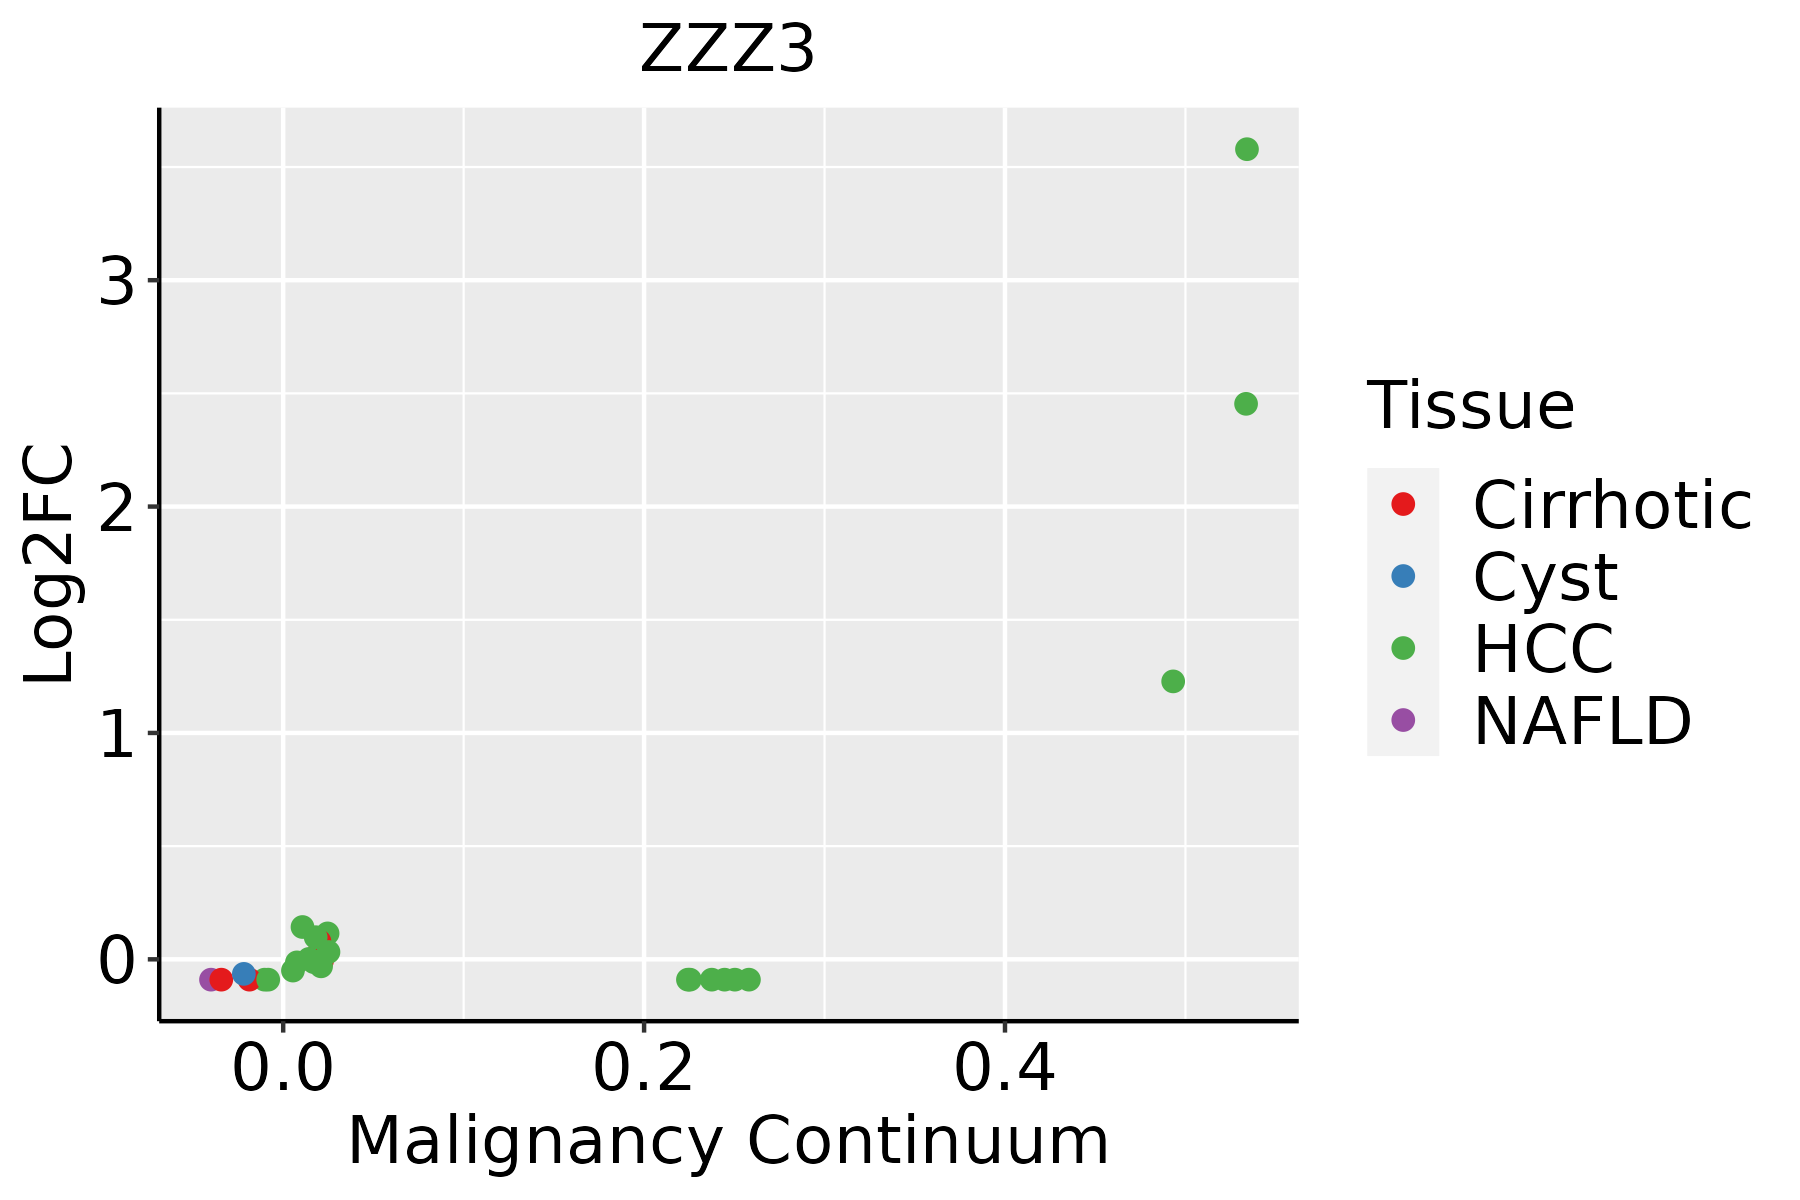 | HCC: Hepatocellular carcinoma |
| NAFLD: Non-alcoholic fatty liver disease | ||
| Oral Cavity |  | EOLP: Erosive Oral lichen planus |
| LP: leukoplakia | ||
| NEOLP: Non-erosive oral lichen planus | ||
| OSCC: Oral squamous cell carcinoma | ||
| Prostate |  | BPH: Benign Prostatic Hyperplasia |
| ∗log2FC in expression of this searched gene in stem-like cells from each diseased tissue sample relative to stem-like cells in normal samples in each tissue plotted against the malignancy continuum. Samples are colored based on if they are from different disease stage. |
Top |
Malignant transformation related pathway analysis |
| Find out the enriched GO biological processes and KEGG pathways involved in transition from healthy to precancer to cancer |
| Tissue | Disease Stage | Enriched GO biological Processes |
| Colorectum | AD |  |
| Colorectum | SER |  |
| Colorectum | MSS |  |
| Colorectum | MSI-H |  |
| Colorectum | FAP |  |
| ∗Top 15 enriched GO BP terms are showed in the bar plot of each disease state in each tissue. Each row represents a significant GO biological process which is colored according to the -log10(p.adjust). |
| Page: 1 2 3 4 5 6 7 8 9 |
| GO ID | Tissue | Disease Stage | Description | Gene Ratio | Bg Ratio | pvalue | p.adjust | Count |
| GO:0016570 | Colorectum | MSS | histone modification | 113/3467 | 463/18723 | 8.37e-04 | 8.68e-03 | 113 |
| GO:001657015 | Esophagus | ESCC | histone modification | 323/8552 | 463/18723 | 2.61e-26 | 7.88e-24 | 323 |
| GO:001820514 | Esophagus | ESCC | peptidyl-lysine modification | 259/8552 | 376/18723 | 3.90e-20 | 5.26e-18 | 259 |
| GO:001839413 | Esophagus | ESCC | peptidyl-lysine acetylation | 123/8552 | 169/18723 | 6.58e-13 | 2.94e-11 | 123 |
| GO:004354313 | Esophagus | ESCC | protein acylation | 165/8552 | 243/18723 | 1.69e-12 | 7.14e-11 | 165 |
| GO:000647313 | Esophagus | ESCC | protein acetylation | 140/8552 | 201/18723 | 4.37e-12 | 1.69e-10 | 140 |
| GO:001839313 | Esophagus | ESCC | internal peptidyl-lysine acetylation | 114/8552 | 158/18723 | 1.16e-11 | 4.24e-10 | 114 |
| GO:000647513 | Esophagus | ESCC | internal protein amino acid acetylation | 115/8552 | 160/18723 | 1.43e-11 | 5.08e-10 | 115 |
| GO:00165735 | Esophagus | ESCC | histone acetylation | 110/8552 | 152/18723 | 1.95e-11 | 6.81e-10 | 110 |
| GO:004396712 | Esophagus | ESCC | histone H4 acetylation | 53/8552 | 67/18723 | 2.11e-08 | 4.03e-07 | 53 |
| GO:00064731 | Liver | Cirrhotic | protein acetylation | 84/4634 | 201/18723 | 7.50e-08 | 2.25e-06 | 84 |
| GO:00183941 | Liver | Cirrhotic | peptidyl-lysine acetylation | 73/4634 | 169/18723 | 1.08e-07 | 3.07e-06 | 73 |
| GO:00435431 | Liver | Cirrhotic | protein acylation | 95/4634 | 243/18723 | 4.73e-07 | 1.07e-05 | 95 |
| GO:00182051 | Liver | Cirrhotic | peptidyl-lysine modification | 134/4634 | 376/18723 | 1.29e-06 | 2.59e-05 | 134 |
| GO:00064751 | Liver | Cirrhotic | internal protein amino acid acetylation | 65/4634 | 160/18723 | 6.66e-06 | 1.04e-04 | 65 |
| GO:00183931 | Liver | Cirrhotic | internal peptidyl-lysine acetylation | 64/4634 | 158/18723 | 8.75e-06 | 1.29e-04 | 64 |
| GO:001657011 | Liver | Cirrhotic | histone modification | 154/4634 | 463/18723 | 1.92e-05 | 2.57e-04 | 154 |
| GO:00165731 | Liver | Cirrhotic | histone acetylation | 61/4634 | 152/18723 | 1.97e-05 | 2.62e-04 | 61 |
| GO:0043967 | Liver | Cirrhotic | histone H4 acetylation | 31/4634 | 67/18723 | 1.03e-04 | 1.06e-03 | 31 |
| GO:001657021 | Liver | HCC | histone modification | 283/7958 | 463/18723 | 2.68e-16 | 2.33e-14 | 283 |
| Page: 1 2 3 |
| Pathway ID | Tissue | Disease Stage | Description | Gene Ratio | Bg Ratio | pvalue | p.adjust | qvalue | Count |
| Page: 1 |
Top |
Cell-cell communication analysis |
| Identification of potential cell-cell interactions between two cell types and their ligand-receptor pairs for different disease states |
| Ligand | Receptor | LRpair | Pathway | Tissue | Disease Stage |
| Page: 1 |
Top |
Single-cell gene regulatory network inference analysis |
| Find out the significant the regulons (TFs) and the target genes of each regulon across cell types for different disease states |
| TF | Cell Type | Tissue | Disease Stage | Target Gene | RSS | Regulon Activity |
| ∗The dot plots of a searched regulon are shown for all cell subpopulations in each disease state of each tissue based on the regulon specific score inferred using pySCENIC and by calculating the average expression. |
| Page: 1 |
Top |
Somatic mutation of malignant transformation related genes |
| Annotation of somatic variants for genes involved in malignant transformation |
| Hugo Symbol | Variant Class | Variant Classification | dbSNP RS | HGVSc | HGVSp | HGVSp Short | SWISSPROT | BIOTYPE | SIFT | PolyPhen | Tumor Sample Barcode | Tissue | Histology | Sex | Age | Stage | Therapy Types | Drugs | Outcome |
| ZZZ3 | SNV | Missense_Mutation | novel | c.2361G>C | p.Arg787Ser | p.R787S | Q8IYH5 | protein_coding | deleterious(0.01) | possibly_damaging(0.738) | TCGA-A2-A0CX-01 | Breast | breast invasive carcinoma | Female | <65 | I/II | Chemotherapy | adriamycin | SD |
| ZZZ3 | SNV | Missense_Mutation | c.2709N>T | p.Arg903Ser | p.R903S | Q8IYH5 | protein_coding | deleterious(0) | probably_damaging(0.994) | TCGA-A8-A09Q-01 | Breast | breast invasive carcinoma | Female | >=65 | III/IV | Hormone Therapy | anastrozole | SD | |
| ZZZ3 | SNV | Missense_Mutation | c.1477G>C | p.Asp493His | p.D493H | Q8IYH5 | protein_coding | deleterious(0) | probably_damaging(0.998) | TCGA-AC-A23H-01 | Breast | breast invasive carcinoma | Female | >=65 | I/II | Unknown | Unknown | PD | |
| ZZZ3 | SNV | Missense_Mutation | rs763631835 | c.1066N>T | p.Pro356Ser | p.P356S | Q8IYH5 | protein_coding | tolerated(0.69) | benign(0) | TCGA-AC-A5XS-01 | Breast | breast invasive carcinoma | Female | >=65 | I/II | Hormone Therapy | femara | SD |
| ZZZ3 | SNV | Missense_Mutation | c.2093N>A | p.Arg698Gln | p.R698Q | Q8IYH5 | protein_coding | deleterious(0) | probably_damaging(0.999) | TCGA-AR-A1AO-01 | Breast | breast invasive carcinoma | Female | <65 | I/II | Chemotherapy | doxorubicin | SD | |
| ZZZ3 | SNV | Missense_Mutation | c.1705C>A | p.Gln569Lys | p.Q569K | Q8IYH5 | protein_coding | tolerated(0.22) | benign(0.214) | TCGA-C8-A131-01 | Breast | breast invasive carcinoma | Female | >=65 | III/IV | Chemotherapy | 5-fluorouracil | CR | |
| ZZZ3 | insertion | Nonsense_Mutation | novel | c.926_927insTGATAAAAGTCTCTGCAGATATTGCCTGCAGTAACAGCCTAAGCT | p.Ser309_Ser310insAspLysSerLeuCysArgTyrCysLeuGlnTerGlnProLysLeu | p.S309_S310insDKSLCRYCLQ*QPKL | Q8IYH5 | protein_coding | TCGA-AN-A0FX-01 | Breast | breast invasive carcinoma | Female | <65 | I/II | Unknown | Unknown | SD | ||
| ZZZ3 | insertion | Nonsense_Mutation | novel | c.2042_2043insTATTCATAATGTTATAGAAATTTTCCTTTTACTTTTTACTGGATAGTT | p.Gln681delinsHisIleHisAsnValIleGluIlePheLeuLeuLeuPheThrGlyTerLeu | p.Q681delinsHIHNVIEIFLLLFTG*L | Q8IYH5 | protein_coding | TCGA-BH-A0AY-01 | Breast | breast invasive carcinoma | Female | <65 | I/II | Chemotherapy | SD | |||
| ZZZ3 | SNV | Missense_Mutation | novel | c.692N>T | p.Ser231Phe | p.S231F | Q8IYH5 | protein_coding | deleterious_low_confidence(0) | benign(0.293) | TCGA-MA-AA41-01 | Cervix | cervical & endocervical cancer | Female | <65 | I/II | Unknown | Unknown | SD |
| ZZZ3 | SNV | Missense_Mutation | novel | c.1423N>G | p.Gln475Glu | p.Q475E | Q8IYH5 | protein_coding | tolerated(1) | benign(0.007) | TCGA-PN-A8MA-01 | Cervix | cervical & endocervical cancer | Female | <65 | I/II | Chemotherapy | cisplatin | SD |
| Page: 1 2 3 4 5 6 7 8 |
Top |
Related drugs of malignant transformation related genes |
| Identification of chemicals and drugs interact with genes involved in malignant transfromation |
| (DGIdb 4.0) |
| Entrez ID | Symbol | Category | Interaction Types | Drug Claim Name | Drug Name | PMIDs |
| Page: 1 |

Copyright 2023-Present -The University of Texas Health Science Center at Houston |