
|
|||||
|
 | |
| |
| |
| |
| |
| |
|
Gene: ZZEF1 |
Gene summary for ZZEF1 |
| Gene information | Species | Human | Gene symbol | ZZEF1 | Gene ID | 23140 |
| Gene name | zinc finger ZZ-type and EF-hand domain containing 1 | |
| Gene Alias | ZZZ4 | |
| Cytomap | 17p13.2 | |
| Gene Type | protein-coding | GO ID | GO:0003674 | UniProtAcc | O43149 |
Top |
Malignant transformation analysis |
| Identification of the aberrant gene expression in precancerous and cancerous lesions by comparing the gene expression of stem-like cells in diseased tissues with normal stem cells |
| Entrez ID | Symbol | Replicates | Species | Organ | Tissue | Adj P-value | Log2FC | Malignancy |
| 23140 | ZZEF1 | HTA11_3410_2000001011 | Human | Colorectum | AD | 1.60e-11 | -5.00e-01 | 0.0155 |
| 23140 | ZZEF1 | HTA11_347_2000001011 | Human | Colorectum | AD | 2.53e-07 | 5.97e-01 | -0.1954 |
| 23140 | ZZEF1 | HTA11_866_3004761011 | Human | Colorectum | AD | 6.53e-06 | -3.92e-01 | 0.096 |
| 23140 | ZZEF1 | HTA11_10711_2000001011 | Human | Colorectum | AD | 4.58e-06 | -4.90e-01 | 0.0338 |
| 23140 | ZZEF1 | HTA11_6818_2000001021 | Human | Colorectum | AD | 7.09e-03 | -3.53e-01 | 0.0588 |
| 23140 | ZZEF1 | HTA11_99999970781_79442 | Human | Colorectum | MSS | 1.29e-14 | -5.33e-01 | 0.294 |
| 23140 | ZZEF1 | HTA11_99999971662_82457 | Human | Colorectum | MSS | 4.35e-11 | -4.48e-01 | 0.3859 |
| 23140 | ZZEF1 | HTA11_99999973899_84307 | Human | Colorectum | MSS | 1.55e-03 | -4.84e-01 | 0.2585 |
| 23140 | ZZEF1 | HTA11_99999974143_84620 | Human | Colorectum | MSS | 6.15e-10 | -4.63e-01 | 0.3005 |
| 23140 | ZZEF1 | F007 | Human | Colorectum | FAP | 8.79e-06 | -4.26e-01 | 0.1176 |
| 23140 | ZZEF1 | A002-C-010 | Human | Colorectum | FAP | 6.52e-04 | -2.40e-01 | 0.242 |
| 23140 | ZZEF1 | A001-C-207 | Human | Colorectum | FAP | 1.41e-07 | -3.32e-01 | 0.1278 |
| 23140 | ZZEF1 | A015-C-203 | Human | Colorectum | FAP | 2.04e-25 | -3.41e-01 | -0.1294 |
| 23140 | ZZEF1 | A015-C-204 | Human | Colorectum | FAP | 6.63e-04 | -1.20e-01 | -0.0228 |
| 23140 | ZZEF1 | A014-C-040 | Human | Colorectum | FAP | 3.97e-05 | -3.92e-01 | -0.1184 |
| 23140 | ZZEF1 | A002-C-201 | Human | Colorectum | FAP | 1.64e-13 | -2.19e-01 | 0.0324 |
| 23140 | ZZEF1 | A002-C-203 | Human | Colorectum | FAP | 3.99e-04 | -2.61e-01 | 0.2786 |
| 23140 | ZZEF1 | A001-C-119 | Human | Colorectum | FAP | 7.28e-07 | -2.96e-01 | -0.1557 |
| 23140 | ZZEF1 | A001-C-108 | Human | Colorectum | FAP | 8.74e-16 | -2.75e-01 | -0.0272 |
| 23140 | ZZEF1 | A002-C-205 | Human | Colorectum | FAP | 2.73e-23 | -2.55e-01 | -0.1236 |
| Page: 1 2 3 4 5 6 |
| Tissue | Expression Dynamics | Abbreviation |
| Colorectum (GSE201348) |  | FAP: Familial adenomatous polyposis |
| CRC: Colorectal cancer | ||
| Colorectum (HTA11) |  | AD: Adenomas |
| SER: Sessile serrated lesions | ||
| MSI-H: Microsatellite-high colorectal cancer | ||
| MSS: Microsatellite stable colorectal cancer | ||
| Esophagus | 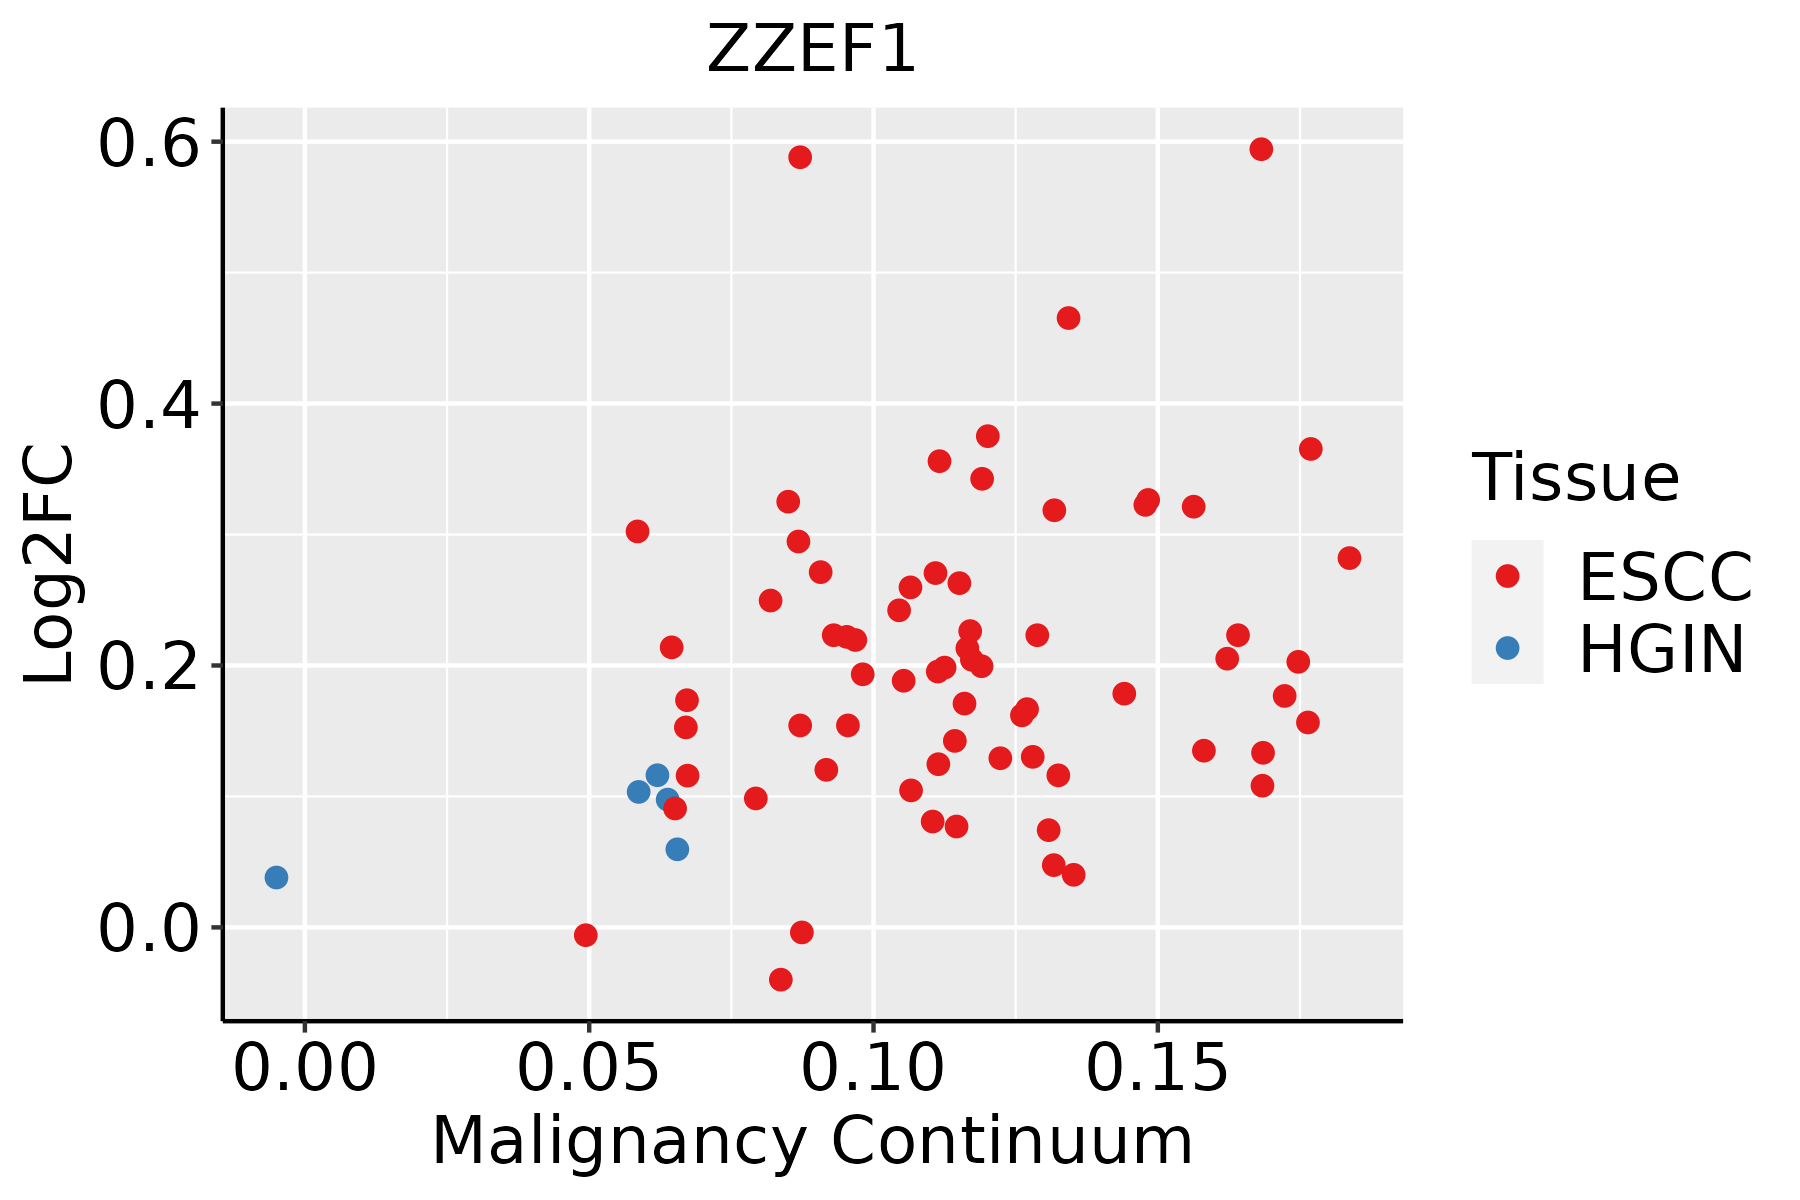 | ESCC: Esophageal squamous cell carcinoma |
| HGIN: High-grade intraepithelial neoplasias | ||
| LGIN: Low-grade intraepithelial neoplasias | ||
| Thyroid | 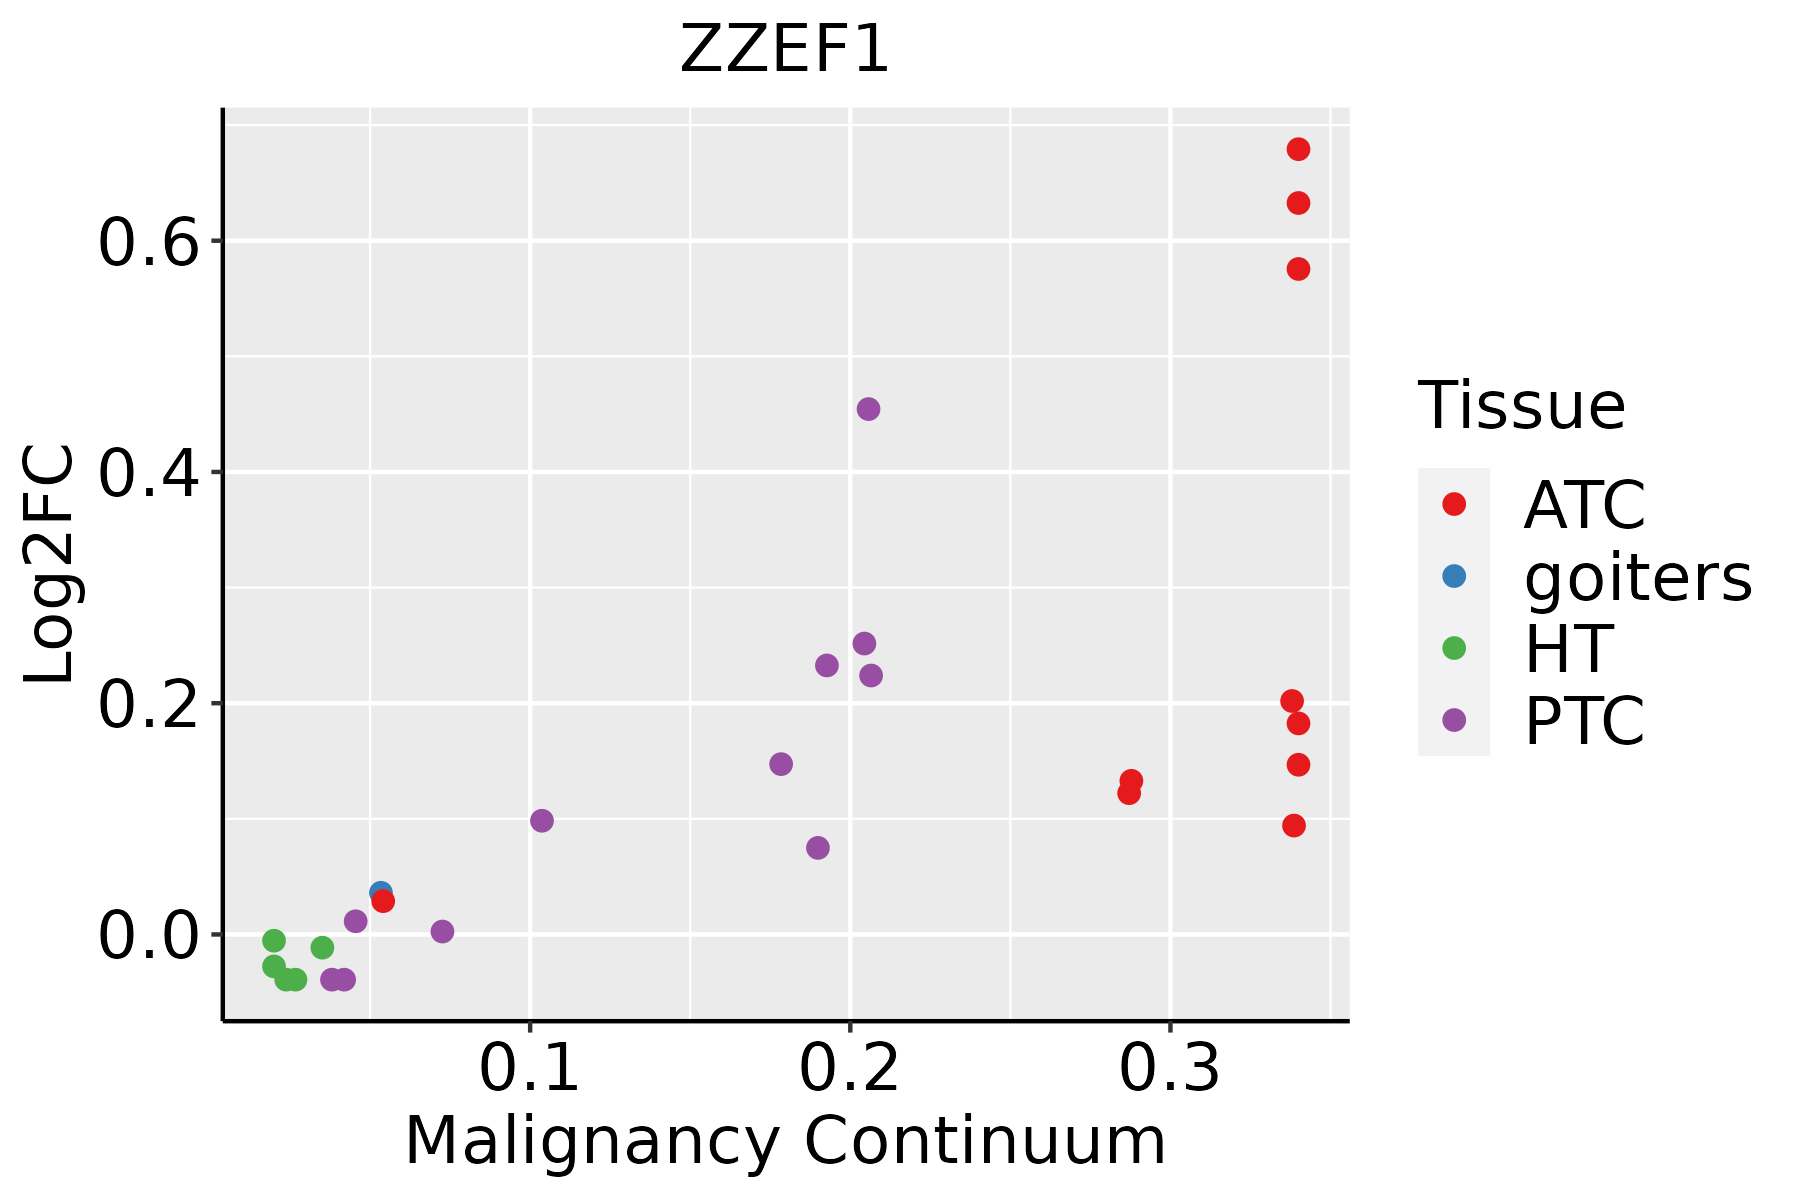 | ATC: Anaplastic thyroid cancer |
| HT: Hashimoto's thyroiditis | ||
| PTC: Papillary thyroid cancer |
| ∗log2FC in expression of this searched gene in stem-like cells from each diseased tissue sample relative to stem-like cells in normal samples in each tissue plotted against the malignancy continuum. Samples are colored based on if they are from different disease stage. |
Top |
Malignant transformation related pathway analysis |
| Find out the enriched GO biological processes and KEGG pathways involved in transition from healthy to precancer to cancer |
| Tissue | Disease Stage | Enriched GO biological Processes |
| Colorectum | AD |  |
| Colorectum | SER |  |
| Colorectum | MSS |  |
| Colorectum | MSI-H |  |
| Colorectum | FAP |  |
| ∗Top 15 enriched GO BP terms are showed in the bar plot of each disease state in each tissue. Each row represents a significant GO biological process which is colored according to the -log10(p.adjust). |
| Page: 1 2 3 4 5 6 7 8 9 |
| GO ID | Tissue | Disease Stage | Description | Gene Ratio | Bg Ratio | pvalue | p.adjust | Count |
| Page: 1 |
| Pathway ID | Tissue | Disease Stage | Description | Gene Ratio | Bg Ratio | pvalue | p.adjust | qvalue | Count |
| Page: 1 |
Top |
Cell-cell communication analysis |
| Identification of potential cell-cell interactions between two cell types and their ligand-receptor pairs for different disease states |
| Ligand | Receptor | LRpair | Pathway | Tissue | Disease Stage |
| Page: 1 |
Top |
Single-cell gene regulatory network inference analysis |
| Find out the significant the regulons (TFs) and the target genes of each regulon across cell types for different disease states |
| TF | Cell Type | Tissue | Disease Stage | Target Gene | RSS | Regulon Activity |
| ∗The dot plots of a searched regulon are shown for all cell subpopulations in each disease state of each tissue based on the regulon specific score inferred using pySCENIC and by calculating the average expression. |
| Page: 1 |
Top |
Somatic mutation of malignant transformation related genes |
| Annotation of somatic variants for genes involved in malignant transformation |
| Hugo Symbol | Variant Class | Variant Classification | dbSNP RS | HGVSc | HGVSp | HGVSp Short | SWISSPROT | BIOTYPE | SIFT | PolyPhen | Tumor Sample Barcode | Tissue | Histology | Sex | Age | Stage | Therapy Types | Drugs | Outcome |
| ZZEF1 | SNV | Missense_Mutation | novel | c.5782A>G | p.Thr1928Ala | p.T1928A | O43149 | protein_coding | tolerated(0.65) | benign(0) | TCGA-A7-A0CE-01 | Breast | breast invasive carcinoma | Female | <65 | I/II | Chemotherapy | adriamycin | SD |
| ZZEF1 | SNV | Missense_Mutation | rs546462540 | c.724N>C | p.Glu242Gln | p.E242Q | O43149 | protein_coding | tolerated(0.12) | probably_damaging(0.959) | TCGA-AC-A23H-01 | Breast | breast invasive carcinoma | Female | >=65 | I/II | Unknown | Unknown | PD |
| ZZEF1 | SNV | Missense_Mutation | c.889N>A | p.Val297Met | p.V297M | O43149 | protein_coding | deleterious(0) | probably_damaging(0.999) | TCGA-AN-A0AK-01 | Breast | breast invasive carcinoma | Female | >=65 | I/II | Unknown | Unknown | SD | |
| ZZEF1 | SNV | Missense_Mutation | rs756019778 | c.920C>G | p.Ala307Gly | p.A307G | O43149 | protein_coding | deleterious(0.03) | benign(0.243) | TCGA-AN-A0G0-01 | Breast | breast invasive carcinoma | Female | <65 | I/II | Unknown | Unknown | SD |
| ZZEF1 | SNV | Missense_Mutation | novel | c.6900N>A | p.Asp2300Glu | p.D2300E | O43149 | protein_coding | tolerated(0.05) | possibly_damaging(0.893) | TCGA-AR-A1AI-01 | Breast | breast invasive carcinoma | Female | <65 | I/II | Chemotherapy | cytoxan | PD |
| ZZEF1 | SNV | Missense_Mutation | c.2885N>T | p.Ser962Phe | p.S962F | O43149 | protein_coding | deleterious(0) | probably_damaging(0.982) | TCGA-BH-A18P-01 | Breast | breast invasive carcinoma | Female | <65 | I/II | Unknown | Unknown | PD | |
| ZZEF1 | SNV | Missense_Mutation | c.5018N>G | p.Ala1673Gly | p.A1673G | O43149 | protein_coding | deleterious(0.01) | probably_damaging(0.931) | TCGA-BH-A18U-01 | Breast | breast invasive carcinoma | Female | >=65 | III/IV | Unknown | Unknown | SD | |
| ZZEF1 | SNV | Missense_Mutation | c.2156N>A | p.Cys719Tyr | p.C719Y | O43149 | protein_coding | tolerated(0.2) | benign(0.345) | TCGA-BH-A1FD-01 | Breast | breast invasive carcinoma | Female | >=65 | I/II | Unknown | Unknown | PD | |
| ZZEF1 | SNV | Missense_Mutation | c.8689N>A | p.Arg2897Ser | p.R2897S | O43149 | protein_coding | deleterious(0.04) | possibly_damaging(0.907) | TCGA-D8-A1J8-01 | Breast | breast invasive carcinoma | Female | >=65 | I/II | Hormone Therapy | nolvadex | SD | |
| ZZEF1 | SNV | Missense_Mutation | c.3781N>C | p.Glu1261Gln | p.E1261Q | O43149 | protein_coding | tolerated(0.3) | benign(0.007) | TCGA-EW-A1IX-01 | Breast | breast invasive carcinoma | Female | <65 | I/II | Hormone Therapy | femara | SD |
| Page: 1 2 3 4 5 6 7 8 9 10 11 12 13 14 15 16 17 18 19 20 21 22 23 |
Top |
Related drugs of malignant transformation related genes |
| Identification of chemicals and drugs interact with genes involved in malignant transfromation |
| (DGIdb 4.0) |
| Entrez ID | Symbol | Category | Interaction Types | Drug Claim Name | Drug Name | PMIDs |
| Page: 1 |

Copyright 2023-Present -The University of Texas Health Science Center at Houston |