
|
|||||
|
 | |
| |
| |
| |
| |
| |
|
Gene: ZYX |
Gene summary for ZYX |
| Gene information | Species | Human | Gene symbol | ZYX | Gene ID | 7791 |
| Gene name | zyxin | |
| Gene Alias | ESP-2 | |
| Cytomap | 7q34 | |
| Gene Type | protein-coding | GO ID | GO:0002376 | UniProtAcc | Q15942 |
Top |
Malignant transformation analysis |
| Identification of the aberrant gene expression in precancerous and cancerous lesions by comparing the gene expression of stem-like cells in diseased tissues with normal stem cells |
| Entrez ID | Symbol | Replicates | Species | Organ | Tissue | Adj P-value | Log2FC | Malignancy |
| 7791 | ZYX | HTA11_3410_2000001011 | Human | Colorectum | AD | 1.25e-08 | 2.39e-01 | 0.0155 |
| 7791 | ZYX | HTA11_2487_2000001011 | Human | Colorectum | SER | 1.77e-05 | 3.30e-01 | -0.1808 |
| 7791 | ZYX | HTA11_1938_2000001011 | Human | Colorectum | AD | 2.94e-13 | 5.75e-01 | -0.0811 |
| 7791 | ZYX | HTA11_78_2000001011 | Human | Colorectum | AD | 8.01e-14 | 4.37e-01 | -0.1088 |
| 7791 | ZYX | HTA11_347_2000001011 | Human | Colorectum | AD | 5.83e-04 | 1.82e-01 | -0.1954 |
| 7791 | ZYX | HTA11_3361_2000001011 | Human | Colorectum | AD | 3.57e-04 | 2.91e-01 | -0.1207 |
| 7791 | ZYX | HTA11_696_2000001011 | Human | Colorectum | AD | 1.16e-02 | 2.16e-01 | -0.1464 |
| 7791 | ZYX | HTA11_1391_2000001011 | Human | Colorectum | AD | 2.61e-05 | 4.03e-01 | -0.059 |
| 7791 | ZYX | HTA11_546_2000001011 | Human | Colorectum | AD | 1.05e-03 | 3.39e-01 | -0.0842 |
| 7791 | ZYX | HTA11_9408_2000001011 | Human | Colorectum | AD | 1.01e-03 | 5.08e-01 | 0.0451 |
| 7791 | ZYX | HTA11_10623_2000001011 | Human | Colorectum | AD | 2.67e-02 | 2.51e-01 | -0.0177 |
| 7791 | ZYX | HTA11_6801_2000001011 | Human | Colorectum | SER | 2.37e-03 | 3.66e-01 | 0.0171 |
| 7791 | ZYX | HTA11_10711_2000001011 | Human | Colorectum | AD | 9.93e-07 | 4.12e-01 | 0.0338 |
| 7791 | ZYX | HTA11_7696_3000711011 | Human | Colorectum | AD | 2.00e-20 | 4.95e-01 | 0.0674 |
| 7791 | ZYX | HTA11_6818_2000001011 | Human | Colorectum | AD | 9.79e-04 | 3.45e-01 | 0.0112 |
| 7791 | ZYX | HTA11_99999965104_69814 | Human | Colorectum | MSS | 9.12e-23 | 6.86e-01 | 0.281 |
| 7791 | ZYX | HTA11_99999971662_82457 | Human | Colorectum | MSS | 1.14e-13 | 4.30e-01 | 0.3859 |
| 7791 | ZYX | HTA11_99999973899_84307 | Human | Colorectum | MSS | 2.49e-12 | 6.82e-01 | 0.2585 |
| 7791 | ZYX | HTA11_99999974143_84620 | Human | Colorectum | MSS | 2.13e-08 | 2.80e-01 | 0.3005 |
| 7791 | ZYX | LZE3D | Human | Esophagus | HGIN | 4.39e-03 | 5.11e-01 | 0.0668 |
| Page: 1 2 3 4 5 6 7 8 |
| Tissue | Expression Dynamics | Abbreviation |
| Colorectum (GSE201348) | 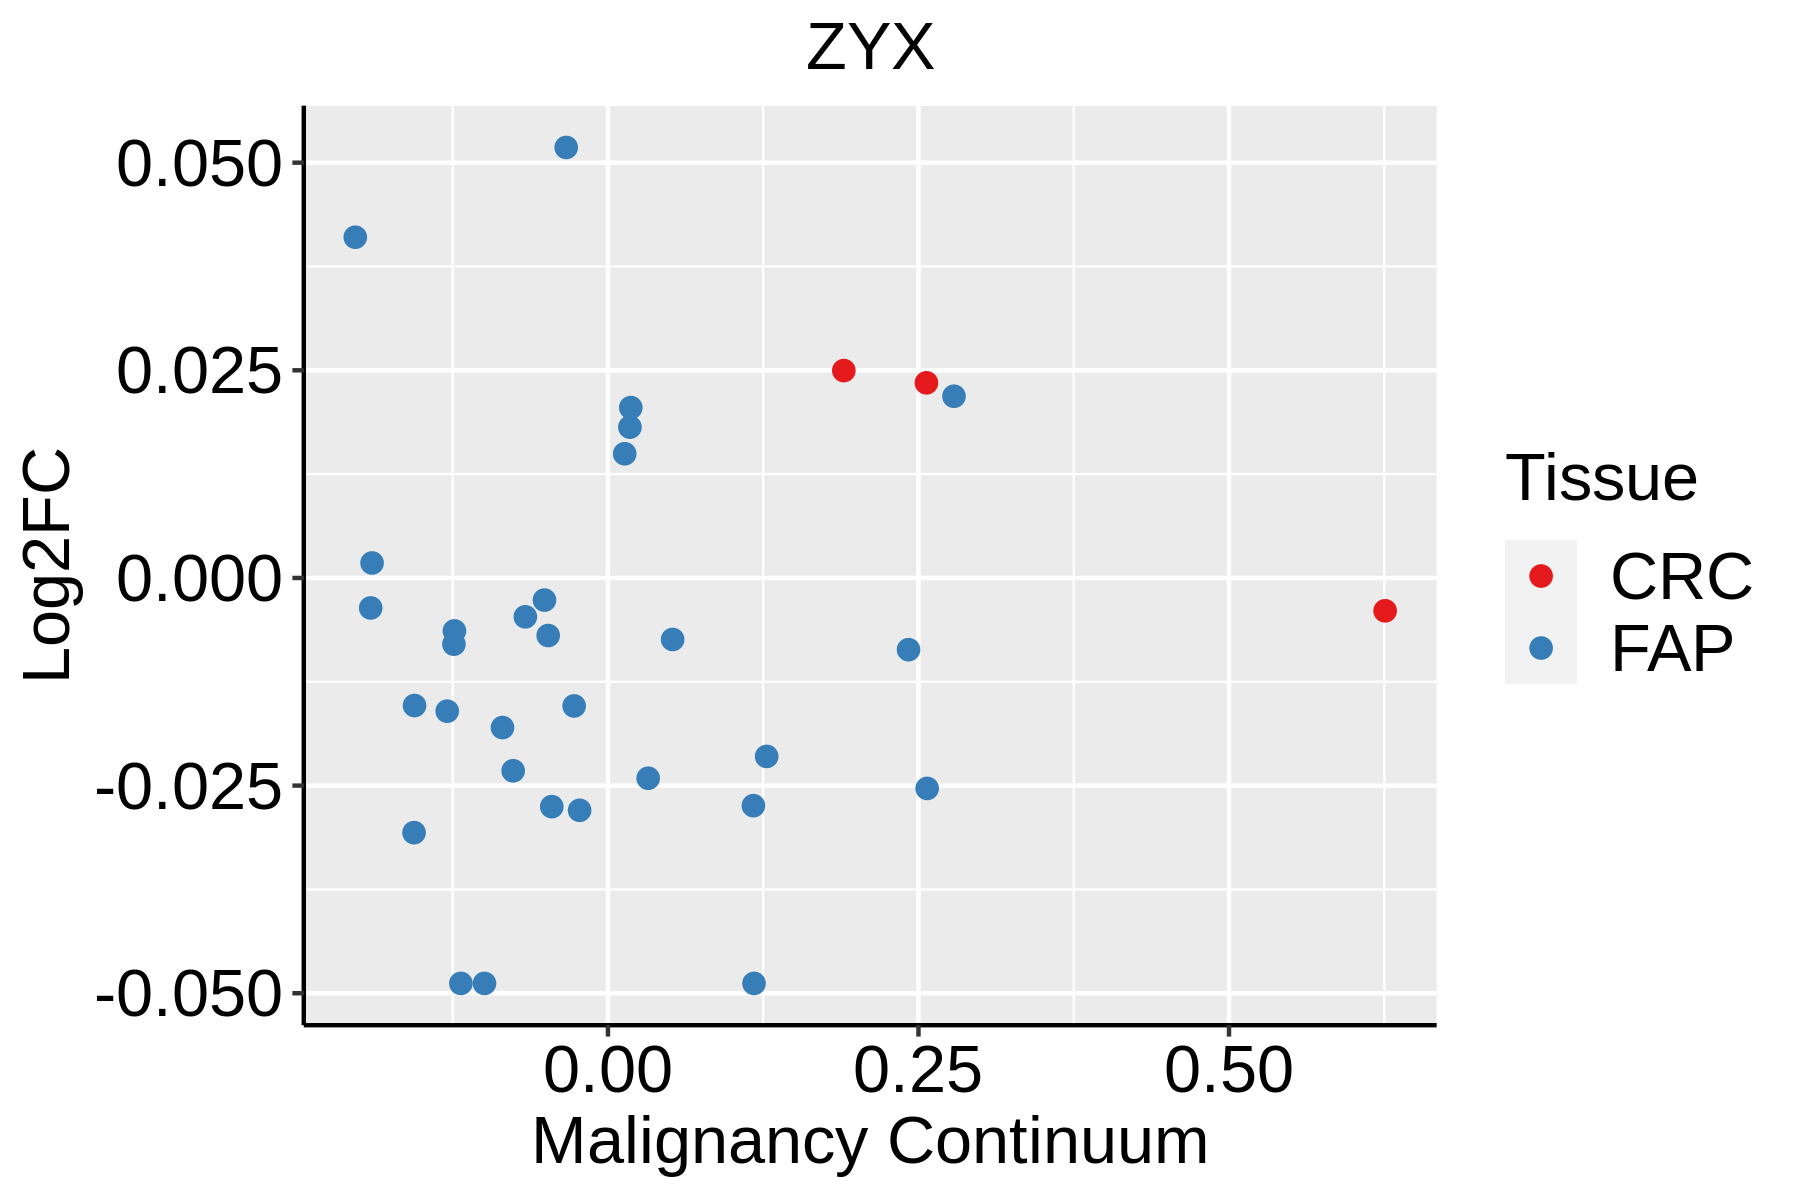 | FAP: Familial adenomatous polyposis |
| CRC: Colorectal cancer | ||
| Colorectum (HTA11) |  | AD: Adenomas |
| SER: Sessile serrated lesions | ||
| MSI-H: Microsatellite-high colorectal cancer | ||
| MSS: Microsatellite stable colorectal cancer | ||
| Esophagus | 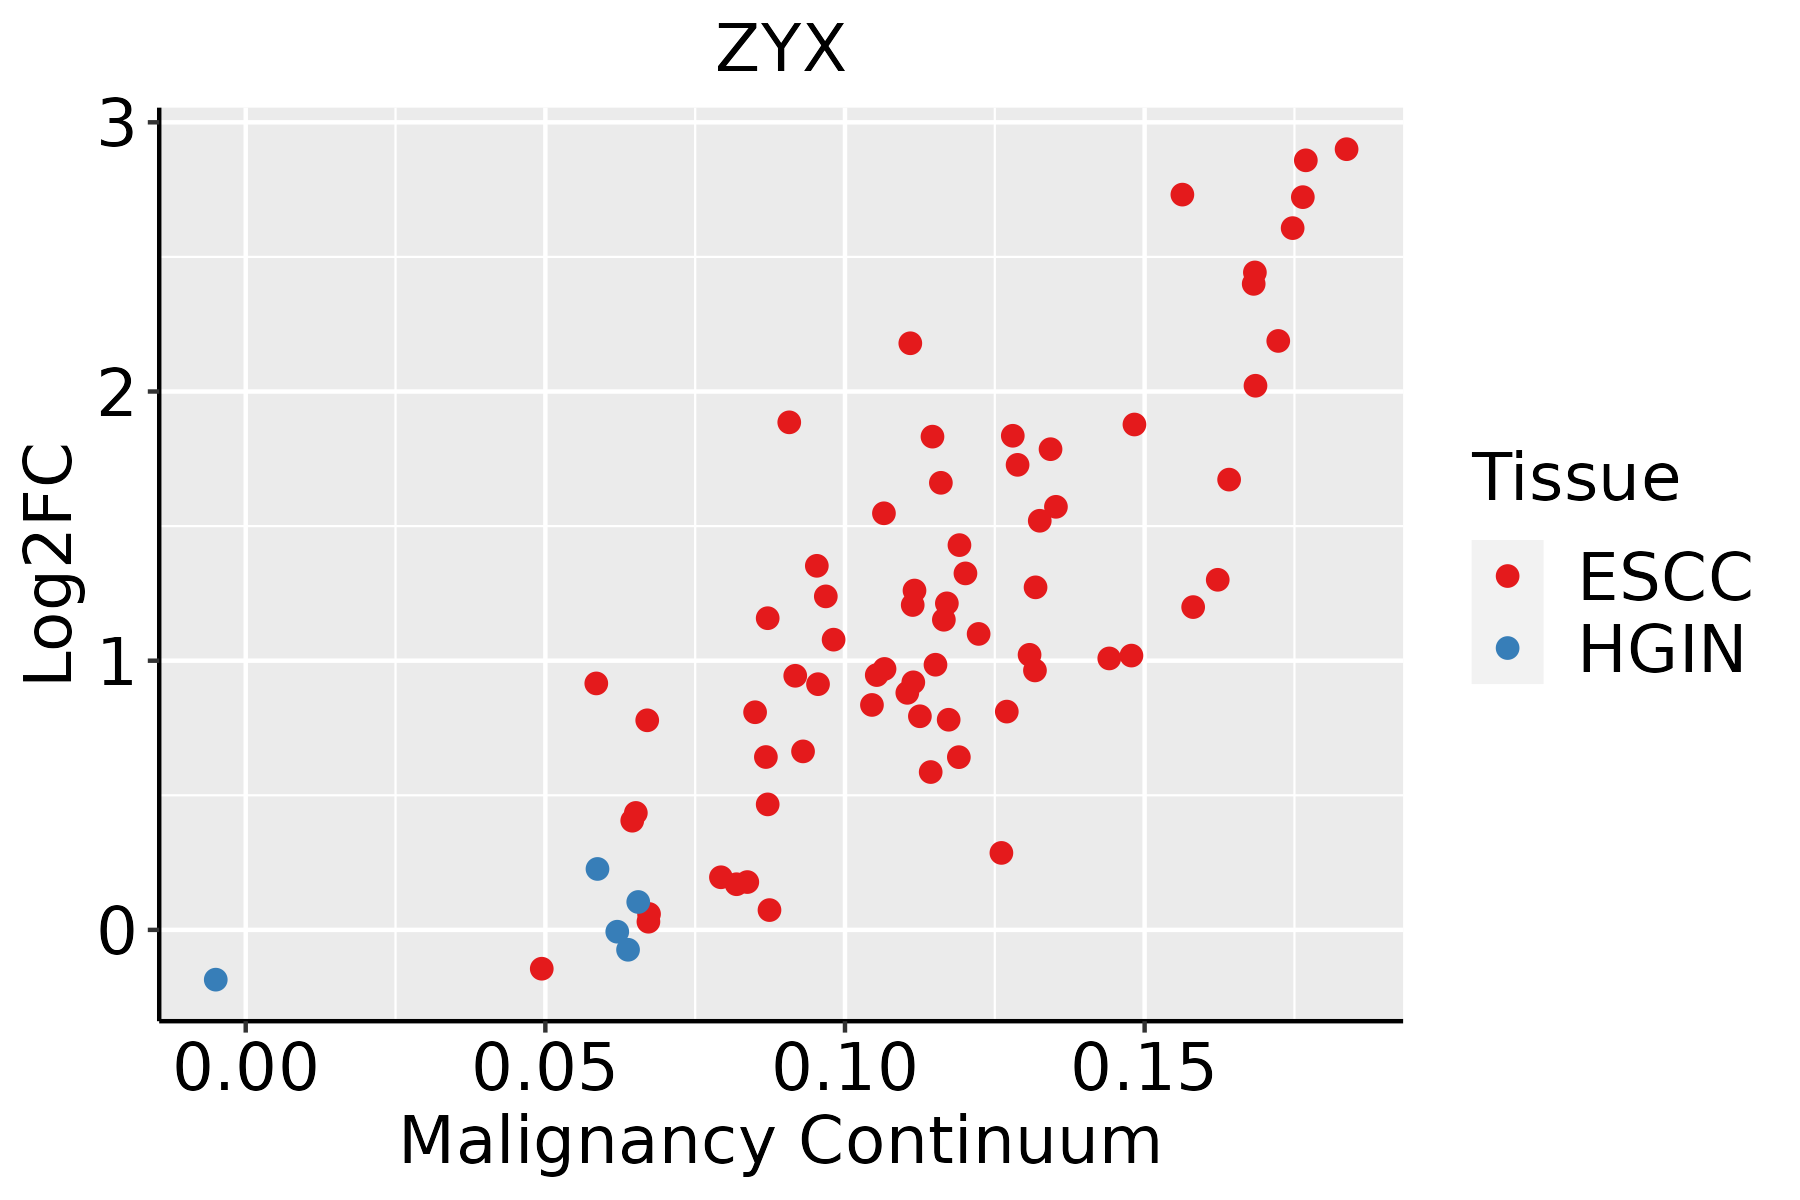 | ESCC: Esophageal squamous cell carcinoma |
| HGIN: High-grade intraepithelial neoplasias | ||
| LGIN: Low-grade intraepithelial neoplasias | ||
| Liver | 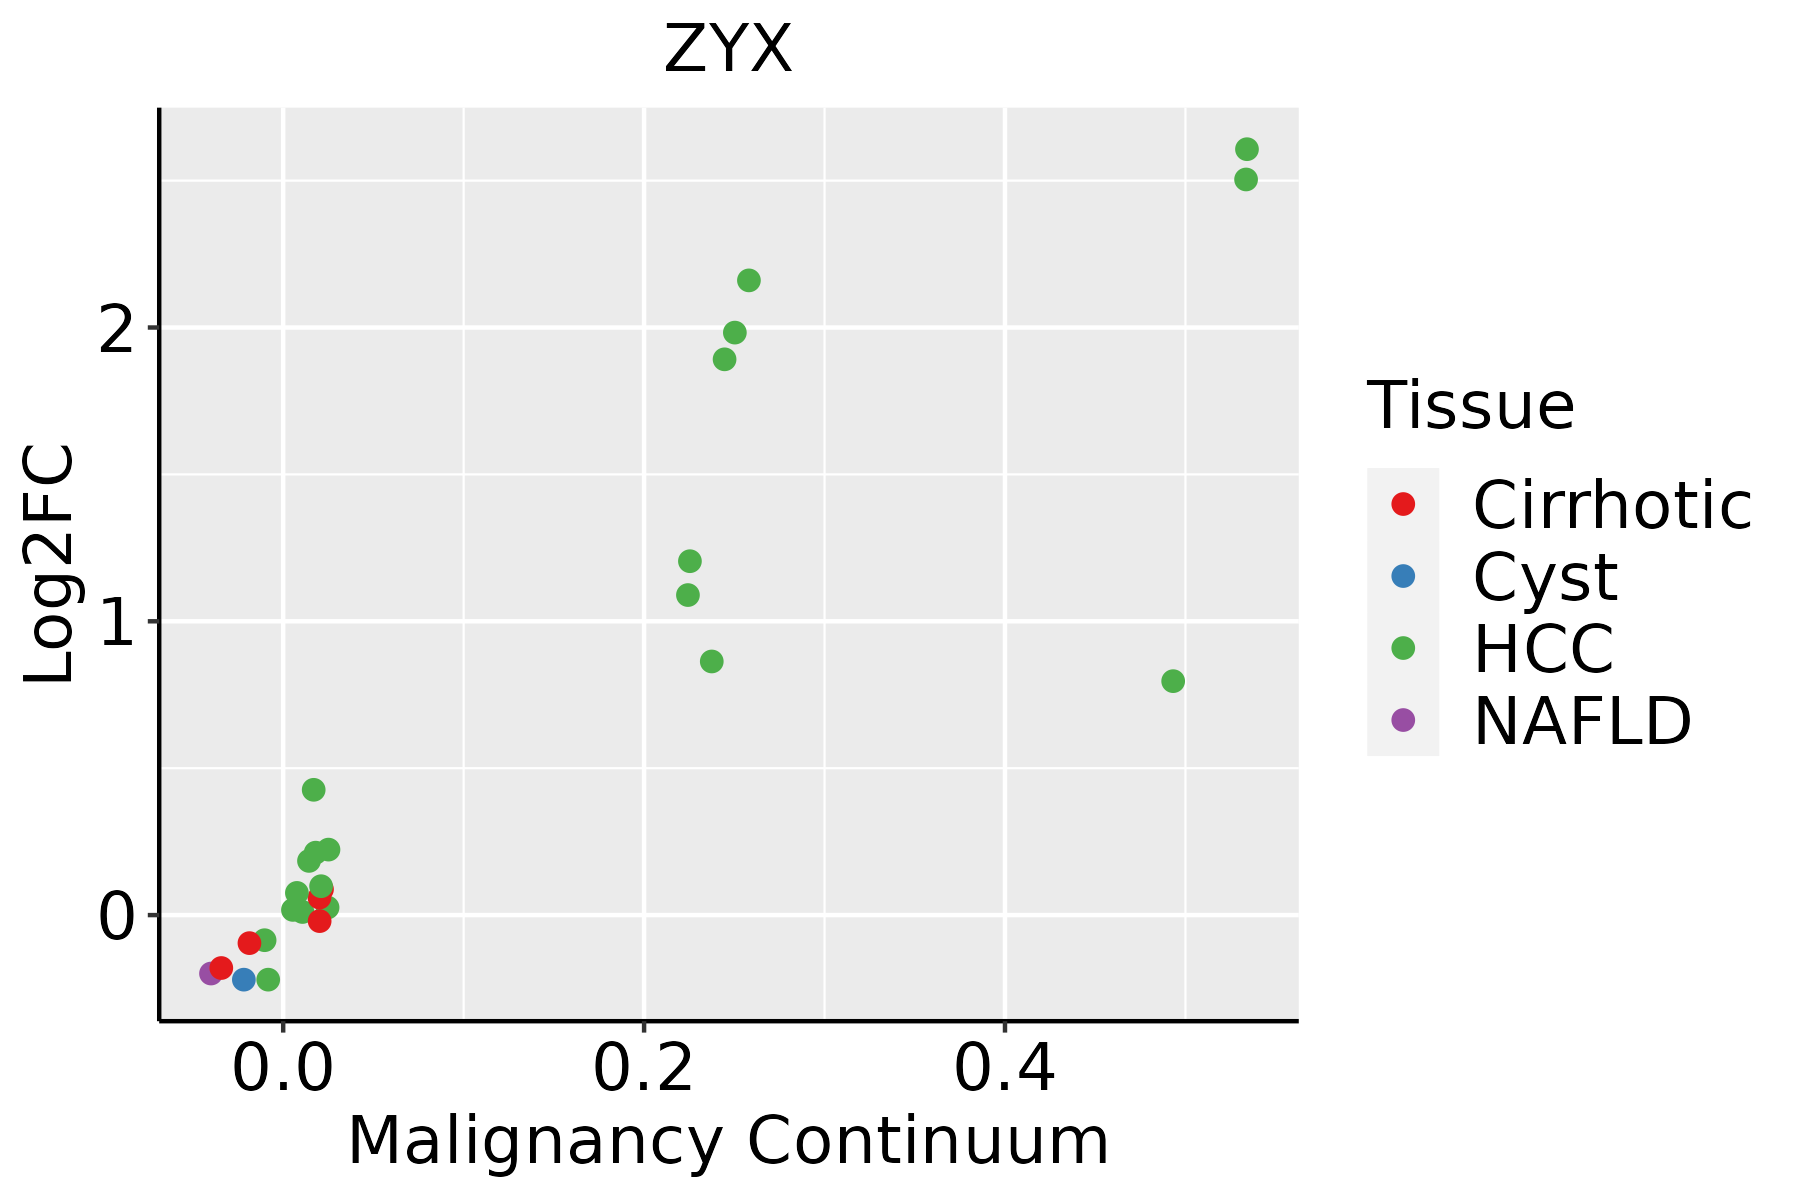 | HCC: Hepatocellular carcinoma |
| NAFLD: Non-alcoholic fatty liver disease | ||
| Oral Cavity | 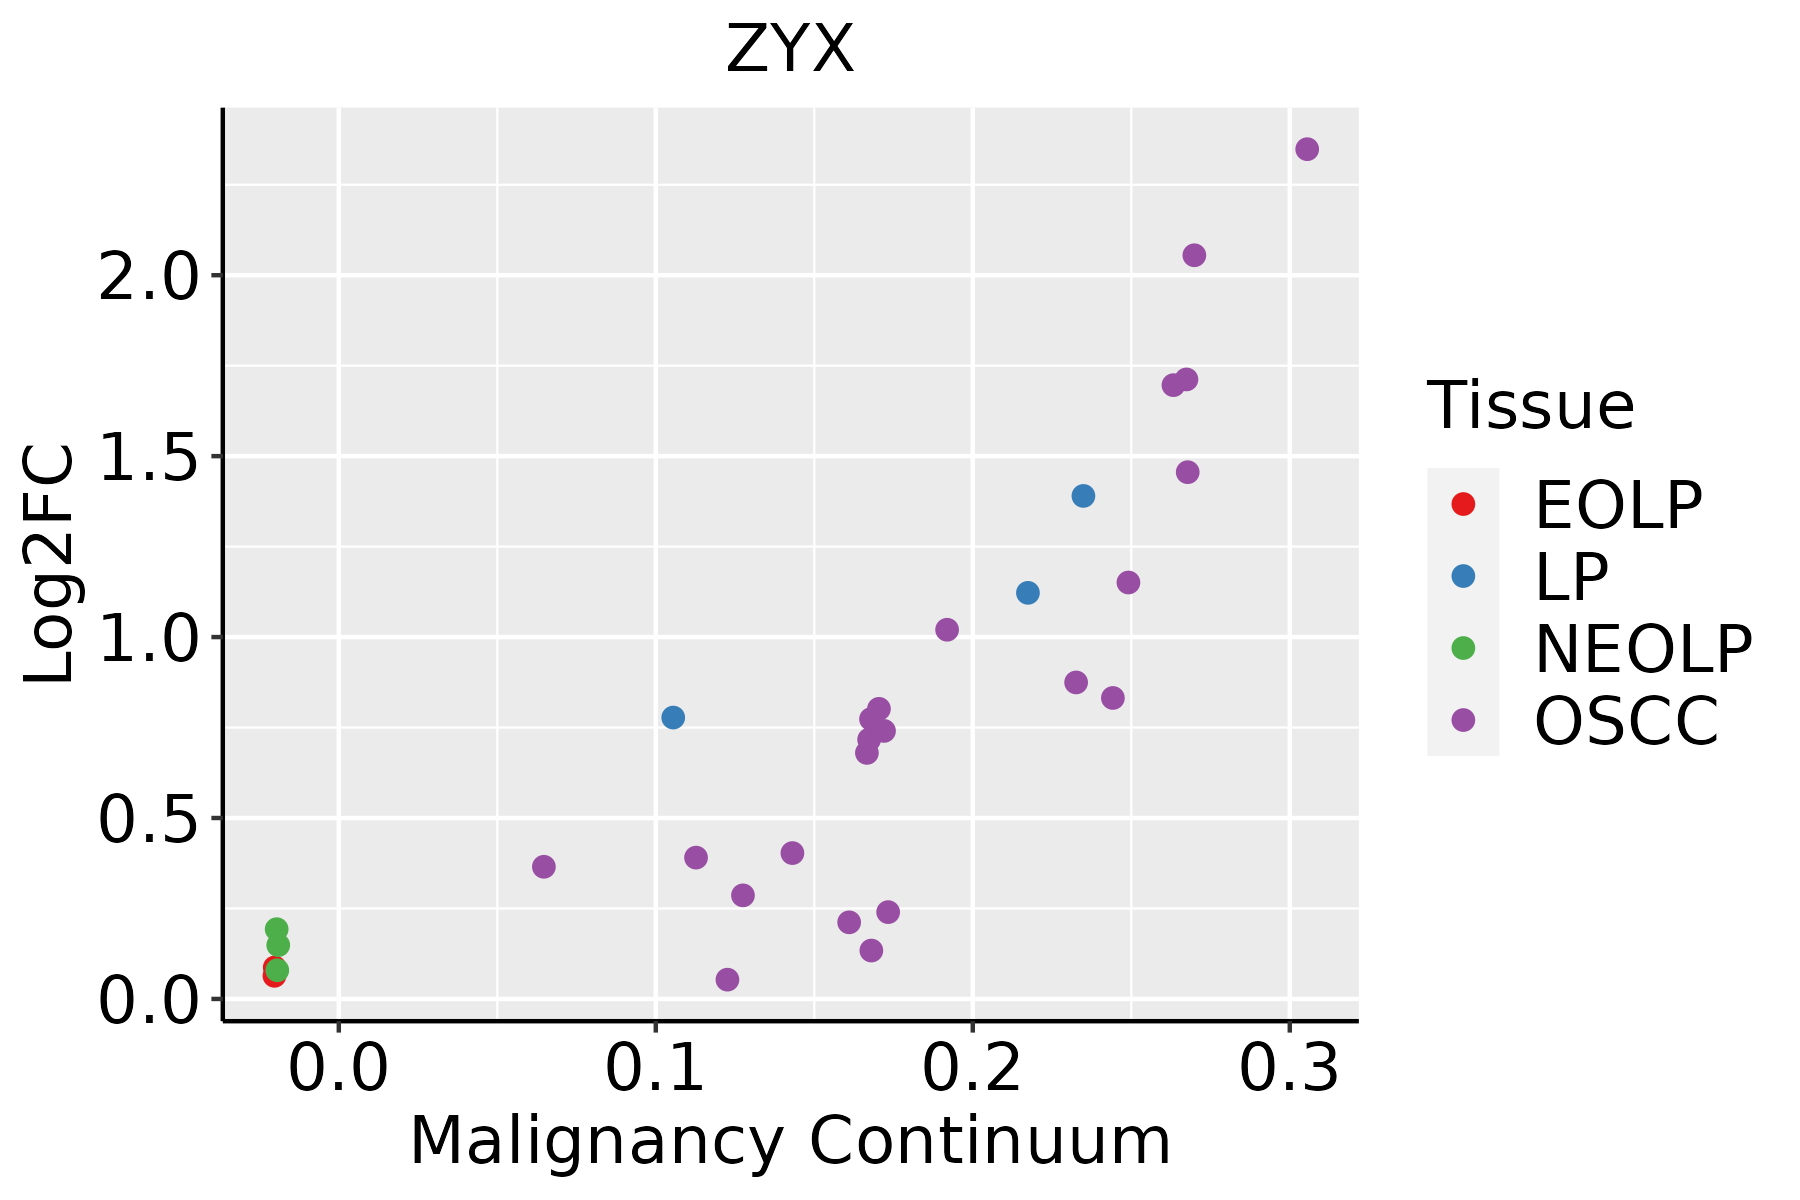 | EOLP: Erosive Oral lichen planus |
| LP: leukoplakia | ||
| NEOLP: Non-erosive oral lichen planus | ||
| OSCC: Oral squamous cell carcinoma | ||
| Prostate | 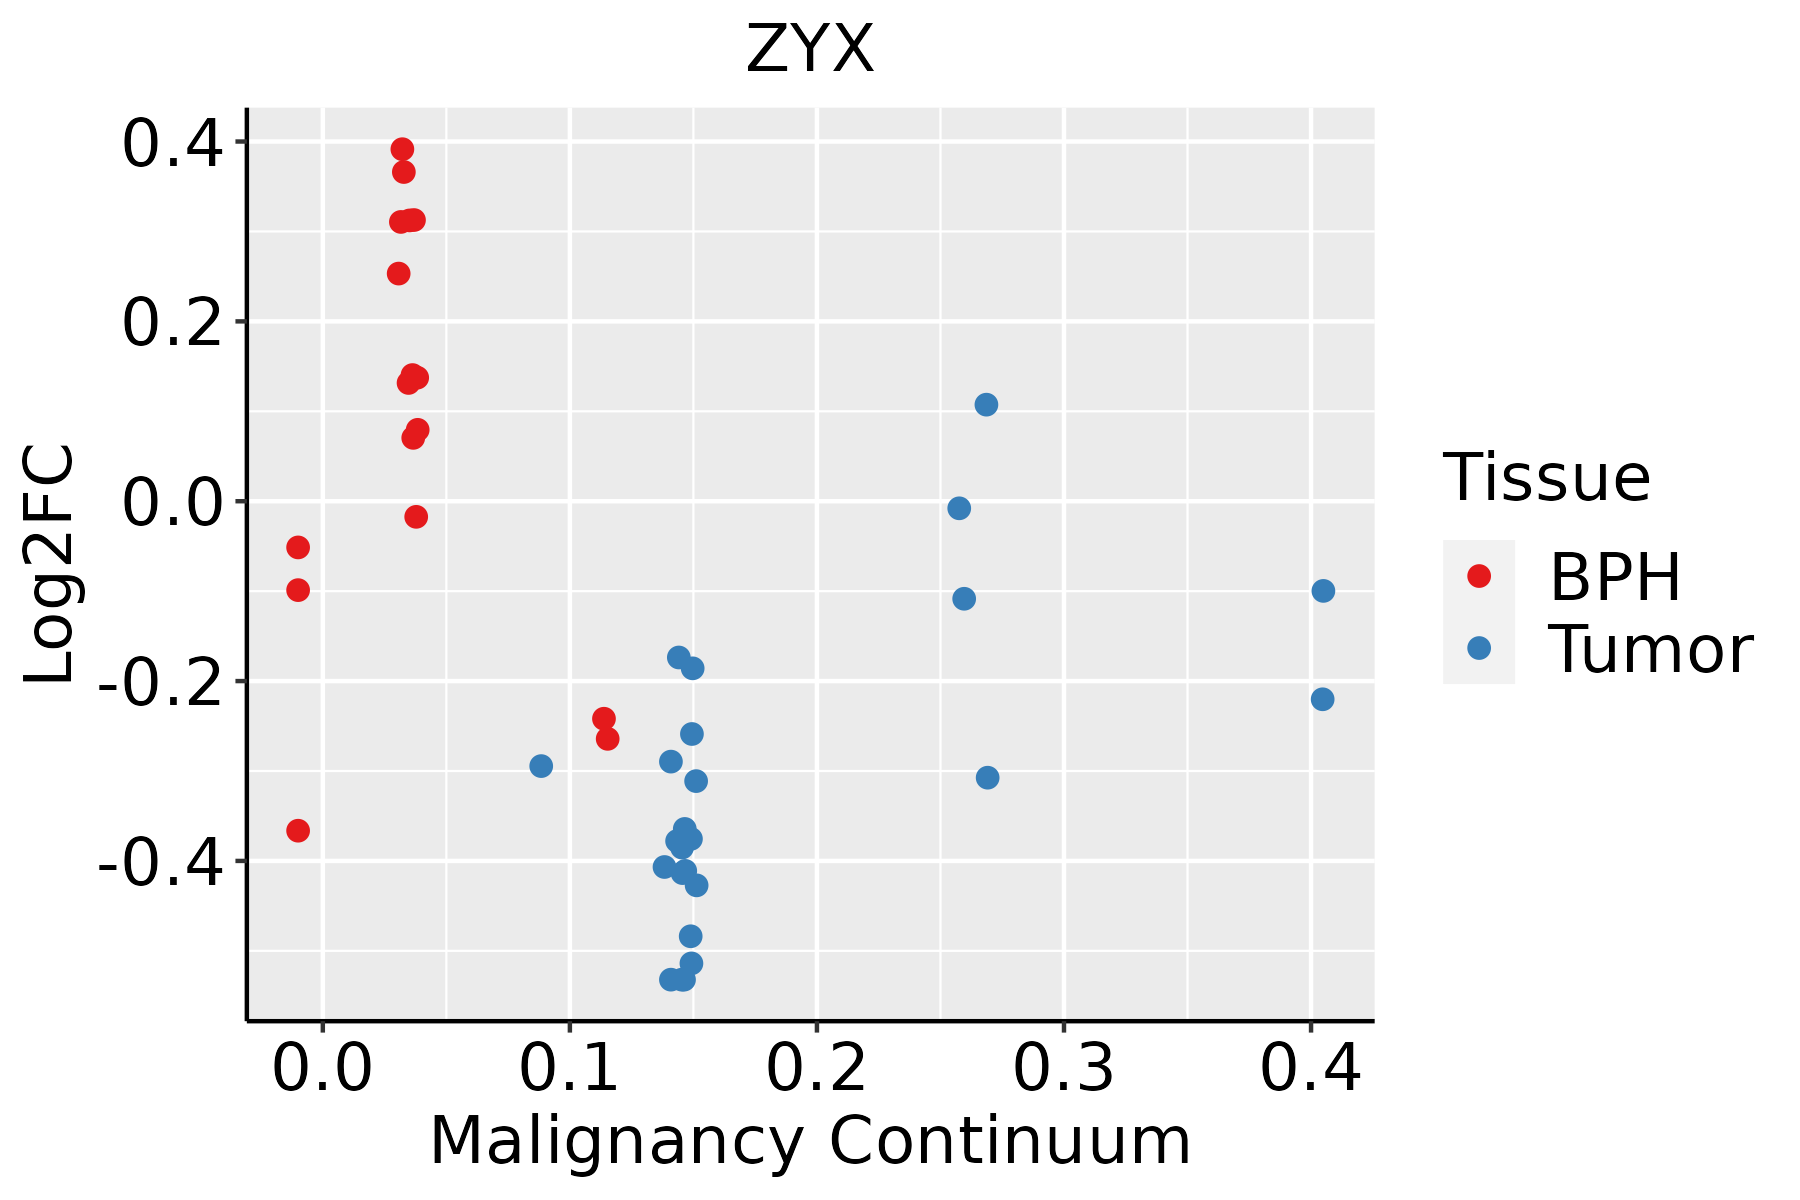 | BPH: Benign Prostatic Hyperplasia |
| Skin | 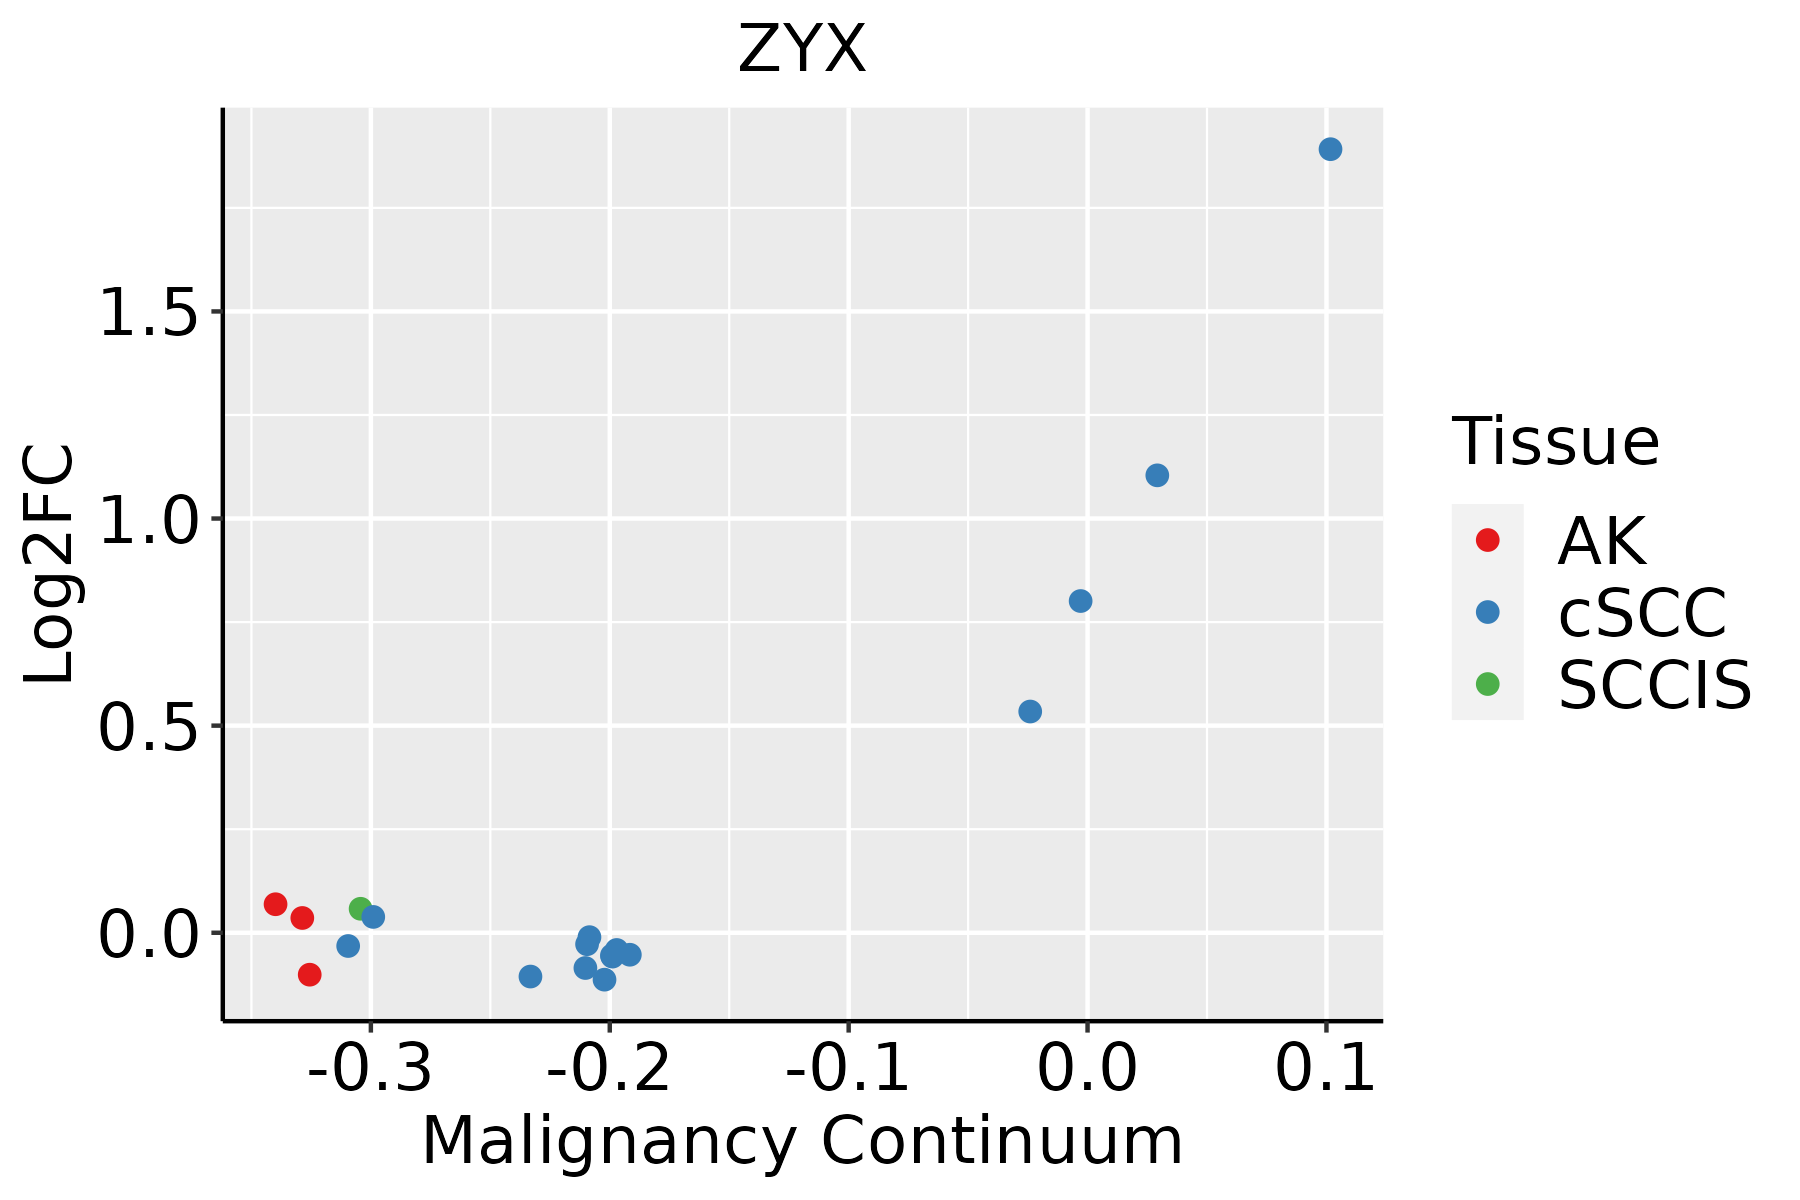 | AK: Actinic keratosis |
| cSCC: Cutaneous squamous cell carcinoma | ||
| SCCIS:squamous cell carcinoma in situ | ||
| Thyroid | 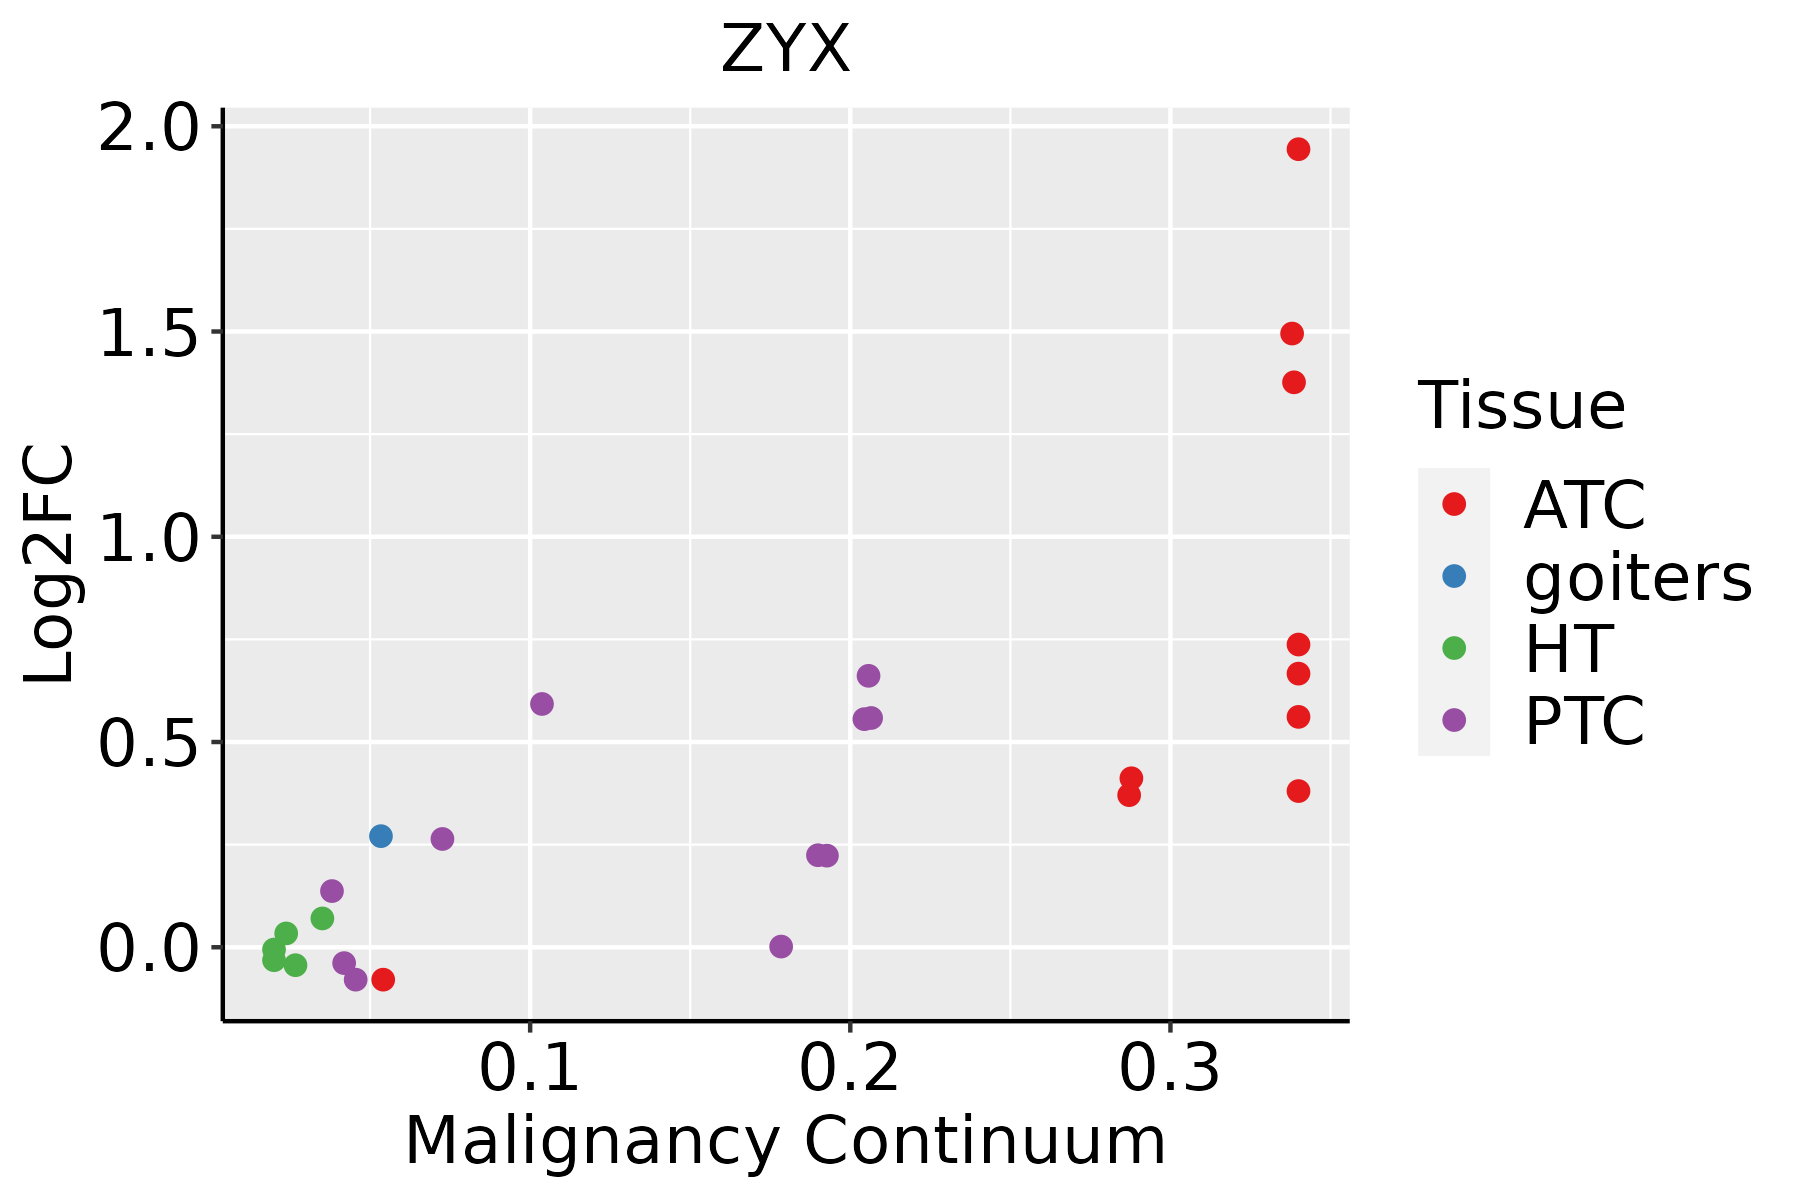 | ATC: Anaplastic thyroid cancer |
| HT: Hashimoto's thyroiditis | ||
| PTC: Papillary thyroid cancer |
| ∗log2FC in expression of this searched gene in stem-like cells from each diseased tissue sample relative to stem-like cells in normal samples in each tissue plotted against the malignancy continuum. Samples are colored based on if they are from different disease stage. |
Top |
Malignant transformation related pathway analysis |
| Find out the enriched GO biological processes and KEGG pathways involved in transition from healthy to precancer to cancer |
| Tissue | Disease Stage | Enriched GO biological Processes |
| Colorectum | AD |  |
| Colorectum | SER |  |
| Colorectum | MSS |  |
| Colorectum | MSI-H |  |
| Colorectum | FAP |  |
| ∗Top 15 enriched GO BP terms are showed in the bar plot of each disease state in each tissue. Each row represents a significant GO biological process which is colored according to the -log10(p.adjust). |
| Page: 1 2 3 4 5 6 7 8 9 |
| GO ID | Tissue | Disease Stage | Description | Gene Ratio | Bg Ratio | pvalue | p.adjust | Count |
| GO:0007015 | Colorectum | AD | actin filament organization | 167/3918 | 442/18723 | 1.65e-16 | 7.94e-14 | 167 |
| GO:0031589 | Colorectum | AD | cell-substrate adhesion | 116/3918 | 363/18723 | 4.68e-07 | 1.76e-05 | 116 |
| GO:0061572 | Colorectum | AD | actin filament bundle organization | 60/3918 | 161/18723 | 1.33e-06 | 4.23e-05 | 60 |
| GO:0051017 | Colorectum | AD | actin filament bundle assembly | 58/3918 | 157/18723 | 2.74e-06 | 7.89e-05 | 58 |
| GO:0007160 | Colorectum | AD | cell-matrix adhesion | 75/3918 | 233/18723 | 3.56e-05 | 6.45e-04 | 75 |
| GO:0031032 | Colorectum | AD | actomyosin structure organization | 65/3918 | 196/18723 | 4.17e-05 | 7.37e-04 | 65 |
| GO:0030038 | Colorectum | AD | contractile actin filament bundle assembly | 39/3918 | 106/18723 | 1.22e-04 | 1.78e-03 | 39 |
| GO:0043149 | Colorectum | AD | stress fiber assembly | 39/3918 | 106/18723 | 1.22e-04 | 1.78e-03 | 39 |
| GO:0007178 | Colorectum | AD | transmembrane receptor protein serine/threonine kinase signaling pathway | 99/3918 | 355/18723 | 9.92e-04 | 9.28e-03 | 99 |
| GO:0071559 | Colorectum | AD | response to transforming growth factor beta | 74/3918 | 256/18723 | 1.45e-03 | 1.23e-02 | 74 |
| GO:0071560 | Colorectum | AD | cellular response to transforming growth factor beta stimulus | 72/3918 | 250/18723 | 1.85e-03 | 1.52e-02 | 72 |
| GO:0007179 | Colorectum | AD | transforming growth factor beta receptor signaling pathway | 59/3918 | 198/18723 | 1.94e-03 | 1.58e-02 | 59 |
| GO:00070151 | Colorectum | SER | actin filament organization | 134/2897 | 442/18723 | 1.39e-15 | 5.70e-13 | 134 |
| GO:00615721 | Colorectum | SER | actin filament bundle organization | 48/2897 | 161/18723 | 2.97e-06 | 1.19e-04 | 48 |
| GO:00510171 | Colorectum | SER | actin filament bundle assembly | 46/2897 | 157/18723 | 7.88e-06 | 2.69e-04 | 46 |
| GO:00315891 | Colorectum | SER | cell-substrate adhesion | 86/2897 | 363/18723 | 2.36e-05 | 6.64e-04 | 86 |
| GO:00300381 | Colorectum | SER | contractile actin filament bundle assembly | 29/2897 | 106/18723 | 1.19e-03 | 1.36e-02 | 29 |
| GO:00431491 | Colorectum | SER | stress fiber assembly | 29/2897 | 106/18723 | 1.19e-03 | 1.36e-02 | 29 |
| GO:00071601 | Colorectum | SER | cell-matrix adhesion | 53/2897 | 233/18723 | 2.10e-03 | 2.06e-02 | 53 |
| GO:00310321 | Colorectum | SER | actomyosin structure organization | 45/2897 | 196/18723 | 3.60e-03 | 3.03e-02 | 45 |
| Page: 1 2 3 4 5 6 7 8 9 |
| Pathway ID | Tissue | Disease Stage | Description | Gene Ratio | Bg Ratio | pvalue | p.adjust | qvalue | Count |
| hsa04510 | Colorectum | AD | Focal adhesion | 67/2092 | 203/8465 | 4.40e-03 | 2.17e-02 | 1.38e-02 | 67 |
| hsa045101 | Colorectum | AD | Focal adhesion | 67/2092 | 203/8465 | 4.40e-03 | 2.17e-02 | 1.38e-02 | 67 |
| hsa0451020 | Esophagus | ESCC | Focal adhesion | 127/4205 | 203/8465 | 1.25e-04 | 4.99e-04 | 2.56e-04 | 127 |
| hsa04510111 | Esophagus | ESCC | Focal adhesion | 127/4205 | 203/8465 | 1.25e-04 | 4.99e-04 | 2.56e-04 | 127 |
| hsa0451021 | Liver | Cirrhotic | Focal adhesion | 93/2530 | 203/8465 | 9.27e-07 | 1.10e-05 | 6.80e-06 | 93 |
| hsa0451031 | Liver | Cirrhotic | Focal adhesion | 93/2530 | 203/8465 | 9.27e-07 | 1.10e-05 | 6.80e-06 | 93 |
| hsa0451041 | Liver | HCC | Focal adhesion | 125/4020 | 203/8465 | 3.12e-05 | 1.88e-04 | 1.04e-04 | 125 |
| hsa0451051 | Liver | HCC | Focal adhesion | 125/4020 | 203/8465 | 3.12e-05 | 1.88e-04 | 1.04e-04 | 125 |
| hsa0451019 | Oral cavity | OSCC | Focal adhesion | 128/3704 | 203/8465 | 1.71e-08 | 1.63e-07 | 8.31e-08 | 128 |
| hsa04510110 | Oral cavity | OSCC | Focal adhesion | 128/3704 | 203/8465 | 1.71e-08 | 1.63e-07 | 8.31e-08 | 128 |
| hsa0451043 | Oral cavity | NEOLP | Focal adhesion | 71/1112 | 203/8465 | 7.25e-16 | 7.68e-14 | 4.83e-14 | 71 |
| hsa0451053 | Oral cavity | NEOLP | Focal adhesion | 71/1112 | 203/8465 | 7.25e-16 | 7.68e-14 | 4.83e-14 | 71 |
| hsa0451017 | Prostate | BPH | Focal adhesion | 85/1718 | 203/8465 | 1.17e-12 | 2.28e-11 | 1.41e-11 | 85 |
| hsa0451018 | Prostate | BPH | Focal adhesion | 85/1718 | 203/8465 | 1.17e-12 | 2.28e-11 | 1.41e-11 | 85 |
| hsa0451025 | Prostate | Tumor | Focal adhesion | 84/1791 | 203/8465 | 3.44e-11 | 6.69e-10 | 4.15e-10 | 84 |
| hsa0451035 | Prostate | Tumor | Focal adhesion | 84/1791 | 203/8465 | 3.44e-11 | 6.69e-10 | 4.15e-10 | 84 |
| Page: 1 |
Top |
Cell-cell communication analysis |
| Identification of potential cell-cell interactions between two cell types and their ligand-receptor pairs for different disease states |
| Ligand | Receptor | LRpair | Pathway | Tissue | Disease Stage |
| Page: 1 |
Top |
Single-cell gene regulatory network inference analysis |
| Find out the significant the regulons (TFs) and the target genes of each regulon across cell types for different disease states |
| TF | Cell Type | Tissue | Disease Stage | Target Gene | RSS | Regulon Activity |
| ∗The dot plots of a searched regulon are shown for all cell subpopulations in each disease state of each tissue based on the regulon specific score inferred using pySCENIC and by calculating the average expression. |
| Page: 1 |
Top |
Somatic mutation of malignant transformation related genes |
| Annotation of somatic variants for genes involved in malignant transformation |
| Hugo Symbol | Variant Class | Variant Classification | dbSNP RS | HGVSc | HGVSp | HGVSp Short | SWISSPROT | BIOTYPE | SIFT | PolyPhen | Tumor Sample Barcode | Tissue | Histology | Sex | Age | Stage | Therapy Types | Drugs | Outcome |
| ZYX | SNV | Missense_Mutation | novel | c.1348N>T | p.Pro450Ser | p.P450S | Q15942 | protein_coding | deleterious(0.03) | possibly_damaging(0.696) | TCGA-E9-A3HO-01 | Breast | breast invasive carcinoma | Female | <65 | I/II | Chemotherapy | cyclophosphamide | CR |
| ZYX | SNV | Missense_Mutation | novel | c.1421N>G | p.Ala474Gly | p.A474G | Q15942 | protein_coding | tolerated(0.14) | possibly_damaging(0.824) | TCGA-C5-A8YT-01 | Cervix | cervical & endocervical cancer | Female | <65 | I/II | Chemotherapy | cisplatin | PD |
| ZYX | SNV | Missense_Mutation | novel | c.467N>T | p.Asp156Val | p.D156V | Q15942 | protein_coding | tolerated(0.06) | benign(0.353) | TCGA-EK-A2GZ-01 | Cervix | cervical & endocervical cancer | Female | <65 | III/IV | Unknown | Unknown | SD |
| ZYX | SNV | Missense_Mutation | rs758266725 | c.802N>G | p.Pro268Ala | p.P268A | Q15942 | protein_coding | tolerated(0.11) | benign(0.039) | TCGA-VS-A958-01 | Cervix | cervical & endocervical cancer | Female | <65 | I/II | Chemotherapy | cisplatin | CR |
| ZYX | SNV | Missense_Mutation | novel | c.737C>A | p.Ser246Tyr | p.S246Y | Q15942 | protein_coding | tolerated(0.39) | possibly_damaging(0.601) | TCGA-CA-6717-01 | Colorectum | colon adenocarcinoma | Male | <65 | I/II | Chemotherapy | oxaliplatin | CR |
| ZYX | SNV | Missense_Mutation | c.320N>T | p.Ala107Val | p.A107V | Q15942 | protein_coding | deleterious(0.04) | benign(0.051) | TCGA-CK-5913-01 | Colorectum | colon adenocarcinoma | Female | <65 | I/II | Unknown | Unknown | SD | |
| ZYX | SNV | Missense_Mutation | novel | c.1216C>T | p.His406Tyr | p.H406Y | Q15942 | protein_coding | deleterious(0) | probably_damaging(0.998) | TCGA-F4-6461-01 | Colorectum | colon adenocarcinoma | Female | <65 | III/IV | Unknown | Unknown | PD |
| ZYX | SNV | Missense_Mutation | novel | c.812C>A | p.Pro271His | p.P271H | Q15942 | protein_coding | deleterious(0) | possibly_damaging(0.841) | TCGA-AG-A002-01 | Colorectum | rectum adenocarcinoma | Male | <65 | I/II | Unknown | Unknown | SD |
| ZYX | SNV | Missense_Mutation | rs569088357 | c.1516N>A | p.Val506Ile | p.V506I | Q15942 | protein_coding | deleterious(0) | possibly_damaging(0.506) | TCGA-EI-6507-01 | Colorectum | rectum adenocarcinoma | Male | <65 | I/II | Unknown | Unknown | SD |
| ZYX | SNV | Missense_Mutation | novel | c.538C>A | p.Pro180Thr | p.P180T | Q15942 | protein_coding | deleterious(0.01) | probably_damaging(0.981) | TCGA-F5-6814-01 | Colorectum | rectum adenocarcinoma | Male | <65 | I/II | Unknown | Unknown | SD |
| Page: 1 2 3 4 5 |
Top |
Related drugs of malignant transformation related genes |
| Identification of chemicals and drugs interact with genes involved in malignant transfromation |
| (DGIdb 4.0) |
| Entrez ID | Symbol | Category | Interaction Types | Drug Claim Name | Drug Name | PMIDs |
| Page: 1 |

Copyright 2023-Present -The University of Texas Health Science Center at Houston |