Schematic overview of the cellular and molecular mechanisms involved in the cancer progression, including the proposed cellular and molecular mechanisms in cancer cells trajectory. AT1: alveolar type 1 cells; AT2: alveolar type 2 cells; AAH: atypical adenomatous hyperplasia; AIS: adenocarcinoma in situ; MIA: minimally invasive adenocarcinoma; IA: invasive adenocarcinoma; EMT: epithelial-mesenchymal transition

Home

Download

Statistics

Help

Contact

Center for Computational Systems Medicine
leaf

Gene summary

leaf

Malignant transformation analysis

leaf

Malignant transformation related pathway analysis

leaf

Cell-cell communication analysis

leaf

Single-cell gene regulatory network inference analysis

leaf

Somatic mutation of malignant transformation related genes

leaf

Related drugs of malignant transformation related genes

Gene: ZYG11B

Gene summary for ZYG11B

check button Gene summary.

Gene informationSpeciesHuman
Gene symbol

ZYG11B

Gene ID

79699

Gene namezyg-11 family member B, cell cycle regulator
Gene AliasZYG11
Cytomap1p32.3
Gene Typeprotein-coding
GO ID

GO:0006508

UniProtAcc

B4DK95


Top

Malignant transformation analysis

check button Identification of the aberrant gene expression in precancerous and cancerous lesions by comparing the gene expression of stem-like cells in diseased tissues with normal stem cells
check button Malignant transformation involving gene list.
Entrez IDSymbolReplicatesSpeciesOrganTissueAdj P-valueLog2FCMalignancy
79699ZYG11BHTA11_347_2000001011HumanColorectumAD1.98e-094.69e-01-0.1954
79699ZYG11BHTA11_1391_2000001011HumanColorectumAD4.91e-034.13e-01-0.059
79699ZYG11BHTA11_7663_2000001011HumanColorectumSER1.40e-099.40e-010.0131
79699ZYG11BHTA11_6818_2000001011HumanColorectumAD2.34e-035.88e-010.0112
79699ZYG11BHTA11_99999965062_69753HumanColorectumMSI-H1.69e-061.12e+000.3487
79699ZYG11BHTA11_99999965104_69814HumanColorectumMSS1.77e-086.79e-010.281
79699ZYG11BHTA11_99999971662_82457HumanColorectumMSS9.71e-241.34e+000.3859
79699ZYG11BHTA11_99999973899_84307HumanColorectumMSS4.31e-045.48e-010.2585
79699ZYG11BA015-C-203HumanColorectumFAP3.83e-12-2.44e-01-0.1294
79699ZYG11BA015-C-204HumanColorectumFAP1.35e-02-2.57e-01-0.0228
79699ZYG11BA002-C-201HumanColorectumFAP5.82e-05-1.93e-010.0324
79699ZYG11BA002-C-203HumanColorectumFAP2.31e-02-1.44e-010.2786
79699ZYG11BA001-C-119HumanColorectumFAP1.80e-02-2.55e-01-0.1557
79699ZYG11BA001-C-108HumanColorectumFAP6.07e-11-2.73e-01-0.0272
79699ZYG11BA002-C-205HumanColorectumFAP1.67e-07-1.88e-01-0.1236
79699ZYG11BA001-C-104HumanColorectumFAP1.01e-02-2.11e-010.0184
79699ZYG11BA015-C-006HumanColorectumFAP1.45e-07-3.35e-01-0.0994
79699ZYG11BA015-C-106HumanColorectumFAP6.44e-05-2.12e-01-0.0511
79699ZYG11BA002-C-114HumanColorectumFAP2.24e-08-3.32e-01-0.1561
79699ZYG11BA015-C-104HumanColorectumFAP1.53e-11-2.75e-01-0.1899
Page: 1 2 3 4 

check button Transcriptomic changes along malignancy continuum.
TissueExpression DynamicsAbbreviation
Colorectum (GSE201348)The image shows the transcriptomic changes along malignancy continuum.log2FC in expression of this searched gene in stem-like cells from each diseased tissue sample relative to stem-like cells in normal samples in each tissue plotted against the malignancy continuum. Samples are colored based on if they are from different disease stage.FAP: Familial adenomatous polyposis
CRC: Colorectal cancer
Colorectum (HTA11)The image shows the transcriptomic changes along malignancy continuum.log2FC in expression of this searched gene in stem-like cells from each diseased tissue sample relative to stem-like cells in normal samples in each tissue plotted against the malignancy continuum. Samples are colored based on if they are from different disease stage.AD: Adenomas
SER: Sessile serrated lesions
MSI-H: Microsatellite-high colorectal cancer
MSS: Microsatellite stable colorectal cancer
LiverThe image shows the transcriptomic changes along malignancy continuum.log2FC in expression of this searched gene in stem-like cells from each diseased tissue sample relative to stem-like cells in normal samples in each tissue plotted against the malignancy continuum. Samples are colored based on if they are from different disease stage.
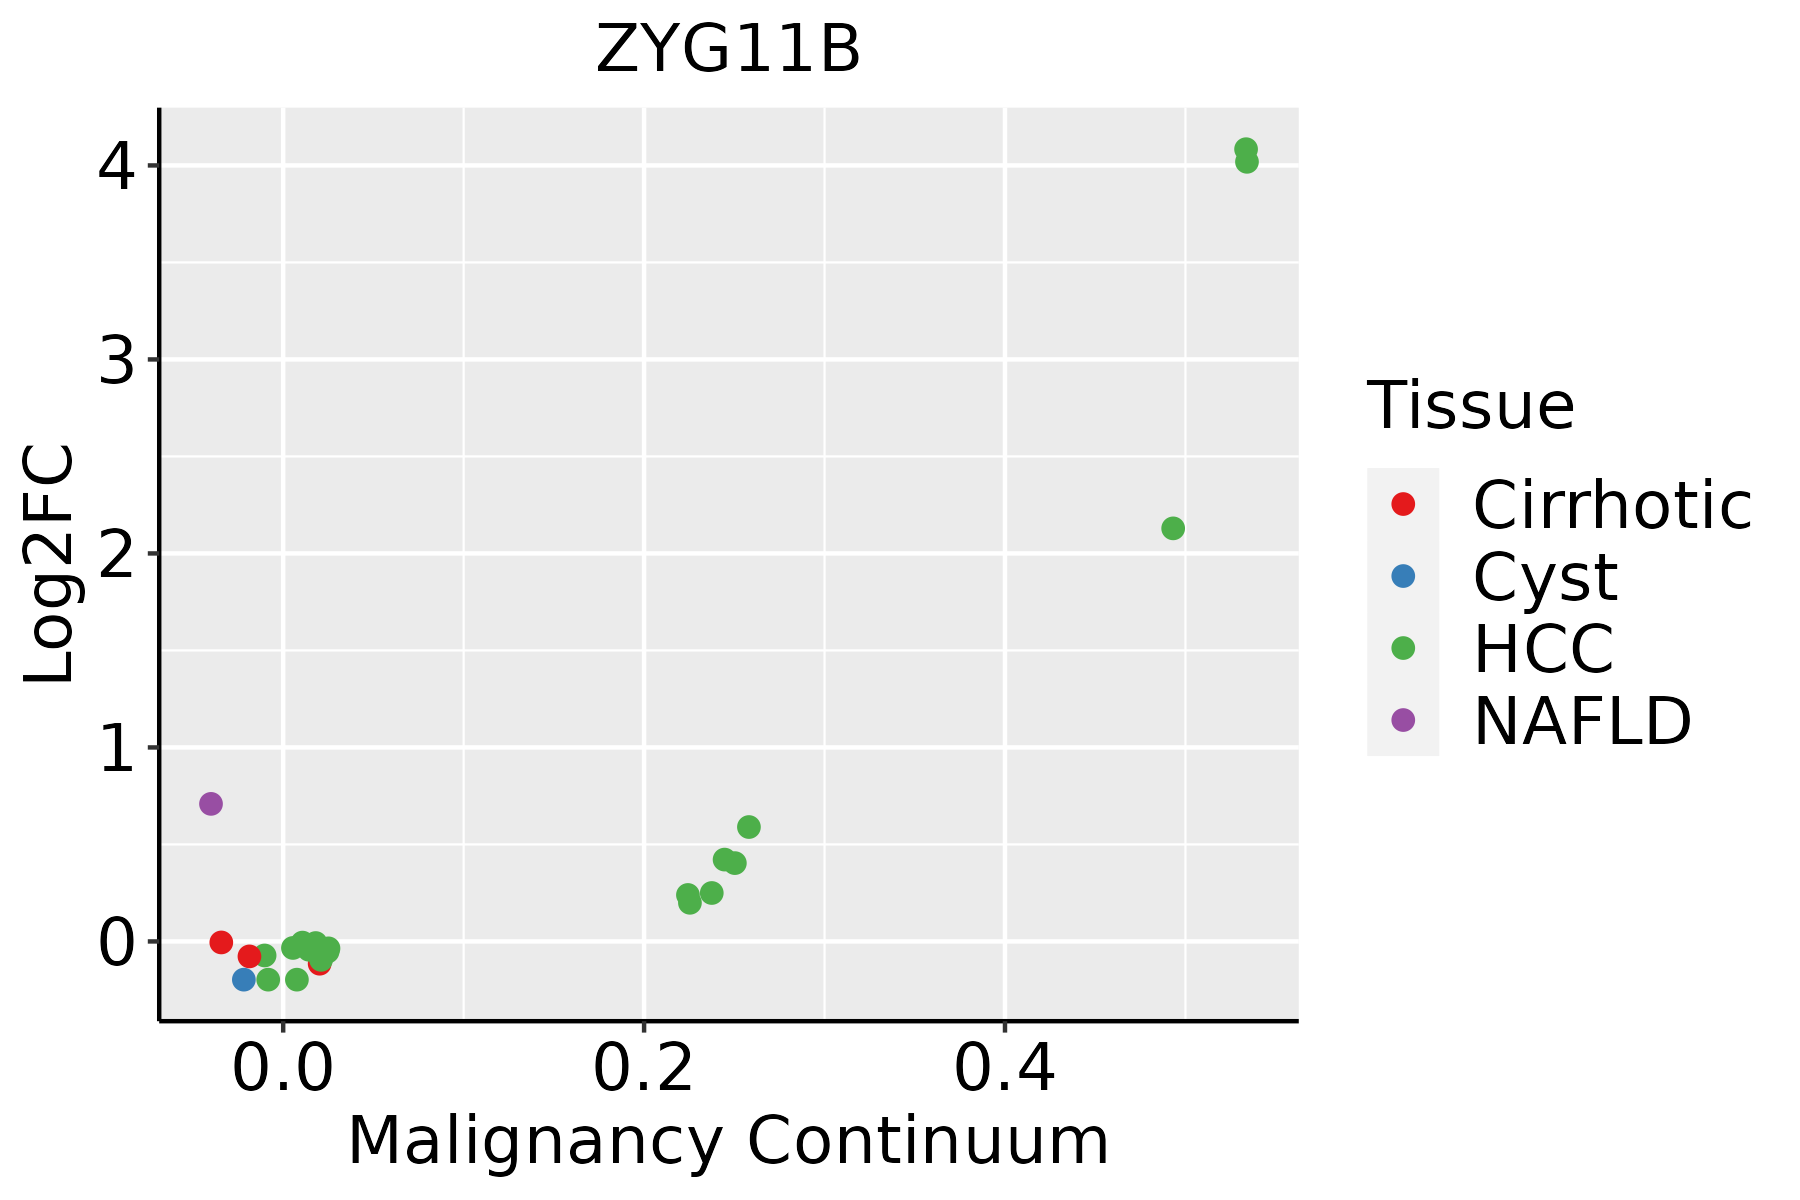
HCC: Hepatocellular carcinoma
NAFLD: Non-alcoholic fatty liver disease
ProstateThe image shows the transcriptomic changes along malignancy continuum.log2FC in expression of this searched gene in stem-like cells from each diseased tissue sample relative to stem-like cells in normal samples in each tissue plotted against the malignancy continuum. Samples are colored based on if they are from different disease stage.
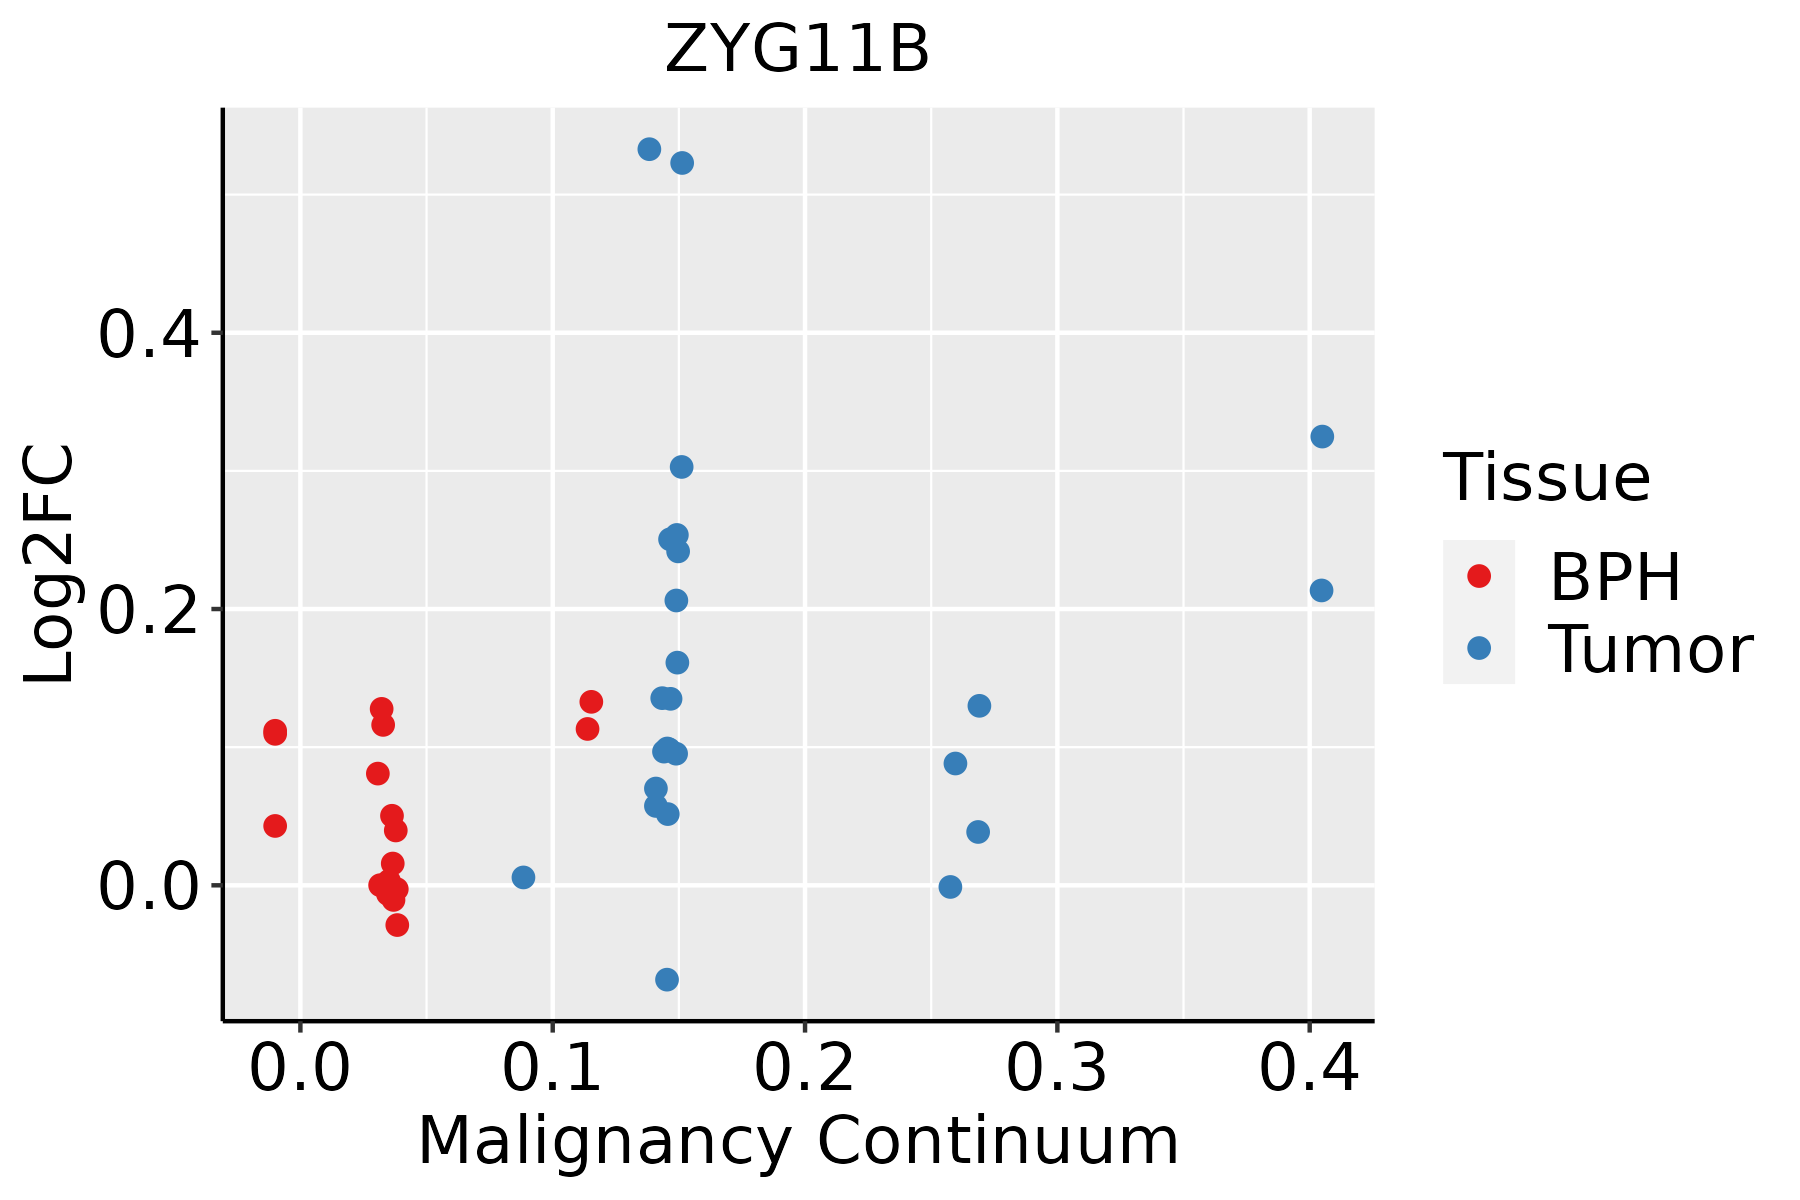
BPH: Benign Prostatic Hyperplasia
ThyroidThe image shows the transcriptomic changes along malignancy continuum.log2FC in expression of this searched gene in stem-like cells from each diseased tissue sample relative to stem-like cells in normal samples in each tissue plotted against the malignancy continuum. Samples are colored based on if they are from different disease stage.
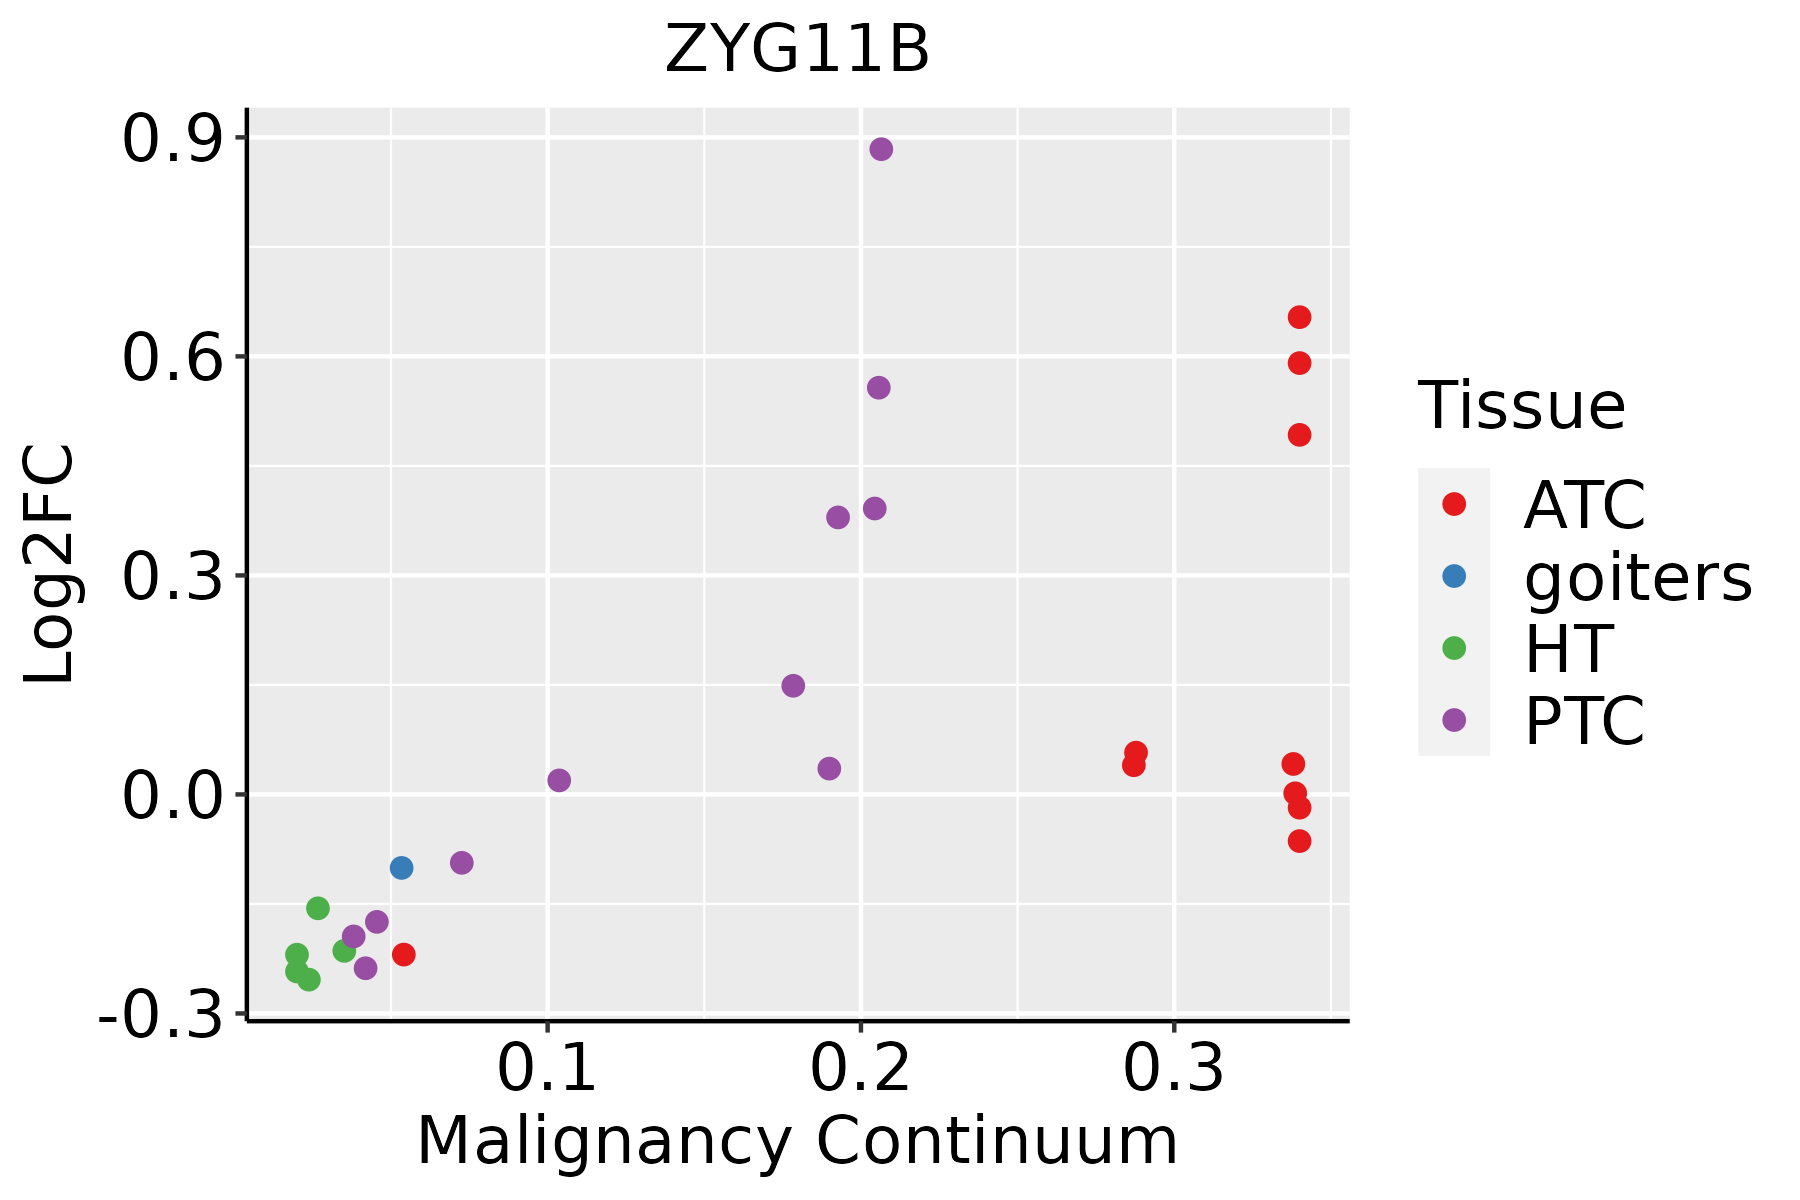
ATC: Anaplastic thyroid cancer
HT: Hashimoto's thyroiditis
PTC: Papillary thyroid cancer
∗log2FC in expression of this searched gene in stem-like cells from each diseased tissue sample relative to stem-like cells in normal samples in each tissue plotted against the malignancy continuum. Samples are colored based on if they are from different disease stage.

Top

Malignant transformation related pathway analysis

check buttonFind out the enriched GO biological processes and KEGG pathways involved in transition from healthy to precancer to cancer
check button Figure of enriched GO biological processes.
TissueDisease StageEnriched GO biological Processes
ColorectumADGO analysis - Figure of enriched GO biological processes: Top 15 enriched GO BP terms are showed in the bar plot of each disease state in each tissue. Each row represents a significant GO biological process which is colored according to the -log10(p.adjust).
ColorectumSERGO analysis - Figure of enriched GO biological processes: Top 15 enriched GO BP terms are showed in the bar plot of each disease state in each tissue. Each row represents a significant GO biological process which is colored according to the -log10(p.adjust).
ColorectumMSSGO analysis - Figure of enriched GO biological processes: Top 15 enriched GO BP terms are showed in the bar plot of each disease state in each tissue. Each row represents a significant GO biological process which is colored according to the -log10(p.adjust).
ColorectumMSI-HGO analysis - Figure of enriched GO biological processes: Top 15 enriched GO BP terms are showed in the bar plot of each disease state in each tissue. Each row represents a significant GO biological process which is colored according to the -log10(p.adjust).
ColorectumFAPGO analysis - Figure of enriched GO biological processes: Top 15 enriched GO BP terms are showed in the bar plot of each disease state in each tissue. Each row represents a significant GO biological process which is colored according to the -log10(p.adjust).
∗Top 15 enriched GO BP terms are showed in the bar plot of each disease state in each tissue. Each row represents a significant GO biological process which is colored according to the -log10(p.adjust).
Page: 1 2 3 4 5 6 7 8 9 

check button Enriched GO biological processes.
GO IDTissueDisease StageDescriptionGene RatioBg Ratiopvaluep.adjustCount
GO:0042176ColorectumADregulation of protein catabolic process160/3918391/187231.06e-197.34e-17160
GO:0009896ColorectumADpositive regulation of catabolic process180/3918492/187234.33e-161.94e-13180
GO:1903362ColorectumADregulation of cellular protein catabolic process109/3918255/187232.14e-156.08e-13109
GO:0010498ColorectumADproteasomal protein catabolic process174/3918490/187233.18e-147.66e-12174
GO:0031331ColorectumADpositive regulation of cellular catabolic process156/3918427/187234.68e-141.05e-11156
GO:1903050ColorectumADregulation of proteolysis involved in cellular protein catabolic process92/3918221/187232.04e-123.19e-1092
GO:0045732ColorectumADpositive regulation of protein catabolic process92/3918231/187233.85e-114.47e-0992
GO:0043161ColorectumADproteasome-mediated ubiquitin-dependent protein catabolic process141/3918412/187231.77e-101.68e-08141
GO:0045862ColorectumADpositive regulation of proteolysis129/3918372/187234.04e-103.46e-08129
GO:0061136ColorectumADregulation of proteasomal protein catabolic process75/3918187/187231.65e-091.20e-0775
GO:2000058ColorectumADregulation of ubiquitin-dependent protein catabolic process68/3918164/187231.82e-091.31e-0768
GO:1903364ColorectumADpositive regulation of cellular protein catabolic process62/3918155/187234.66e-082.51e-0662
GO:0032434ColorectumADregulation of proteasomal ubiquitin-dependent protein catabolic process54/3918134/187232.51e-071.02e-0554
GO:1903052ColorectumADpositive regulation of proteolysis involved in cellular protein catabolic process53/3918133/187234.93e-071.85e-0553
GO:2000060ColorectumADpositive regulation of ubiquitin-dependent protein catabolic process44/3918107/187231.65e-065.03e-0544
GO:1901800ColorectumADpositive regulation of proteasomal protein catabolic process44/3918114/187231.18e-052.62e-0444
GO:0032436ColorectumADpositive regulation of proteasomal ubiquitin-dependent protein catabolic process36/391890/187232.89e-055.37e-0436
GO:0006515ColorectumADprotein quality control for misfolded or incompletely synthesized proteins14/391828/187236.01e-046.33e-0314
GO:00421761ColorectumSERregulation of protein catabolic process126/2897391/187235.33e-172.52e-14126
GO:19033621ColorectumSERregulation of cellular protein catabolic process91/2897255/187231.22e-155.36e-1391
Page: 1 2 3 4 5 6 7 8 9 10 11 12 

check button Enriched KEGG pathways.
Pathway IDTissueDisease StageDescriptionGene RatioBg Ratiopvaluep.adjustqvalueCount
Page: 1 

Top

Cell-cell communication analysis

check buttonIdentification of potential cell-cell interactions between two cell types and their ligand-receptor pairs for different disease states
LigandReceptorLRpairPathwayTissueDisease Stage
Page: 1 

Top

Single-cell gene regulatory network inference analysis

check buttonFind out the significant the regulons (TFs) and the target genes of each regulon across cell types for different disease states
TFCell TypeTissueDisease StageTarget GeneRSSRegulon Activity
∗The dot plots of a searched regulon are shown for all cell subpopulations in each disease state of each tissue based on the regulon specific score inferred using pySCENIC and by calculating the average expression.
Page: 1 

Top

Somatic mutation of malignant transformation related genes

check buttonAnnotation of somatic variants for genes involved in malignant transformation
Hugo SymbolVariant ClassVariant ClassificationdbSNP RSHGVScHGVSpHGVSp ShortSWISSPROTBIOTYPESIFTPolyPhenTumor Sample BarcodeTissueHistologySexAgeStageTherapy TypesDrugsOutcome
ZYG11BSNVMissense_Mutationnovelc.1542G>Tp.Leu514Phep.L514FQ9C0D3protein_codingtolerated(0.19)benign(0.125)TCGA-AN-A046-01Breastbreast invasive carcinomaFemale>=65I/IIUnknownUnknownSD
ZYG11BSNVMissense_Mutationnovelc.1555N>Gp.Ser519Glyp.S519GQ9C0D3protein_codingdeleterious(0.01)possibly_damaging(0.571)TCGA-AO-A128-01Breastbreast invasive carcinomaFemale<65I/IIChemotherapydoxorubicinSD
ZYG11BSNVMissense_Mutationnovelc.143G>Cp.Gly48Alap.G48AQ9C0D3protein_codingtolerated(0.96)benign(0.001)TCGA-GI-A2C9-01Breastbreast invasive carcinomaFemale<65I/IIUnspecificSD
ZYG11BinsertionFrame_Shift_Insnovelc.2018_2019insGTp.Met674SerfsTer17p.M674Sfs*17Q9C0D3protein_codingTCGA-A8-A08F-01Breastbreast invasive carcinomaFemale<65III/IVChemotherapy5-fluorouracilCR
ZYG11BinsertionNonsense_Mutationnovelc.2019_2020insTCAAATAAATAAATAAATGTAAAAp.Ala673_Met674insSerAsnLysTerIleAsnValLysp.A673_M674insSNK*INVKQ9C0D3protein_codingTCGA-A8-A08F-01Breastbreast invasive carcinomaFemale<65III/IVChemotherapy5-fluorouracilCR
ZYG11BinsertionFrame_Shift_Insnovelc.1166_1167insGTGTGTATATACATCTATACATATATGTGTATATACATp.Asn389LysfsTer15p.N389Kfs*15Q9C0D3protein_codingTCGA-BH-A0B4-01Breastbreast invasive carcinomaMale>=65III/IVHormone TherapytamoxiphenSD
ZYG11BSNVMissense_Mutationnovelc.572T>Cp.Leu191Serp.L191SQ9C0D3protein_codingdeleterious(0)probably_damaging(0.999)TCGA-2W-A8YY-01Cervixcervical & endocervical cancerFemale<65I/IIChemotherapycisplatinCR
ZYG11BSNVMissense_Mutationnovelc.934G>Ap.Gly312Serp.G312SQ9C0D3protein_codingtolerated(0.55)benign(0.041)TCGA-2W-A8YY-01Cervixcervical & endocervical cancerFemale<65I/IIChemotherapycisplatinCR
ZYG11BSNVMissense_Mutationc.2107G>Tp.Asp703Tyrp.D703YQ9C0D3protein_codingdeleterious(0.01)benign(0.179)TCGA-FU-A3HZ-01Cervixcervical & endocervical cancerFemale<65I/IIChemotherapycisplatinCR
ZYG11BSNVMissense_Mutationc.91N>Cp.Glu31Glnp.E31QQ9C0D3protein_codingdeleterious(0.03)probably_damaging(0.943)TCGA-JX-A3Q0-01Cervixcervical & endocervical cancerFemale<65III/IVUnknownUnknownSD
Page: 1 2 3 4 5 6 7 8 

Top

Related drugs of malignant transformation related genes

check buttonIdentification of chemicals and drugs interact with genes involved in malignant transfromation
(DGIdb 4.0)
Entrez IDSymbolCategoryInteraction TypesDrug Claim NameDrug NamePMIDs
Page: 1