
|
|||||
|
 | |
| |
| |
| |
| |
| |
|
Gene: ZXDC |
Gene summary for ZXDC |
| Gene information | Species | Human | Gene symbol | ZXDC | Gene ID | 79364 |
| Gene name | ZXD family zinc finger C | |
| Gene Alias | ZXDL | |
| Cytomap | 3q21.3 | |
| Gene Type | protein-coding | GO ID | GO:0006139 | UniProtAcc | Q2QGD7 |
Top |
Malignant transformation analysis |
| Identification of the aberrant gene expression in precancerous and cancerous lesions by comparing the gene expression of stem-like cells in diseased tissues with normal stem cells |
| Entrez ID | Symbol | Replicates | Species | Organ | Tissue | Adj P-value | Log2FC | Malignancy |
| 79364 | ZXDC | CCI_1 | Human | Cervix | CC | 1.48e-04 | 6.43e-01 | 0.528 |
| 79364 | ZXDC | CCI_2 | Human | Cervix | CC | 9.56e-05 | 6.61e-01 | 0.5249 |
| 79364 | ZXDC | CCI_3 | Human | Cervix | CC | 1.31e-12 | 8.78e-01 | 0.516 |
| 79364 | ZXDC | LZE24T | Human | Esophagus | ESCC | 1.10e-05 | 1.48e-01 | 0.0596 |
| 79364 | ZXDC | P1T-E | Human | Esophagus | ESCC | 2.63e-02 | 2.73e-01 | 0.0875 |
| 79364 | ZXDC | P2T-E | Human | Esophagus | ESCC | 1.41e-20 | 2.91e-01 | 0.1177 |
| 79364 | ZXDC | P5T-E | Human | Esophagus | ESCC | 2.31e-11 | 1.87e-01 | 0.1327 |
| 79364 | ZXDC | P8T-E | Human | Esophagus | ESCC | 3.22e-15 | 2.36e-01 | 0.0889 |
| 79364 | ZXDC | P9T-E | Human | Esophagus | ESCC | 4.76e-09 | 2.30e-01 | 0.1131 |
| 79364 | ZXDC | P10T-E | Human | Esophagus | ESCC | 4.30e-17 | 3.11e-01 | 0.116 |
| 79364 | ZXDC | P11T-E | Human | Esophagus | ESCC | 1.25e-03 | 3.27e-01 | 0.1426 |
| 79364 | ZXDC | P12T-E | Human | Esophagus | ESCC | 2.54e-08 | 1.27e-01 | 0.1122 |
| 79364 | ZXDC | P15T-E | Human | Esophagus | ESCC | 1.94e-08 | 2.46e-01 | 0.1149 |
| 79364 | ZXDC | P16T-E | Human | Esophagus | ESCC | 7.92e-10 | 1.38e-01 | 0.1153 |
| 79364 | ZXDC | P20T-E | Human | Esophagus | ESCC | 4.37e-06 | 1.74e-01 | 0.1124 |
| 79364 | ZXDC | P21T-E | Human | Esophagus | ESCC | 3.46e-04 | 1.46e-01 | 0.1617 |
| 79364 | ZXDC | P22T-E | Human | Esophagus | ESCC | 1.34e-12 | 1.87e-01 | 0.1236 |
| 79364 | ZXDC | P23T-E | Human | Esophagus | ESCC | 7.15e-11 | 3.59e-01 | 0.108 |
| 79364 | ZXDC | P24T-E | Human | Esophagus | ESCC | 2.32e-06 | 1.14e-01 | 0.1287 |
| 79364 | ZXDC | P26T-E | Human | Esophagus | ESCC | 2.84e-11 | 1.73e-01 | 0.1276 |
| Page: 1 2 3 4 |
| Tissue | Expression Dynamics | Abbreviation |
| Cervix | 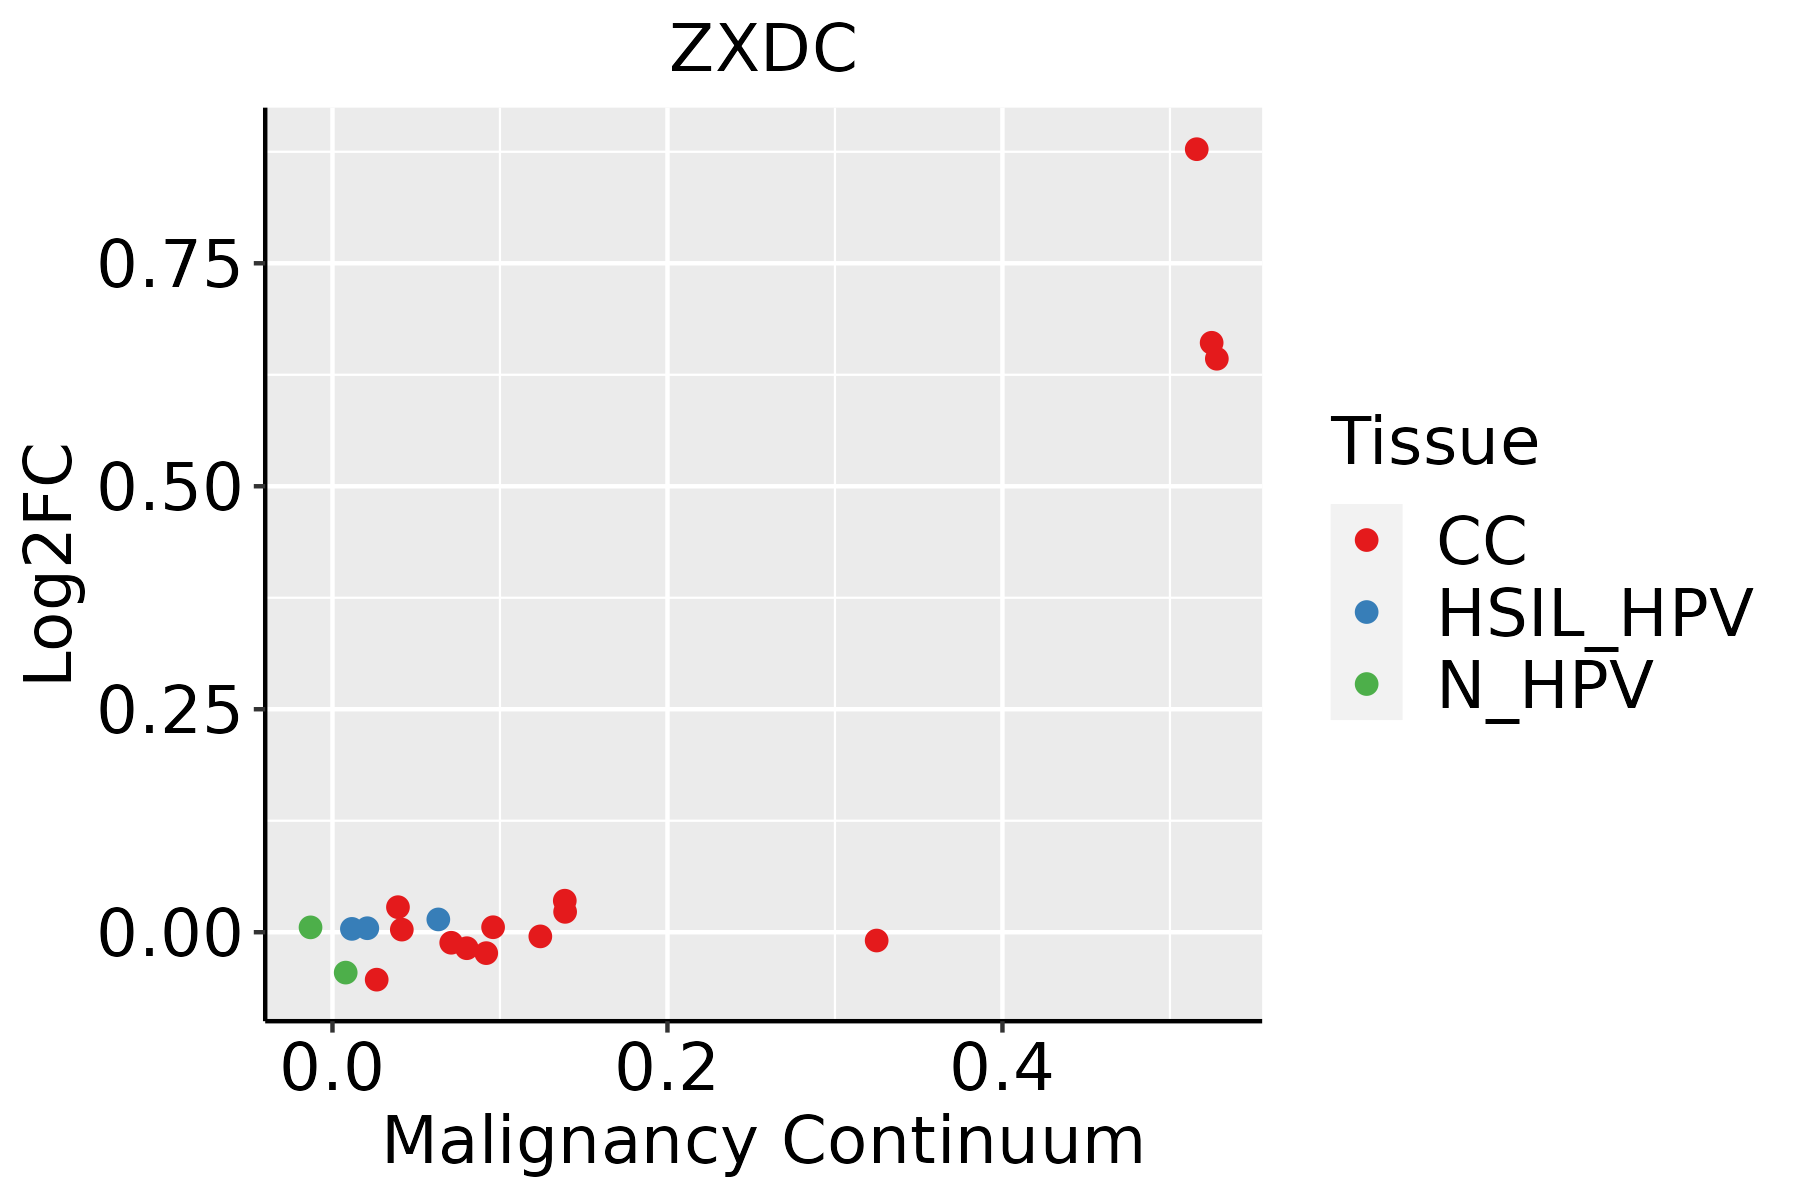 | CC: Cervix cancer |
| HSIL_HPV: HPV-infected high-grade squamous intraepithelial lesions | ||
| N_HPV: HPV-infected normal cervix | ||
| Esophagus | 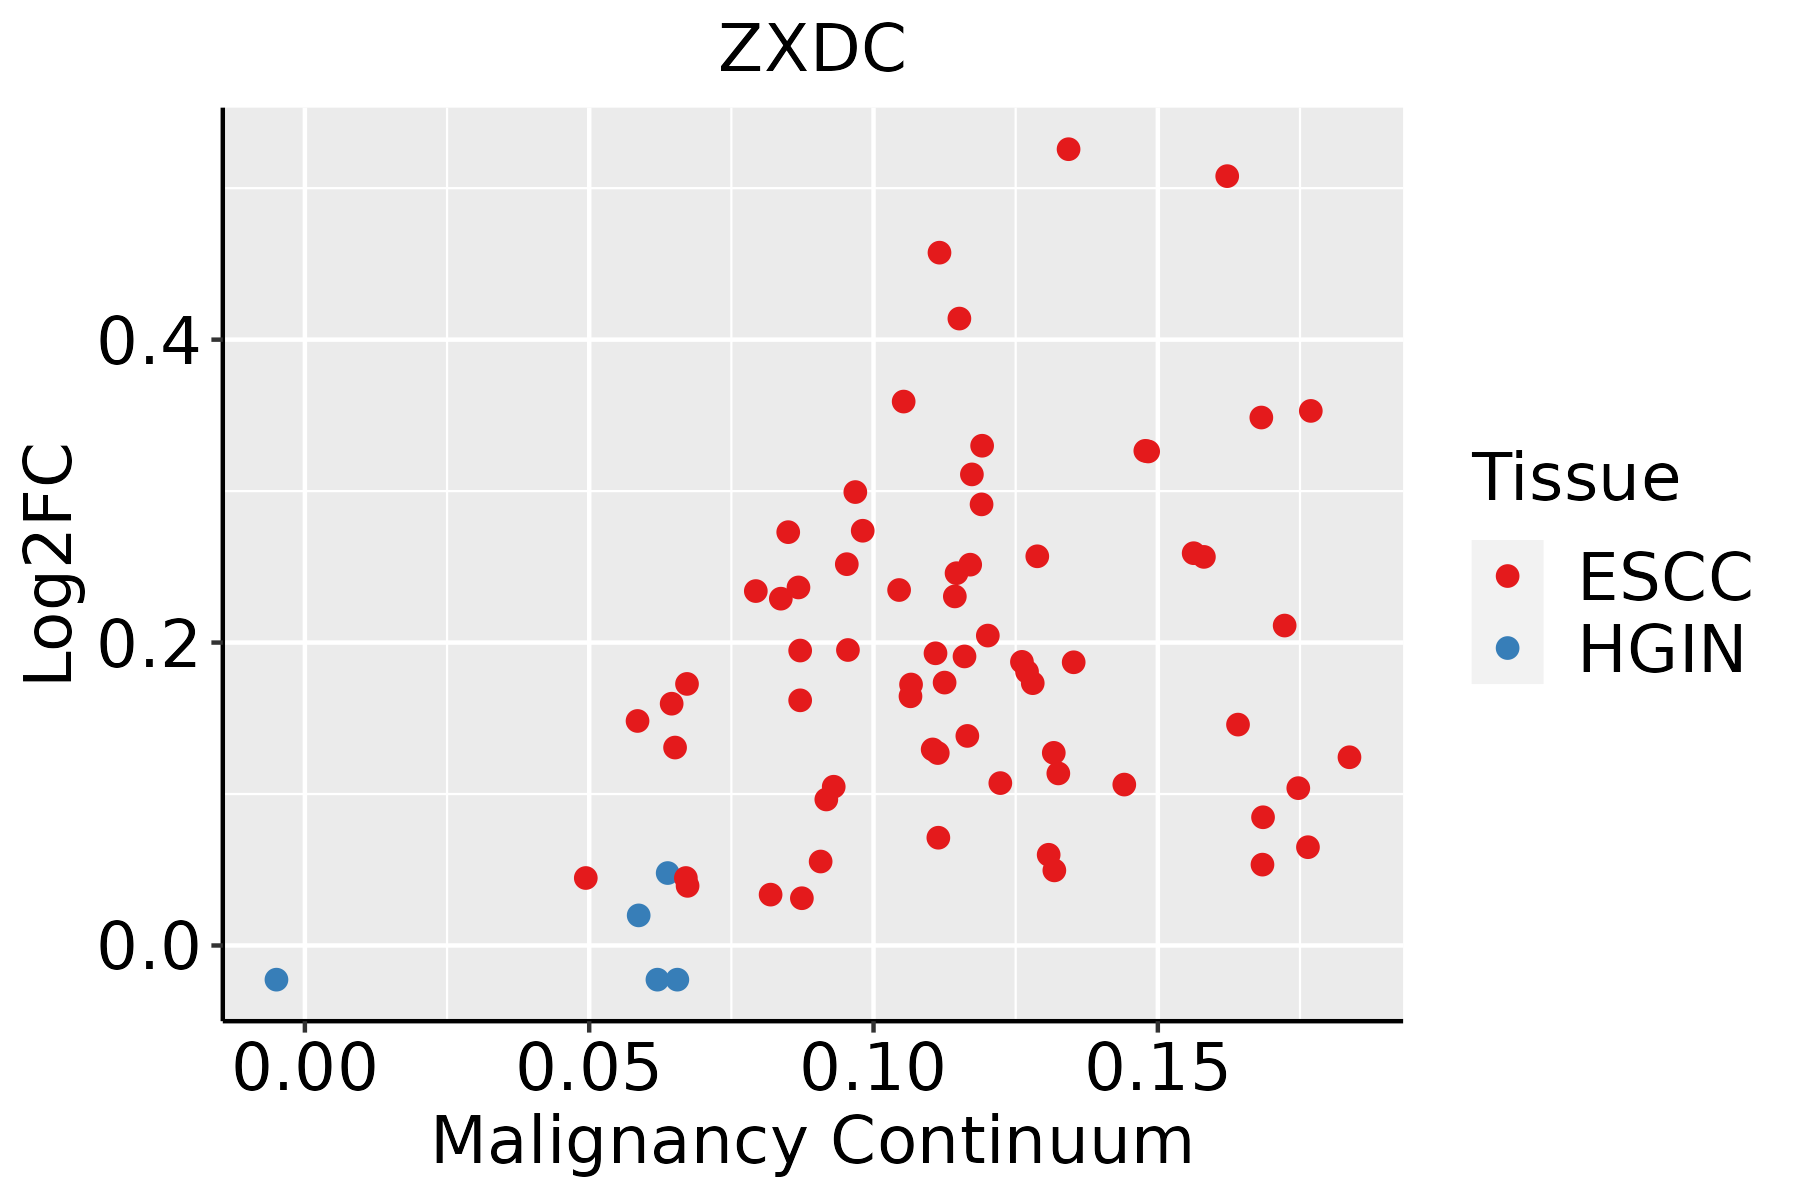 | ESCC: Esophageal squamous cell carcinoma |
| HGIN: High-grade intraepithelial neoplasias | ||
| LGIN: Low-grade intraepithelial neoplasias | ||
| Liver | 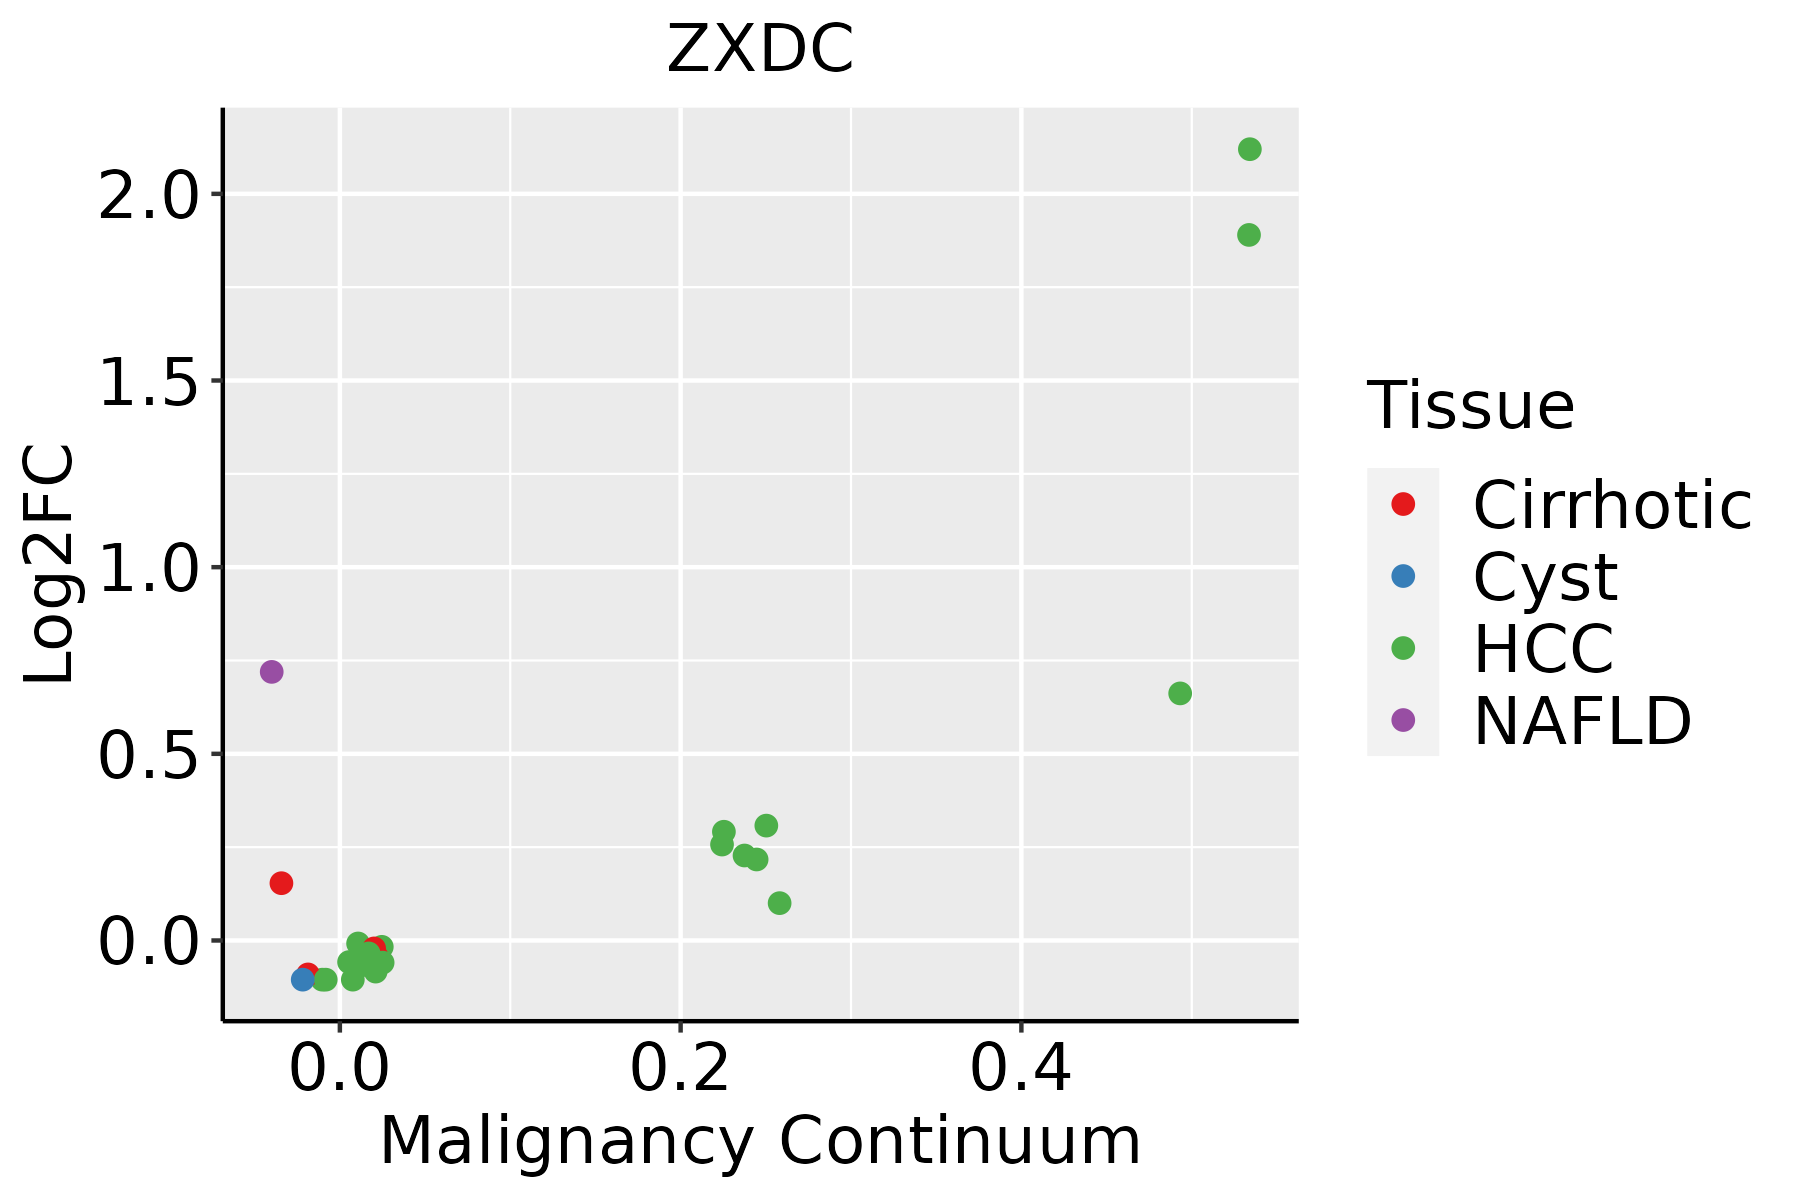 | HCC: Hepatocellular carcinoma |
| NAFLD: Non-alcoholic fatty liver disease | ||
| Lung |  | AAH: Atypical adenomatous hyperplasia |
| AIS: Adenocarcinoma in situ | ||
| IAC: Invasive lung adenocarcinoma | ||
| MIA: Minimally invasive adenocarcinoma |
| ∗log2FC in expression of this searched gene in stem-like cells from each diseased tissue sample relative to stem-like cells in normal samples in each tissue plotted against the malignancy continuum. Samples are colored based on if they are from different disease stage. |
Top |
Malignant transformation related pathway analysis |
| Find out the enriched GO biological processes and KEGG pathways involved in transition from healthy to precancer to cancer |
| Tissue | Disease Stage | Enriched GO biological Processes |
| Colorectum | AD |  |
| Colorectum | SER |  |
| Colorectum | MSS |  |
| Colorectum | MSI-H |  |
| Colorectum | FAP |  |
| ∗Top 15 enriched GO BP terms are showed in the bar plot of each disease state in each tissue. Each row represents a significant GO biological process which is colored according to the -log10(p.adjust). |
| Page: 1 2 3 4 5 6 7 8 9 |
| GO ID | Tissue | Disease Stage | Description | Gene Ratio | Bg Ratio | pvalue | p.adjust | Count |
| Page: 1 |
| Pathway ID | Tissue | Disease Stage | Description | Gene Ratio | Bg Ratio | pvalue | p.adjust | qvalue | Count |
| Page: 1 |
Top |
Cell-cell communication analysis |
| Identification of potential cell-cell interactions between two cell types and their ligand-receptor pairs for different disease states |
| Ligand | Receptor | LRpair | Pathway | Tissue | Disease Stage |
| Page: 1 |
Top |
Single-cell gene regulatory network inference analysis |
| Find out the significant the regulons (TFs) and the target genes of each regulon across cell types for different disease states |
| TF | Cell Type | Tissue | Disease Stage | Target Gene | RSS | Regulon Activity |
| ZXDC | NK | Endometrium | AEH | NOL4L,TLE1,MYO5B, etc. | 9.85e-02 |  |
| ZXDC | CD8TEX | Endometrium | AEH | NOL4L,TLE1,MYO5B, etc. | 2.03e-02 | |
| ZXDC | CD8TEREX | Endometrium | AEH | NOL4L,TLE1,MYO5B, etc. | 9.63e-02 | |
| ZXDC | CD8TCM | Endometrium | EEC | NOL4L,TLE1,MYO5B, etc. | 1.34e-02 |  |
| ZXDC | BMEM | Endometrium | EEC | NOL4L,TLE1,MYO5B, etc. | 9.52e-02 | |
| ZXDC | CD8TEREX | Endometrium | EEC | NOL4L,TLE1,MYO5B, etc. | 2.02e-01 | |
| ZXDC | NK | Endometrium | EEC | NOL4L,TLE1,MYO5B, etc. | 4.74e-02 | |
| ZXDC | CD8TEX | Endometrium | EEC | NOL4L,TLE1,MYO5B, etc. | 2.23e-02 | |
| ZXDC | MAST | Endometrium | Healthy | NOL4L,TLE1,MYO5B, etc. | 4.48e-02 |  |
| ZXDC | KER | Esophagus | ADJ | POLR2J3,RP11-514P8.6,MKRN2OS, etc. | 1.98e-01 |  |
| ∗The dot plots of a searched regulon are shown for all cell subpopulations in each disease state of each tissue based on the regulon specific score inferred using pySCENIC and by calculating the average expression. |
| Page: 1 2 |
Top |
Somatic mutation of malignant transformation related genes |
| Annotation of somatic variants for genes involved in malignant transformation |
| Hugo Symbol | Variant Class | Variant Classification | dbSNP RS | HGVSc | HGVSp | HGVSp Short | SWISSPROT | BIOTYPE | SIFT | PolyPhen | Tumor Sample Barcode | Tissue | Histology | Sex | Age | Stage | Therapy Types | Drugs | Outcome |
| ZXDC | SNV | Missense_Mutation | rs758081002 | c.2426N>T | p.Ser809Leu | p.S809L | Q2QGD7 | protein_coding | tolerated(1) | benign(0) | TCGA-3C-AALI-01 | Breast | breast invasive carcinoma | Female | <65 | I/II | Unspecific | Poly E | Complete Response |
| ZXDC | SNV | Missense_Mutation | novel | c.905C>G | p.Pro302Arg | p.P302R | Q2QGD7 | protein_coding | deleterious(0) | probably_damaging(0.999) | TCGA-A8-A08R-01 | Breast | breast invasive carcinoma | Female | <65 | I/II | Unknown | Unknown | SD |
| ZXDC | SNV | Missense_Mutation | novel | c.1069N>T | p.Pro357Ser | p.P357S | Q2QGD7 | protein_coding | deleterious(0.01) | probably_damaging(0.994) | TCGA-AC-A3QQ-01 | Breast | breast invasive carcinoma | Female | <65 | I/II | Unknown | Unknown | SD |
| ZXDC | SNV | Missense_Mutation | c.1870N>A | p.Pro624Thr | p.P624T | Q2QGD7 | protein_coding | tolerated(0.08) | benign(0.072) | TCGA-AO-A12F-01 | Breast | breast invasive carcinoma | Female | <65 | I/II | Chemotherapy | paclitaxel | SD | |
| ZXDC | SNV | Missense_Mutation | c.2271N>G | p.Phe757Leu | p.F757L | Q2QGD7 | protein_coding | tolerated(0.74) | benign(0) | TCGA-B6-A1KC-01 | Breast | breast invasive carcinoma | Female | >=65 | I/II | Unknown | Unknown | SD | |
| ZXDC | insertion | Frame_Shift_Ins | novel | c.1069_1070insATTT | p.Pro357HisfsTer6 | p.P357Hfs*6 | Q2QGD7 | protein_coding | TCGA-AC-A3QQ-01 | Breast | breast invasive carcinoma | Female | <65 | I/II | Unknown | Unknown | SD | ||
| ZXDC | deletion | Frame_Shift_Del | novel | c.2138delN | p.Gly713AlafsTer12 | p.G713Afs*12 | Q2QGD7 | protein_coding | TCGA-D8-A27V-01 | Breast | breast invasive carcinoma | Female | <65 | I/II | Hormone Therapy | tamoxiphen | SD | ||
| ZXDC | SNV | Missense_Mutation | rs750723904 | c.1414A>G | p.Met472Val | p.M472V | Q2QGD7 | protein_coding | tolerated(0.43) | benign(0.005) | TCGA-DG-A2KK-01 | Cervix | cervical & endocervical cancer | Female | <65 | III/IV | Chemotherapy | cisplatin | SD |
| ZXDC | SNV | Missense_Mutation | novel | c.752N>A | p.Thr251Lys | p.T251K | Q2QGD7 | protein_coding | deleterious(0.01) | possibly_damaging(0.883) | TCGA-EK-A2RE-01 | Cervix | cervical & endocervical cancer | Female | <65 | I/II | Unknown | Unknown | SD |
| ZXDC | SNV | Missense_Mutation | novel | c.2161G>T | p.Ala721Ser | p.A721S | Q2QGD7 | protein_coding | tolerated(0.07) | benign(0.352) | TCGA-VS-A8EJ-01 | Cervix | cervical & endocervical cancer | Female | <65 | I/II | Chemotherapy | cisplatin | PD |
| Page: 1 2 3 4 5 6 7 8 |
Top |
Related drugs of malignant transformation related genes |
| Identification of chemicals and drugs interact with genes involved in malignant transfromation |
| (DGIdb 4.0) |
| Entrez ID | Symbol | Category | Interaction Types | Drug Claim Name | Drug Name | PMIDs |
| Page: 1 |

Copyright 2023-Present -The University of Texas Health Science Center at Houston |