Schematic overview of the cellular and molecular mechanisms involved in the cancer progression, including the proposed cellular and molecular mechanisms in cancer cells trajectory. AT1: alveolar type 1 cells; AT2: alveolar type 2 cells; AAH: atypical adenomatous hyperplasia; AIS: adenocarcinoma in situ; MIA: minimally invasive adenocarcinoma; IA: invasive adenocarcinoma; EMT: epithelial-mesenchymal transition

Home

Download

Statistics

Help

Contact

Center for Computational Systems Medicine
leaf

Gene summary

leaf

Malignant transformation analysis

leaf

Malignant transformation related pathway analysis

leaf

Cell-cell communication analysis

leaf

Single-cell gene regulatory network inference analysis

leaf

Somatic mutation of malignant transformation related genes

leaf

Related drugs of malignant transformation related genes

Gene: ZWINT

Gene summary for ZWINT

check button Gene summary.

Gene informationSpeciesHuman
Gene symbol

ZWINT

Gene ID

11130

Gene nameZW10 interacting kinetochore protein
Gene AliasHZwint-1
Cytomap10q21.1
Gene Typeprotein-coding
GO ID

GO:0000070

UniProtAcc

O95229


Top

Malignant transformation analysis

check button Identification of the aberrant gene expression in precancerous and cancerous lesions by comparing the gene expression of stem-like cells in diseased tissues with normal stem cells
check button Malignant transformation involving gene list.
Entrez IDSymbolReplicatesSpeciesOrganTissueAdj P-valueLog2FCMalignancy
11130ZWINTLZE5THumanEsophagusESCC1.57e-023.52e-010.0514
11130ZWINTLZE7THumanEsophagusESCC1.02e-032.73e-010.0667
11130ZWINTLZE21THumanEsophagusESCC1.16e-052.66e-010.0655
11130ZWINTLZE6THumanEsophagusESCC5.35e-042.56e-010.0845
11130ZWINTP1T-EHumanEsophagusESCC4.62e-032.49e-010.0875
11130ZWINTP2T-EHumanEsophagusESCC3.73e-185.64e-010.1177
11130ZWINTP4T-EHumanEsophagusESCC4.13e-174.16e-010.1323
11130ZWINTP5T-EHumanEsophagusESCC1.81e-226.06e-010.1327
11130ZWINTP8T-EHumanEsophagusESCC7.33e-104.32e-010.0889
11130ZWINTP9T-EHumanEsophagusESCC4.01e-041.78e-010.1131
11130ZWINTP10T-EHumanEsophagusESCC1.14e-052.74e-010.116
11130ZWINTP11T-EHumanEsophagusESCC9.07e-042.70e-010.1426
11130ZWINTP15T-EHumanEsophagusESCC5.37e-052.09e-010.1149
11130ZWINTP16T-EHumanEsophagusESCC7.38e-114.36e-010.1153
11130ZWINTP17T-EHumanEsophagusESCC2.60e-063.04e-010.1278
11130ZWINTP21T-EHumanEsophagusESCC6.36e-125.68e-010.1617
11130ZWINTP24T-EHumanEsophagusESCC4.42e-133.16e-010.1287
11130ZWINTP26T-EHumanEsophagusESCC6.70e-084.08e-010.1276
11130ZWINTP27T-EHumanEsophagusESCC1.34e-113.80e-010.1055
11130ZWINTP28T-EHumanEsophagusESCC3.08e-072.17e-010.1149
Page: 1 2 3 4 5 

check button Transcriptomic changes along malignancy continuum.
TissueExpression DynamicsAbbreviation
EsophagusThe image shows the transcriptomic changes along malignancy continuum.log2FC in expression of this searched gene in stem-like cells from each diseased tissue sample relative to stem-like cells in normal samples in each tissue plotted against the malignancy continuum. Samples are colored based on if they are from different disease stage.ESCC: Esophageal squamous cell carcinoma
HGIN: High-grade intraepithelial neoplasias
LGIN: Low-grade intraepithelial neoplasias
LiverThe image shows the transcriptomic changes along malignancy continuum.log2FC in expression of this searched gene in stem-like cells from each diseased tissue sample relative to stem-like cells in normal samples in each tissue plotted against the malignancy continuum. Samples are colored based on if they are from different disease stage.
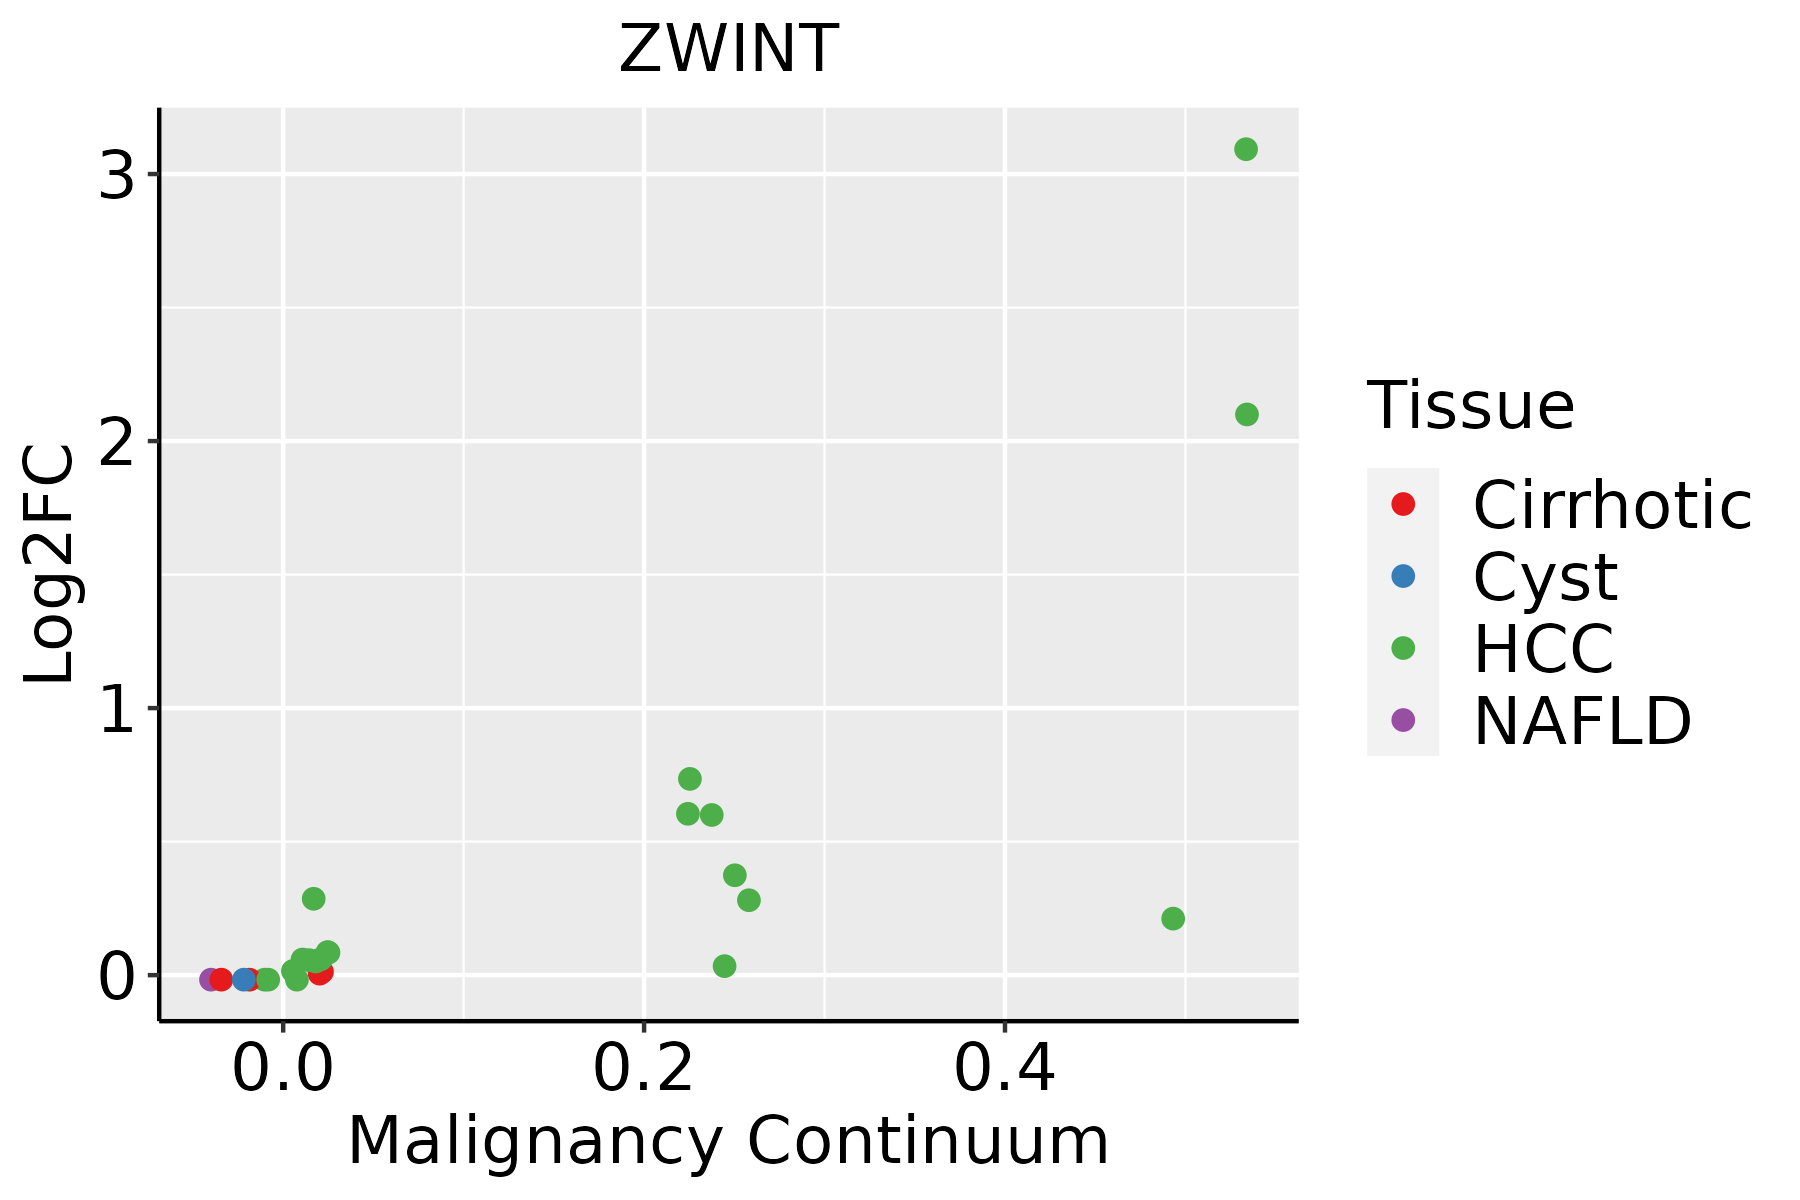
HCC: Hepatocellular carcinoma
NAFLD: Non-alcoholic fatty liver disease
Oral CavityThe image shows the transcriptomic changes along malignancy continuum.log2FC in expression of this searched gene in stem-like cells from each diseased tissue sample relative to stem-like cells in normal samples in each tissue plotted against the malignancy continuum. Samples are colored based on if they are from different disease stage.EOLP: Erosive Oral lichen planus
LP: leukoplakia
NEOLP: Non-erosive oral lichen planus
OSCC: Oral squamous cell carcinoma
SkinThe image shows the transcriptomic changes along malignancy continuum.log2FC in expression of this searched gene in stem-like cells from each diseased tissue sample relative to stem-like cells in normal samples in each tissue plotted against the malignancy continuum. Samples are colored based on if they are from different disease stage.
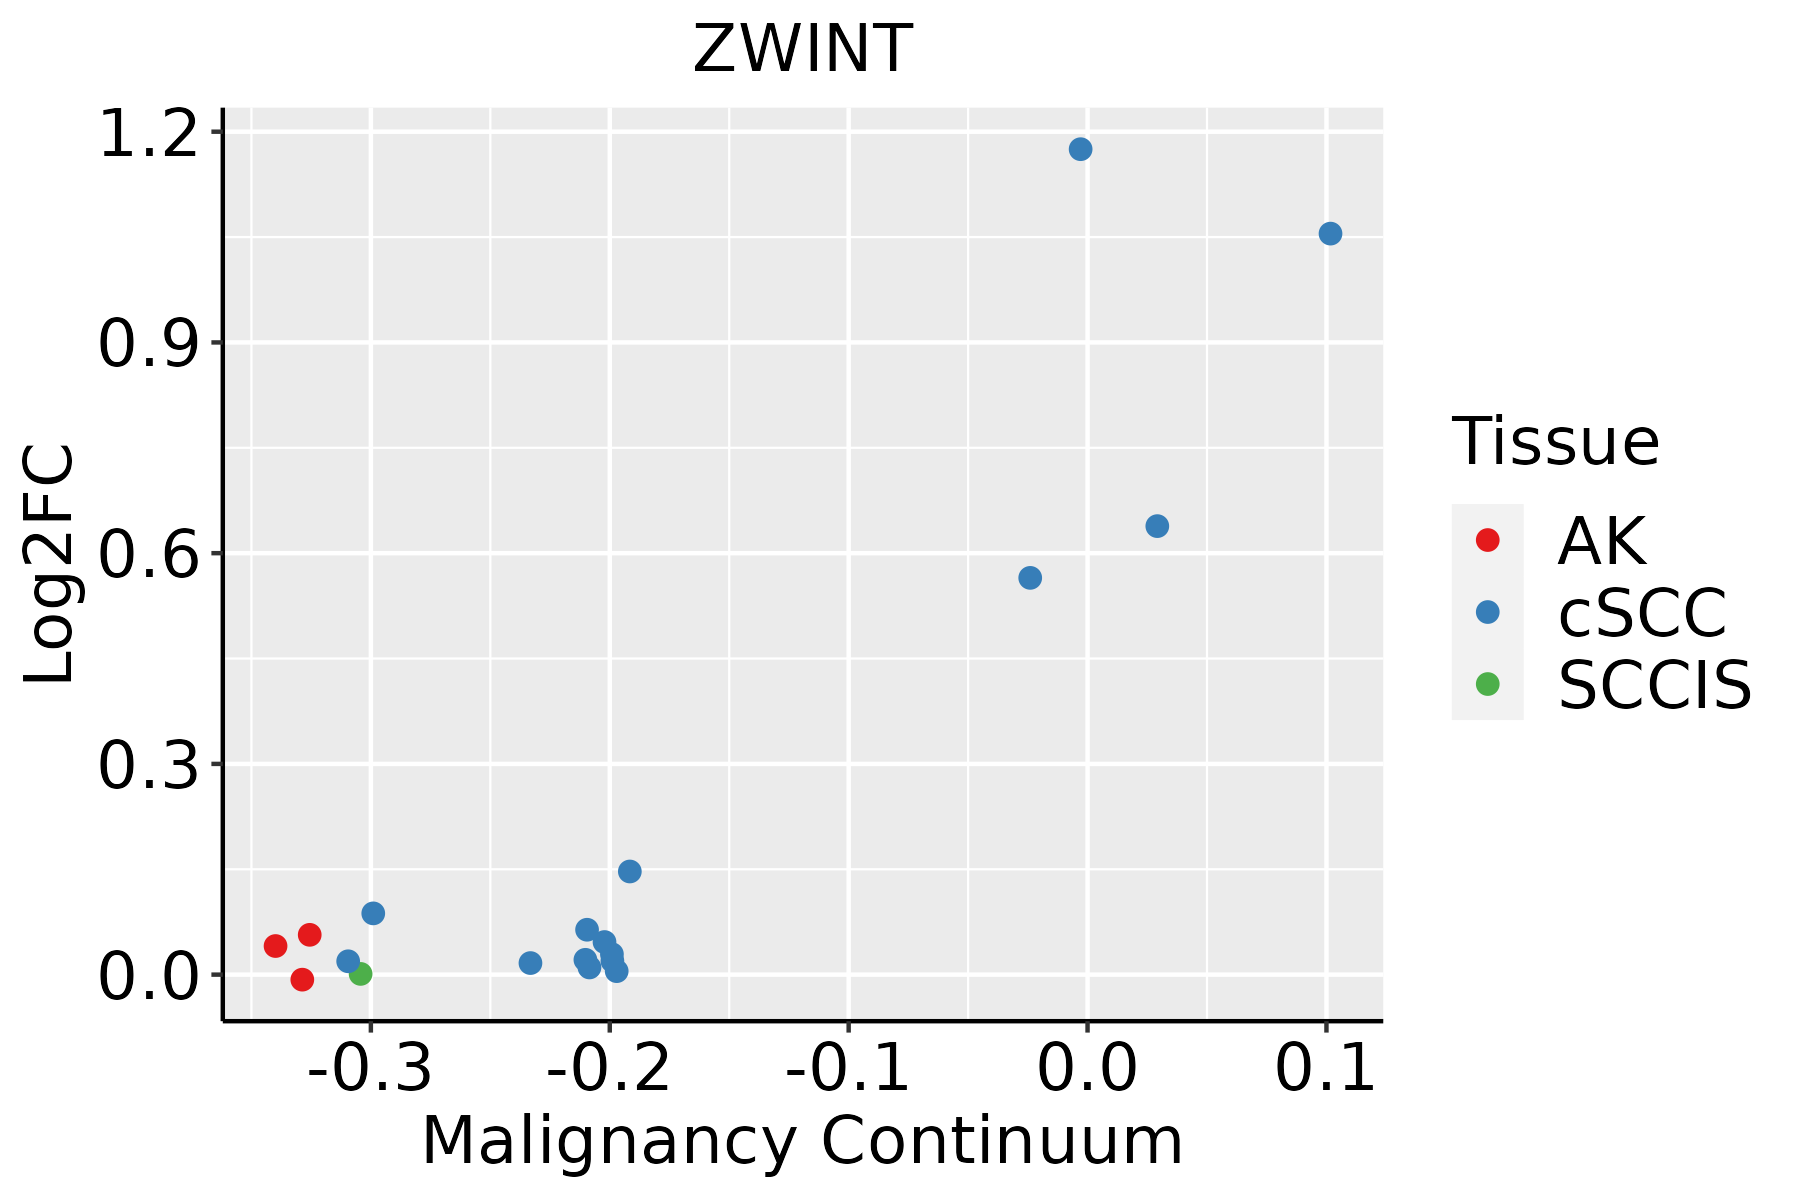
AK: Actinic keratosis
cSCC: Cutaneous squamous cell carcinoma
SCCIS:squamous cell carcinoma in situ
ThyroidThe image shows the transcriptomic changes along malignancy continuum.log2FC in expression of this searched gene in stem-like cells from each diseased tissue sample relative to stem-like cells in normal samples in each tissue plotted against the malignancy continuum. Samples are colored based on if they are from different disease stage.ATC: Anaplastic thyroid cancer
HT: Hashimoto's thyroiditis
PTC: Papillary thyroid cancer
∗log2FC in expression of this searched gene in stem-like cells from each diseased tissue sample relative to stem-like cells in normal samples in each tissue plotted against the malignancy continuum. Samples are colored based on if they are from different disease stage.

Top

Malignant transformation related pathway analysis

check buttonFind out the enriched GO biological processes and KEGG pathways involved in transition from healthy to precancer to cancer
check button Figure of enriched GO biological processes.
TissueDisease StageEnriched GO biological Processes
ColorectumADGO analysis - Figure of enriched GO biological processes: Top 15 enriched GO BP terms are showed in the bar plot of each disease state in each tissue. Each row represents a significant GO biological process which is colored according to the -log10(p.adjust).
ColorectumSERGO analysis - Figure of enriched GO biological processes: Top 15 enriched GO BP terms are showed in the bar plot of each disease state in each tissue. Each row represents a significant GO biological process which is colored according to the -log10(p.adjust).
ColorectumMSSGO analysis - Figure of enriched GO biological processes: Top 15 enriched GO BP terms are showed in the bar plot of each disease state in each tissue. Each row represents a significant GO biological process which is colored according to the -log10(p.adjust).
ColorectumMSI-HGO analysis - Figure of enriched GO biological processes: Top 15 enriched GO BP terms are showed in the bar plot of each disease state in each tissue. Each row represents a significant GO biological process which is colored according to the -log10(p.adjust).
ColorectumFAPGO analysis - Figure of enriched GO biological processes: Top 15 enriched GO BP terms are showed in the bar plot of each disease state in each tissue. Each row represents a significant GO biological process which is colored according to the -log10(p.adjust).
∗Top 15 enriched GO BP terms are showed in the bar plot of each disease state in each tissue. Each row represents a significant GO biological process which is colored according to the -log10(p.adjust).
Page: 1 2 3 4 5 6 7 8 9 

check button Enriched GO biological processes.
GO IDTissueDisease StageDescriptionGene RatioBg Ratiopvaluep.adjustCount
GO:014001414EsophagusESCCmitotic nuclear division218/8552287/187236.17e-261.78e-23218
GO:000007011EsophagusESCCmitotic sister chromatid segregation138/8552168/187231.37e-222.63e-20138
GO:00008194EsophagusESCCsister chromatid segregation157/8552202/187238.41e-211.33e-18157
GO:003304416EsophagusESCCregulation of chromosome organization145/8552187/187233.80e-194.31e-17145
GO:000705911EsophagusESCCchromosome segregation238/8552346/187231.72e-181.82e-16238
GO:004477216EsophagusESCCmitotic cell cycle phase transition281/8552424/187234.63e-184.45e-16281
GO:000734615EsophagusESCCregulation of mitotic cell cycle293/8552457/187238.00e-165.64e-14293
GO:00482853EsophagusESCCorganelle fission301/8552488/187234.64e-132.12e-11301
GO:00988133EsophagusESCCnuclear chromosome segregation187/8552281/187231.00e-124.36e-11187
GO:00002802EsophagusESCCnuclear division270/8552439/187231.17e-114.24e-10270
GO:190198713EsophagusESCCregulation of cell cycle phase transition242/8552390/187233.86e-111.26e-09242
GO:190199013EsophagusESCCregulation of mitotic cell cycle phase transition191/8552299/187231.35e-103.94e-09191
GO:00457865EsophagusESCCnegative regulation of cell cycle236/8552385/187233.62e-109.93e-09236
GO:00000754EsophagusESCCcell cycle checkpoint117/8552169/187234.47e-101.17e-08117
GO:0010639110EsophagusESCCnegative regulation of organelle organization215/8552348/187238.20e-102.01e-08215
GO:00070934EsophagusESCCmitotic cell cycle checkpoint90/8552129/187232.49e-084.69e-0790
GO:00519833EsophagusESCCregulation of chromosome segregation67/855291/187235.42e-089.66e-0767
GO:00070883EsophagusESCCregulation of mitotic nuclear division78/8552110/187236.96e-081.21e-0678
GO:00070912EsophagusESCCmetaphase/anaphase transition of mitotic cell cycle49/855262/187237.65e-081.33e-0649
GO:00513062EsophagusESCCmitotic sister chromatid separation52/855267/187239.14e-081.52e-0652
Page: 1 2 3 4 5 6 7 8 9 10 11 12 13 

check button Enriched KEGG pathways.
Pathway IDTissueDisease StageDescriptionGene RatioBg Ratiopvaluep.adjustqvalueCount
Page: 1 

Top

Cell-cell communication analysis

check buttonIdentification of potential cell-cell interactions between two cell types and their ligand-receptor pairs for different disease states
LigandReceptorLRpairPathwayTissueDisease Stage
Page: 1 

Top

Single-cell gene regulatory network inference analysis

check buttonFind out the significant the regulons (TFs) and the target genes of each regulon across cell types for different disease states
TFCell TypeTissueDisease StageTarget GeneRSSRegulon Activity
∗The dot plots of a searched regulon are shown for all cell subpopulations in each disease state of each tissue based on the regulon specific score inferred using pySCENIC and by calculating the average expression.
Page: 1 

Top

Somatic mutation of malignant transformation related genes

check buttonAnnotation of somatic variants for genes involved in malignant transformation
Hugo SymbolVariant ClassVariant ClassificationdbSNP RSHGVScHGVSpHGVSp ShortSWISSPROTBIOTYPESIFTPolyPhenTumor Sample BarcodeTissueHistologySexAgeStageTherapy TypesDrugsOutcome
ZWINTSNVMissense_Mutationc.452N>Ap.Ala151Glup.A151EO95229protein_codingtolerated(0.32)benign(0.003)TCGA-A8-A094-01Breastbreast invasive carcinomaFemale>=65I/IIUnknownUnknownSD
ZWINTSNVMissense_Mutationnovelc.773A>Gp.Asp258Glyp.D258GO95229protein_codingdeleterious_low_confidence(0.01)benign(0.217)TCGA-B6-A0RE-01Breastbreast invasive carcinomaFemale<65I/IIUnknownUnknownSD
ZWINTSNVMissense_Mutationrs758501648c.52N>Ap.Glu18Lysp.E18KO95229protein_codingtolerated(0.29)benign(0.006)TCGA-BH-A0HP-01Breastbreast invasive carcinomaFemale>=65III/IVChemotherapydoxorubicinSD
ZWINTSNVMissense_Mutationc.556N>Cp.Asp186Hisp.D186HO95229protein_codingdeleterious(0)possibly_damaging(0.471)TCGA-E2-A1IN-01Breastbreast invasive carcinomaFemale<65I/IIHormone TherapyarimidexSD
ZWINTSNVMissense_Mutationnovelc.266C>Ap.Ala89Glup.A89EO95229protein_codingdeleterious(0.01)probably_damaging(0.944)TCGA-E9-A295-01Breastbreast invasive carcinomaFemale>=65I/IIHormone TherapytamoxiphenSD
ZWINTinsertionNonsense_Mutationnovelc.326_327insTTGGTCTTTCTCCCTTGCTTATCTGTAGAAACAAATGp.Ile110TrpfsTer9p.I110Wfs*9O95229protein_codingTCGA-A7-A0CJ-01Breastbreast invasive carcinomaFemale<65I/IIChemotherapycytoxanSD
ZWINTinsertionFrame_Shift_Insnovelc.589_590insCTGGTTTACCTCTCTCTGCATCTGAGCTCTGCTCp.Gln197ProfsTer37p.Q197Pfs*37O95229protein_codingTCGA-A8-A07J-01Breastbreast invasive carcinomaFemale<65I/IIChemotherapy5-fluorouracilCR
ZWINTinsertionIn_Frame_Insnovelc.697_698insTCAp.Glu233delinsValLysp.E233delinsVKO95229protein_codingTCGA-A8-A09D-01Breastbreast invasive carcinomaFemale<65I/IIChemotherapydoxorubicinCR
ZWINTinsertionNonsense_Mutationnovelc.696_697insCATTTGTCTTTATGATTTTCTAGTTGTp.Ala232_Glu233insHisLeuSerLeuTerPheSerSerCysp.A232_E233insHLSL*FSSCO95229protein_codingTCGA-A8-A09D-01Breastbreast invasive carcinomaFemale<65I/IIChemotherapydoxorubicinCR
ZWINTSNVMissense_Mutationc.757N>Ap.Asp253Asnp.D253NO95229protein_codingdeleterious_low_confidence(0.02)benign(0.066)TCGA-FU-A5XV-01Cervixcervical & endocervical cancerFemale<65III/IVUnknownUnknownSD
Page: 1 2 3 4 5 6 

Top

Related drugs of malignant transformation related genes

check buttonIdentification of chemicals and drugs interact with genes involved in malignant transfromation
(DGIdb 4.0)
Entrez IDSymbolCategoryInteraction TypesDrug Claim NameDrug NamePMIDs
Page: 1