
|
|||||
|
 | |
| |
| |
| |
| |
| |
|
Gene: ZSWIM8 |
Gene summary for ZSWIM8 |
| Gene information | Species | Human | Gene symbol | ZSWIM8 | Gene ID | 23053 |
| Gene name | zinc finger SWIM-type containing 8 | |
| Gene Alias | KIAA0913 | |
| Cytomap | 10q22.2 | |
| Gene Type | protein-coding | GO ID | GO:0006139 | UniProtAcc | A7E2V4 |
Top |
Malignant transformation analysis |
| Identification of the aberrant gene expression in precancerous and cancerous lesions by comparing the gene expression of stem-like cells in diseased tissues with normal stem cells |
| Entrez ID | Symbol | Replicates | Species | Organ | Tissue | Adj P-value | Log2FC | Malignancy |
| 23053 | ZSWIM8 | HCC1_Meng | Human | Liver | HCC | 1.13e-13 | -4.42e-02 | 0.0246 |
| 23053 | ZSWIM8 | HCC2_Meng | Human | Liver | HCC | 1.49e-11 | 4.96e-02 | 0.0107 |
| 23053 | ZSWIM8 | HCC2 | Human | Liver | HCC | 4.84e-13 | 2.34e+00 | 0.5341 |
| 23053 | ZSWIM8 | S014 | Human | Liver | HCC | 3.09e-03 | 3.17e-01 | 0.2254 |
| 23053 | ZSWIM8 | S015 | Human | Liver | HCC | 4.64e-05 | 4.14e-01 | 0.2375 |
| 23053 | ZSWIM8 | S016 | Human | Liver | HCC | 3.61e-05 | 3.56e-01 | 0.2243 |
| 23053 | ZSWIM8 | S027 | Human | Liver | HCC | 5.80e-07 | 5.67e-01 | 0.2446 |
| 23053 | ZSWIM8 | S028 | Human | Liver | HCC | 9.00e-15 | 6.14e-01 | 0.2503 |
| 23053 | ZSWIM8 | S029 | Human | Liver | HCC | 2.55e-09 | 5.30e-01 | 0.2581 |
| 23053 | ZSWIM8 | male-WTA | Human | Thyroid | PTC | 2.45e-18 | 1.43e-01 | 0.1037 |
| 23053 | ZSWIM8 | PTC01 | Human | Thyroid | PTC | 8.77e-05 | 7.64e-02 | 0.1899 |
| 23053 | ZSWIM8 | PTC03 | Human | Thyroid | PTC | 6.02e-04 | 1.05e-01 | 0.1784 |
| 23053 | ZSWIM8 | PTC04 | Human | Thyroid | PTC | 2.12e-21 | 3.44e-01 | 0.1927 |
| 23053 | ZSWIM8 | PTC05 | Human | Thyroid | PTC | 3.43e-20 | 4.96e-01 | 0.2065 |
| 23053 | ZSWIM8 | PTC06 | Human | Thyroid | PTC | 2.45e-22 | 4.03e-01 | 0.2057 |
| 23053 | ZSWIM8 | PTC07 | Human | Thyroid | PTC | 2.74e-17 | 3.18e-01 | 0.2044 |
| 23053 | ZSWIM8 | ATC09 | Human | Thyroid | ATC | 6.18e-20 | 4.05e-01 | 0.2871 |
| 23053 | ZSWIM8 | ATC11 | Human | Thyroid | ATC | 1.24e-03 | 2.27e-01 | 0.3386 |
| 23053 | ZSWIM8 | ATC12 | Human | Thyroid | ATC | 4.67e-13 | 2.37e-01 | 0.34 |
| 23053 | ZSWIM8 | ATC13 | Human | Thyroid | ATC | 3.45e-25 | 4.01e-01 | 0.34 |
| Page: 1 2 |
| Tissue | Expression Dynamics | Abbreviation |
| Liver | 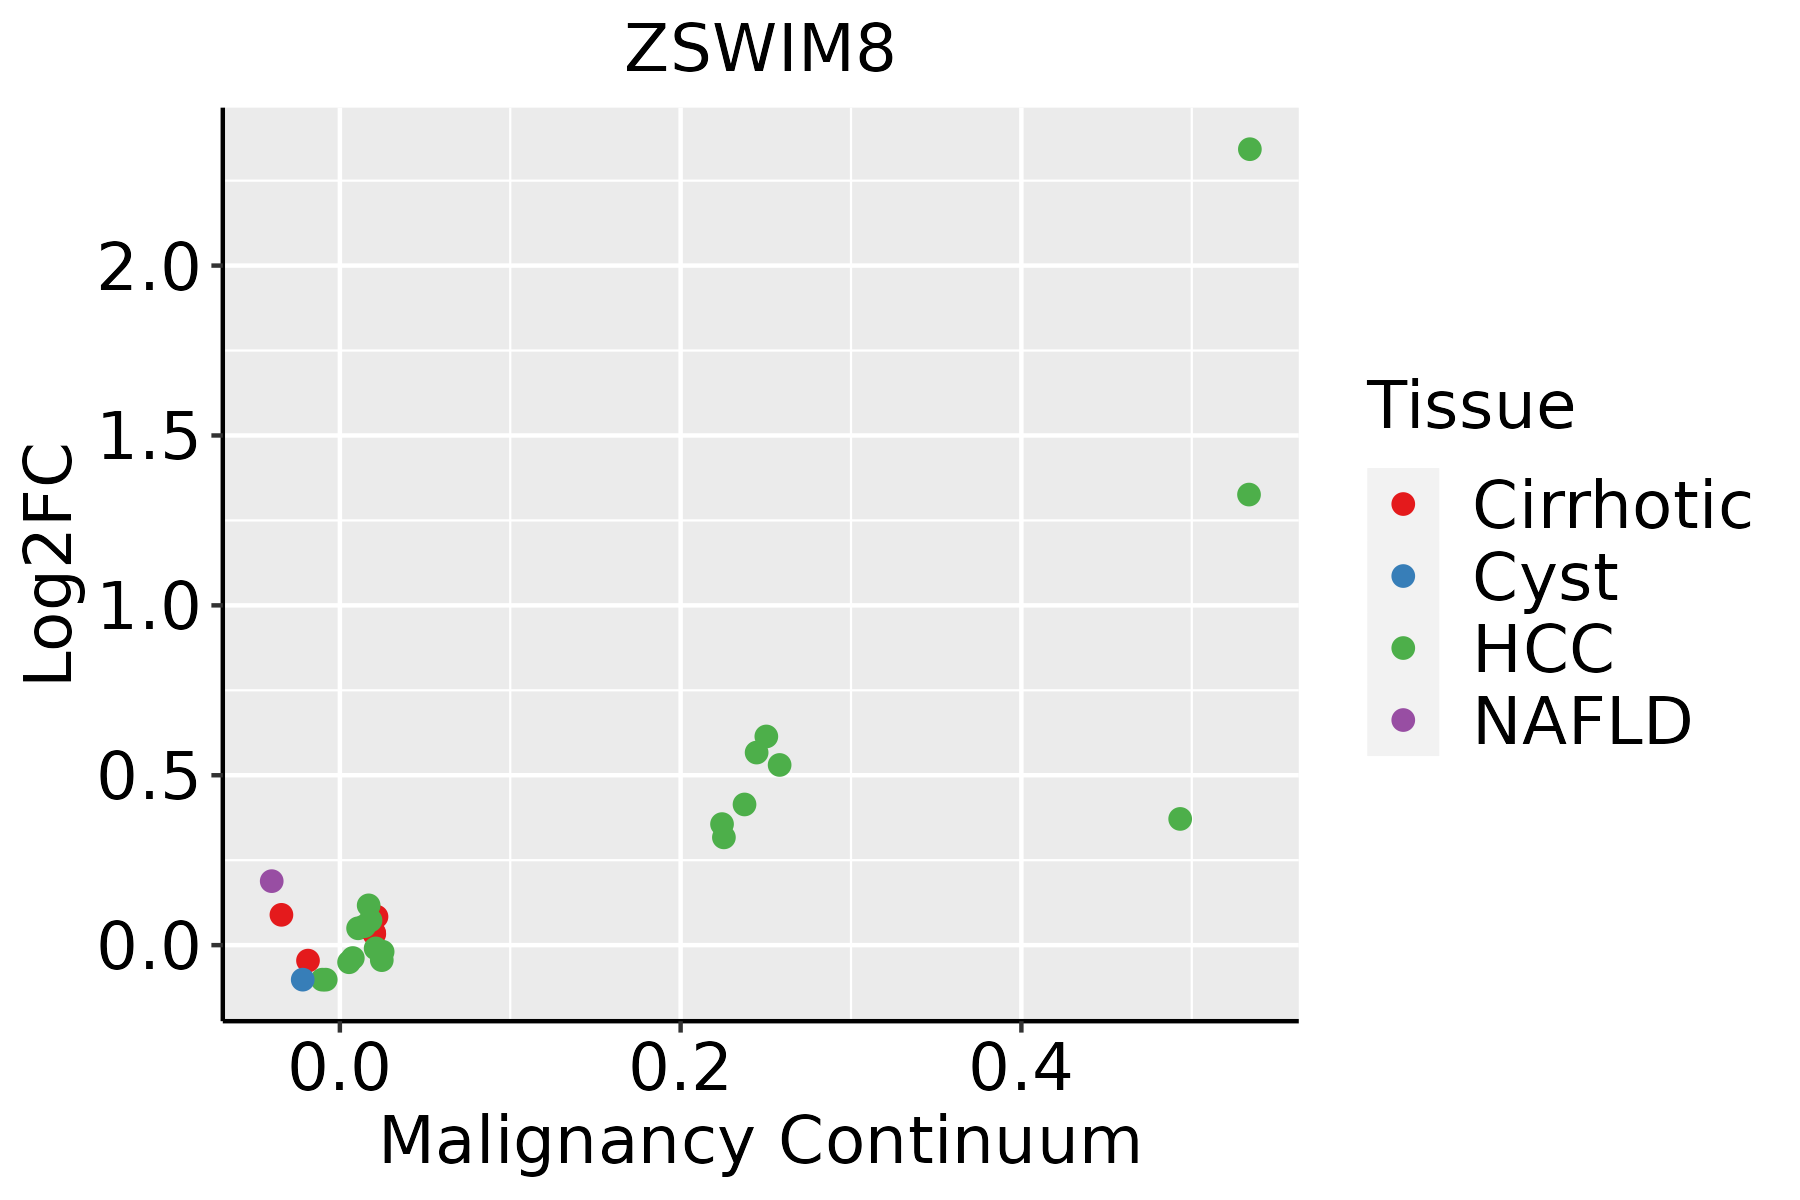 | HCC: Hepatocellular carcinoma |
| NAFLD: Non-alcoholic fatty liver disease | ||
| Thyroid |  | ATC: Anaplastic thyroid cancer |
| HT: Hashimoto's thyroiditis | ||
| PTC: Papillary thyroid cancer |
| ∗log2FC in expression of this searched gene in stem-like cells from each diseased tissue sample relative to stem-like cells in normal samples in each tissue plotted against the malignancy continuum. Samples are colored based on if they are from different disease stage. |
Top |
Malignant transformation related pathway analysis |
| Find out the enriched GO biological processes and KEGG pathways involved in transition from healthy to precancer to cancer |
| Tissue | Disease Stage | Enriched GO biological Processes |
| Colorectum | AD |  |
| Colorectum | SER |  |
| Colorectum | MSS |  |
| Colorectum | MSI-H |  |
| Colorectum | FAP |  |
| ∗Top 15 enriched GO BP terms are showed in the bar plot of each disease state in each tissue. Each row represents a significant GO biological process which is colored according to the -log10(p.adjust). |
| Page: 1 2 3 4 5 6 7 8 9 |
| GO ID | Tissue | Disease Stage | Description | Gene Ratio | Bg Ratio | pvalue | p.adjust | Count |
| GO:001049822 | Liver | HCC | proteasomal protein catabolic process | 351/7958 | 490/18723 | 6.92e-40 | 1.46e-36 | 351 |
| GO:004316122 | Liver | HCC | proteasome-mediated ubiquitin-dependent protein catabolic process | 299/7958 | 412/18723 | 7.82e-36 | 8.27e-33 | 299 |
| GO:00346601 | Liver | HCC | ncRNA metabolic process | 332/7958 | 485/18723 | 1.48e-31 | 7.80e-29 | 332 |
| GO:000989622 | Liver | HCC | positive regulation of catabolic process | 335/7958 | 492/18723 | 3.83e-31 | 1.87e-28 | 335 |
| GO:003133122 | Liver | HCC | positive regulation of cellular catabolic process | 295/7958 | 427/18723 | 3.20e-29 | 1.45e-26 | 295 |
| GO:004427021 | Liver | HCC | cellular nitrogen compound catabolic process | 303/7958 | 451/18723 | 9.76e-27 | 3.64e-24 | 303 |
| GO:004670021 | Liver | HCC | heterocycle catabolic process | 299/7958 | 445/18723 | 2.07e-26 | 7.29e-24 | 299 |
| GO:190136121 | Liver | HCC | organic cyclic compound catabolic process | 325/7958 | 495/18723 | 6.52e-26 | 2.18e-23 | 325 |
| GO:001943921 | Liver | HCC | aromatic compound catabolic process | 309/7958 | 467/18723 | 1.56e-25 | 4.94e-23 | 309 |
| GO:000640121 | Liver | HCC | RNA catabolic process | 201/7958 | 278/18723 | 3.88e-24 | 1.02e-21 | 201 |
| GO:003465521 | Liver | HCC | nucleobase-containing compound catabolic process | 273/7958 | 407/18723 | 4.84e-24 | 1.23e-21 | 273 |
| GO:001058611 | Liver | HCC | miRNA metabolic process | 22/7958 | 27/18723 | 3.97e-05 | 3.90e-04 | 22 |
| GO:00346611 | Liver | HCC | ncRNA catabolic process | 31/7958 | 43/18723 | 8.13e-05 | 7.19e-04 | 31 |
| GO:2000628 | Liver | HCC | regulation of miRNA metabolic process | 10/7958 | 12/18723 | 4.79e-03 | 2.02e-02 | 10 |
| GO:0010498113 | Thyroid | PTC | proteasomal protein catabolic process | 297/5968 | 490/18723 | 4.58e-40 | 9.63e-37 | 297 |
| GO:0043161113 | Thyroid | PTC | proteasome-mediated ubiquitin-dependent protein catabolic process | 254/5968 | 412/18723 | 3.91e-36 | 4.54e-33 | 254 |
| GO:0009896113 | Thyroid | PTC | positive regulation of catabolic process | 278/5968 | 492/18723 | 3.35e-30 | 2.64e-27 | 278 |
| GO:0031331113 | Thyroid | PTC | positive regulation of cellular catabolic process | 249/5968 | 427/18723 | 5.28e-30 | 3.58e-27 | 249 |
| GO:0006401112 | Thyroid | PTC | RNA catabolic process | 163/5968 | 278/18723 | 2.13e-20 | 3.27e-18 | 163 |
| GO:0034655112 | Thyroid | PTC | nucleobase-containing compound catabolic process | 211/5968 | 407/18723 | 2.72e-17 | 2.52e-15 | 211 |
| Page: 1 2 3 |
| Pathway ID | Tissue | Disease Stage | Description | Gene Ratio | Bg Ratio | pvalue | p.adjust | qvalue | Count |
| Page: 1 |
Top |
Cell-cell communication analysis |
| Identification of potential cell-cell interactions between two cell types and their ligand-receptor pairs for different disease states |
| Ligand | Receptor | LRpair | Pathway | Tissue | Disease Stage |
| Page: 1 |
Top |
Single-cell gene regulatory network inference analysis |
| Find out the significant the regulons (TFs) and the target genes of each regulon across cell types for different disease states |
| TF | Cell Type | Tissue | Disease Stage | Target Gene | RSS | Regulon Activity |
| ∗The dot plots of a searched regulon are shown for all cell subpopulations in each disease state of each tissue based on the regulon specific score inferred using pySCENIC and by calculating the average expression. |
| Page: 1 |
Top |
Somatic mutation of malignant transformation related genes |
| Annotation of somatic variants for genes involved in malignant transformation |
| Hugo Symbol | Variant Class | Variant Classification | dbSNP RS | HGVSc | HGVSp | HGVSp Short | SWISSPROT | BIOTYPE | SIFT | PolyPhen | Tumor Sample Barcode | Tissue | Histology | Sex | Age | Stage | Therapy Types | Drugs | Outcome |
| ZSWIM8 | SNV | Missense_Mutation | novel | c.2932N>A | p.Ala978Thr | p.A978T | A7E2V4 | protein_coding | deleterious(0.01) | benign(0.019) | TCGA-A2-A0CM-01 | Breast | breast invasive carcinoma | Female | <65 | I/II | Chemotherapy | adriamycin | PD |
| ZSWIM8 | SNV | Missense_Mutation | c.4387N>A | p.Glu1463Lys | p.E1463K | A7E2V4 | protein_coding | tolerated(0.23) | benign(0.111) | TCGA-A8-A06Q-01 | Breast | breast invasive carcinoma | Female | <65 | III/IV | Unknown | Unknown | SD | |
| ZSWIM8 | SNV | Missense_Mutation | c.779N>G | p.Ser260Cys | p.S260C | A7E2V4 | protein_coding | deleterious(0.02) | probably_damaging(0.993) | TCGA-A8-A095-01 | Breast | breast invasive carcinoma | Female | <65 | I/II | Chemotherapy | 5-fluorouracil | CR | |
| ZSWIM8 | SNV | Missense_Mutation | c.3374G>A | p.Arg1125His | p.R1125H | A7E2V4 | protein_coding | deleterious_low_confidence(0.04) | probably_damaging(0.991) | TCGA-AN-A0AK-01 | Breast | breast invasive carcinoma | Female | >=65 | I/II | Unknown | Unknown | SD | |
| ZSWIM8 | SNV | Missense_Mutation | c.3856G>A | p.Ala1286Thr | p.A1286T | A7E2V4 | protein_coding | deleterious(0) | probably_damaging(0.99) | TCGA-AN-A0AK-01 | Breast | breast invasive carcinoma | Female | >=65 | I/II | Unknown | Unknown | SD | |
| ZSWIM8 | SNV | Missense_Mutation | c.3360N>C | p.Leu1120Phe | p.L1120F | A7E2V4 | protein_coding | tolerated_low_confidence(0.06) | probably_damaging(0.994) | TCGA-AN-A0XN-01 | Breast | breast invasive carcinoma | Female | >=65 | III/IV | Unknown | Unknown | SD | |
| ZSWIM8 | SNV | Missense_Mutation | novel | c.4894G>C | p.Ala1632Pro | p.A1632P | A7E2V4 | protein_coding | tolerated(0.27) | benign(0.094) | TCGA-B6-A0IK-01 | Breast | breast invasive carcinoma | Female | <65 | III/IV | Unknown | Unknown | PD |
| ZSWIM8 | SNV | Missense_Mutation | c.1723N>G | p.Leu575Val | p.L575V | A7E2V4 | protein_coding | tolerated_low_confidence(0.75) | benign(0) | TCGA-C8-A275-01 | Breast | breast invasive carcinoma | Female | <65 | I/II | Unknown | Unknown | SD | |
| ZSWIM8 | SNV | Missense_Mutation | c.3593C>T | p.Ser1198Leu | p.S1198L | A7E2V4 | protein_coding | tolerated(0.07) | probably_damaging(0.978) | TCGA-D8-A1J9-01 | Breast | breast invasive carcinoma | Female | <65 | I/II | Unknown | Unknown | SD | |
| ZSWIM8 | SNV | Missense_Mutation | novel | c.2293N>A | p.Glu765Lys | p.E765K | A7E2V4 | protein_coding | tolerated(0.33) | benign(0.003) | TCGA-E2-A2P6-01 | Breast | breast invasive carcinoma | Female | >=65 | I/II | Hormone Therapy | anastrozole | SD |
| Page: 1 2 3 4 5 6 7 8 9 10 11 12 13 14 15 16 17 |
Top |
Related drugs of malignant transformation related genes |
| Identification of chemicals and drugs interact with genes involved in malignant transfromation |
| (DGIdb 4.0) |
| Entrez ID | Symbol | Category | Interaction Types | Drug Claim Name | Drug Name | PMIDs |
| Page: 1 |

Copyright 2023-Present -The University of Texas Health Science Center at Houston |