
|
|||||
|
 | |
| |
| |
| |
| |
| |
|
Gene: ZSWIM6 |
Gene summary for ZSWIM6 |
| Gene information | Species | Human | Gene symbol | ZSWIM6 | Gene ID | 57688 |
| Gene name | zinc finger SWIM-type containing 6 | |
| Gene Alias | AFND | |
| Cytomap | 5q12.1 | |
| Gene Type | protein-coding | GO ID | GO:0007275 | UniProtAcc | Q9HCJ5 |
Top |
Malignant transformation analysis |
| Identification of the aberrant gene expression in precancerous and cancerous lesions by comparing the gene expression of stem-like cells in diseased tissues with normal stem cells |
| Entrez ID | Symbol | Replicates | Species | Organ | Tissue | Adj P-value | Log2FC | Malignancy |
| 57688 | ZSWIM6 | CCI_1 | Human | Cervix | CC | 1.82e-11 | 1.09e+00 | 0.528 |
| 57688 | ZSWIM6 | CCI_2 | Human | Cervix | CC | 5.17e-22 | 2.76e+00 | 0.5249 |
| 57688 | ZSWIM6 | CCI_3 | Human | Cervix | CC | 3.00e-36 | 1.73e+00 | 0.516 |
| 57688 | ZSWIM6 | CCII_1 | Human | Cervix | CC | 5.14e-05 | 3.32e-01 | 0.3249 |
| 57688 | ZSWIM6 | HTA11_3410_2000001011 | Human | Colorectum | AD | 4.03e-23 | -7.01e-01 | 0.0155 |
| 57688 | ZSWIM6 | HTA11_2951_2000001011 | Human | Colorectum | AD | 2.80e-03 | -7.50e-01 | 0.0216 |
| 57688 | ZSWIM6 | HTA11_347_2000001011 | Human | Colorectum | AD | 4.22e-18 | 7.86e-01 | -0.1954 |
| 57688 | ZSWIM6 | HTA11_2112_2000001011 | Human | Colorectum | SER | 4.34e-06 | 6.12e-01 | -0.2196 |
| 57688 | ZSWIM6 | HTA11_83_2000001011 | Human | Colorectum | SER | 4.01e-02 | 3.53e-01 | -0.1526 |
| 57688 | ZSWIM6 | HTA11_7862_2000001011 | Human | Colorectum | AD | 8.45e-06 | -6.66e-01 | -0.0179 |
| 57688 | ZSWIM6 | HTA11_866_3004761011 | Human | Colorectum | AD | 2.88e-18 | -7.43e-01 | 0.096 |
| 57688 | ZSWIM6 | HTA11_4255_2000001011 | Human | Colorectum | SER | 1.43e-03 | -5.84e-01 | 0.0446 |
| 57688 | ZSWIM6 | HTA11_8622_2000001021 | Human | Colorectum | SER | 5.34e-08 | -9.26e-01 | 0.0528 |
| 57688 | ZSWIM6 | HTA11_6801_2000001011 | Human | Colorectum | SER | 7.89e-04 | -8.98e-01 | 0.0171 |
| 57688 | ZSWIM6 | HTA11_7696_3000711011 | Human | Colorectum | AD | 1.24e-07 | -4.89e-01 | 0.0674 |
| 57688 | ZSWIM6 | HTA11_6818_2000001011 | Human | Colorectum | AD | 6.06e-05 | -5.45e-01 | 0.0112 |
| 57688 | ZSWIM6 | HTA11_99999970781_79442 | Human | Colorectum | MSS | 1.19e-26 | -7.57e-01 | 0.294 |
| 57688 | ZSWIM6 | HTA11_99999971662_82457 | Human | Colorectum | MSS | 5.24e-22 | -7.46e-01 | 0.3859 |
| 57688 | ZSWIM6 | HTA11_99999973899_84307 | Human | Colorectum | MSS | 1.10e-09 | -7.88e-01 | 0.2585 |
| 57688 | ZSWIM6 | HTA11_99999974143_84620 | Human | Colorectum | MSS | 3.97e-74 | -1.30e+00 | 0.3005 |
| Page: 1 2 3 4 5 6 7 8 9 |
| Tissue | Expression Dynamics | Abbreviation |
| Cervix | 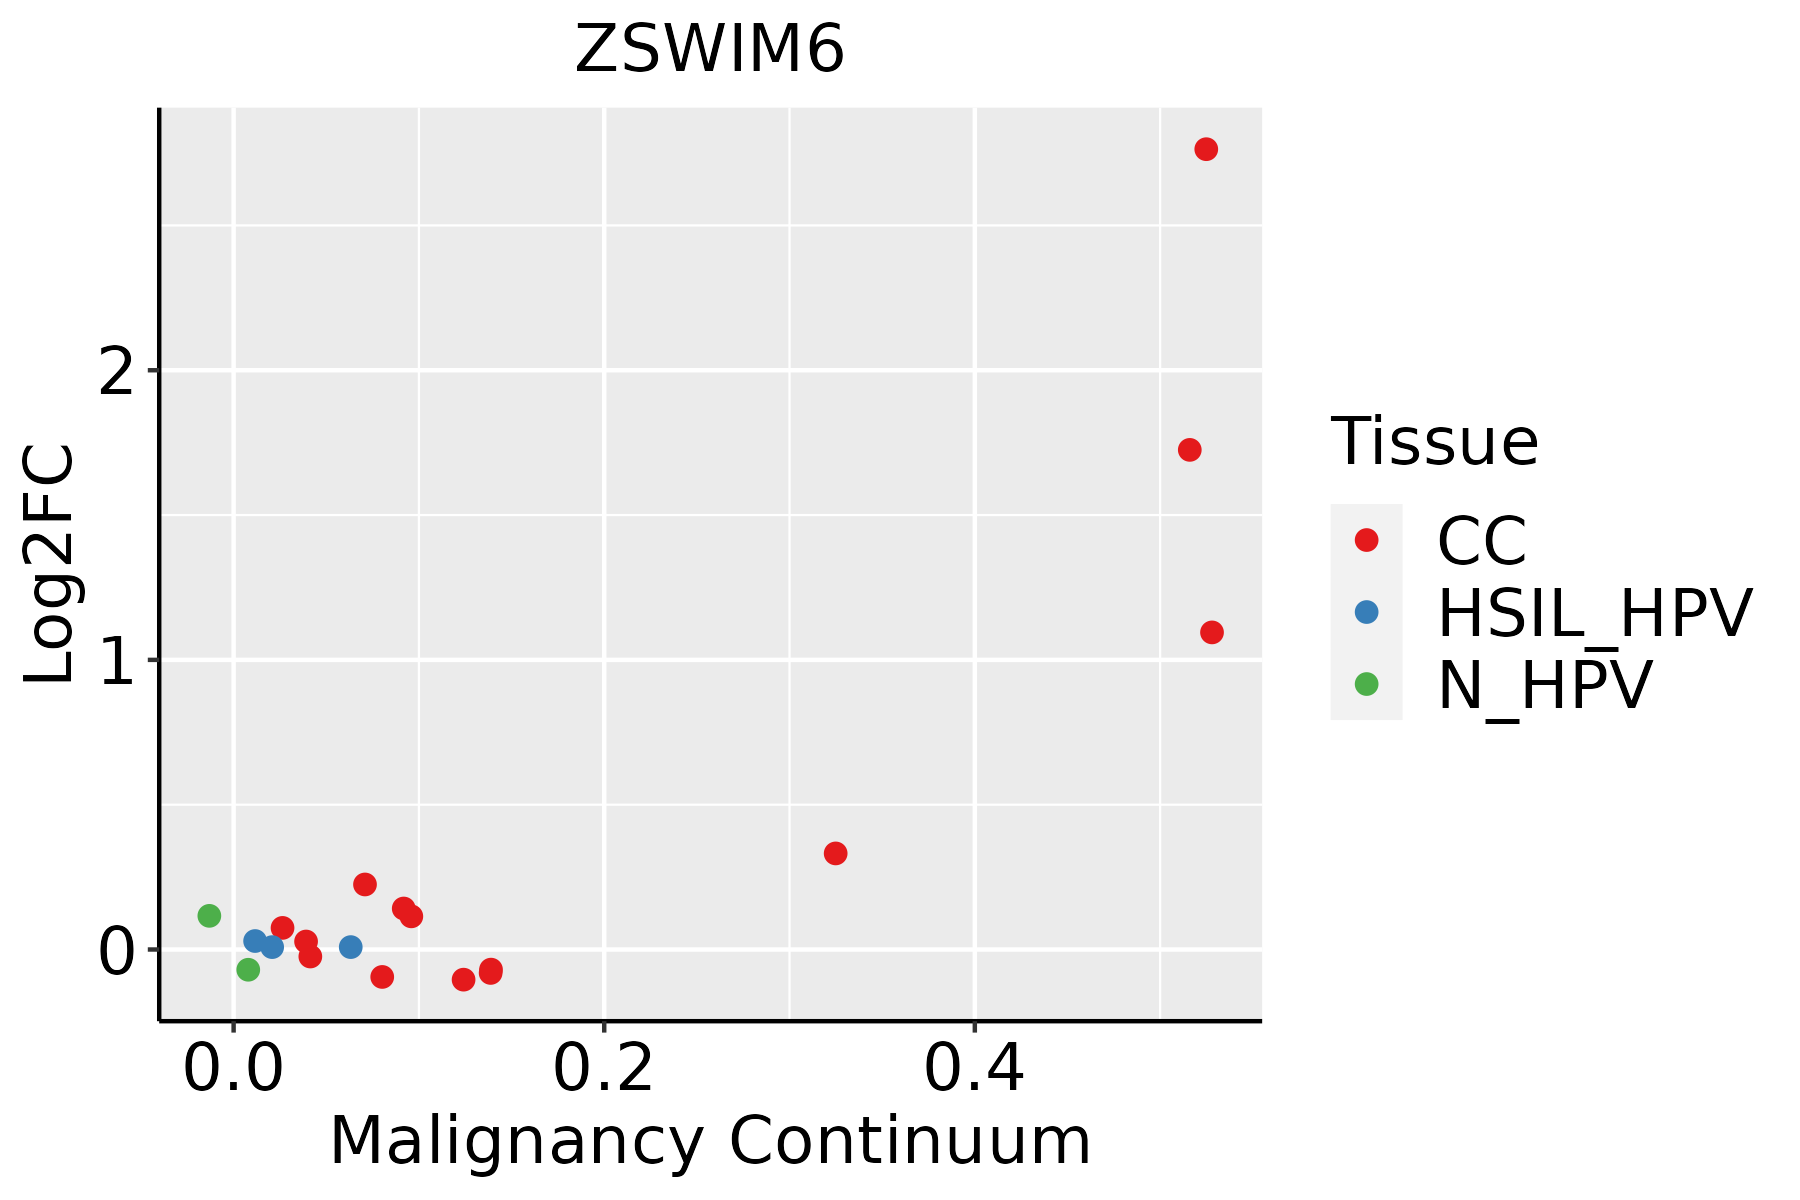 | CC: Cervix cancer |
| HSIL_HPV: HPV-infected high-grade squamous intraepithelial lesions | ||
| N_HPV: HPV-infected normal cervix | ||
| Colorectum (GSE201348) | 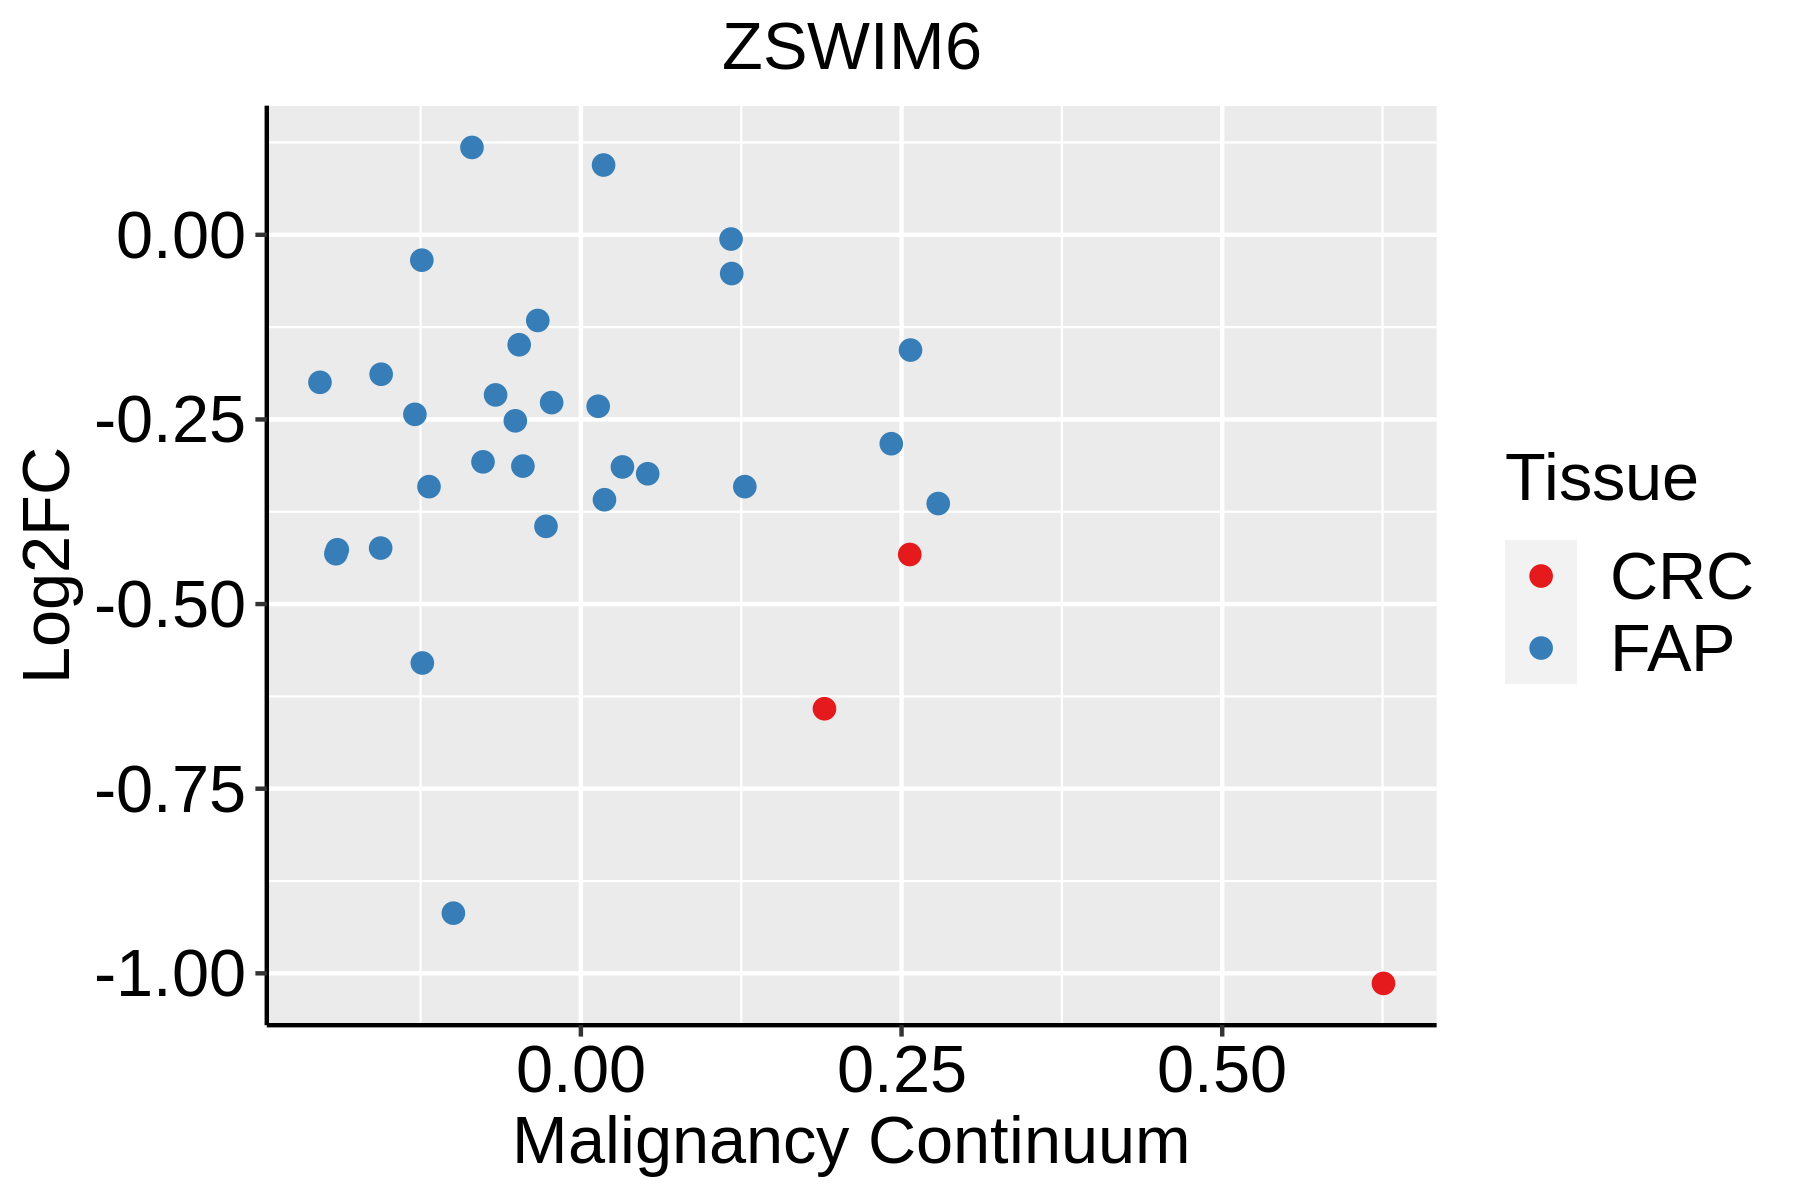 | FAP: Familial adenomatous polyposis |
| CRC: Colorectal cancer | ||
| Colorectum (HTA11) |  | AD: Adenomas |
| SER: Sessile serrated lesions | ||
| MSI-H: Microsatellite-high colorectal cancer | ||
| MSS: Microsatellite stable colorectal cancer | ||
| Endometrium |  | AEH: Atypical endometrial hyperplasia |
| EEC: Endometrioid Cancer | ||
| GC | 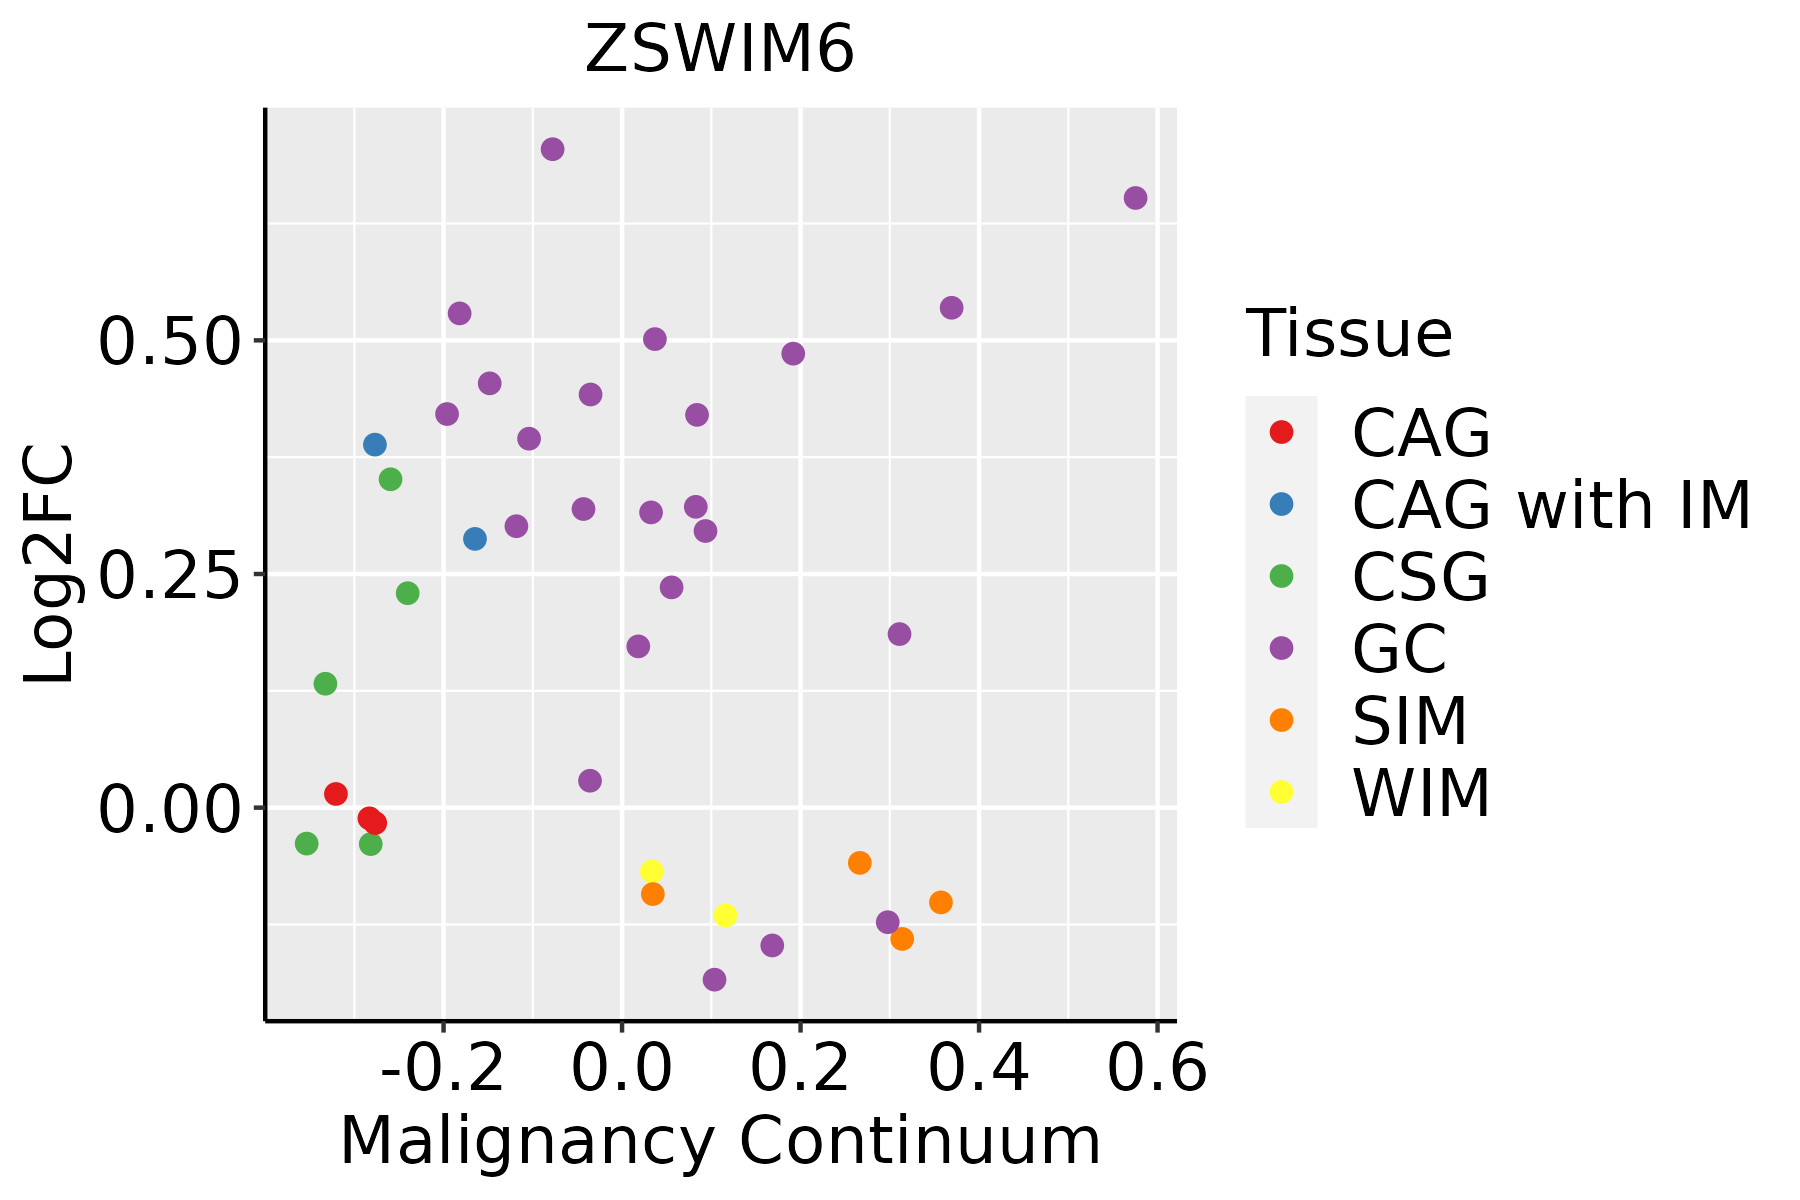 | CAG: Chronic atrophic gastritis |
| CAG with IM: Chronic atrophic gastritis with intestinal metaplasia | ||
| CSG: Chronic superficial gastritis | ||
| GC: Gastric cancer | ||
| SIM: Severe intestinal metaplasia | ||
| WIM: Wild intestinal metaplasia | ||
| Liver | 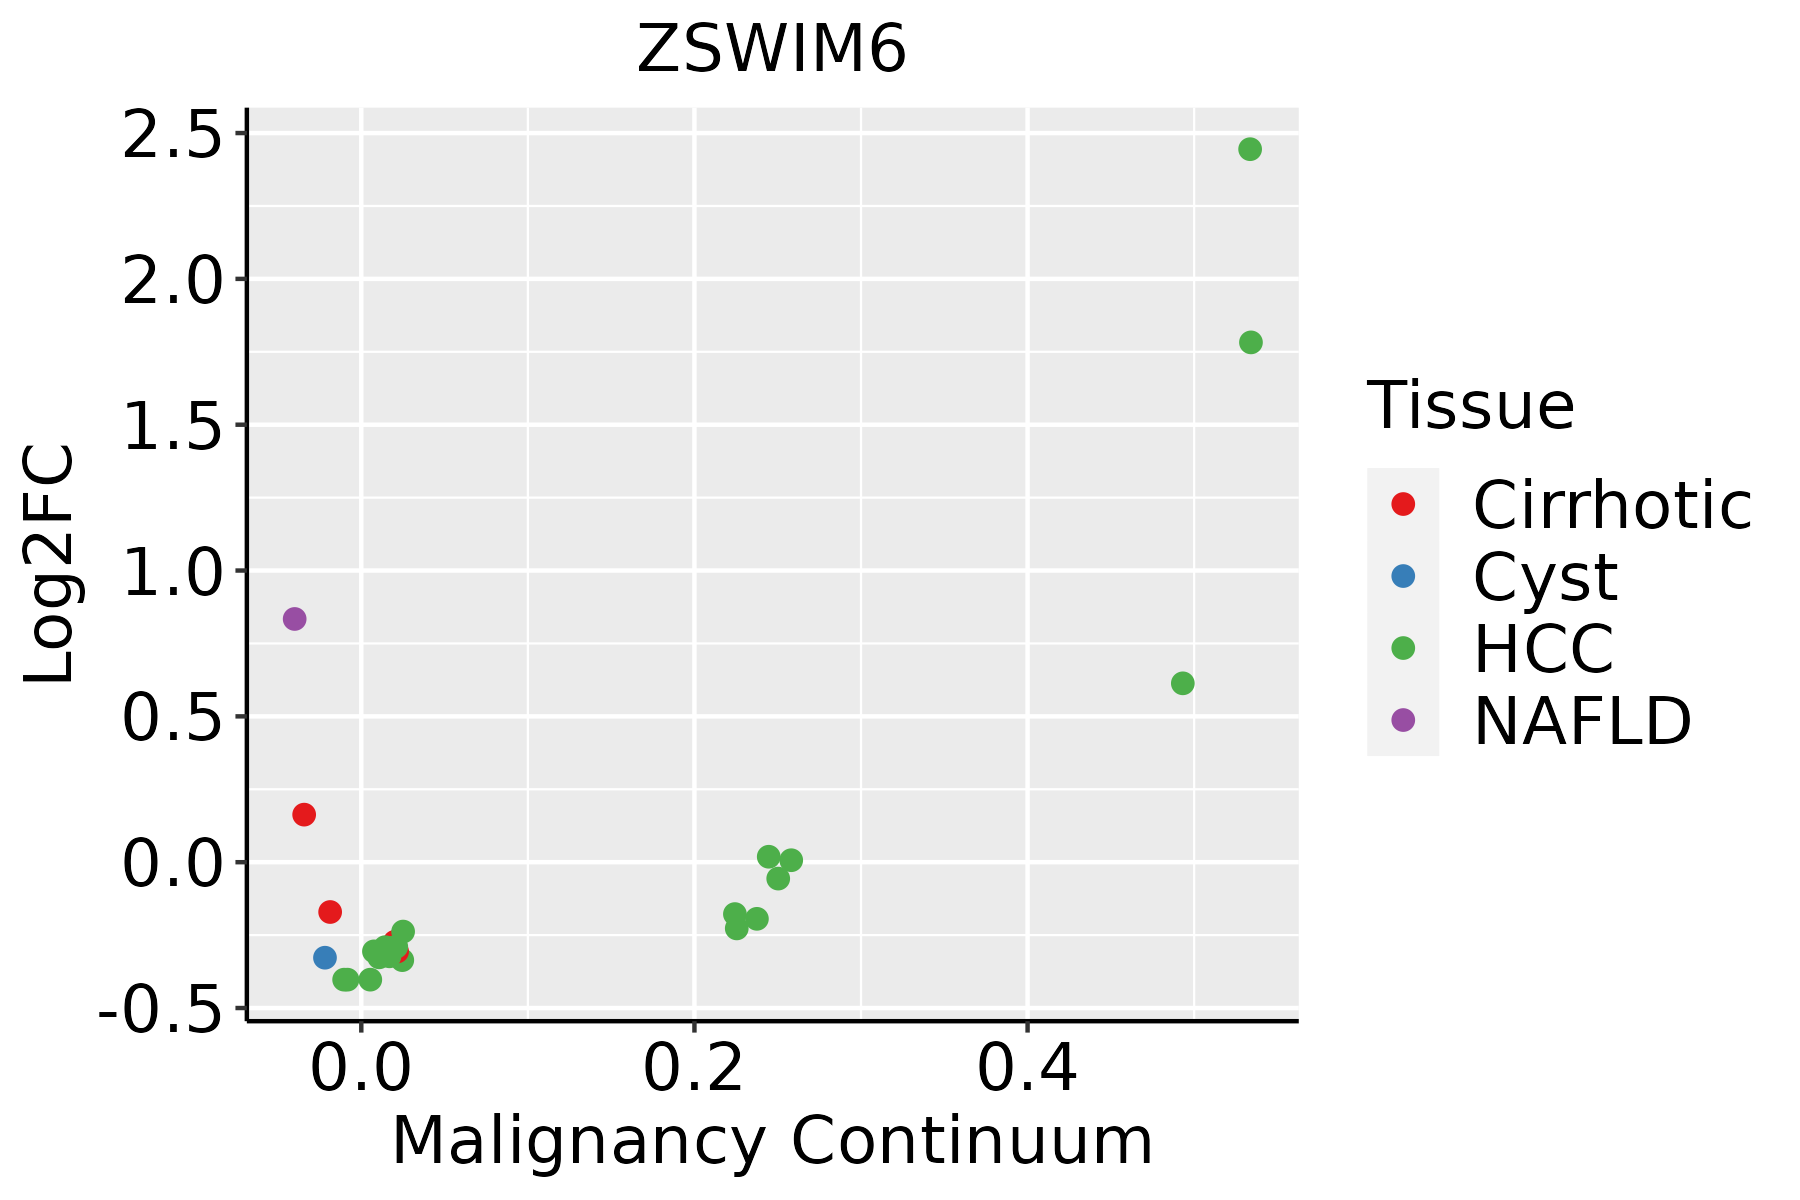 | HCC: Hepatocellular carcinoma |
| NAFLD: Non-alcoholic fatty liver disease | ||
| Lung |  | AAH: Atypical adenomatous hyperplasia |
| AIS: Adenocarcinoma in situ | ||
| IAC: Invasive lung adenocarcinoma | ||
| MIA: Minimally invasive adenocarcinoma | ||
| Oral Cavity | 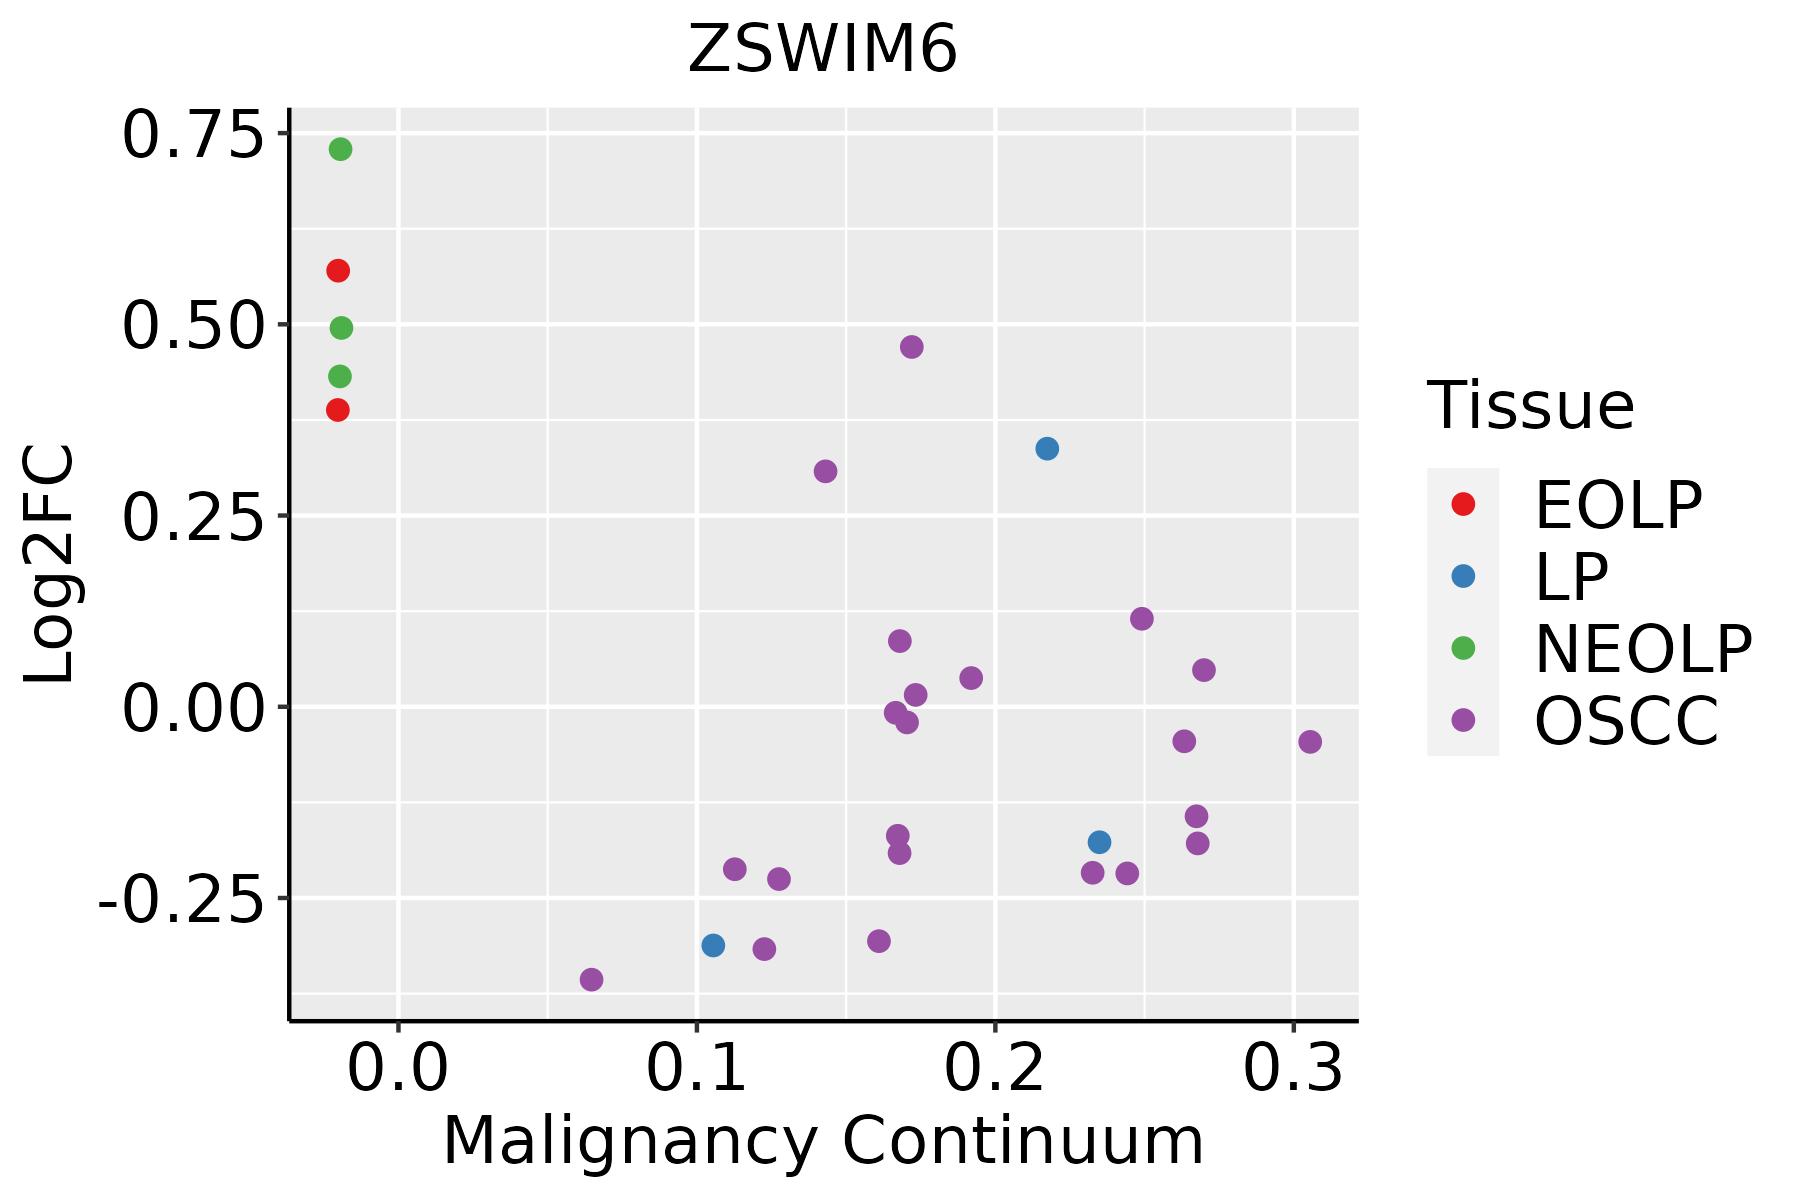 | EOLP: Erosive Oral lichen planus |
| LP: leukoplakia | ||
| NEOLP: Non-erosive oral lichen planus | ||
| OSCC: Oral squamous cell carcinoma | ||
| Prostate | 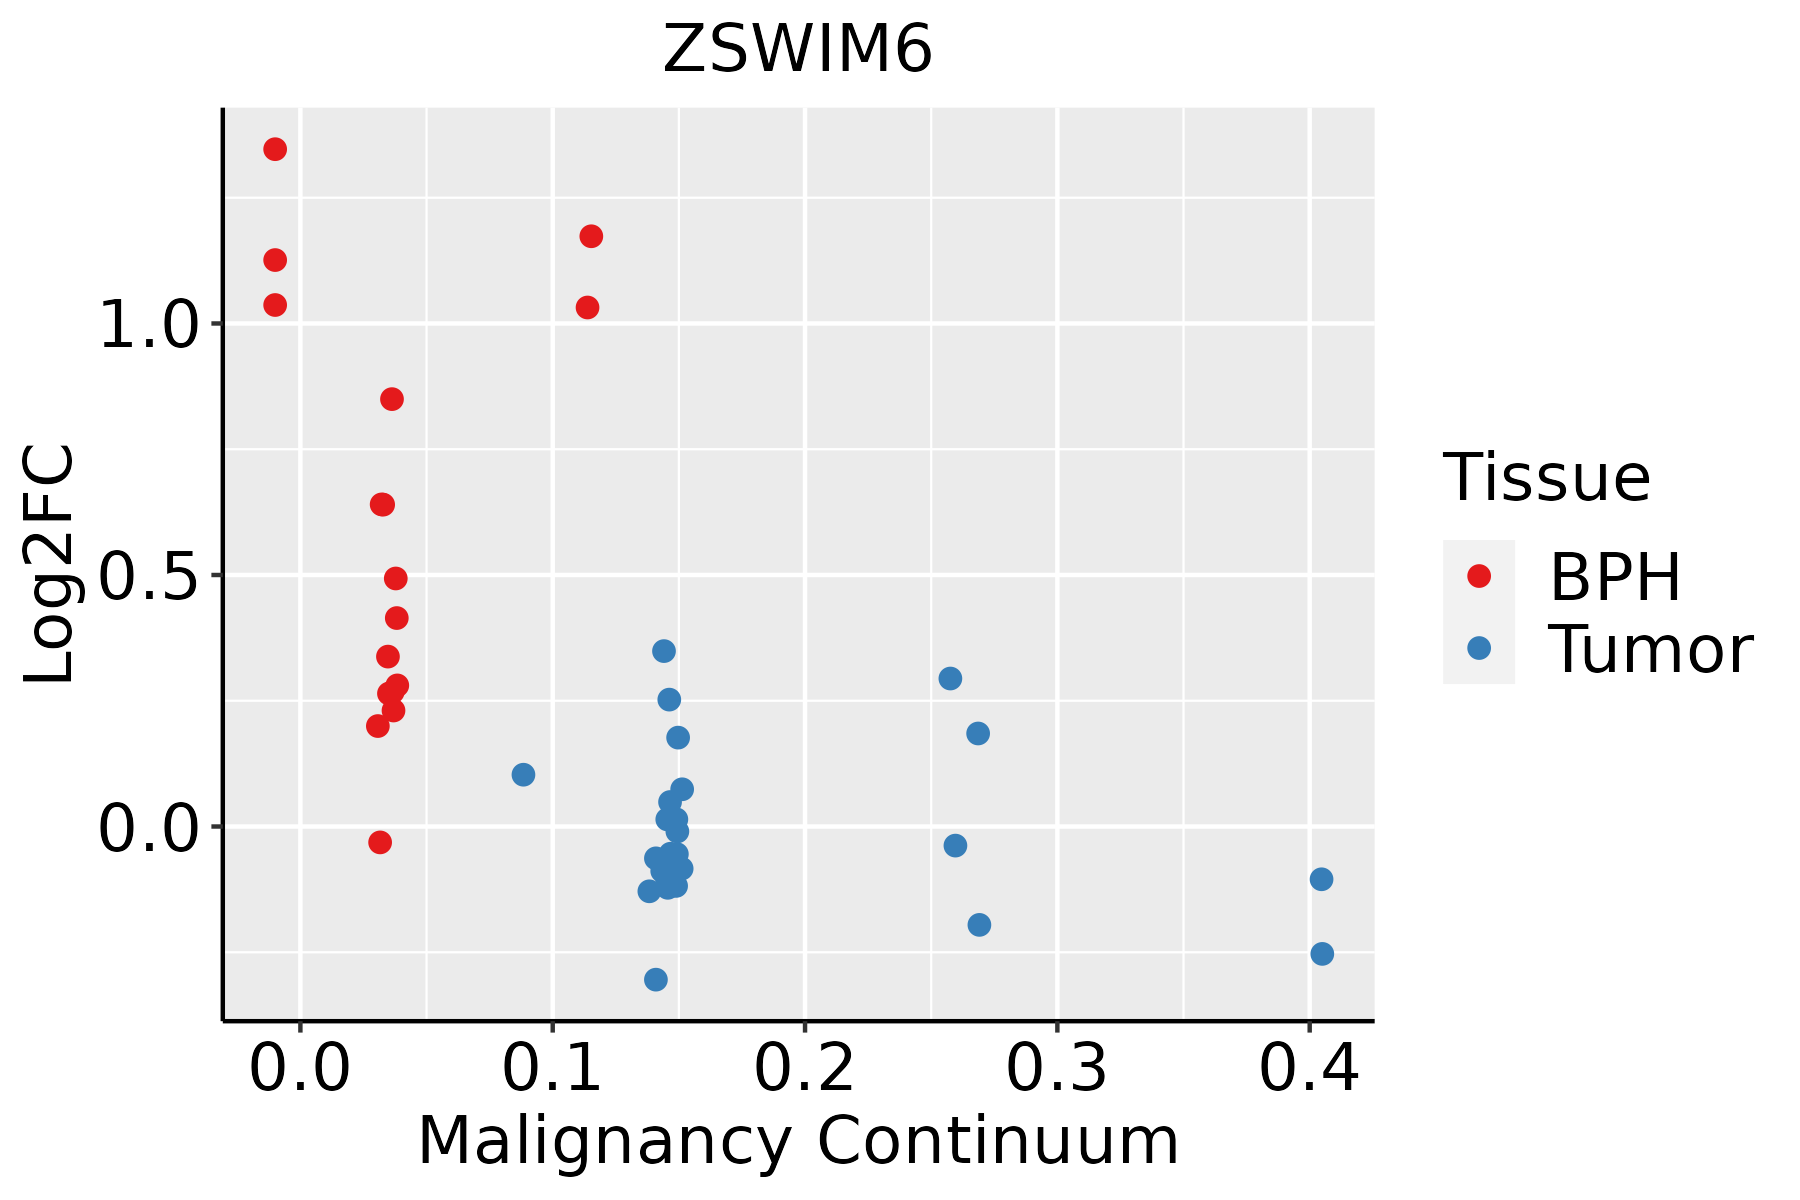 | BPH: Benign Prostatic Hyperplasia |
| Skin | 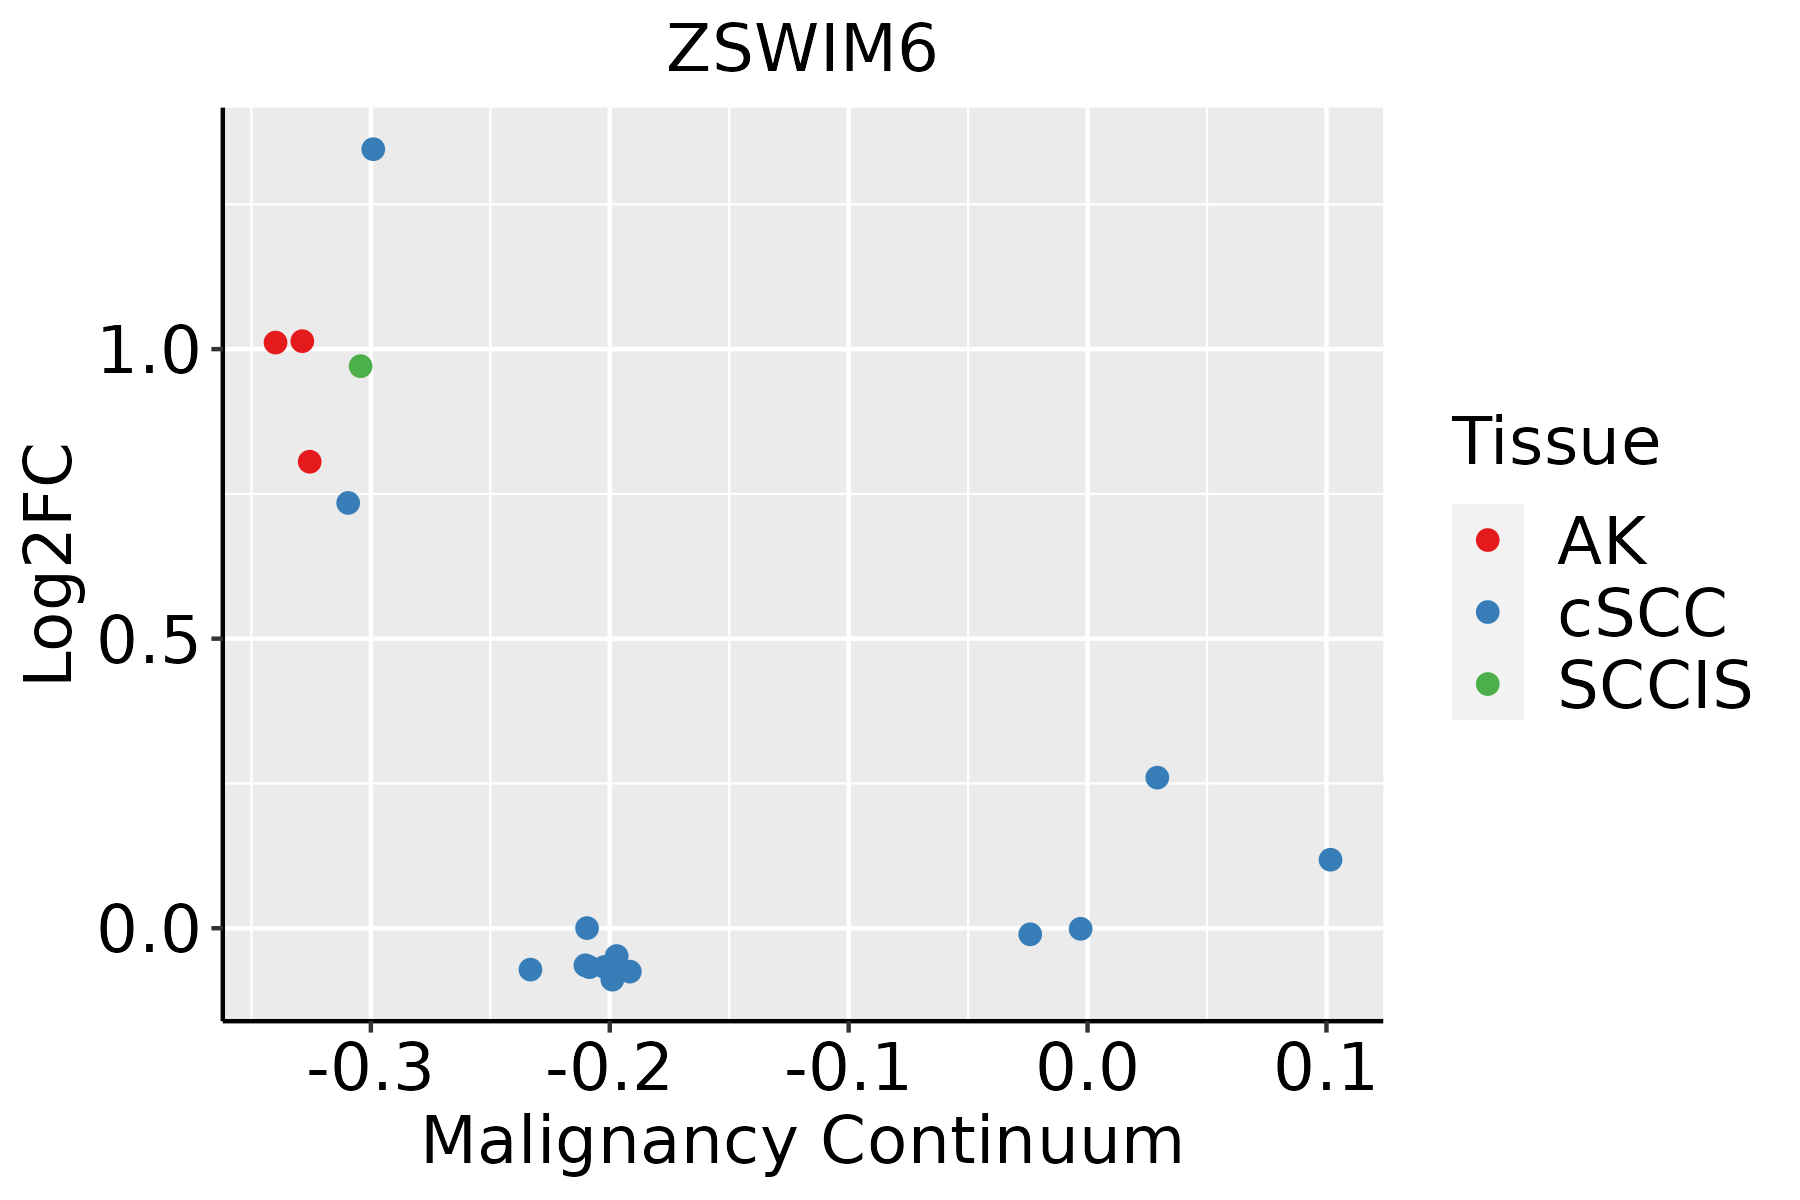 | AK: Actinic keratosis |
| cSCC: Cutaneous squamous cell carcinoma | ||
| SCCIS:squamous cell carcinoma in situ |
| ∗log2FC in expression of this searched gene in stem-like cells from each diseased tissue sample relative to stem-like cells in normal samples in each tissue plotted against the malignancy continuum. Samples are colored based on if they are from different disease stage. |
Top |
Malignant transformation related pathway analysis |
| Find out the enriched GO biological processes and KEGG pathways involved in transition from healthy to precancer to cancer |
| Tissue | Disease Stage | Enriched GO biological Processes |
| Colorectum | AD |  |
| Colorectum | SER |  |
| Colorectum | MSS |  |
| Colorectum | MSI-H |  |
| Colorectum | FAP |  |
| ∗Top 15 enriched GO BP terms are showed in the bar plot of each disease state in each tissue. Each row represents a significant GO biological process which is colored according to the -log10(p.adjust). |
| Page: 1 2 3 4 5 6 7 8 9 |
| GO ID | Tissue | Disease Stage | Description | Gene Ratio | Bg Ratio | pvalue | p.adjust | Count |
| GO:00309003 | Cervix | CC | forebrain development | 64/2311 | 379/18723 | 5.53e-03 | 3.19e-02 | 64 |
| GO:0030900 | Colorectum | FAP | forebrain development | 70/2622 | 379/18723 | 8.64e-03 | 4.98e-02 | 70 |
| GO:00309001 | Colorectum | CRC | forebrain development | 66/2078 | 379/18723 | 1.36e-04 | 2.57e-03 | 66 |
| GO:0021879 | Colorectum | CRC | forebrain neuron differentiation | 12/2078 | 42/18723 | 1.55e-03 | 1.63e-02 | 12 |
| GO:0021537 | Colorectum | CRC | telencephalon development | 43/2078 | 248/18723 | 2.01e-03 | 2.01e-02 | 43 |
| GO:0021872 | Colorectum | CRC | forebrain generation of neurons | 13/2078 | 51/18723 | 3.09e-03 | 2.73e-02 | 13 |
| GO:0021953 | Colorectum | CRC | central nervous system neuron differentiation | 29/2078 | 162/18723 | 6.36e-03 | 4.62e-02 | 29 |
| GO:00309002 | Lung | IAC | forebrain development | 61/2061 | 379/18723 | 1.52e-03 | 1.61e-02 | 61 |
| GO:003090011 | Lung | AIS | forebrain development | 55/1849 | 379/18723 | 2.37e-03 | 2.48e-02 | 55 |
| GO:00309005 | Oral cavity | EOLP | forebrain development | 68/2218 | 379/18723 | 2.97e-04 | 2.79e-03 | 68 |
| GO:003090013 | Oral cavity | NEOLP | forebrain development | 67/2005 | 379/18723 | 2.54e-05 | 3.99e-04 | 67 |
| GO:00219532 | Oral cavity | NEOLP | central nervous system neuron differentiation | 30/2005 | 162/18723 | 1.96e-03 | 1.32e-02 | 30 |
| GO:00215371 | Oral cavity | NEOLP | telencephalon development | 40/2005 | 248/18723 | 5.50e-03 | 2.93e-02 | 40 |
| GO:00309004 | Prostate | BPH | forebrain development | 80/3107 | 379/18723 | 1.19e-02 | 4.82e-02 | 80 |
| GO:003090012 | Prostate | Tumor | forebrain development | 86/3246 | 379/18723 | 4.22e-03 | 2.11e-02 | 86 |
| GO:00309006 | Skin | AK | forebrain development | 66/1910 | 379/18723 | 1.02e-05 | 2.17e-04 | 66 |
| GO:00215372 | Skin | AK | telencephalon development | 42/1910 | 248/18723 | 7.04e-04 | 6.01e-03 | 42 |
| GO:003090014 | Skin | SCCIS | forebrain development | 34/919 | 379/18723 | 5.35e-04 | 8.26e-03 | 34 |
| GO:002153711 | Skin | SCCIS | telencephalon development | 23/919 | 248/18723 | 2.63e-03 | 2.48e-02 | 23 |
| Page: 1 |
| Pathway ID | Tissue | Disease Stage | Description | Gene Ratio | Bg Ratio | pvalue | p.adjust | qvalue | Count |
| Page: 1 |
Top |
Cell-cell communication analysis |
| Identification of potential cell-cell interactions between two cell types and their ligand-receptor pairs for different disease states |
| Ligand | Receptor | LRpair | Pathway | Tissue | Disease Stage |
| Page: 1 |
Top |
Single-cell gene regulatory network inference analysis |
| Find out the significant the regulons (TFs) and the target genes of each regulon across cell types for different disease states |
| TF | Cell Type | Tissue | Disease Stage | Target Gene | RSS | Regulon Activity |
| ∗The dot plots of a searched regulon are shown for all cell subpopulations in each disease state of each tissue based on the regulon specific score inferred using pySCENIC and by calculating the average expression. |
| Page: 1 |
Top |
Somatic mutation of malignant transformation related genes |
| Annotation of somatic variants for genes involved in malignant transformation |
| Hugo Symbol | Variant Class | Variant Classification | dbSNP RS | HGVSc | HGVSp | HGVSp Short | SWISSPROT | BIOTYPE | SIFT | PolyPhen | Tumor Sample Barcode | Tissue | Histology | Sex | Age | Stage | Therapy Types | Drugs | Outcome |
| ZSWIM6 | SNV | Missense_Mutation | novel | c.1558N>C | p.Glu520Gln | p.E520Q | Q9HCJ5 | protein_coding | tolerated(0.22) | possibly_damaging(0.852) | TCGA-3C-AALI-01 | Breast | breast invasive carcinoma | Female | <65 | I/II | Unspecific | Poly E | Complete Response |
| ZSWIM6 | SNV | Missense_Mutation | rs752185820 | c.3197N>C | p.His1066Pro | p.H1066P | Q9HCJ5 | protein_coding | deleterious(0) | probably_damaging(0.999) | TCGA-A2-A1G0-01 | Breast | breast invasive carcinoma | Female | <65 | I/II | Chemotherapy | taxotere | SD |
| ZSWIM6 | SNV | Missense_Mutation | novel | c.1030N>A | p.His344Asn | p.H344N | Q9HCJ5 | protein_coding | tolerated(0.16) | benign(0.03) | TCGA-AN-A046-01 | Breast | breast invasive carcinoma | Female | >=65 | I/II | Unknown | Unknown | SD |
| ZSWIM6 | SNV | Missense_Mutation | rs754512309 | c.2040N>A | p.Phe680Leu | p.F680L | Q9HCJ5 | protein_coding | tolerated(0.75) | benign(0.003) | TCGA-AN-A046-01 | Breast | breast invasive carcinoma | Female | >=65 | I/II | Unknown | Unknown | SD |
| ZSWIM6 | SNV | Missense_Mutation | c.741C>A | p.Asn247Lys | p.N247K | Q9HCJ5 | protein_coding | tolerated(1) | benign(0.015) | TCGA-AN-A0FW-01 | Breast | breast invasive carcinoma | Female | >=65 | III/IV | Unknown | Unknown | SD | |
| ZSWIM6 | SNV | Missense_Mutation | rs752185820 | c.3197A>C | p.His1066Pro | p.H1066P | Q9HCJ5 | protein_coding | deleterious(0) | probably_damaging(0.999) | TCGA-AR-A255-01 | Breast | breast invasive carcinoma | Female | <65 | I/II | Targeted Molecular therapy | trastuzumab | SD |
| ZSWIM6 | SNV | Missense_Mutation | rs752185820 | c.3197N>C | p.His1066Pro | p.H1066P | Q9HCJ5 | protein_coding | deleterious(0) | probably_damaging(0.999) | TCGA-B6-A0I5-01 | Breast | breast invasive carcinoma | Female | <65 | I/II | Unknown | Unknown | SD |
| ZSWIM6 | SNV | Missense_Mutation | rs752185820 | c.3197N>C | p.His1066Pro | p.H1066P | Q9HCJ5 | protein_coding | deleterious(0) | probably_damaging(0.999) | TCGA-BH-A0HO-01 | Breast | breast invasive carcinoma | Female | <65 | I/II | Chemotherapy | cyclophosphamide | SD |
| ZSWIM6 | SNV | Missense_Mutation | c.1813N>C | p.Glu605Gln | p.E605Q | Q9HCJ5 | protein_coding | deleterious(0.02) | possibly_damaging(0.617) | TCGA-BH-A1F8-01 | Breast | breast invasive carcinoma | Female | >=65 | III/IV | Unknown | Unknown | PD | |
| ZSWIM6 | SNV | Missense_Mutation | rs752185820 | c.3197A>C | p.His1066Pro | p.H1066P | Q9HCJ5 | protein_coding | deleterious(0) | probably_damaging(0.999) | TCGA-BH-A1FR-01 | Breast | breast invasive carcinoma | Female | >=65 | III/IV | Unknown | Unknown | PD |
| Page: 1 2 3 4 5 6 7 8 9 |
Top |
Related drugs of malignant transformation related genes |
| Identification of chemicals and drugs interact with genes involved in malignant transfromation |
| (DGIdb 4.0) |
| Entrez ID | Symbol | Category | Interaction Types | Drug Claim Name | Drug Name | PMIDs |
| Page: 1 |

Copyright 2023-Present -The University of Texas Health Science Center at Houston |