
|
|||||
|
 | |
| |
| |
| |
| |
| |
|
Gene: ZSCAN31 |
Gene summary for ZSCAN31 |
| Gene information | Species | Human | Gene symbol | ZSCAN31 | Gene ID | 64288 |
| Gene name | zinc finger and SCAN domain containing 31 | |
| Gene Alias | ZNF20-Lp | |
| Cytomap | 6p22.1 | |
| Gene Type | protein-coding | GO ID | GO:0006139 | UniProtAcc | A0A024RCL4 |
Top |
Malignant transformation analysis |
| Identification of the aberrant gene expression in precancerous and cancerous lesions by comparing the gene expression of stem-like cells in diseased tissues with normal stem cells |
| Entrez ID | Symbol | Replicates | Species | Organ | Tissue | Adj P-value | Log2FC | Malignancy |
| 64288 | ZSCAN31 | LZE2T | Human | Esophagus | ESCC | 4.73e-03 | 2.95e-01 | 0.082 |
| 64288 | ZSCAN31 | LZE4T | Human | Esophagus | ESCC | 9.56e-12 | 4.35e-01 | 0.0811 |
| 64288 | ZSCAN31 | LZE7T | Human | Esophagus | ESCC | 1.62e-04 | 2.35e-01 | 0.0667 |
| 64288 | ZSCAN31 | LZE20T | Human | Esophagus | ESCC | 7.90e-04 | 1.40e-01 | 0.0662 |
| 64288 | ZSCAN31 | LZE24T | Human | Esophagus | ESCC | 1.48e-08 | 2.59e-01 | 0.0596 |
| 64288 | ZSCAN31 | LZE21T | Human | Esophagus | ESCC | 8.02e-04 | 2.40e-01 | 0.0655 |
| 64288 | ZSCAN31 | P1T-E | Human | Esophagus | ESCC | 1.64e-05 | 2.46e-01 | 0.0875 |
| 64288 | ZSCAN31 | P2T-E | Human | Esophagus | ESCC | 1.34e-03 | 1.63e-01 | 0.1177 |
| 64288 | ZSCAN31 | P4T-E | Human | Esophagus | ESCC | 1.06e-14 | 3.90e-01 | 0.1323 |
| 64288 | ZSCAN31 | P5T-E | Human | Esophagus | ESCC | 3.90e-06 | 1.20e-01 | 0.1327 |
| 64288 | ZSCAN31 | P8T-E | Human | Esophagus | ESCC | 6.84e-07 | 6.73e-02 | 0.0889 |
| 64288 | ZSCAN31 | P9T-E | Human | Esophagus | ESCC | 1.08e-07 | 1.95e-01 | 0.1131 |
| 64288 | ZSCAN31 | P10T-E | Human | Esophagus | ESCC | 6.47e-10 | 2.44e-01 | 0.116 |
| 64288 | ZSCAN31 | P11T-E | Human | Esophagus | ESCC | 6.74e-09 | 4.40e-01 | 0.1426 |
| 64288 | ZSCAN31 | P12T-E | Human | Esophagus | ESCC | 2.02e-06 | 1.85e-01 | 0.1122 |
| 64288 | ZSCAN31 | P15T-E | Human | Esophagus | ESCC | 5.63e-18 | 3.87e-01 | 0.1149 |
| 64288 | ZSCAN31 | P16T-E | Human | Esophagus | ESCC | 2.31e-02 | 5.93e-02 | 0.1153 |
| 64288 | ZSCAN31 | P20T-E | Human | Esophagus | ESCC | 2.18e-13 | 3.17e-01 | 0.1124 |
| 64288 | ZSCAN31 | P21T-E | Human | Esophagus | ESCC | 5.71e-08 | 2.01e-01 | 0.1617 |
| 64288 | ZSCAN31 | P22T-E | Human | Esophagus | ESCC | 1.19e-21 | 5.45e-01 | 0.1236 |
| Page: 1 2 3 |
| Tissue | Expression Dynamics | Abbreviation |
| Esophagus | 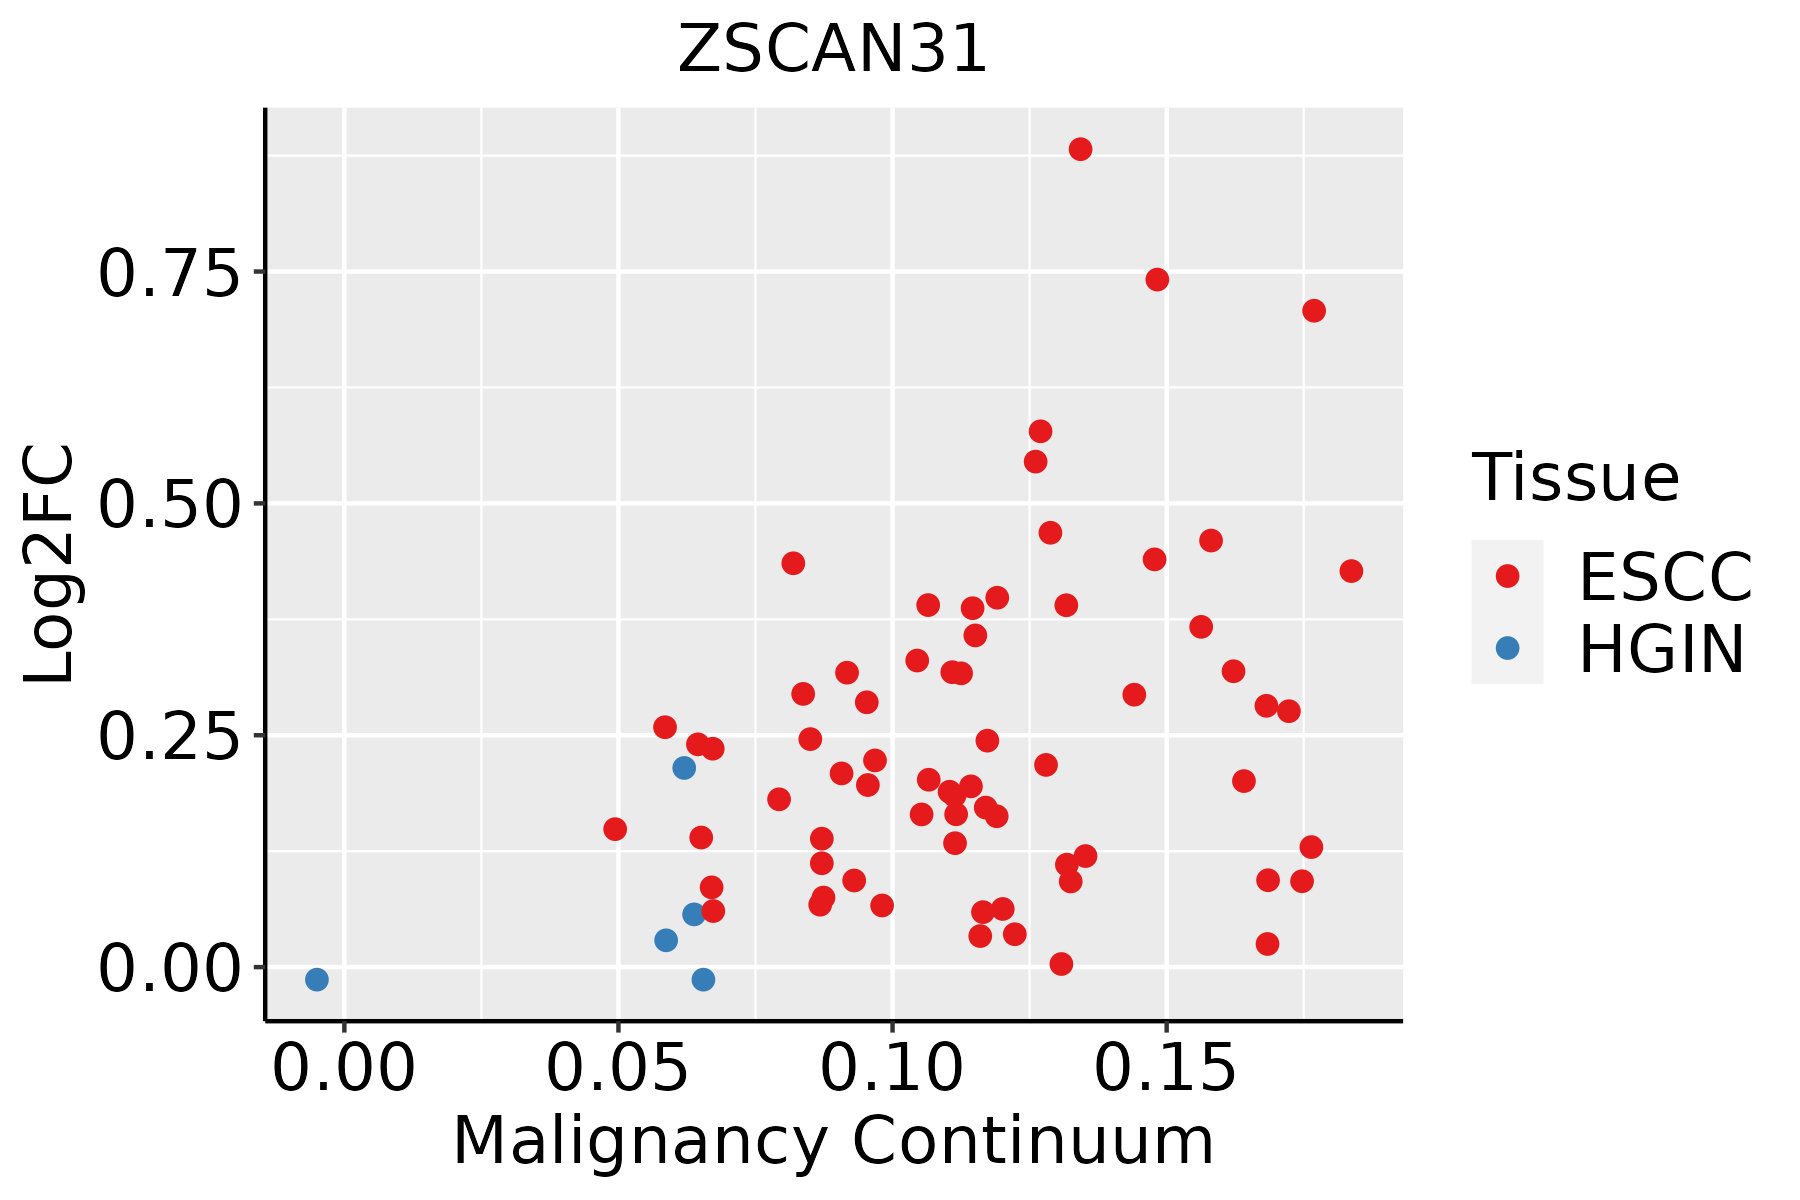 | ESCC: Esophageal squamous cell carcinoma |
| HGIN: High-grade intraepithelial neoplasias | ||
| LGIN: Low-grade intraepithelial neoplasias | ||
| Liver | 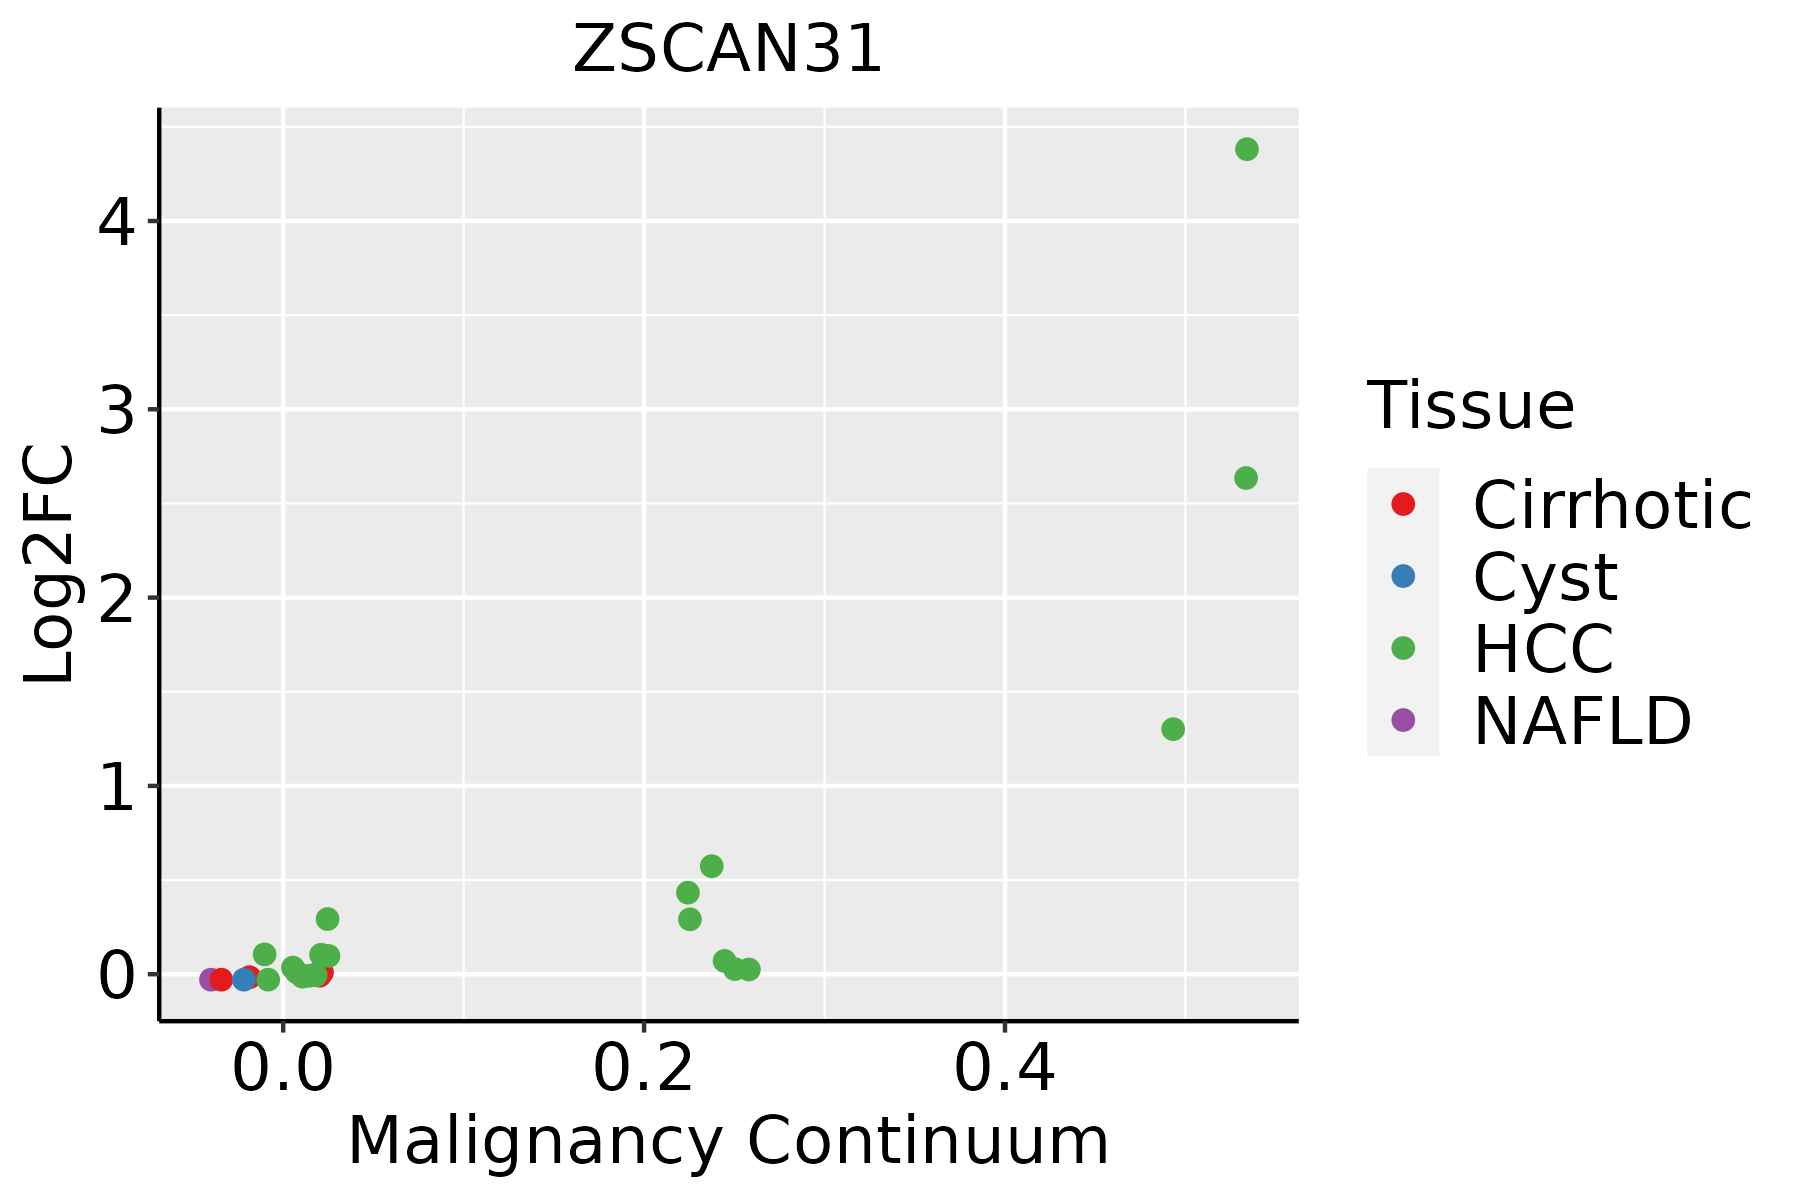 | HCC: Hepatocellular carcinoma |
| NAFLD: Non-alcoholic fatty liver disease |
| ∗log2FC in expression of this searched gene in stem-like cells from each diseased tissue sample relative to stem-like cells in normal samples in each tissue plotted against the malignancy continuum. Samples are colored based on if they are from different disease stage. |
Top |
Malignant transformation related pathway analysis |
| Find out the enriched GO biological processes and KEGG pathways involved in transition from healthy to precancer to cancer |
| Tissue | Disease Stage | Enriched GO biological Processes |
| Colorectum | AD |  |
| Colorectum | SER |  |
| Colorectum | MSS |  |
| Colorectum | MSI-H |  |
| Colorectum | FAP |  |
| ∗Top 15 enriched GO BP terms are showed in the bar plot of each disease state in each tissue. Each row represents a significant GO biological process which is colored according to the -log10(p.adjust). |
| Page: 1 2 3 4 5 6 7 8 9 |
| GO ID | Tissue | Disease Stage | Description | Gene Ratio | Bg Ratio | pvalue | p.adjust | Count |
| Page: 1 |
| Pathway ID | Tissue | Disease Stage | Description | Gene Ratio | Bg Ratio | pvalue | p.adjust | qvalue | Count |
| Page: 1 |
Top |
Cell-cell communication analysis |
| Identification of potential cell-cell interactions between two cell types and their ligand-receptor pairs for different disease states |
| Ligand | Receptor | LRpair | Pathway | Tissue | Disease Stage |
| Page: 1 |
Top |
Single-cell gene regulatory network inference analysis |
| Find out the significant the regulons (TFs) and the target genes of each regulon across cell types for different disease states |
| TF | Cell Type | Tissue | Disease Stage | Target Gene | RSS | Regulon Activity |
| ZSCAN31 | TRANS | Esophagus | Healthy | PSMB3,NHP2,COL6A2, etc. | 2.16e-01 |  |
| ∗The dot plots of a searched regulon are shown for all cell subpopulations in each disease state of each tissue based on the regulon specific score inferred using pySCENIC and by calculating the average expression. |
| Page: 1 |
Top |
Somatic mutation of malignant transformation related genes |
| Annotation of somatic variants for genes involved in malignant transformation |
| Hugo Symbol | Variant Class | Variant Classification | dbSNP RS | HGVSc | HGVSp | HGVSp Short | SWISSPROT | BIOTYPE | SIFT | PolyPhen | Tumor Sample Barcode | Tissue | Histology | Sex | Age | Stage | Therapy Types | Drugs | Outcome |
| ZSCAN31 | SNV | Missense_Mutation | c.1193N>G | p.Gln398Arg | p.Q398R | Q96LW9 | protein_coding | deleterious(0) | benign(0.017) | TCGA-BH-A18G-01 | Breast | breast invasive carcinoma | Female | >=65 | I/II | Unknown | Unknown | SD | |
| ZSCAN31 | insertion | Frame_Shift_Ins | novel | c.1156_1157insC | p.Lys386ThrfsTer4 | p.K386Tfs*4 | Q96LW9 | protein_coding | TCGA-A8-A07P-01 | Breast | breast invasive carcinoma | Female | >=65 | I/II | Chemotherapy | 5-fluorouracil | SD | ||
| ZSCAN31 | insertion | Nonsense_Mutation | novel | c.1155_1156insTATCTAAATGCTGCTATGCTATAGTCTCCCCACCTGTAAA | p.Lys386TyrfsTer8 | p.K386Yfs*8 | Q96LW9 | protein_coding | TCGA-A8-A07P-01 | Breast | breast invasive carcinoma | Female | >=65 | I/II | Chemotherapy | 5-fluorouracil | SD | ||
| ZSCAN31 | SNV | Missense_Mutation | c.1075N>T | p.Ala359Ser | p.A359S | Q96LW9 | protein_coding | tolerated(0.29) | benign(0.268) | TCGA-A6-3809-01 | Colorectum | colon adenocarcinoma | Female | >=65 | I/II | Unknown | Unknown | SD | |
| ZSCAN31 | SNV | Missense_Mutation | c.1105N>A | p.His369Asn | p.H369N | Q96LW9 | protein_coding | deleterious(0) | probably_damaging(1) | TCGA-AA-3663-01 | Colorectum | colon adenocarcinoma | Male | <65 | I/II | Unknown | Unknown | SD | |
| ZSCAN31 | SNV | Missense_Mutation | rs760495522 | c.25N>A | p.Asp9Asn | p.D9N | Q96LW9 | protein_coding | tolerated(0.27) | benign(0.007) | TCGA-AA-A010-01 | Colorectum | colon adenocarcinoma | Female | <65 | I/II | Chemotherapy | folinic | CR |
| ZSCAN31 | SNV | Missense_Mutation | rs768839187 | c.298N>T | p.Arg100Trp | p.R100W | Q96LW9 | protein_coding | deleterious(0) | benign(0.003) | TCGA-AA-A02O-01 | Colorectum | colon adenocarcinoma | Male | >=65 | I/II | Unknown | Unknown | SD |
| ZSCAN31 | SNV | Missense_Mutation | novel | c.848A>T | p.Asn283Ile | p.N283I | Q96LW9 | protein_coding | tolerated(1) | benign(0.003) | TCGA-AM-5820-01 | Colorectum | colon adenocarcinoma | Female | <65 | I/II | Unknown | Unknown | SD |
| ZSCAN31 | SNV | Missense_Mutation | rs768839187 | c.298C>T | p.Arg100Trp | p.R100W | Q96LW9 | protein_coding | deleterious(0) | benign(0.003) | TCGA-AZ-6601-01 | Colorectum | colon adenocarcinoma | Male | >=65 | I/II | Unknown | Unknown | PD |
| ZSCAN31 | SNV | Missense_Mutation | novel | c.944N>T | p.Arg315Ile | p.R315I | Q96LW9 | protein_coding | deleterious(0) | possibly_damaging(0.825) | TCGA-CA-6717-01 | Colorectum | colon adenocarcinoma | Male | <65 | I/II | Chemotherapy | oxaliplatin | CR |
| Page: 1 2 3 4 5 |
Top |
Related drugs of malignant transformation related genes |
| Identification of chemicals and drugs interact with genes involved in malignant transfromation |
| (DGIdb 4.0) |
| Entrez ID | Symbol | Category | Interaction Types | Drug Claim Name | Drug Name | PMIDs |
| Page: 1 |

Copyright 2023-Present -The University of Texas Health Science Center at Houston |