
|
|||||
|
 | |
| |
| |
| |
| |
| |
|
Gene: ZSCAN25 |
Gene summary for ZSCAN25 |
| Gene information | Species | Human | Gene symbol | ZSCAN25 | Gene ID | 221785 |
| Gene name | zinc finger and SCAN domain containing 25 | |
| Gene Alias | ZNF498 | |
| Cytomap | 7q22.1 | |
| Gene Type | protein-coding | GO ID | GO:0006139 | UniProtAcc | Q6NSZ9 |
Top |
Malignant transformation analysis |
| Identification of the aberrant gene expression in precancerous and cancerous lesions by comparing the gene expression of stem-like cells in diseased tissues with normal stem cells |
| Entrez ID | Symbol | Replicates | Species | Organ | Tissue | Adj P-value | Log2FC | Malignancy |
| 221785 | ZSCAN25 | LZE24T | Human | Esophagus | ESCC | 7.97e-05 | 1.01e-01 | 0.0596 |
| 221785 | ZSCAN25 | P2T-E | Human | Esophagus | ESCC | 7.73e-13 | 2.09e-01 | 0.1177 |
| 221785 | ZSCAN25 | P4T-E | Human | Esophagus | ESCC | 2.37e-09 | 1.43e-01 | 0.1323 |
| 221785 | ZSCAN25 | P5T-E | Human | Esophagus | ESCC | 3.73e-02 | 4.96e-02 | 0.1327 |
| 221785 | ZSCAN25 | P8T-E | Human | Esophagus | ESCC | 1.93e-17 | 9.47e-02 | 0.0889 |
| 221785 | ZSCAN25 | P10T-E | Human | Esophagus | ESCC | 3.55e-17 | 1.78e-01 | 0.116 |
| 221785 | ZSCAN25 | P11T-E | Human | Esophagus | ESCC | 1.20e-02 | 1.66e-01 | 0.1426 |
| 221785 | ZSCAN25 | P12T-E | Human | Esophagus | ESCC | 1.43e-17 | 2.24e-01 | 0.1122 |
| 221785 | ZSCAN25 | P15T-E | Human | Esophagus | ESCC | 7.13e-10 | 2.47e-01 | 0.1149 |
| 221785 | ZSCAN25 | P16T-E | Human | Esophagus | ESCC | 8.32e-23 | 2.56e-01 | 0.1153 |
| 221785 | ZSCAN25 | P20T-E | Human | Esophagus | ESCC | 1.39e-19 | 4.05e-01 | 0.1124 |
| 221785 | ZSCAN25 | P21T-E | Human | Esophagus | ESCC | 1.35e-08 | 9.40e-02 | 0.1617 |
| 221785 | ZSCAN25 | P22T-E | Human | Esophagus | ESCC | 1.18e-10 | 8.37e-02 | 0.1236 |
| 221785 | ZSCAN25 | P23T-E | Human | Esophagus | ESCC | 1.66e-07 | 3.16e-01 | 0.108 |
| 221785 | ZSCAN25 | P24T-E | Human | Esophagus | ESCC | 3.44e-02 | 2.32e-02 | 0.1287 |
| 221785 | ZSCAN25 | P26T-E | Human | Esophagus | ESCC | 1.61e-18 | 1.74e-01 | 0.1276 |
| 221785 | ZSCAN25 | P27T-E | Human | Esophagus | ESCC | 2.19e-15 | 1.68e-01 | 0.1055 |
| 221785 | ZSCAN25 | P28T-E | Human | Esophagus | ESCC | 7.70e-05 | 8.90e-02 | 0.1149 |
| 221785 | ZSCAN25 | P31T-E | Human | Esophagus | ESCC | 9.90e-05 | 5.76e-02 | 0.1251 |
| 221785 | ZSCAN25 | P32T-E | Human | Esophagus | ESCC | 2.87e-12 | 1.19e-01 | 0.1666 |
| Page: 1 2 3 |
| Tissue | Expression Dynamics | Abbreviation |
| Esophagus | 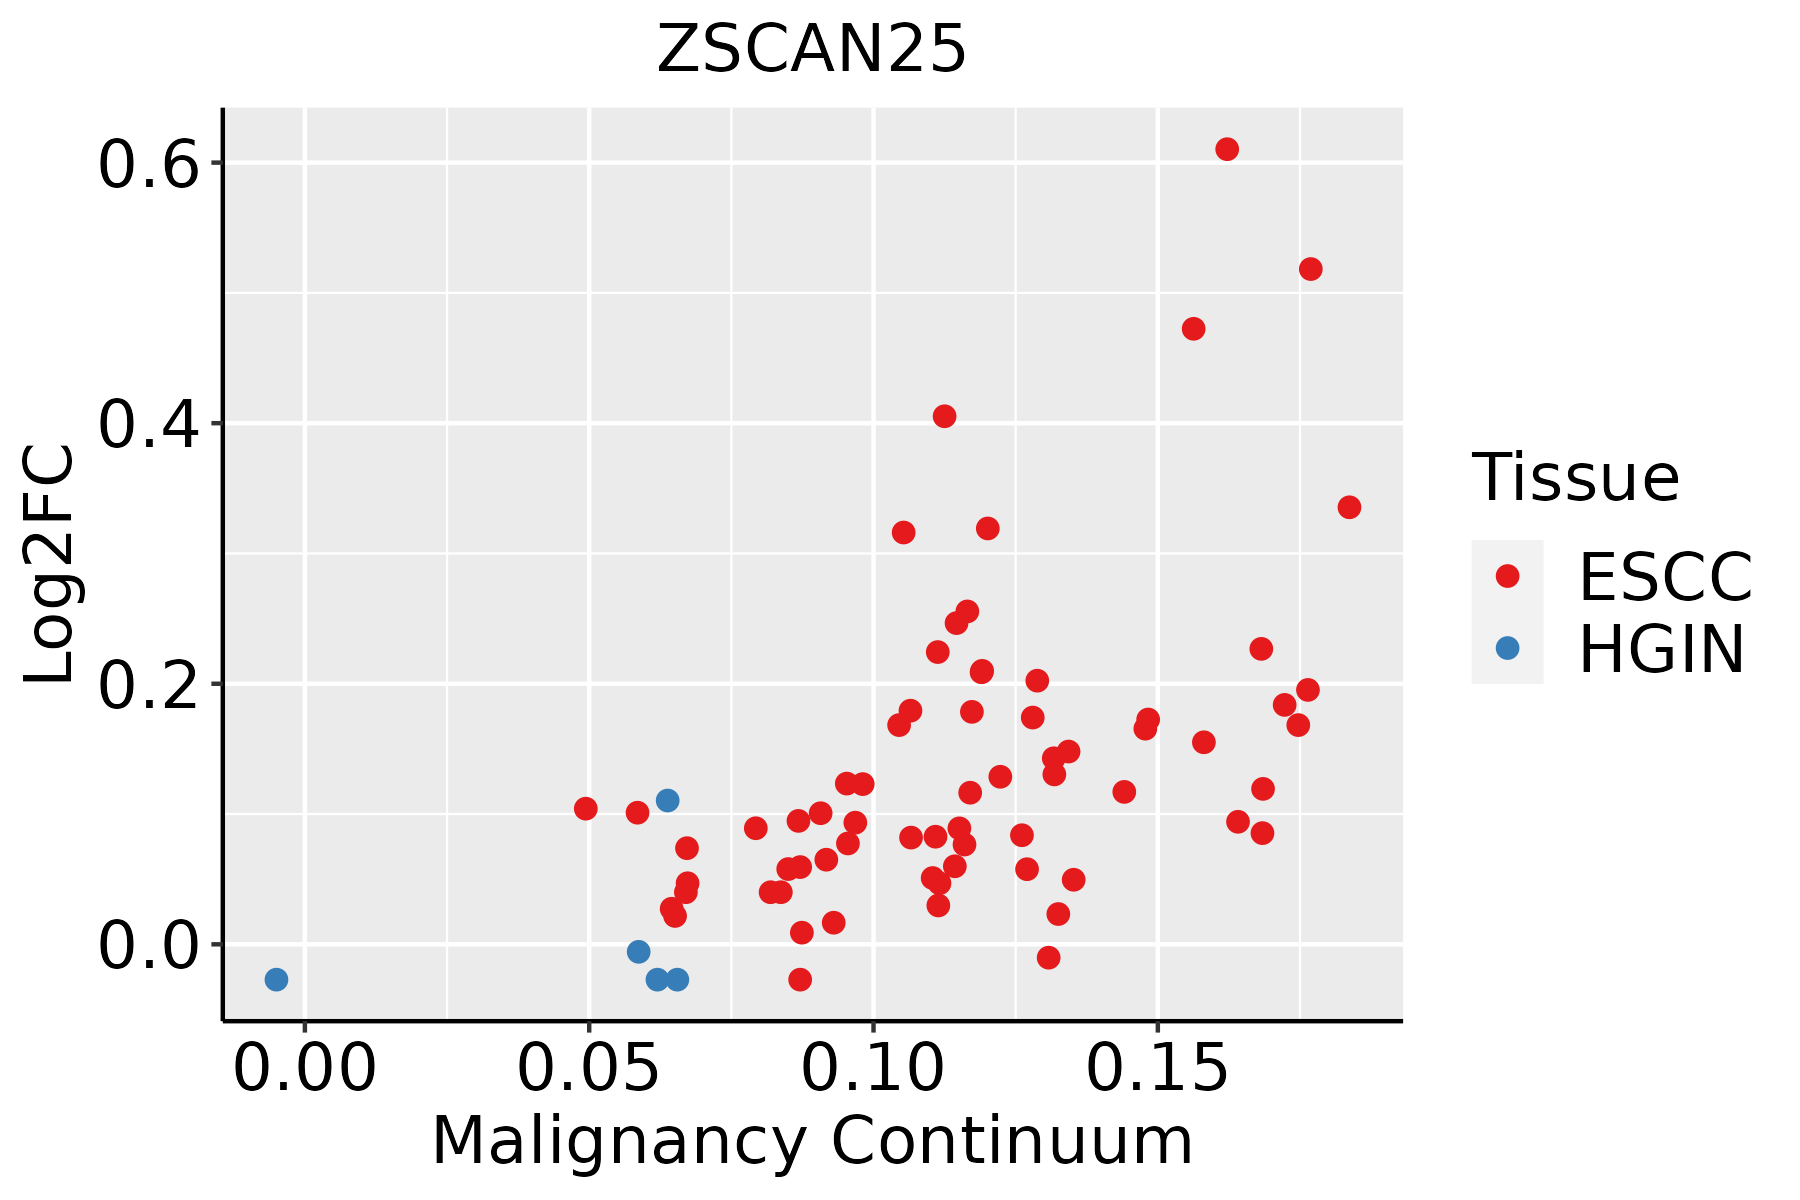 | ESCC: Esophageal squamous cell carcinoma |
| HGIN: High-grade intraepithelial neoplasias | ||
| LGIN: Low-grade intraepithelial neoplasias |
| ∗log2FC in expression of this searched gene in stem-like cells from each diseased tissue sample relative to stem-like cells in normal samples in each tissue plotted against the malignancy continuum. Samples are colored based on if they are from different disease stage. |
Top |
Malignant transformation related pathway analysis |
| Find out the enriched GO biological processes and KEGG pathways involved in transition from healthy to precancer to cancer |
| Tissue | Disease Stage | Enriched GO biological Processes |
| Colorectum | AD |  |
| Colorectum | SER |  |
| Colorectum | MSS |  |
| Colorectum | MSI-H |  |
| Colorectum | FAP |  |
| ∗Top 15 enriched GO BP terms are showed in the bar plot of each disease state in each tissue. Each row represents a significant GO biological process which is colored according to the -log10(p.adjust). |
| Page: 1 2 3 4 5 6 7 8 9 |
| GO ID | Tissue | Disease Stage | Description | Gene Ratio | Bg Ratio | pvalue | p.adjust | Count |
| Page: 1 |
| Pathway ID | Tissue | Disease Stage | Description | Gene Ratio | Bg Ratio | pvalue | p.adjust | qvalue | Count |
| Page: 1 |
Top |
Cell-cell communication analysis |
| Identification of potential cell-cell interactions between two cell types and their ligand-receptor pairs for different disease states |
| Ligand | Receptor | LRpair | Pathway | Tissue | Disease Stage |
| Page: 1 |
Top |
Single-cell gene regulatory network inference analysis |
| Find out the significant the regulons (TFs) and the target genes of each regulon across cell types for different disease states |
| TF | Cell Type | Tissue | Disease Stage | Target Gene | RSS | Regulon Activity |
| ∗The dot plots of a searched regulon are shown for all cell subpopulations in each disease state of each tissue based on the regulon specific score inferred using pySCENIC and by calculating the average expression. |
| Page: 1 |
Top |
Somatic mutation of malignant transformation related genes |
| Annotation of somatic variants for genes involved in malignant transformation |
| Hugo Symbol | Variant Class | Variant Classification | dbSNP RS | HGVSc | HGVSp | HGVSp Short | SWISSPROT | BIOTYPE | SIFT | PolyPhen | Tumor Sample Barcode | Tissue | Histology | Sex | Age | Stage | Therapy Types | Drugs | Outcome |
| ZSCAN25 | SNV | Missense_Mutation | c.601N>G | p.Leu201Val | p.L201V | Q6NSZ9 | protein_coding | tolerated(0.17) | probably_damaging(0.967) | TCGA-AC-A23H-01 | Breast | breast invasive carcinoma | Female | >=65 | I/II | Unknown | Unknown | PD | |
| ZSCAN25 | SNV | Missense_Mutation | rs745830286 | c.1505N>G | p.Val502Gly | p.V502G | Q6NSZ9 | protein_coding | deleterious(0) | possibly_damaging(0.676) | TCGA-AO-A0JA-01 | Breast | breast invasive carcinoma | Female | <65 | III/IV | Hormone Therapy | leuprolide | SD |
| ZSCAN25 | SNV | Missense_Mutation | novel | c.1512N>G | p.His504Gln | p.H504Q | Q6NSZ9 | protein_coding | deleterious(0) | probably_damaging(0.999) | TCGA-GM-A5PV-01 | Breast | breast invasive carcinoma | Female | <65 | I/II | Chemotherapy | taxotere | CR |
| ZSCAN25 | deletion | Frame_Shift_Del | novel | c.971delN | p.Pro325LeufsTer62 | p.P325Lfs*62 | Q6NSZ9 | protein_coding | TCGA-EW-A2FV-01 | Breast | breast invasive carcinoma | Female | <65 | III/IV | Chemotherapy | docetaxel | SD | ||
| ZSCAN25 | SNV | Missense_Mutation | c.908G>A | p.Gly303Asp | p.G303D | Q6NSZ9 | protein_coding | tolerated(0.52) | benign(0.034) | TCGA-AA-3492-01 | Colorectum | colon adenocarcinoma | Female | >=65 | I/II | Unknown | Unknown | SD | |
| ZSCAN25 | SNV | Missense_Mutation | c.1103N>A | p.Arg368Gln | p.R368Q | Q6NSZ9 | protein_coding | tolerated(0.06) | possibly_damaging(0.764) | TCGA-CA-6718-01 | Colorectum | colon adenocarcinoma | Male | <65 | I/II | Unknown | Unknown | PD | |
| ZSCAN25 | SNV | Missense_Mutation | c.1403G>A | p.Ser468Asn | p.S468N | Q6NSZ9 | protein_coding | tolerated(0.22) | possibly_damaging(0.473) | TCGA-F4-6570-01 | Colorectum | colon adenocarcinoma | Female | >=65 | I/II | Unknown | Unknown | SD | |
| ZSCAN25 | SNV | Missense_Mutation | c.1498C>T | p.Arg500Trp | p.R500W | Q6NSZ9 | protein_coding | deleterious(0.03) | probably_damaging(0.958) | TCGA-G4-6588-01 | Colorectum | colon adenocarcinoma | Female | <65 | I/II | Unknown | Unknown | SD | |
| ZSCAN25 | SNV | Missense_Mutation | rs755130158 | c.1009G>A | p.Glu337Lys | p.E337K | Q6NSZ9 | protein_coding | tolerated(0.58) | benign(0.012) | TCGA-AG-A002-01 | Colorectum | rectum adenocarcinoma | Male | <65 | I/II | Unknown | Unknown | SD |
| ZSCAN25 | SNV | Missense_Mutation | rs761704567 | c.1090N>A | p.Val364Ile | p.V364I | Q6NSZ9 | protein_coding | tolerated(1) | possibly_damaging(0.616) | TCGA-AG-A02X-01 | Colorectum | rectum adenocarcinoma | Male | >=65 | I/II | Unknown | Unknown | SD |
| Page: 1 2 3 4 5 6 |
Top |
Related drugs of malignant transformation related genes |
| Identification of chemicals and drugs interact with genes involved in malignant transfromation |
| (DGIdb 4.0) |
| Entrez ID | Symbol | Category | Interaction Types | Drug Claim Name | Drug Name | PMIDs |
| 221785 | ZSCAN25 | NA | lumefantrine | LUMEFANTRINE | ||
| 221785 | ZSCAN25 | NA | lopinavir | LOPINAVIR | ||
| 221785 | ZSCAN25 | NA | tacrolimus | TACROLIMUS | 29318894,29454235 |
| Page: 1 |

Copyright 2023-Present -The University of Texas Health Science Center at Houston |