
|
|||||
|
 | |
| |
| |
| |
| |
| |
|
Gene: ZRANB2 |
Gene summary for ZRANB2 |
| Gene information | Species | Human | Gene symbol | ZRANB2 | Gene ID | 9406 |
| Gene name | zinc finger RANBP2-type containing 2 | |
| Gene Alias | ZIS | |
| Cytomap | 1p31.1 | |
| Gene Type | protein-coding | GO ID | GO:0006139 | UniProtAcc | O95218 |
Top |
Malignant transformation analysis |
| Identification of the aberrant gene expression in precancerous and cancerous lesions by comparing the gene expression of stem-like cells in diseased tissues with normal stem cells |
| Entrez ID | Symbol | Replicates | Species | Organ | Tissue | Adj P-value | Log2FC | Malignancy |
| 9406 | ZRANB2 | HTA11_3410_2000001011 | Human | Colorectum | AD | 1.52e-21 | -7.05e-01 | 0.0155 |
| 9406 | ZRANB2 | HTA11_2951_2000001011 | Human | Colorectum | AD | 1.44e-04 | -9.02e-01 | 0.0216 |
| 9406 | ZRANB2 | HTA11_347_2000001011 | Human | Colorectum | AD | 3.06e-14 | 5.77e-01 | -0.1954 |
| 9406 | ZRANB2 | HTA11_3361_2000001011 | Human | Colorectum | AD | 2.26e-04 | -6.25e-01 | -0.1207 |
| 9406 | ZRANB2 | HTA11_696_2000001011 | Human | Colorectum | AD | 1.32e-08 | -4.35e-01 | -0.1464 |
| 9406 | ZRANB2 | HTA11_866_2000001011 | Human | Colorectum | AD | 3.04e-02 | -3.50e-01 | -0.1001 |
| 9406 | ZRANB2 | HTA11_5212_2000001011 | Human | Colorectum | AD | 6.75e-04 | -7.75e-01 | -0.2061 |
| 9406 | ZRANB2 | HTA11_866_3004761011 | Human | Colorectum | AD | 1.06e-10 | -6.68e-01 | 0.096 |
| 9406 | ZRANB2 | HTA11_4255_2000001011 | Human | Colorectum | SER | 4.38e-02 | -6.98e-01 | 0.0446 |
| 9406 | ZRANB2 | HTA11_9408_2000001011 | Human | Colorectum | AD | 2.43e-02 | -8.36e-01 | 0.0451 |
| 9406 | ZRANB2 | HTA11_8622_2000001021 | Human | Colorectum | SER | 6.46e-04 | -7.26e-01 | 0.0528 |
| 9406 | ZRANB2 | HTA11_10711_2000001011 | Human | Colorectum | AD | 7.21e-05 | -5.57e-01 | 0.0338 |
| 9406 | ZRANB2 | HTA11_7696_3000711011 | Human | Colorectum | AD | 4.44e-09 | -4.71e-01 | 0.0674 |
| 9406 | ZRANB2 | HTA11_6818_2000001011 | Human | Colorectum | AD | 5.44e-03 | -6.90e-01 | 0.0112 |
| 9406 | ZRANB2 | HTA11_6818_2000001021 | Human | Colorectum | AD | 4.80e-07 | -7.12e-01 | 0.0588 |
| 9406 | ZRANB2 | HTA11_99999973899_84307 | Human | Colorectum | MSS | 1.07e-03 | -6.10e-01 | 0.2585 |
| 9406 | ZRANB2 | HTA11_99999974143_84620 | Human | Colorectum | MSS | 2.38e-31 | -7.41e-01 | 0.3005 |
| 9406 | ZRANB2 | F007 | Human | Colorectum | FAP | 9.15e-04 | -2.79e-01 | 0.1176 |
| 9406 | ZRANB2 | A002-C-010 | Human | Colorectum | FAP | 7.27e-08 | -2.45e-01 | 0.242 |
| 9406 | ZRANB2 | A001-C-207 | Human | Colorectum | FAP | 1.94e-05 | -2.07e-01 | 0.1278 |
| Page: 1 2 3 4 5 6 7 8 9 10 11 12 |
| Tissue | Expression Dynamics | Abbreviation |
| Colorectum (GSE201348) |  | FAP: Familial adenomatous polyposis |
| CRC: Colorectal cancer | ||
| Colorectum (HTA11) |  | AD: Adenomas |
| SER: Sessile serrated lesions | ||
| MSI-H: Microsatellite-high colorectal cancer | ||
| MSS: Microsatellite stable colorectal cancer | ||
| Endometrium | 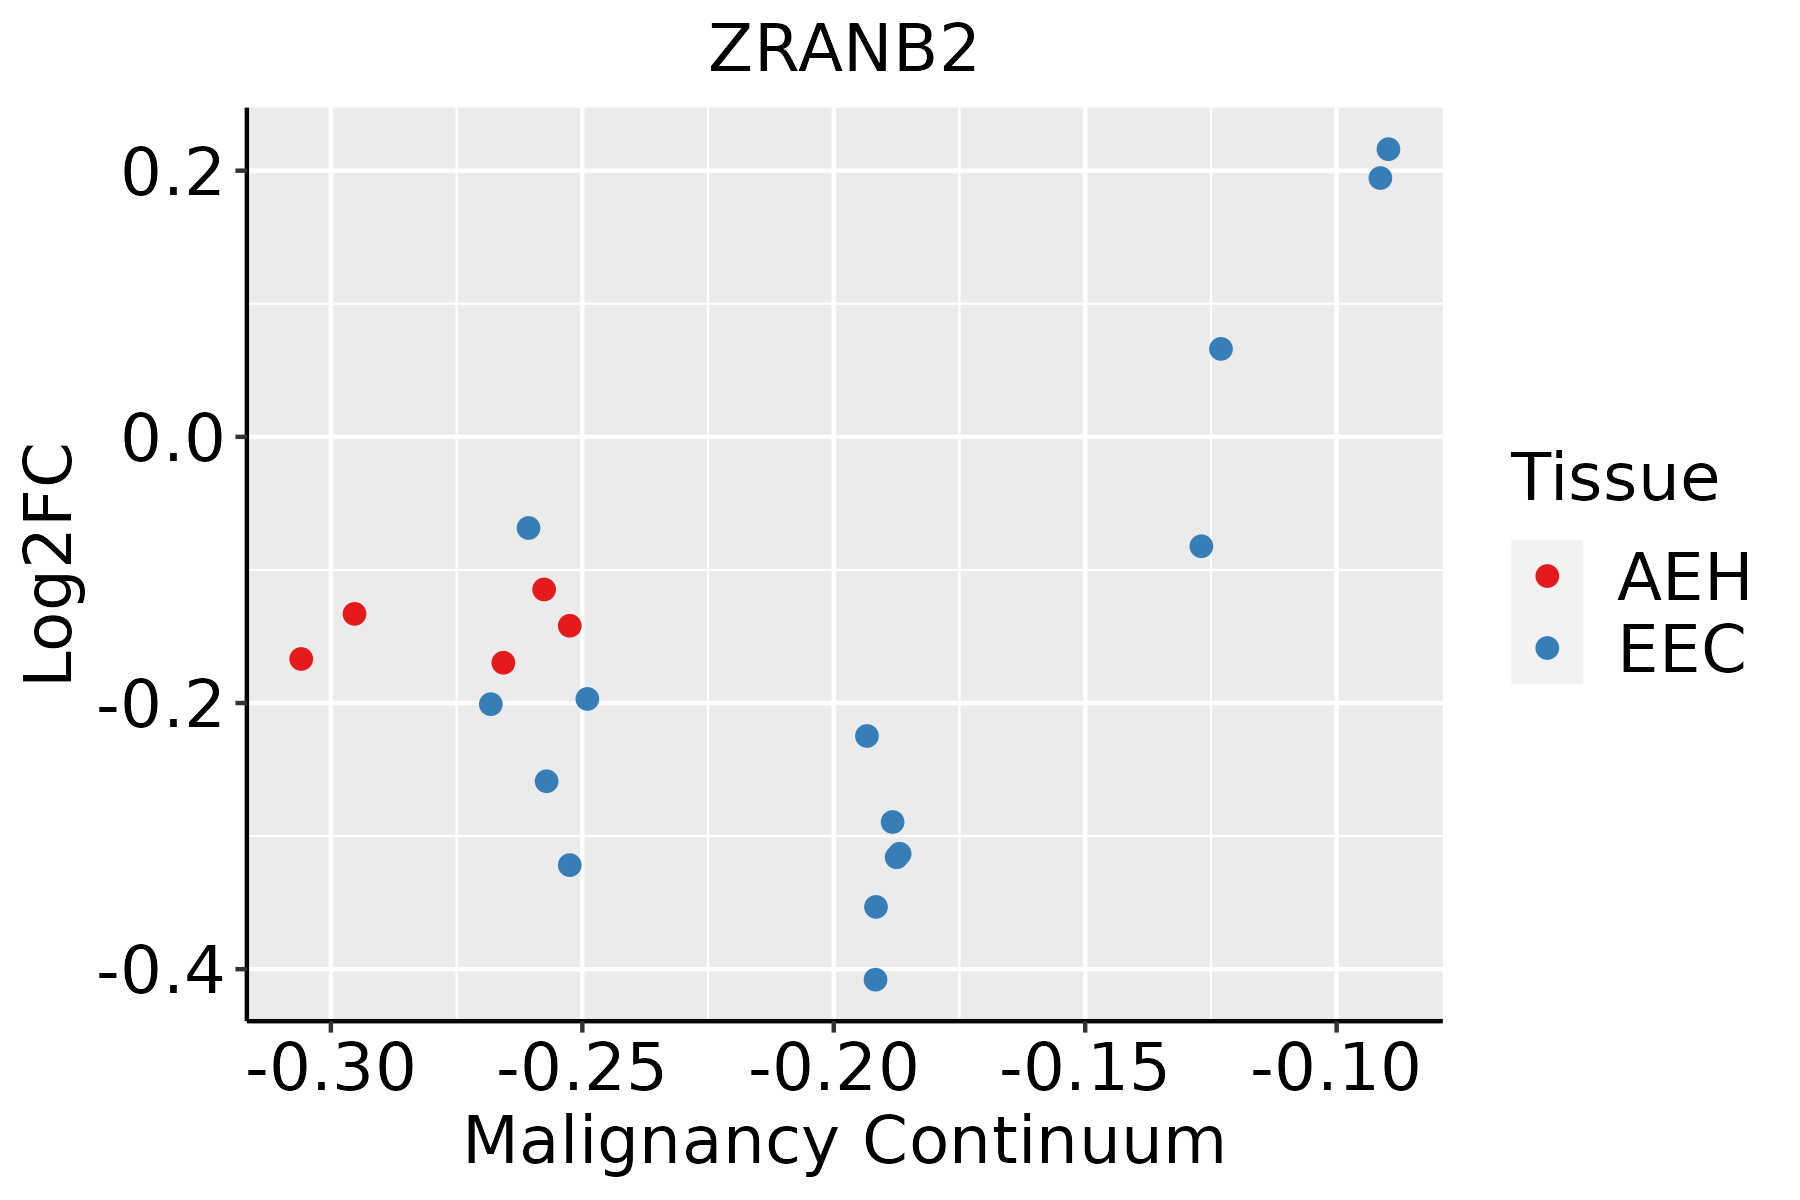 | AEH: Atypical endometrial hyperplasia |
| EEC: Endometrioid Cancer | ||
| Esophagus | 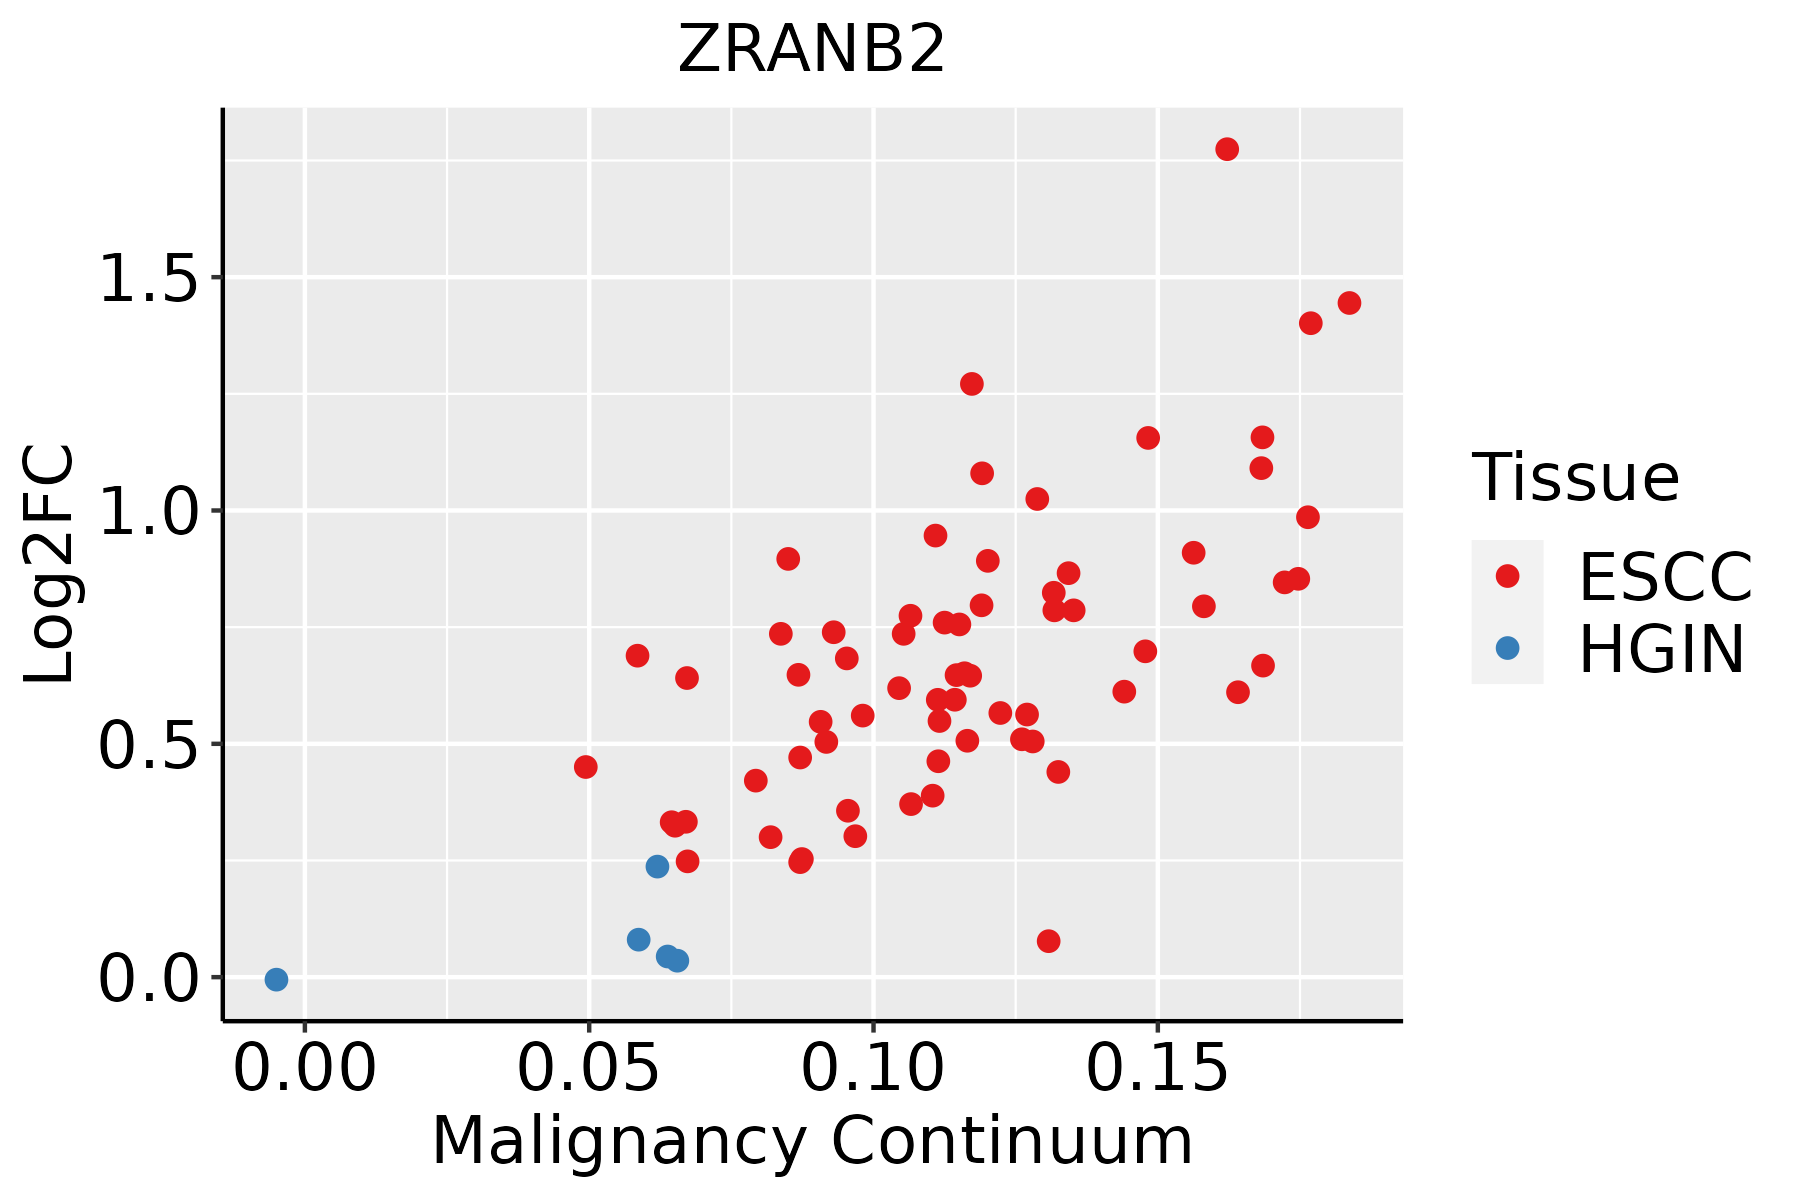 | ESCC: Esophageal squamous cell carcinoma |
| HGIN: High-grade intraepithelial neoplasias | ||
| LGIN: Low-grade intraepithelial neoplasias | ||
| Liver |  | HCC: Hepatocellular carcinoma |
| NAFLD: Non-alcoholic fatty liver disease | ||
| Lung | 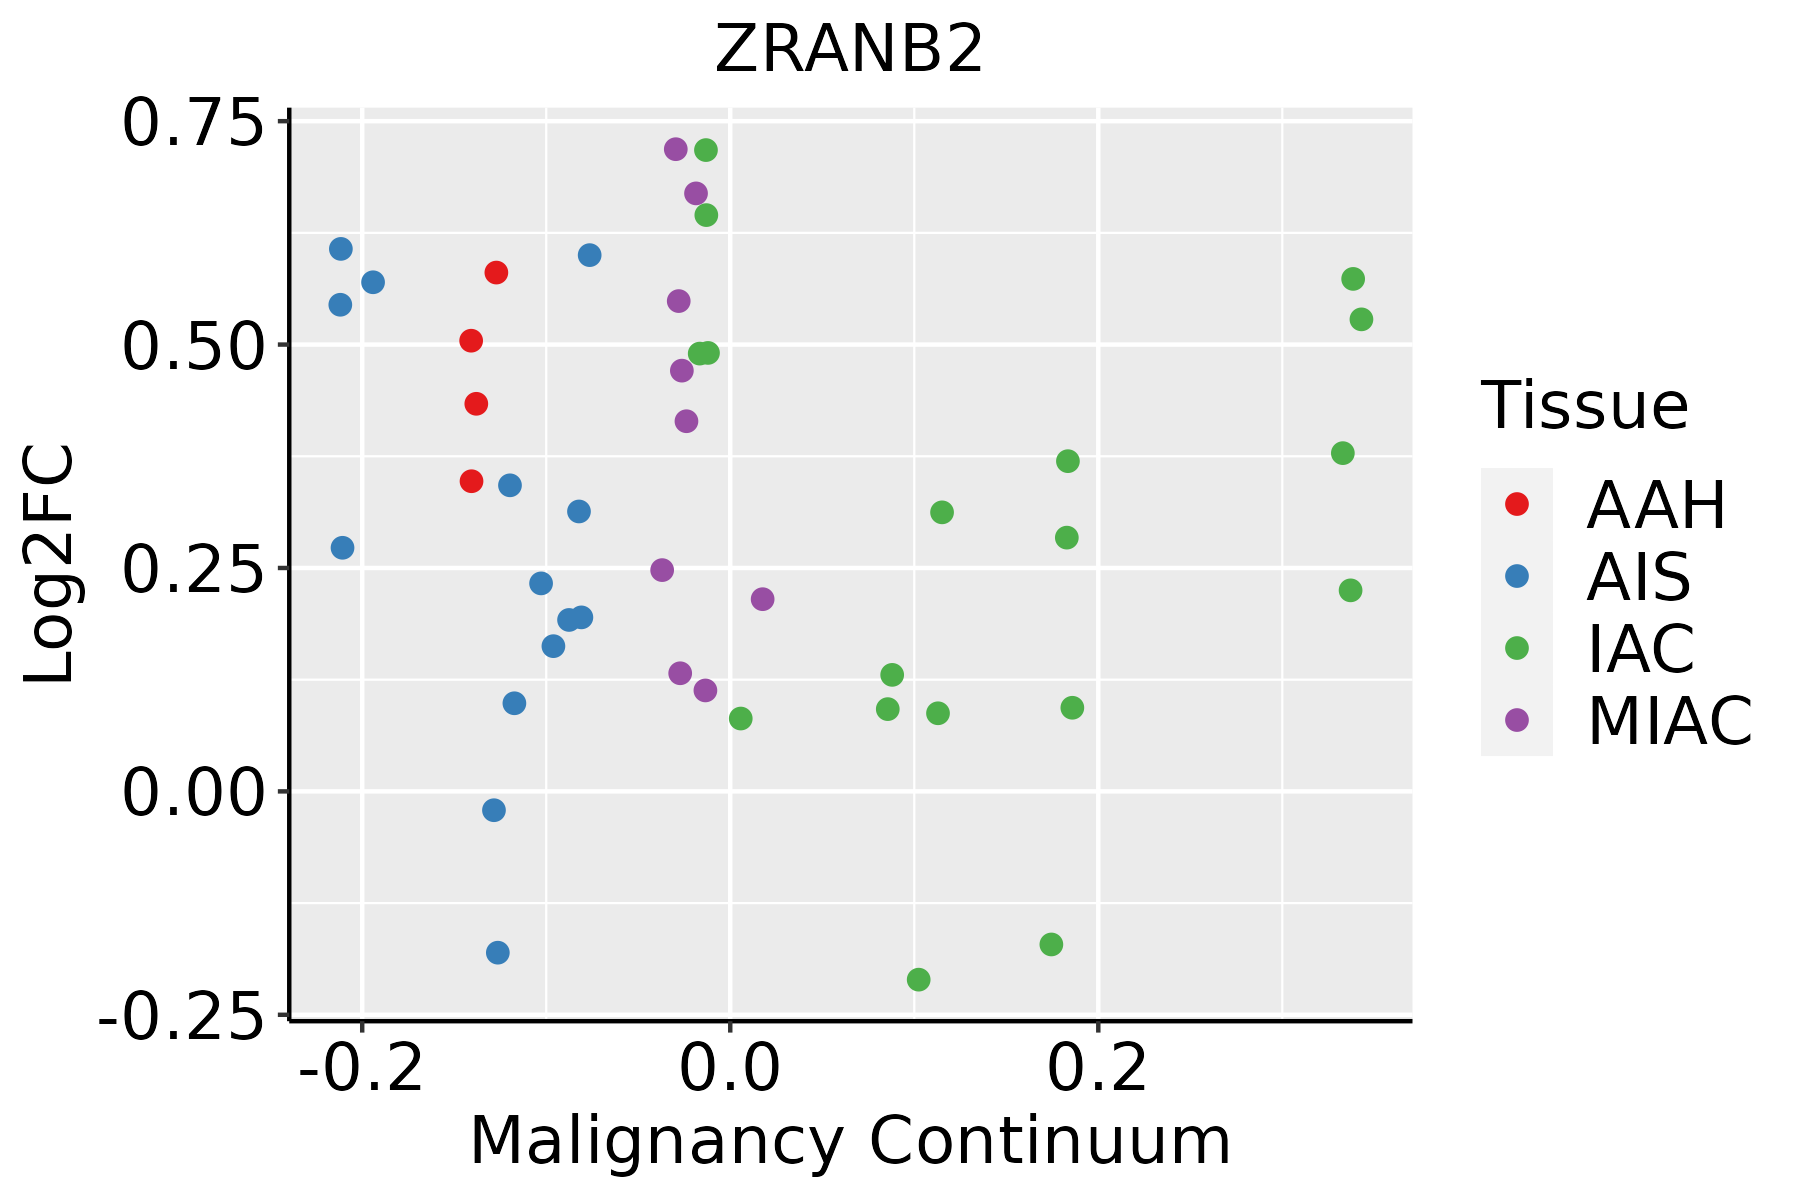 | AAH: Atypical adenomatous hyperplasia |
| AIS: Adenocarcinoma in situ | ||
| IAC: Invasive lung adenocarcinoma | ||
| MIA: Minimally invasive adenocarcinoma | ||
| Oral Cavity | 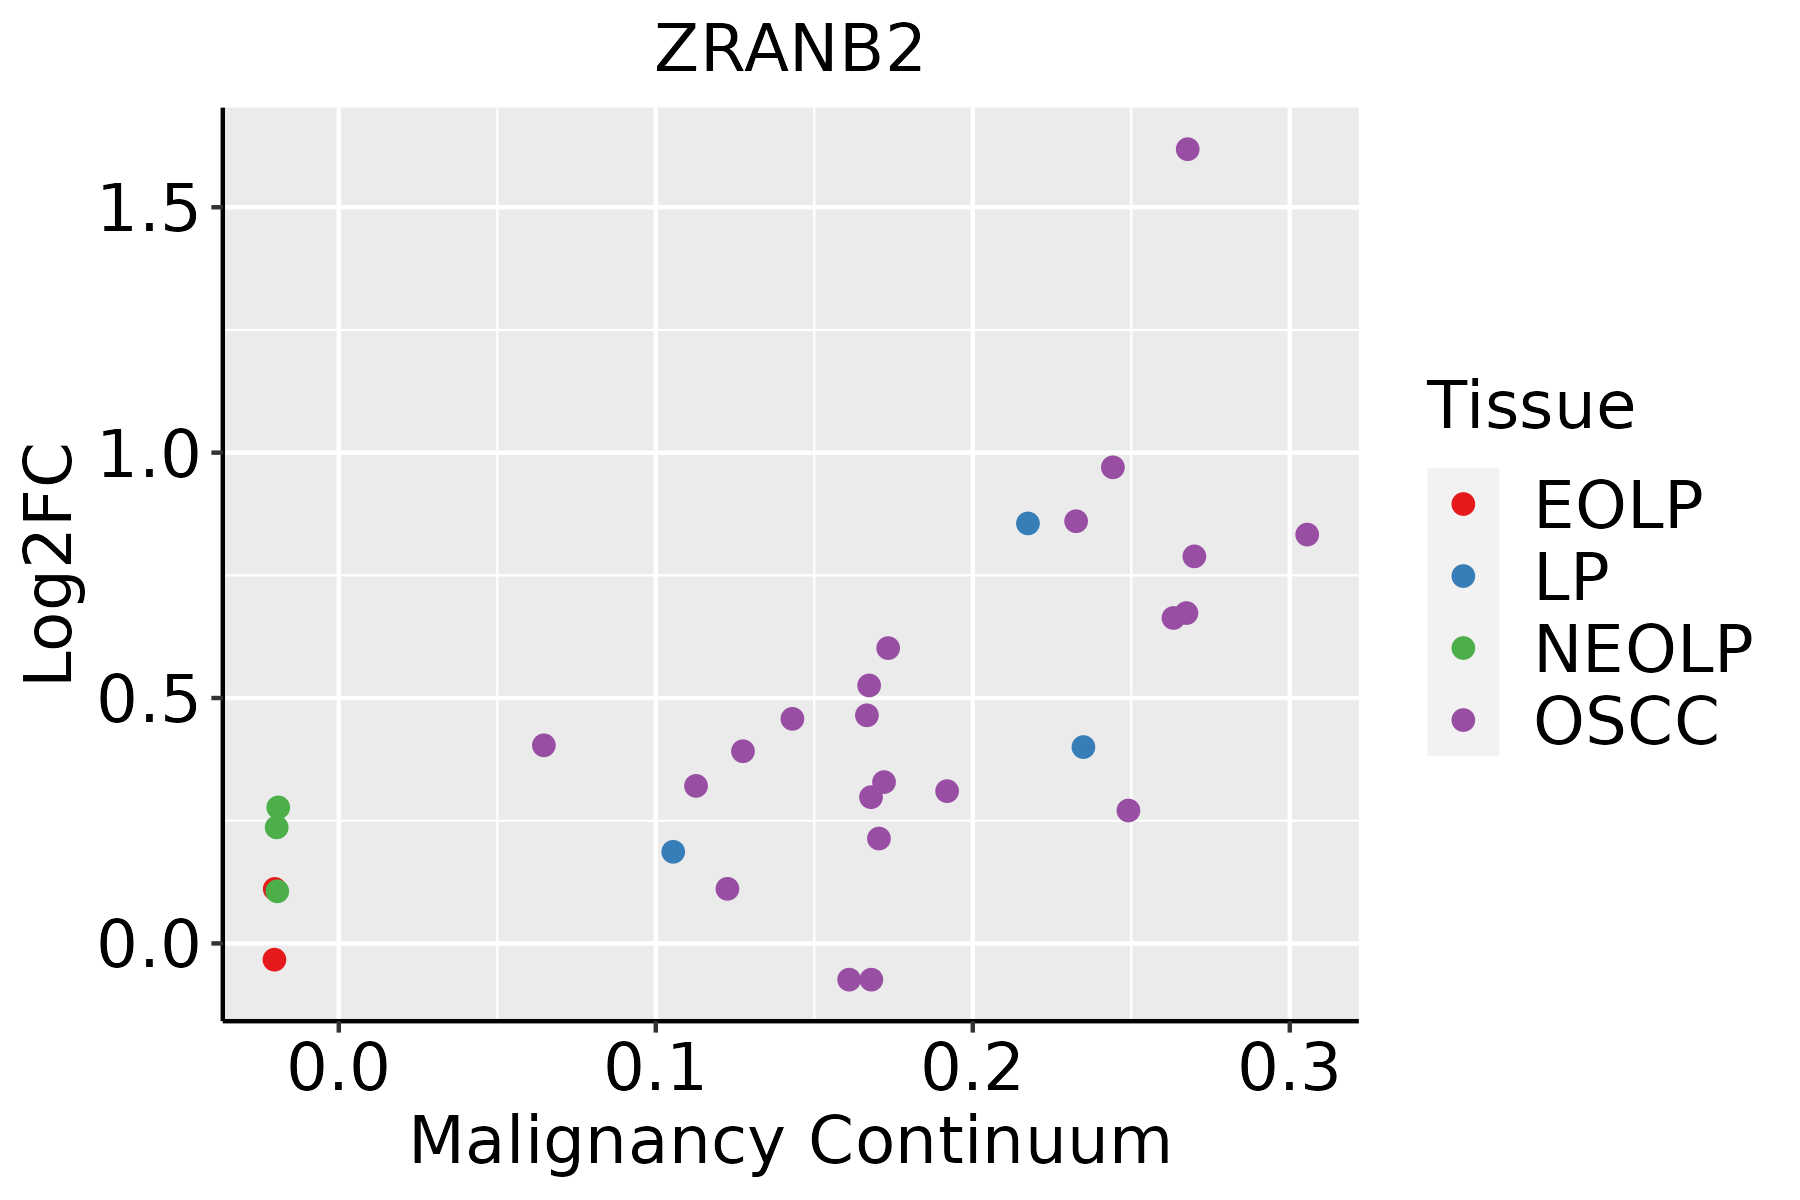 | EOLP: Erosive Oral lichen planus |
| LP: leukoplakia | ||
| NEOLP: Non-erosive oral lichen planus | ||
| OSCC: Oral squamous cell carcinoma | ||
| Prostate | 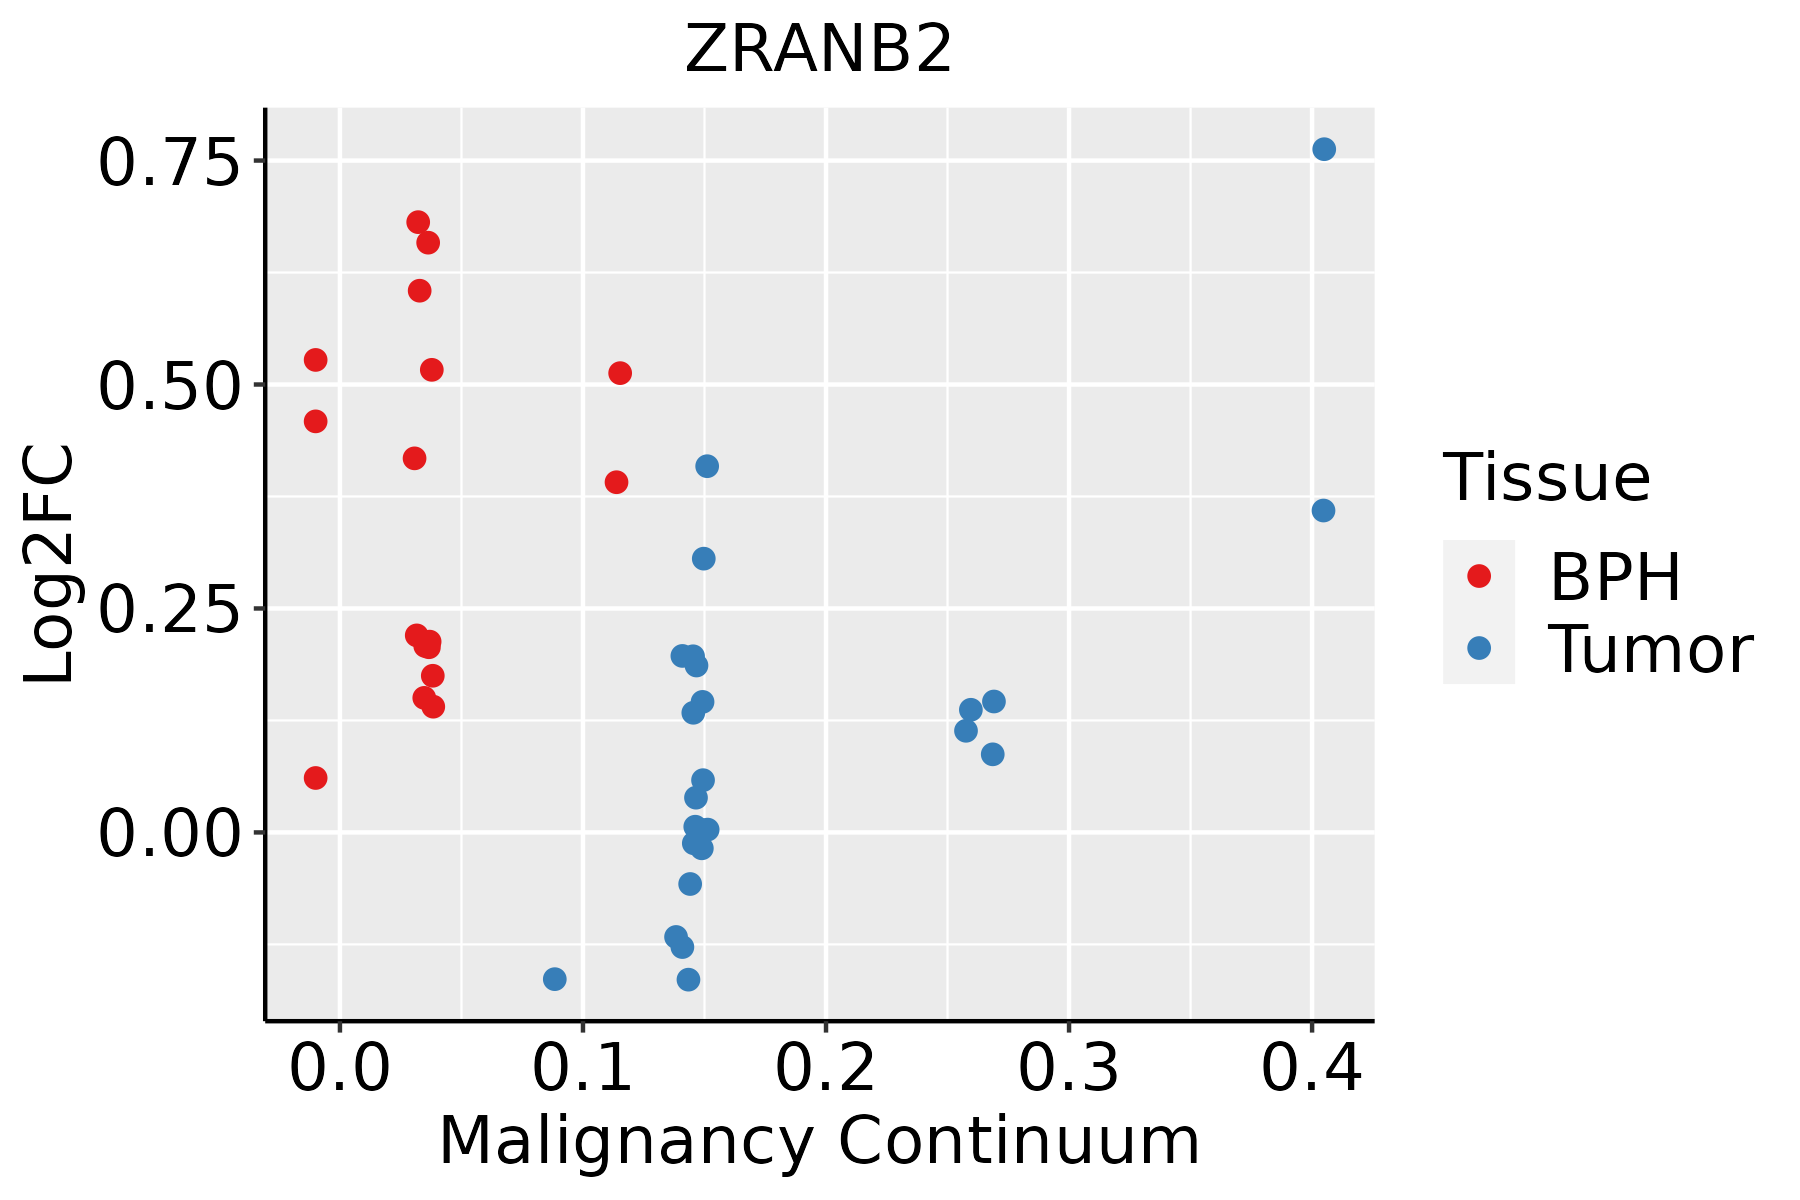 | BPH: Benign Prostatic Hyperplasia |
| Skin | 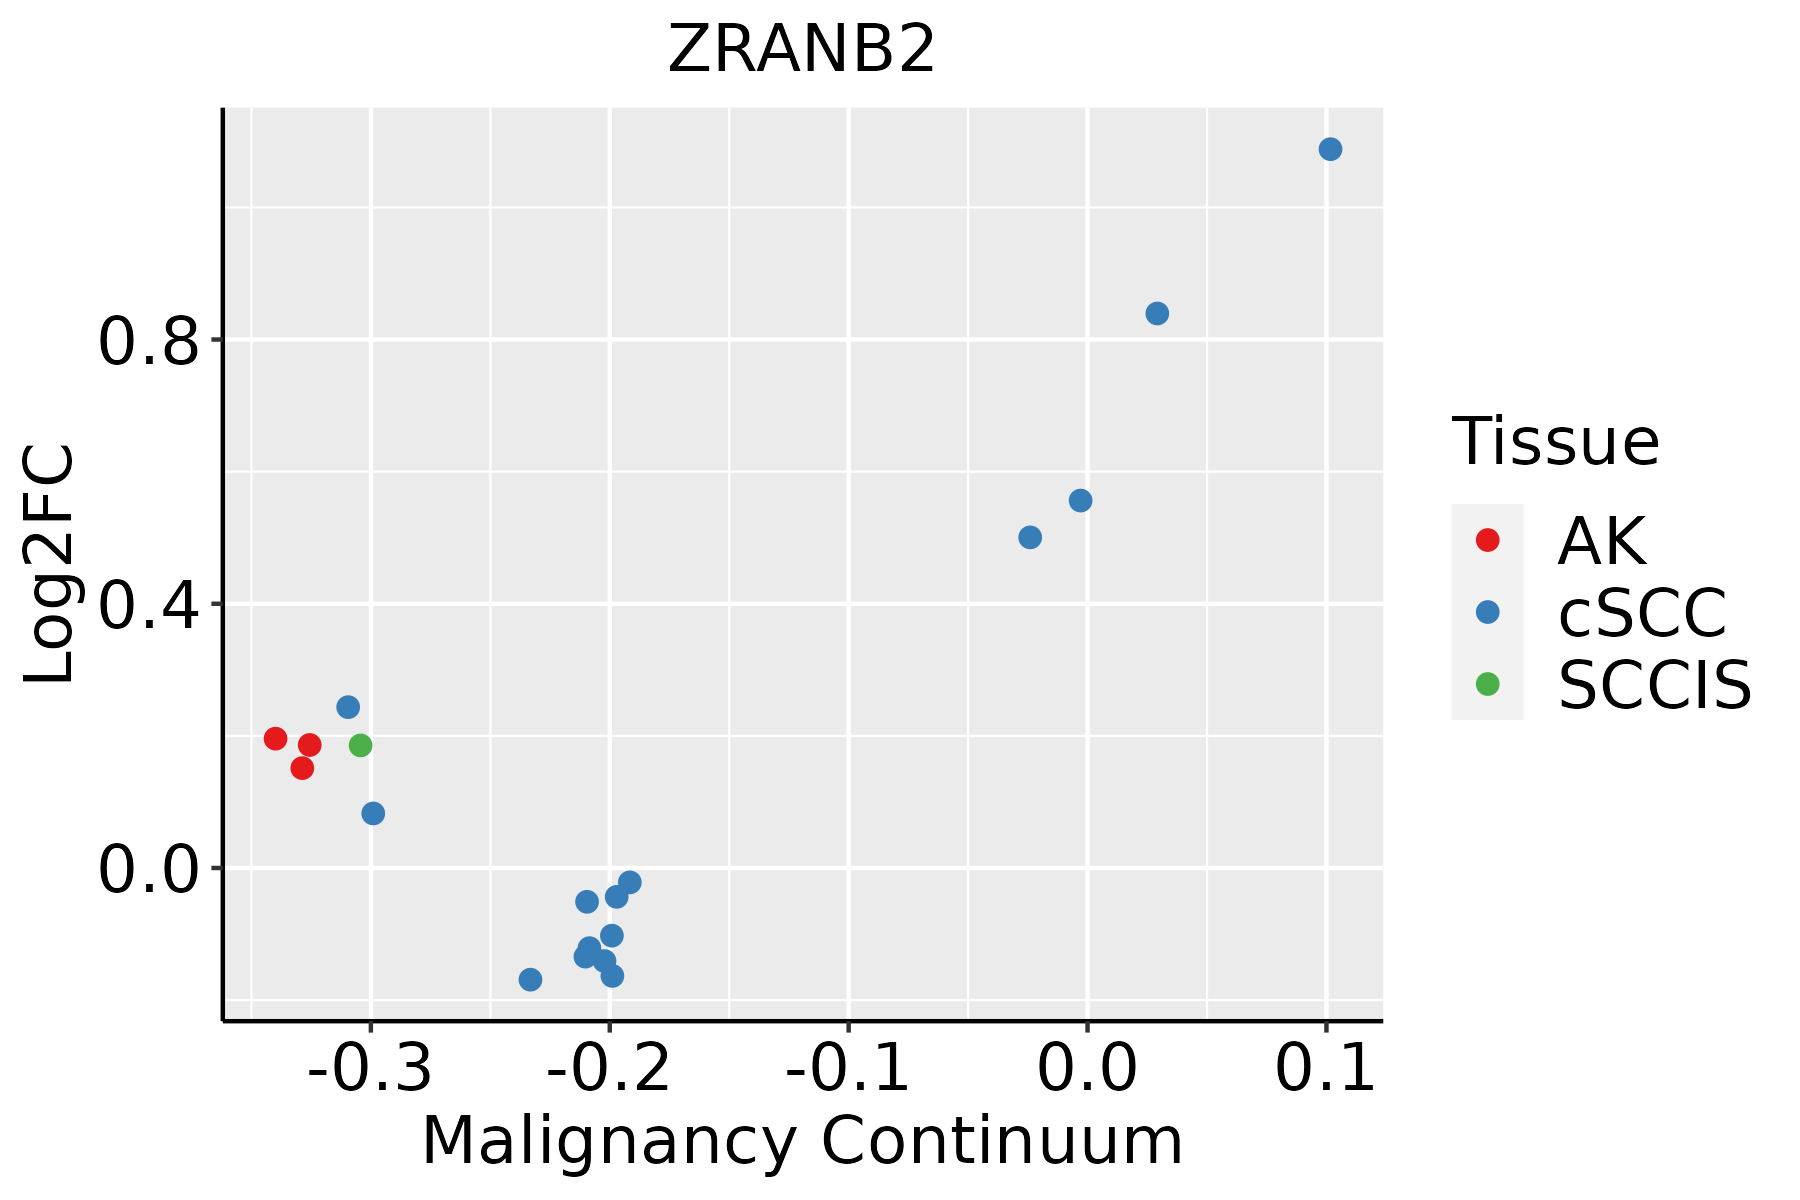 | AK: Actinic keratosis |
| cSCC: Cutaneous squamous cell carcinoma | ||
| SCCIS:squamous cell carcinoma in situ | ||
| Thyroid | 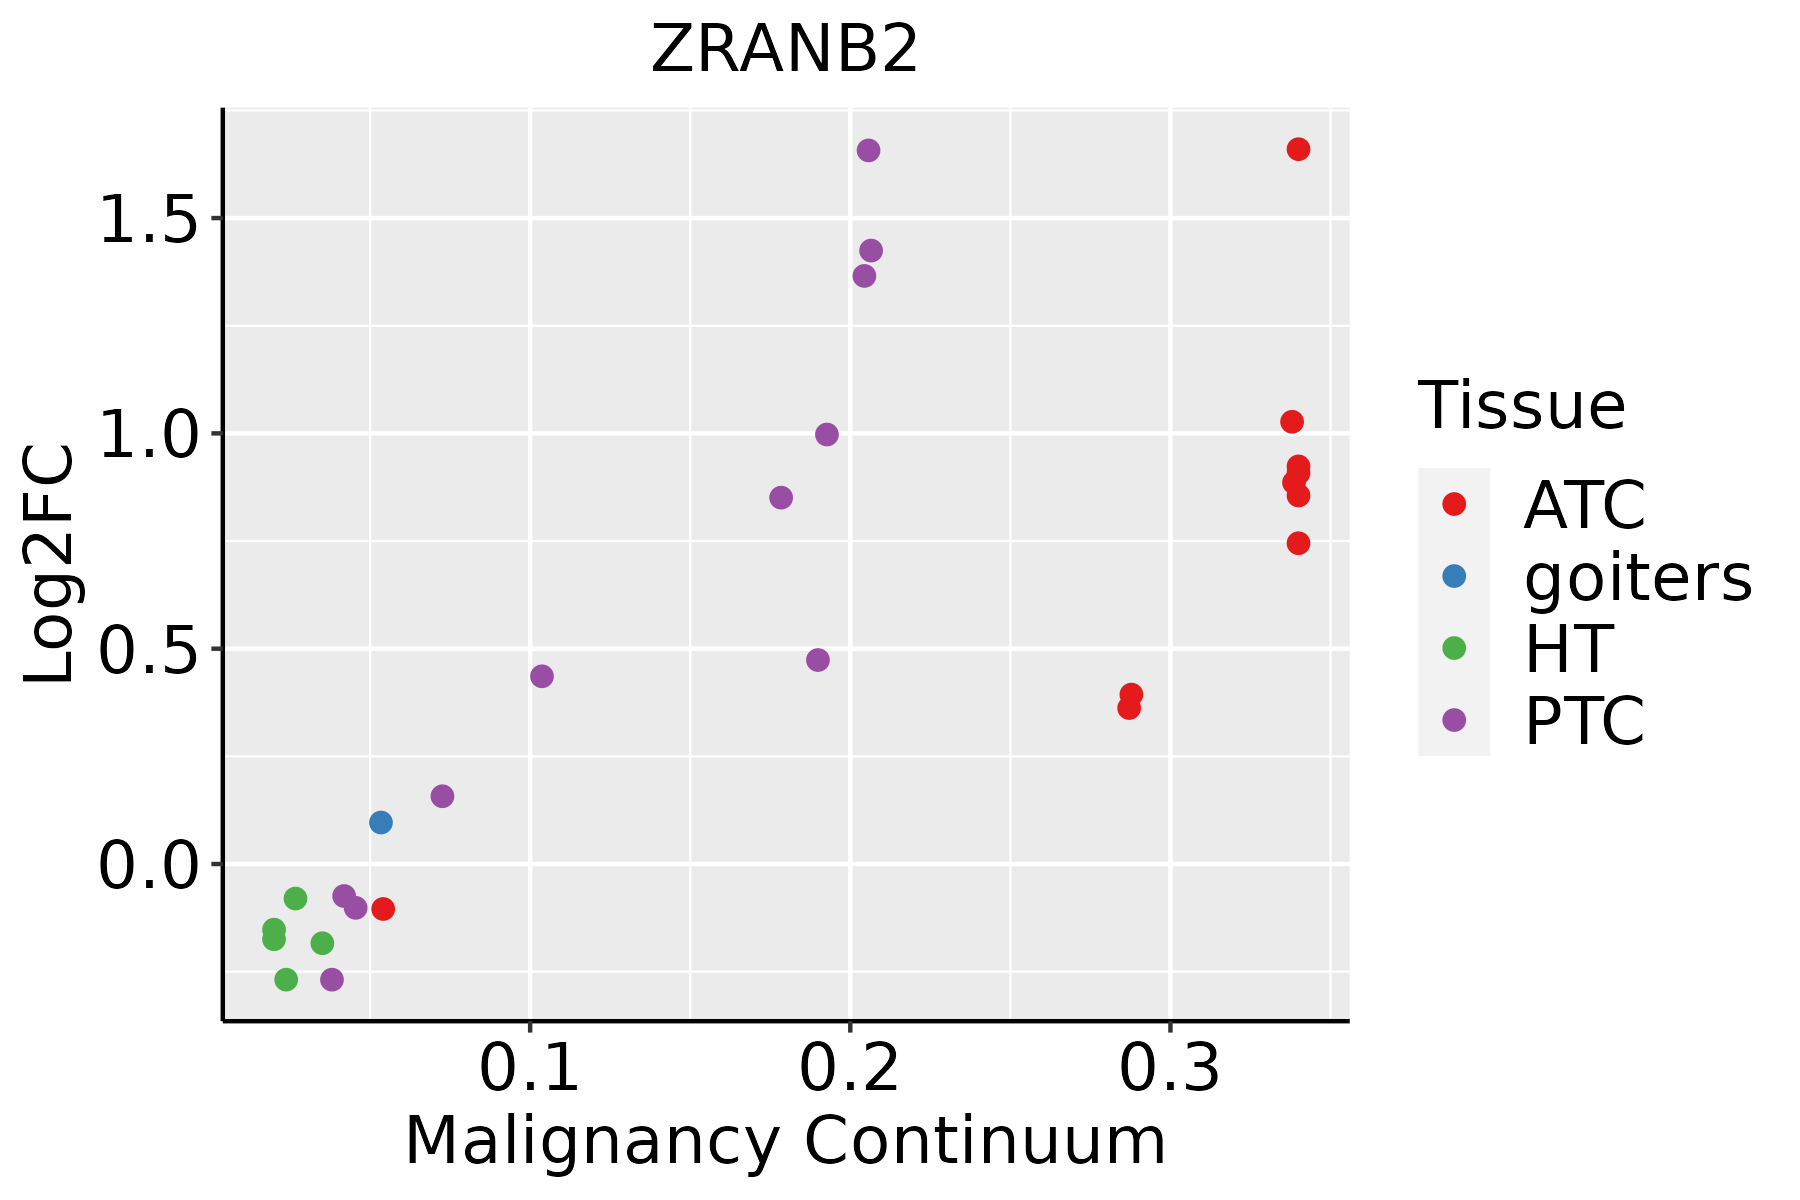 | ATC: Anaplastic thyroid cancer |
| HT: Hashimoto's thyroiditis | ||
| PTC: Papillary thyroid cancer |
| ∗log2FC in expression of this searched gene in stem-like cells from each diseased tissue sample relative to stem-like cells in normal samples in each tissue plotted against the malignancy continuum. Samples are colored based on if they are from different disease stage. |
Top |
Malignant transformation related pathway analysis |
| Find out the enriched GO biological processes and KEGG pathways involved in transition from healthy to precancer to cancer |
| Tissue | Disease Stage | Enriched GO biological Processes |
| Colorectum | AD |  |
| Colorectum | SER |  |
| Colorectum | MSS |  |
| Colorectum | MSI-H |  |
| Colorectum | FAP |  |
| ∗Top 15 enriched GO BP terms are showed in the bar plot of each disease state in each tissue. Each row represents a significant GO biological process which is colored according to the -log10(p.adjust). |
| Page: 1 2 3 4 5 6 7 8 9 |
| GO ID | Tissue | Disease Stage | Description | Gene Ratio | Bg Ratio | pvalue | p.adjust | Count |
| GO:0008380 | Colorectum | AD | RNA splicing | 169/3918 | 434/18723 | 3.59e-18 | 2.04e-15 | 169 |
| GO:00083801 | Colorectum | SER | RNA splicing | 123/2897 | 434/18723 | 3.84e-12 | 8.41e-10 | 123 |
| GO:00083802 | Colorectum | MSS | RNA splicing | 159/3467 | 434/18723 | 1.75e-19 | 1.22e-16 | 159 |
| GO:00083804 | Colorectum | FAP | RNA splicing | 108/2622 | 434/18723 | 7.90e-10 | 1.86e-07 | 108 |
| GO:00083805 | Colorectum | CRC | RNA splicing | 90/2078 | 434/18723 | 2.80e-09 | 7.97e-07 | 90 |
| GO:000838016 | Endometrium | AEH | RNA splicing | 111/2100 | 434/18723 | 2.42e-17 | 1.12e-14 | 111 |
| GO:000838017 | Endometrium | EEC | RNA splicing | 111/2168 | 434/18723 | 2.45e-16 | 1.13e-13 | 111 |
| GO:000838026 | Esophagus | HGIN | RNA splicing | 160/2587 | 434/18723 | 3.74e-34 | 1.12e-30 | 160 |
| GO:0008380111 | Esophagus | ESCC | RNA splicing | 336/8552 | 434/18723 | 1.74e-42 | 3.67e-39 | 336 |
| GO:00083807 | Liver | NAFLD | RNA splicing | 70/1882 | 434/18723 | 4.62e-05 | 1.10e-03 | 70 |
| GO:000838012 | Liver | Cirrhotic | RNA splicing | 229/4634 | 434/18723 | 9.13e-37 | 2.86e-33 | 229 |
| GO:000838022 | Liver | HCC | RNA splicing | 313/7958 | 434/18723 | 1.36e-36 | 1.73e-33 | 313 |
| GO:00083808 | Lung | IAC | RNA splicing | 75/2061 | 434/18723 | 4.89e-05 | 1.12e-03 | 75 |
| GO:000838013 | Lung | AIS | RNA splicing | 68/1849 | 434/18723 | 8.50e-05 | 2.11e-03 | 68 |
| GO:000838023 | Lung | MIAC | RNA splicing | 44/967 | 434/18723 | 1.56e-05 | 1.07e-03 | 44 |
| GO:000838020 | Oral cavity | OSCC | RNA splicing | 308/7305 | 434/18723 | 2.43e-42 | 7.70e-39 | 308 |
| GO:000838025 | Oral cavity | EOLP | RNA splicing | 115/2218 | 434/18723 | 2.24e-17 | 3.04e-14 | 115 |
| GO:000838033 | Oral cavity | NEOLP | RNA splicing | 110/2005 | 434/18723 | 2.29e-18 | 2.72e-15 | 110 |
| GO:000838018 | Prostate | BPH | RNA splicing | 147/3107 | 434/18723 | 5.17e-19 | 2.29e-16 | 147 |
| GO:000838019 | Prostate | Tumor | RNA splicing | 153/3246 | 434/18723 | 9.15e-20 | 5.79e-17 | 153 |
| Page: 1 2 |
| Pathway ID | Tissue | Disease Stage | Description | Gene Ratio | Bg Ratio | pvalue | p.adjust | qvalue | Count |
| Page: 1 |
Top |
Cell-cell communication analysis |
| Identification of potential cell-cell interactions between two cell types and their ligand-receptor pairs for different disease states |
| Ligand | Receptor | LRpair | Pathway | Tissue | Disease Stage |
| Page: 1 |
Top |
Single-cell gene regulatory network inference analysis |
| Find out the significant the regulons (TFs) and the target genes of each regulon across cell types for different disease states |
| TF | Cell Type | Tissue | Disease Stage | Target Gene | RSS | Regulon Activity |
| ∗The dot plots of a searched regulon are shown for all cell subpopulations in each disease state of each tissue based on the regulon specific score inferred using pySCENIC and by calculating the average expression. |
| Page: 1 |
Top |
Somatic mutation of malignant transformation related genes |
| Annotation of somatic variants for genes involved in malignant transformation |
| Hugo Symbol | Variant Class | Variant Classification | dbSNP RS | HGVSc | HGVSp | HGVSp Short | SWISSPROT | BIOTYPE | SIFT | PolyPhen | Tumor Sample Barcode | Tissue | Histology | Sex | Age | Stage | Therapy Types | Drugs | Outcome |
| ZRANB2 | SNV | Missense_Mutation | c.783N>T | p.Arg261Ser | p.R261S | O95218 | protein_coding | deleterious_low_confidence(0.02) | benign(0.037) | TCGA-A8-A08R-01 | Breast | breast invasive carcinoma | Female | <65 | I/II | Unknown | Unknown | SD | |
| ZRANB2 | SNV | Missense_Mutation | c.212G>T | p.Cys71Phe | p.C71F | O95218 | protein_coding | deleterious(0) | probably_damaging(0.99) | TCGA-C8-A1HM-01 | Breast | breast invasive carcinoma | Female | >=65 | I/II | Chemotherapy | doxorubicin | CR | |
| ZRANB2 | insertion | Nonsense_Mutation | novel | c.119_120insAGGATTATAAATTTGTATTGGAAAAGTT | p.Glu41GlyfsTer3 | p.E41Gfs*3 | O95218 | protein_coding | TCGA-BH-A0HX-01 | Breast | breast invasive carcinoma | Female | <65 | I/II | Chemotherapy | adrimycin | SD | ||
| ZRANB2 | insertion | Nonsense_Mutation | novel | c.118_119insATTTCTGATCCT | p.Thr40delinsAsnPheTerSerSer | p.T40delinsNF*SS | O95218 | protein_coding | TCGA-BH-A0HX-01 | Breast | breast invasive carcinoma | Female | <65 | I/II | Chemotherapy | adrimycin | SD | ||
| ZRANB2 | SNV | Missense_Mutation | novel | c.460N>A | p.Glu154Lys | p.E154K | O95218 | protein_coding | tolerated(0.19) | benign(0.099) | TCGA-C5-A7X5-01 | Cervix | cervical & endocervical cancer | Female | >=65 | I/II | Chemotherapy | carboplatin | PD |
| ZRANB2 | SNV | Missense_Mutation | c.245N>A | p.Arg82Lys | p.R82K | O95218 | protein_coding | deleterious(0) | benign(0.065) | TCGA-DG-A2KH-01 | Cervix | cervical & endocervical cancer | Female | <65 | I/II | Unknown | Unknown | SD | |
| ZRANB2 | SNV | Missense_Mutation | novel | c.326N>C | p.Arg109Thr | p.R109T | O95218 | protein_coding | deleterious(0) | possibly_damaging(0.879) | TCGA-FU-A3HY-01 | Cervix | cervical & endocervical cancer | Female | <65 | I/II | Chemotherapy | cisplatin | CR |
| ZRANB2 | SNV | Missense_Mutation | rs746948520 | c.691N>G | p.Ser231Ala | p.S231A | O95218 | protein_coding | deleterious(0.02) | benign(0.007) | TCGA-HG-A2PA-01 | Cervix | cervical & endocervical cancer | Female | <65 | I/II | Unspecific | Taxol | PD |
| ZRANB2 | SNV | Missense_Mutation | c.298N>G | p.Thr100Ala | p.T100A | O95218 | protein_coding | deleterious(0.02) | possibly_damaging(0.899) | TCGA-VS-A959-01 | Cervix | cervical & endocervical cancer | Female | >=65 | I/II | Unknown | Unknown | SD | |
| ZRANB2 | insertion | Frame_Shift_Ins | novel | c.246_247insA | p.Ser83IlefsTer4 | p.S83Ifs*4 | O95218 | protein_coding | TCGA-DG-A2KH-01 | Cervix | cervical & endocervical cancer | Female | <65 | I/II | Unknown | Unknown | SD |
| Page: 1 2 3 4 5 6 |
Top |
Related drugs of malignant transformation related genes |
| Identification of chemicals and drugs interact with genes involved in malignant transfromation |
| (DGIdb 4.0) |
| Entrez ID | Symbol | Category | Interaction Types | Drug Claim Name | Drug Name | PMIDs |
| Page: 1 |

Copyright 2023-Present -The University of Texas Health Science Center at Houston |