
|
|||||
|
 | |
| |
| |
| |
| |
| |
|
Gene: ZRANB1 |
Gene summary for ZRANB1 |
| Gene information | Species | Human | Gene symbol | ZRANB1 | Gene ID | 54764 |
| Gene name | zinc finger RANBP2-type containing 1 | |
| Gene Alias | TRABID | |
| Cytomap | 10q26.13 | |
| Gene Type | protein-coding | GO ID | GO:0000902 | UniProtAcc | Q9UGI0 |
Top |
Malignant transformation analysis |
| Identification of the aberrant gene expression in precancerous and cancerous lesions by comparing the gene expression of stem-like cells in diseased tissues with normal stem cells |
| Entrez ID | Symbol | Replicates | Species | Organ | Tissue | Adj P-value | Log2FC | Malignancy |
| 54764 | ZRANB1 | NAFLD1 | Human | Liver | NAFLD | 4.37e-03 | 5.31e-01 | -0.04 |
| 54764 | ZRANB1 | HCC1_Meng | Human | Liver | HCC | 7.16e-31 | -8.14e-02 | 0.0246 |
| 54764 | ZRANB1 | HCC2_Meng | Human | Liver | HCC | 9.79e-06 | -4.78e-02 | 0.0107 |
| 54764 | ZRANB1 | HCC2 | Human | Liver | HCC | 1.57e-11 | 3.39e+00 | 0.5341 |
| 54764 | ZRANB1 | S014 | Human | Liver | HCC | 4.77e-04 | 4.13e-01 | 0.2254 |
| 54764 | ZRANB1 | S015 | Human | Liver | HCC | 5.79e-04 | 4.24e-01 | 0.2375 |
| 54764 | ZRANB1 | S016 | Human | Liver | HCC | 1.39e-03 | 3.35e-01 | 0.2243 |
| 54764 | ZRANB1 | C04 | Human | Oral cavity | OSCC | 1.43e-08 | 3.09e-01 | 0.2633 |
| 54764 | ZRANB1 | C21 | Human | Oral cavity | OSCC | 1.07e-12 | 3.40e-01 | 0.2678 |
| 54764 | ZRANB1 | C30 | Human | Oral cavity | OSCC | 2.68e-14 | 6.25e-01 | 0.3055 |
| 54764 | ZRANB1 | C43 | Human | Oral cavity | OSCC | 4.81e-02 | 1.75e-02 | 0.1704 |
| 54764 | ZRANB1 | C51 | Human | Oral cavity | OSCC | 1.80e-03 | 2.18e-01 | 0.2674 |
| 54764 | ZRANB1 | C57 | Human | Oral cavity | OSCC | 9.91e-11 | 3.23e-01 | 0.1679 |
| 54764 | ZRANB1 | C06 | Human | Oral cavity | OSCC | 6.34e-03 | 5.40e-01 | 0.2699 |
| 54764 | ZRANB1 | C08 | Human | Oral cavity | OSCC | 4.34e-07 | 1.53e-01 | 0.1919 |
| 54764 | ZRANB1 | C09 | Human | Oral cavity | OSCC | 1.10e-02 | 1.17e-01 | 0.1431 |
| 54764 | ZRANB1 | LN46 | Human | Oral cavity | OSCC | 4.69e-08 | 2.73e-01 | 0.1666 |
| 54764 | ZRANB1 | SYSMH1 | Human | Oral cavity | OSCC | 4.01e-08 | 2.14e-01 | 0.1127 |
| 54764 | ZRANB1 | SYSMH2 | Human | Oral cavity | OSCC | 2.07e-04 | 2.25e-01 | 0.2326 |
| 54764 | ZRANB1 | SYSMH3 | Human | Oral cavity | OSCC | 1.58e-12 | 2.86e-01 | 0.2442 |
| Page: 1 |
| Tissue | Expression Dynamics | Abbreviation |
| Liver | 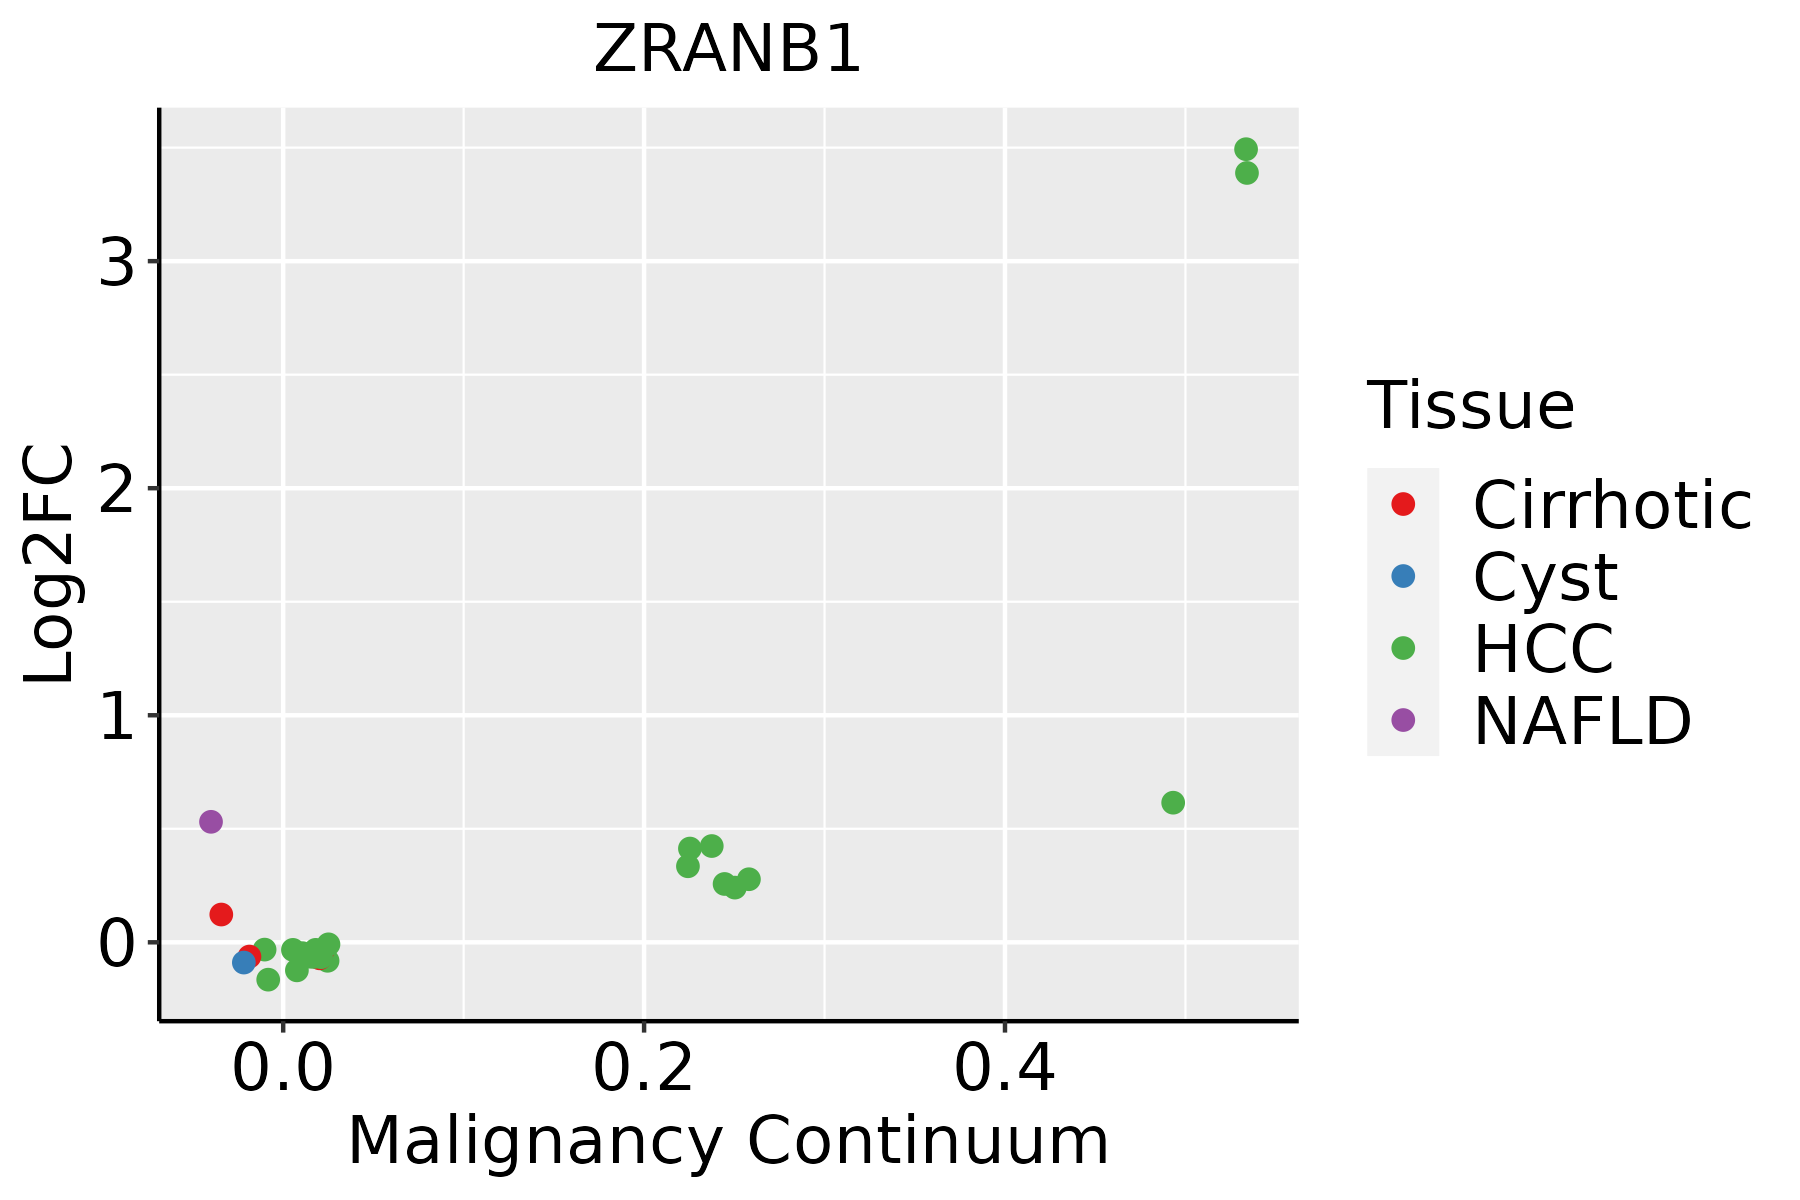 | HCC: Hepatocellular carcinoma |
| NAFLD: Non-alcoholic fatty liver disease | ||
| Oral Cavity | 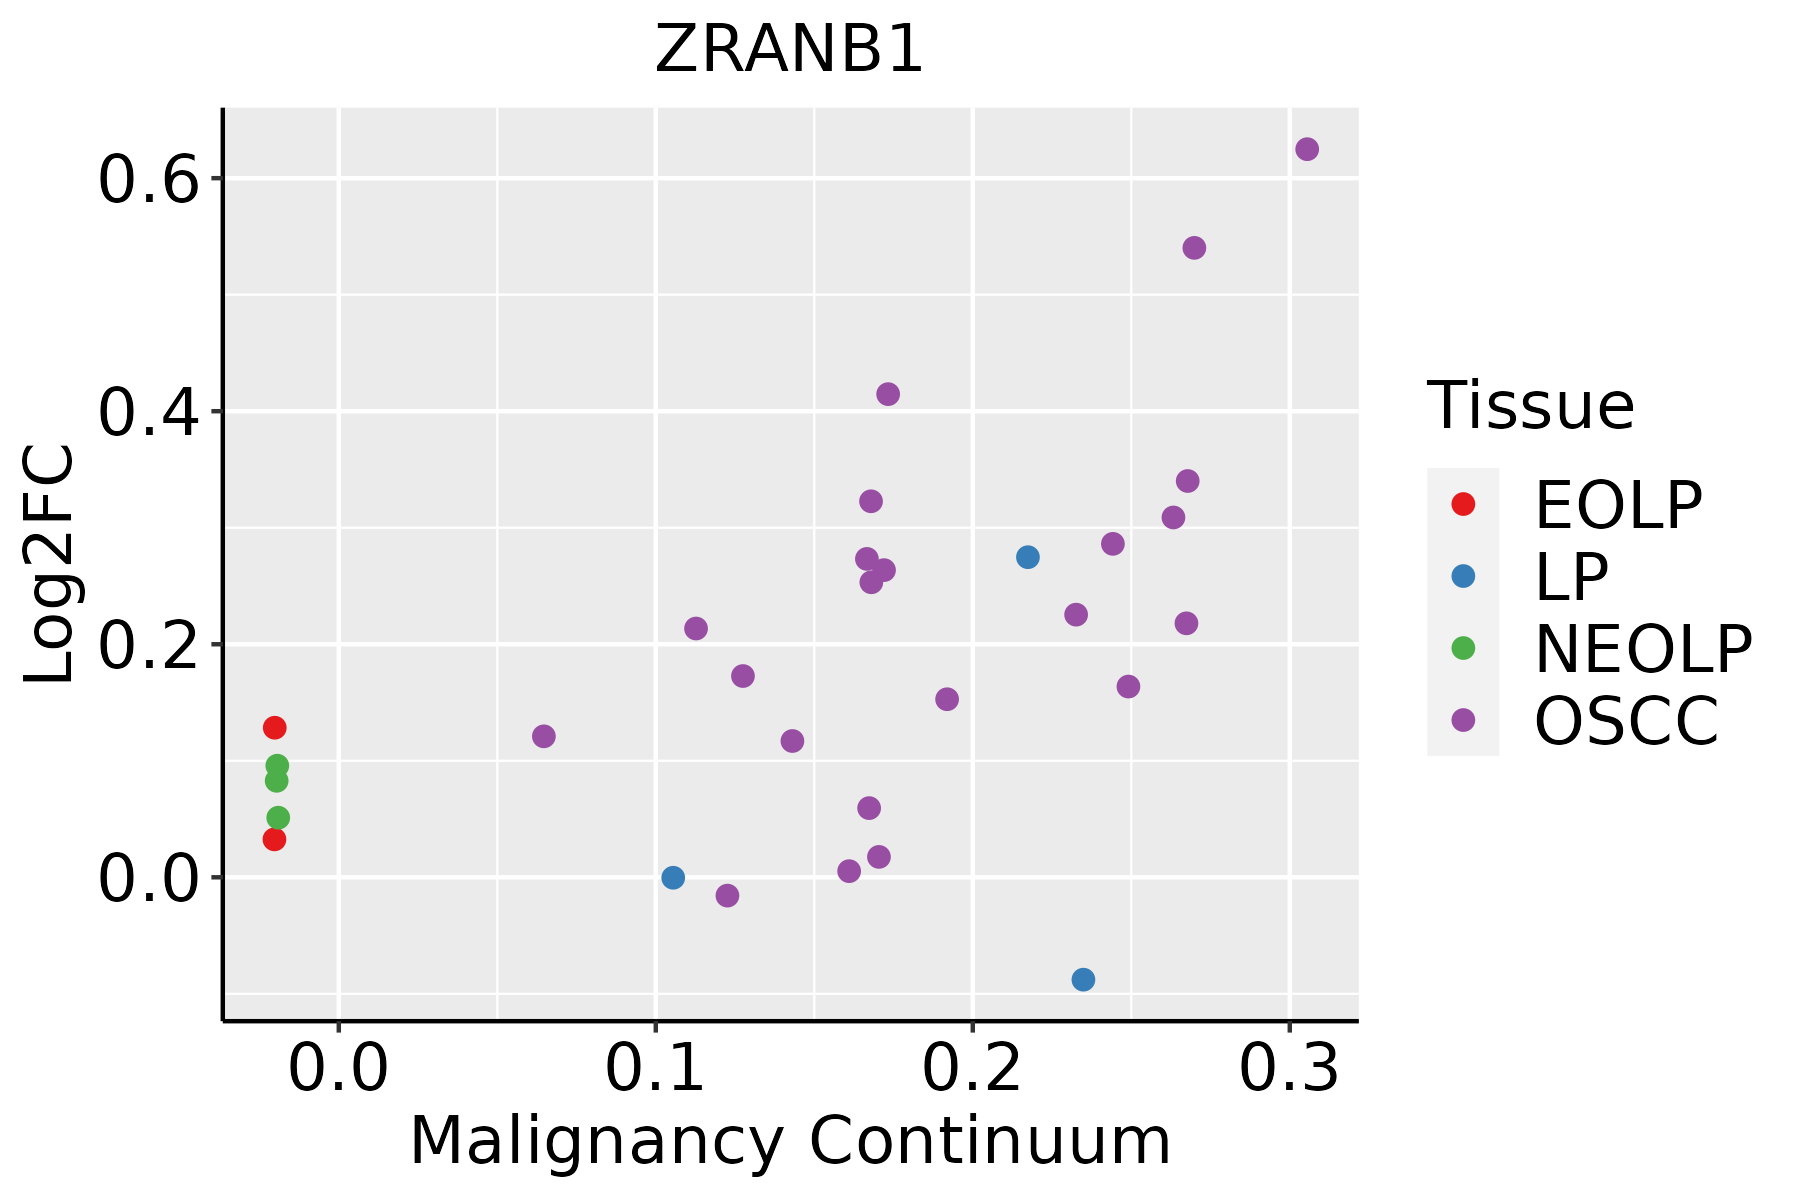 | EOLP: Erosive Oral lichen planus |
| LP: leukoplakia | ||
| NEOLP: Non-erosive oral lichen planus | ||
| OSCC: Oral squamous cell carcinoma |
| ∗log2FC in expression of this searched gene in stem-like cells from each diseased tissue sample relative to stem-like cells in normal samples in each tissue plotted against the malignancy continuum. Samples are colored based on if they are from different disease stage. |
Top |
Malignant transformation related pathway analysis |
| Find out the enriched GO biological processes and KEGG pathways involved in transition from healthy to precancer to cancer |
| Tissue | Disease Stage | Enriched GO biological Processes |
| Colorectum | AD |  |
| Colorectum | SER |  |
| Colorectum | MSS |  |
| Colorectum | MSI-H |  |
| Colorectum | FAP |  |
| ∗Top 15 enriched GO BP terms are showed in the bar plot of each disease state in each tissue. Each row represents a significant GO biological process which is colored according to the -log10(p.adjust). |
| Page: 1 2 3 4 5 6 7 8 9 |
| GO ID | Tissue | Disease Stage | Description | Gene Ratio | Bg Ratio | pvalue | p.adjust | Count |
| GO:00226047 | Liver | NAFLD | regulation of cell morphogenesis | 62/1882 | 309/18723 | 8.35e-08 | 7.09e-06 | 62 |
| GO:00160555 | Liver | NAFLD | Wnt signaling pathway | 74/1882 | 444/18723 | 8.98e-06 | 2.96e-04 | 74 |
| GO:01987385 | Liver | NAFLD | cell-cell signaling by wnt | 74/1882 | 446/18723 | 1.05e-05 | 3.33e-04 | 74 |
| GO:00301115 | Liver | NAFLD | regulation of Wnt signaling pathway | 57/1882 | 328/18723 | 2.79e-05 | 7.46e-04 | 57 |
| GO:00301774 | Liver | NAFLD | positive regulation of Wnt signaling pathway | 27/1882 | 140/18723 | 6.82e-04 | 8.76e-03 | 27 |
| GO:0070646 | Liver | NAFLD | protein modification by small protein removal | 29/1882 | 157/18723 | 9.11e-04 | 1.09e-02 | 29 |
| GO:0016579 | Liver | NAFLD | protein deubiquitination | 26/1882 | 139/18723 | 1.35e-03 | 1.52e-02 | 26 |
| GO:0070536 | Liver | NAFLD | protein K63-linked deubiquitination | 9/1882 | 35/18723 | 6.47e-03 | 4.69e-02 | 9 |
| GO:002260422 | Liver | HCC | regulation of cell morphogenesis | 188/7958 | 309/18723 | 4.84e-11 | 1.82e-09 | 188 |
| GO:019873821 | Liver | HCC | cell-cell signaling by wnt | 247/7958 | 446/18723 | 2.11e-08 | 4.96e-07 | 247 |
| GO:001605521 | Liver | HCC | Wnt signaling pathway | 245/7958 | 444/18723 | 3.68e-08 | 8.09e-07 | 245 |
| GO:003011121 | Liver | HCC | regulation of Wnt signaling pathway | 180/7958 | 328/18723 | 3.62e-06 | 4.72e-05 | 180 |
| GO:00706461 | Liver | HCC | protein modification by small protein removal | 91/7958 | 157/18723 | 6.50e-05 | 5.92e-04 | 91 |
| GO:003017721 | Liver | HCC | positive regulation of Wnt signaling pathway | 81/7958 | 140/18723 | 1.73e-04 | 1.36e-03 | 81 |
| GO:00165791 | Liver | HCC | protein deubiquitination | 78/7958 | 139/18723 | 8.13e-04 | 4.87e-03 | 78 |
| GO:00705361 | Liver | HCC | protein K63-linked deubiquitination | 24/7958 | 35/18723 | 1.64e-03 | 8.61e-03 | 24 |
| GO:001605510 | Oral cavity | OSCC | Wnt signaling pathway | 227/7305 | 444/18723 | 1.10e-07 | 1.87e-06 | 227 |
| GO:019873810 | Oral cavity | OSCC | cell-cell signaling by wnt | 227/7305 | 446/18723 | 1.75e-07 | 2.86e-06 | 227 |
| GO:002260419 | Oral cavity | OSCC | regulation of cell morphogenesis | 163/7305 | 309/18723 | 5.66e-07 | 8.19e-06 | 163 |
| GO:003011110 | Oral cavity | OSCC | regulation of Wnt signaling pathway | 165/7305 | 328/18723 | 1.87e-05 | 1.80e-04 | 165 |
| Page: 1 2 |
| Pathway ID | Tissue | Disease Stage | Description | Gene Ratio | Bg Ratio | pvalue | p.adjust | qvalue | Count |
| Page: 1 |
Top |
Cell-cell communication analysis |
| Identification of potential cell-cell interactions between two cell types and their ligand-receptor pairs for different disease states |
| Ligand | Receptor | LRpair | Pathway | Tissue | Disease Stage |
| Page: 1 |
Top |
Single-cell gene regulatory network inference analysis |
| Find out the significant the regulons (TFs) and the target genes of each regulon across cell types for different disease states |
| TF | Cell Type | Tissue | Disease Stage | Target Gene | RSS | Regulon Activity |
| ∗The dot plots of a searched regulon are shown for all cell subpopulations in each disease state of each tissue based on the regulon specific score inferred using pySCENIC and by calculating the average expression. |
| Page: 1 |
Top |
Somatic mutation of malignant transformation related genes |
| Annotation of somatic variants for genes involved in malignant transformation |
| Hugo Symbol | Variant Class | Variant Classification | dbSNP RS | HGVSc | HGVSp | HGVSp Short | SWISSPROT | BIOTYPE | SIFT | PolyPhen | Tumor Sample Barcode | Tissue | Histology | Sex | Age | Stage | Therapy Types | Drugs | Outcome |
| ZRANB1 | SNV | Missense_Mutation | novel | c.1760N>G | p.Ser587Cys | p.S587C | Q9UGI0 | protein_coding | tolerated(0.05) | probably_damaging(0.984) | TCGA-A7-A4SE-01 | Breast | breast invasive carcinoma | Female | <65 | I/II | Chemotherapy | adriamycin | CR |
| ZRANB1 | SNV | Missense_Mutation | novel | c.599N>T | p.Arg200Ile | p.R200I | Q9UGI0 | protein_coding | tolerated(0.23) | benign(0.018) | TCGA-AN-A046-01 | Breast | breast invasive carcinoma | Female | >=65 | I/II | Unknown | Unknown | SD |
| ZRANB1 | SNV | Missense_Mutation | rs774002081 | c.2012N>A | p.Arg671Gln | p.R671Q | Q9UGI0 | protein_coding | tolerated(0.34) | benign(0.201) | TCGA-AN-A046-01 | Breast | breast invasive carcinoma | Female | >=65 | I/II | Unknown | Unknown | SD |
| ZRANB1 | SNV | Missense_Mutation | c.1294N>G | p.Leu432Val | p.L432V | Q9UGI0 | protein_coding | deleterious(0.01) | probably_damaging(0.978) | TCGA-AN-A0FX-01 | Breast | breast invasive carcinoma | Female | <65 | I/II | Unknown | Unknown | SD | |
| ZRANB1 | SNV | Missense_Mutation | c.553N>A | p.Leu185Met | p.L185M | Q9UGI0 | protein_coding | tolerated(0.16) | benign(0.352) | TCGA-AR-A24L-01 | Breast | breast invasive carcinoma | Female | <65 | I/II | Hormone Therapy | tamoxiphen | PD | |
| ZRANB1 | SNV | Missense_Mutation | c.929N>T | p.Asp310Val | p.D310V | Q9UGI0 | protein_coding | deleterious(0) | probably_damaging(0.917) | TCGA-BH-A0W4-01 | Breast | breast invasive carcinoma | Female | <65 | I/II | Unknown | Unknown | SD | |
| ZRANB1 | SNV | Missense_Mutation | novel | c.860N>T | p.Ser287Leu | p.S287L | Q9UGI0 | protein_coding | deleterious(0.02) | probably_damaging(0.994) | TCGA-C8-A26W-01 | Breast | breast invasive carcinoma | Female | <65 | I/II | Chemotherapy | doxorubicin | CR |
| ZRANB1 | SNV | Missense_Mutation | c.2098G>C | p.Glu700Gln | p.E700Q | Q9UGI0 | protein_coding | tolerated(0.2) | benign(0.055) | TCGA-D8-A1XL-01 | Breast | breast invasive carcinoma | Female | <65 | I/II | Chemotherapy | doxorubicine+cyclophosphamide+tamoxifen | SD | |
| ZRANB1 | SNV | Missense_Mutation | rs774002081 | c.2012N>A | p.Arg671Gln | p.R671Q | Q9UGI0 | protein_coding | tolerated(0.34) | benign(0.201) | TCGA-JX-A3Q0-01 | Cervix | cervical & endocervical cancer | Female | <65 | III/IV | Unknown | Unknown | SD |
| ZRANB1 | SNV | Missense_Mutation | c.271C>T | p.His91Tyr | p.H91Y | Q9UGI0 | protein_coding | deleterious(0.03) | benign(0.043) | TCGA-A6-2684-01 | Colorectum | colon adenocarcinoma | Female | >=65 | I/II | Unknown | Unknown | PD |
| Page: 1 2 3 4 5 6 7 8 |
Top |
Related drugs of malignant transformation related genes |
| Identification of chemicals and drugs interact with genes involved in malignant transfromation |
| (DGIdb 4.0) |
| Entrez ID | Symbol | Category | Interaction Types | Drug Claim Name | Drug Name | PMIDs |
| Page: 1 |

Copyright 2023-Present -The University of Texas Health Science Center at Houston |