
|
|||||
|
 | |
| |
| |
| |
| |
| |
|
Gene: ZPR1 |
Gene summary for ZPR1 |
| Gene information | Species | Human | Gene symbol | ZPR1 | Gene ID | 8882 |
| Gene name | ZPR1 zinc finger | |
| Gene Alias | GKAF | |
| Cytomap | 11q23.3 | |
| Gene Type | protein-coding | GO ID | GO:0000082 | UniProtAcc | O75312 |
Top |
Malignant transformation analysis |
| Identification of the aberrant gene expression in precancerous and cancerous lesions by comparing the gene expression of stem-like cells in diseased tissues with normal stem cells |
| Entrez ID | Symbol | Replicates | Species | Organ | Tissue | Adj P-value | Log2FC | Malignancy |
| 8882 | ZPR1 | LZE4T | Human | Esophagus | ESCC | 1.08e-09 | 1.77e-01 | 0.0811 |
| 8882 | ZPR1 | LZE7T | Human | Esophagus | ESCC | 2.04e-02 | 1.10e-01 | 0.0667 |
| 8882 | ZPR1 | LZE20T | Human | Esophagus | ESCC | 2.57e-08 | 1.29e-01 | 0.0662 |
| 8882 | ZPR1 | LZE24T | Human | Esophagus | ESCC | 7.00e-29 | 1.03e+00 | 0.0596 |
| 8882 | ZPR1 | LZE21T | Human | Esophagus | ESCC | 2.83e-02 | 1.09e-01 | 0.0655 |
| 8882 | ZPR1 | P1T-E | Human | Esophagus | ESCC | 3.28e-07 | 1.74e-01 | 0.0875 |
| 8882 | ZPR1 | P2T-E | Human | Esophagus | ESCC | 6.54e-15 | 2.70e-01 | 0.1177 |
| 8882 | ZPR1 | P4T-E | Human | Esophagus | ESCC | 1.80e-30 | 9.69e-01 | 0.1323 |
| 8882 | ZPR1 | P5T-E | Human | Esophagus | ESCC | 4.44e-26 | 5.86e-01 | 0.1327 |
| 8882 | ZPR1 | P8T-E | Human | Esophagus | ESCC | 6.71e-12 | 1.31e-01 | 0.0889 |
| 8882 | ZPR1 | P9T-E | Human | Esophagus | ESCC | 5.17e-21 | 4.25e-01 | 0.1131 |
| 8882 | ZPR1 | P10T-E | Human | Esophagus | ESCC | 2.62e-23 | 5.26e-01 | 0.116 |
| 8882 | ZPR1 | P11T-E | Human | Esophagus | ESCC | 1.56e-13 | 7.15e-01 | 0.1426 |
| 8882 | ZPR1 | P12T-E | Human | Esophagus | ESCC | 1.11e-30 | 6.10e-01 | 0.1122 |
| 8882 | ZPR1 | P15T-E | Human | Esophagus | ESCC | 3.53e-13 | 3.55e-01 | 0.1149 |
| 8882 | ZPR1 | P16T-E | Human | Esophagus | ESCC | 3.04e-17 | 3.91e-01 | 0.1153 |
| 8882 | ZPR1 | P17T-E | Human | Esophagus | ESCC | 6.32e-03 | 4.76e-01 | 0.1278 |
| 8882 | ZPR1 | P19T-E | Human | Esophagus | ESCC | 2.40e-10 | 5.76e-01 | 0.1662 |
| 8882 | ZPR1 | P20T-E | Human | Esophagus | ESCC | 1.13e-16 | 3.42e-01 | 0.1124 |
| 8882 | ZPR1 | P21T-E | Human | Esophagus | ESCC | 8.52e-41 | 9.79e-01 | 0.1617 |
| Page: 1 2 3 4 5 6 |
| Tissue | Expression Dynamics | Abbreviation |
| Esophagus | 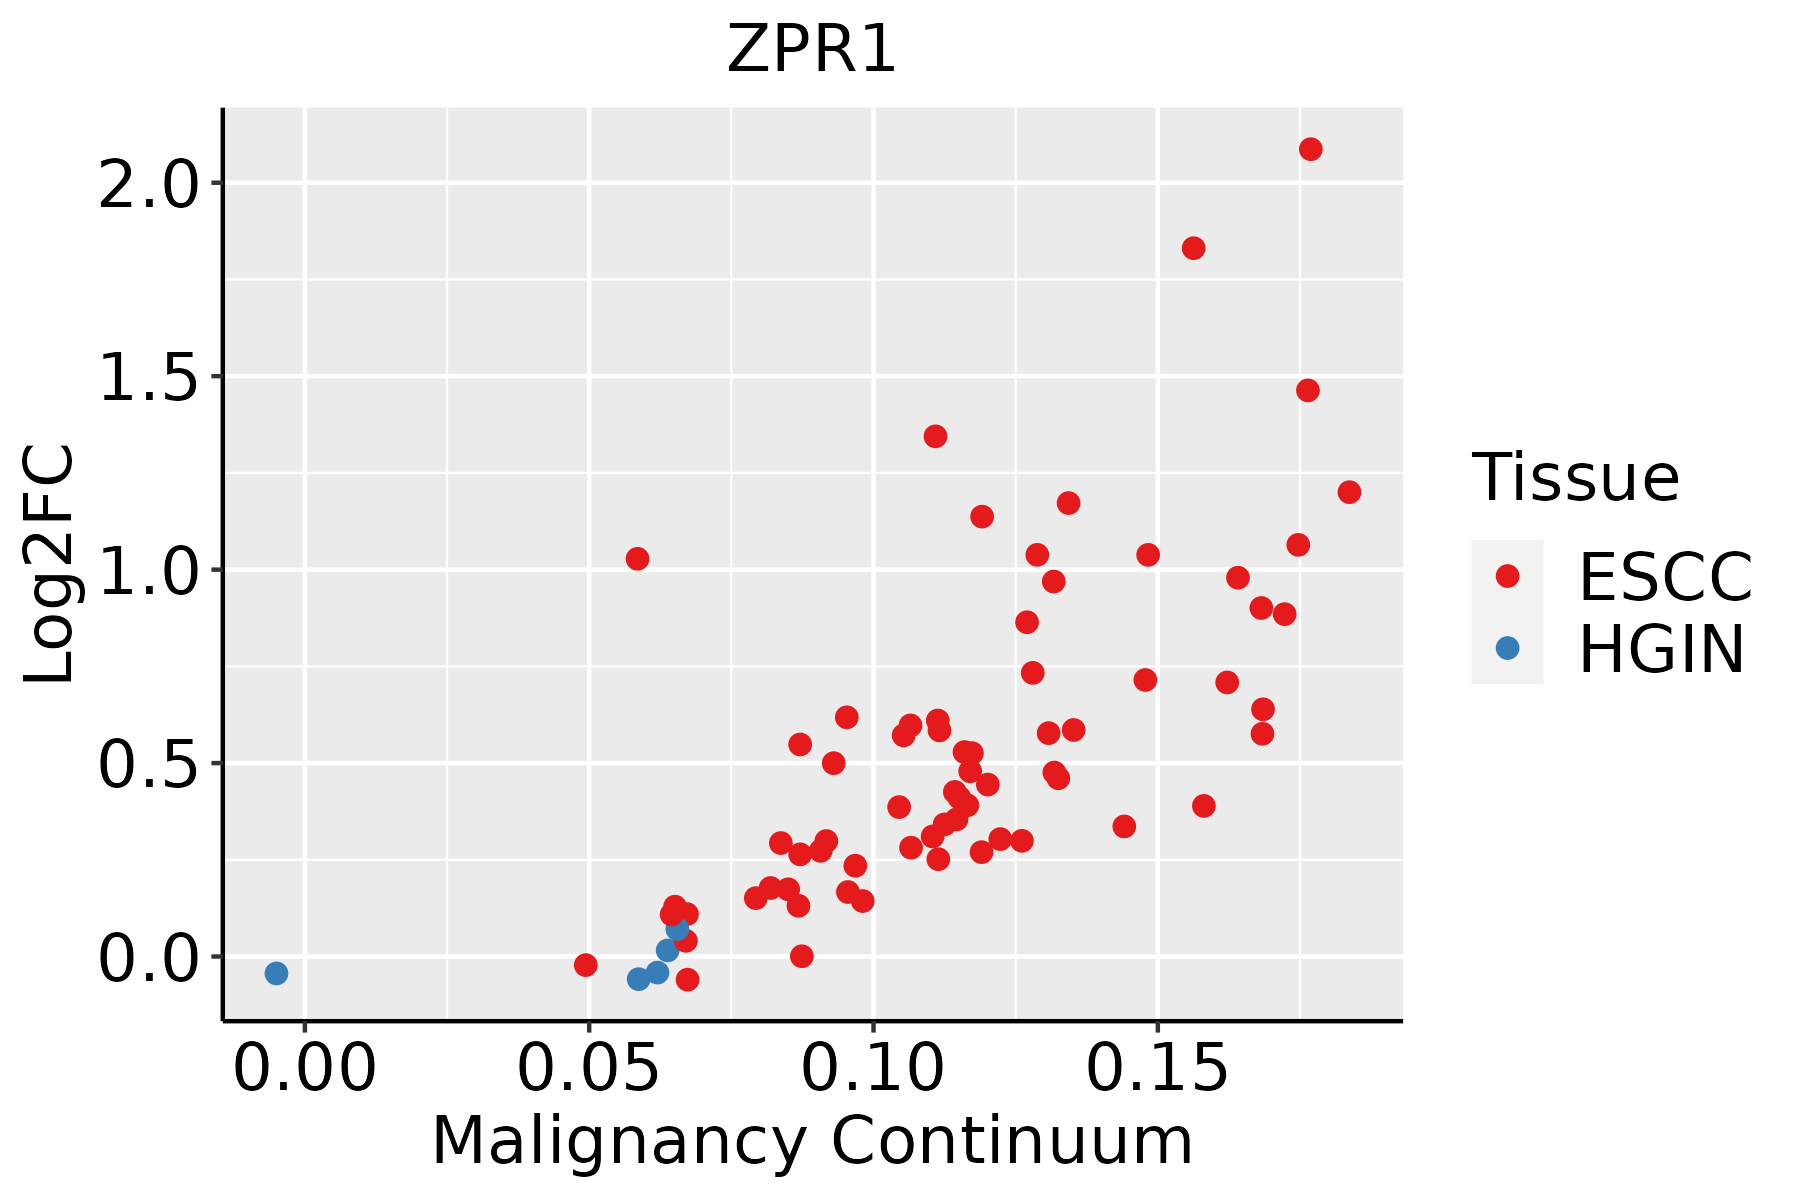 | ESCC: Esophageal squamous cell carcinoma |
| HGIN: High-grade intraepithelial neoplasias | ||
| LGIN: Low-grade intraepithelial neoplasias | ||
| Liver |  | HCC: Hepatocellular carcinoma |
| NAFLD: Non-alcoholic fatty liver disease | ||
| Oral Cavity | 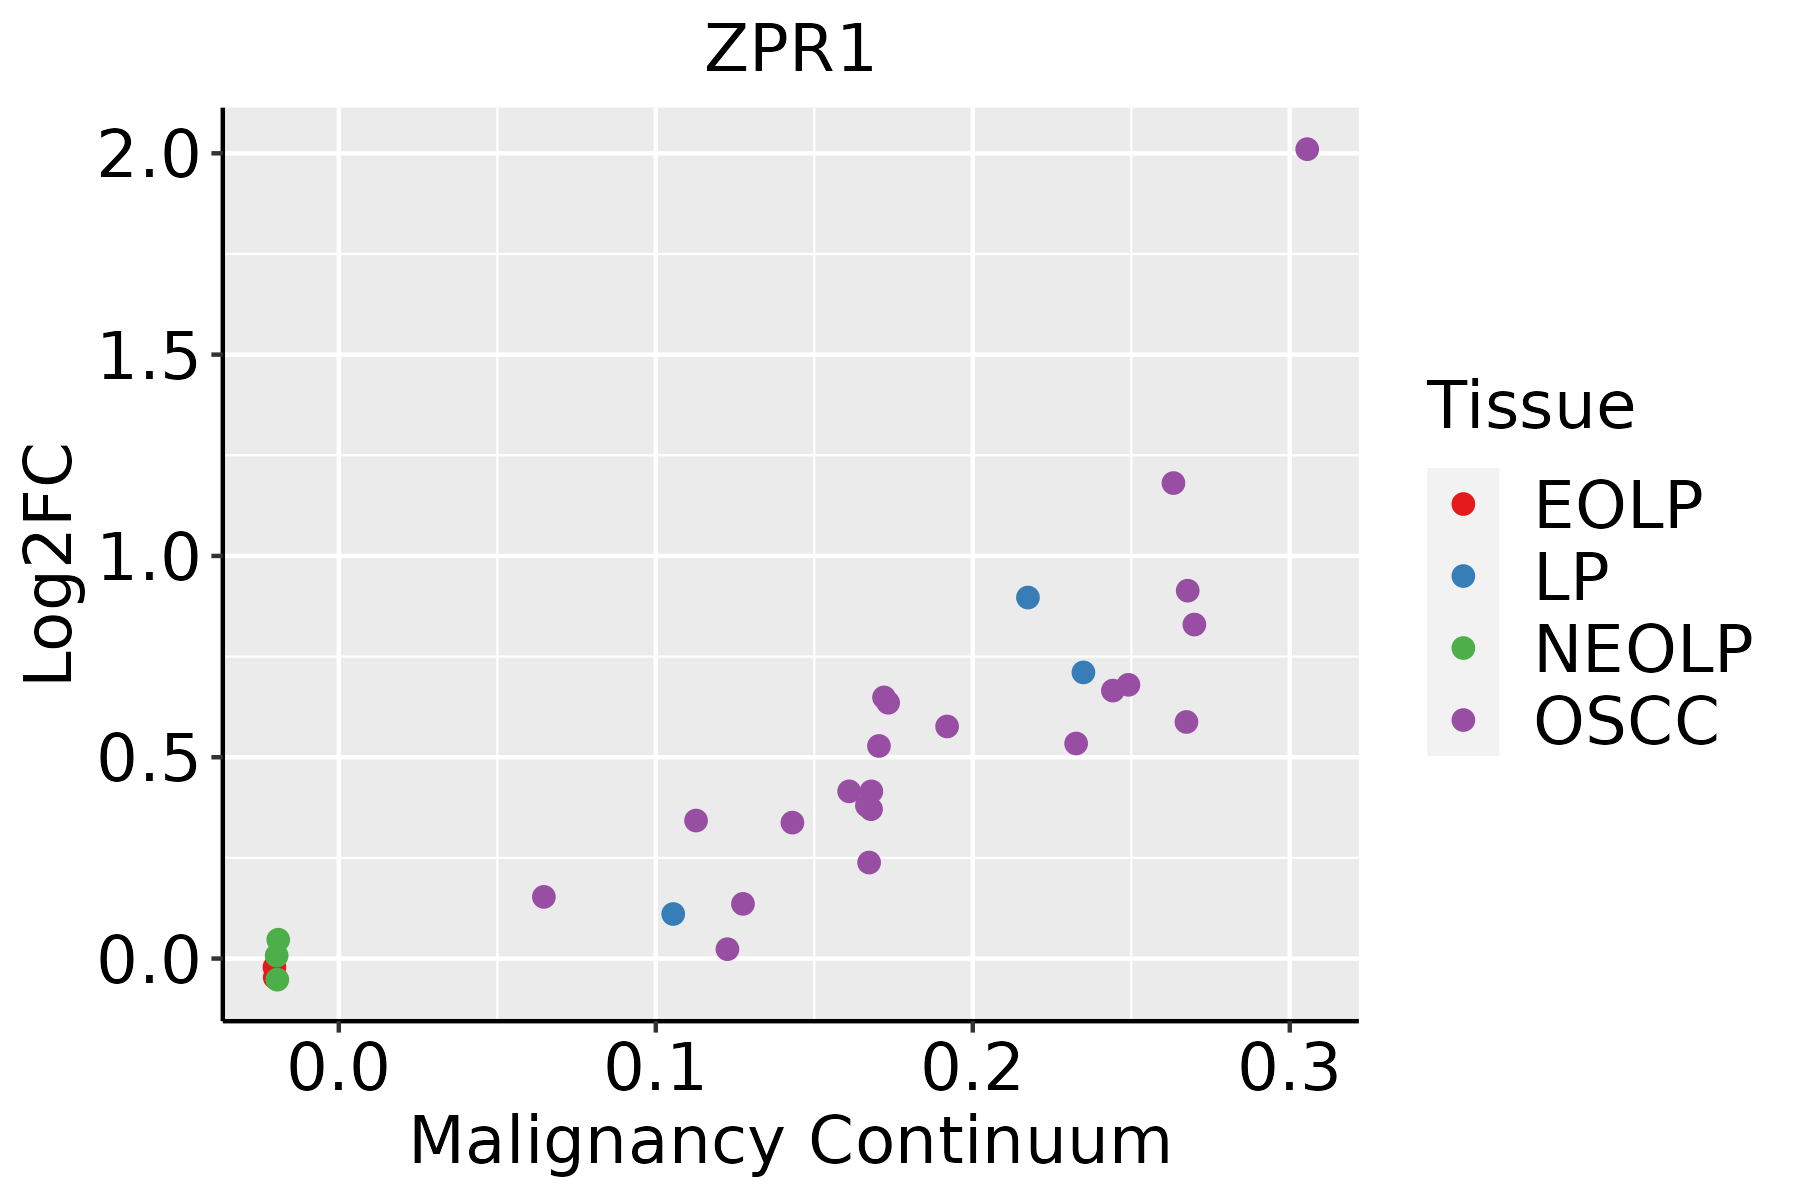 | EOLP: Erosive Oral lichen planus |
| LP: leukoplakia | ||
| NEOLP: Non-erosive oral lichen planus | ||
| OSCC: Oral squamous cell carcinoma | ||
| Thyroid | 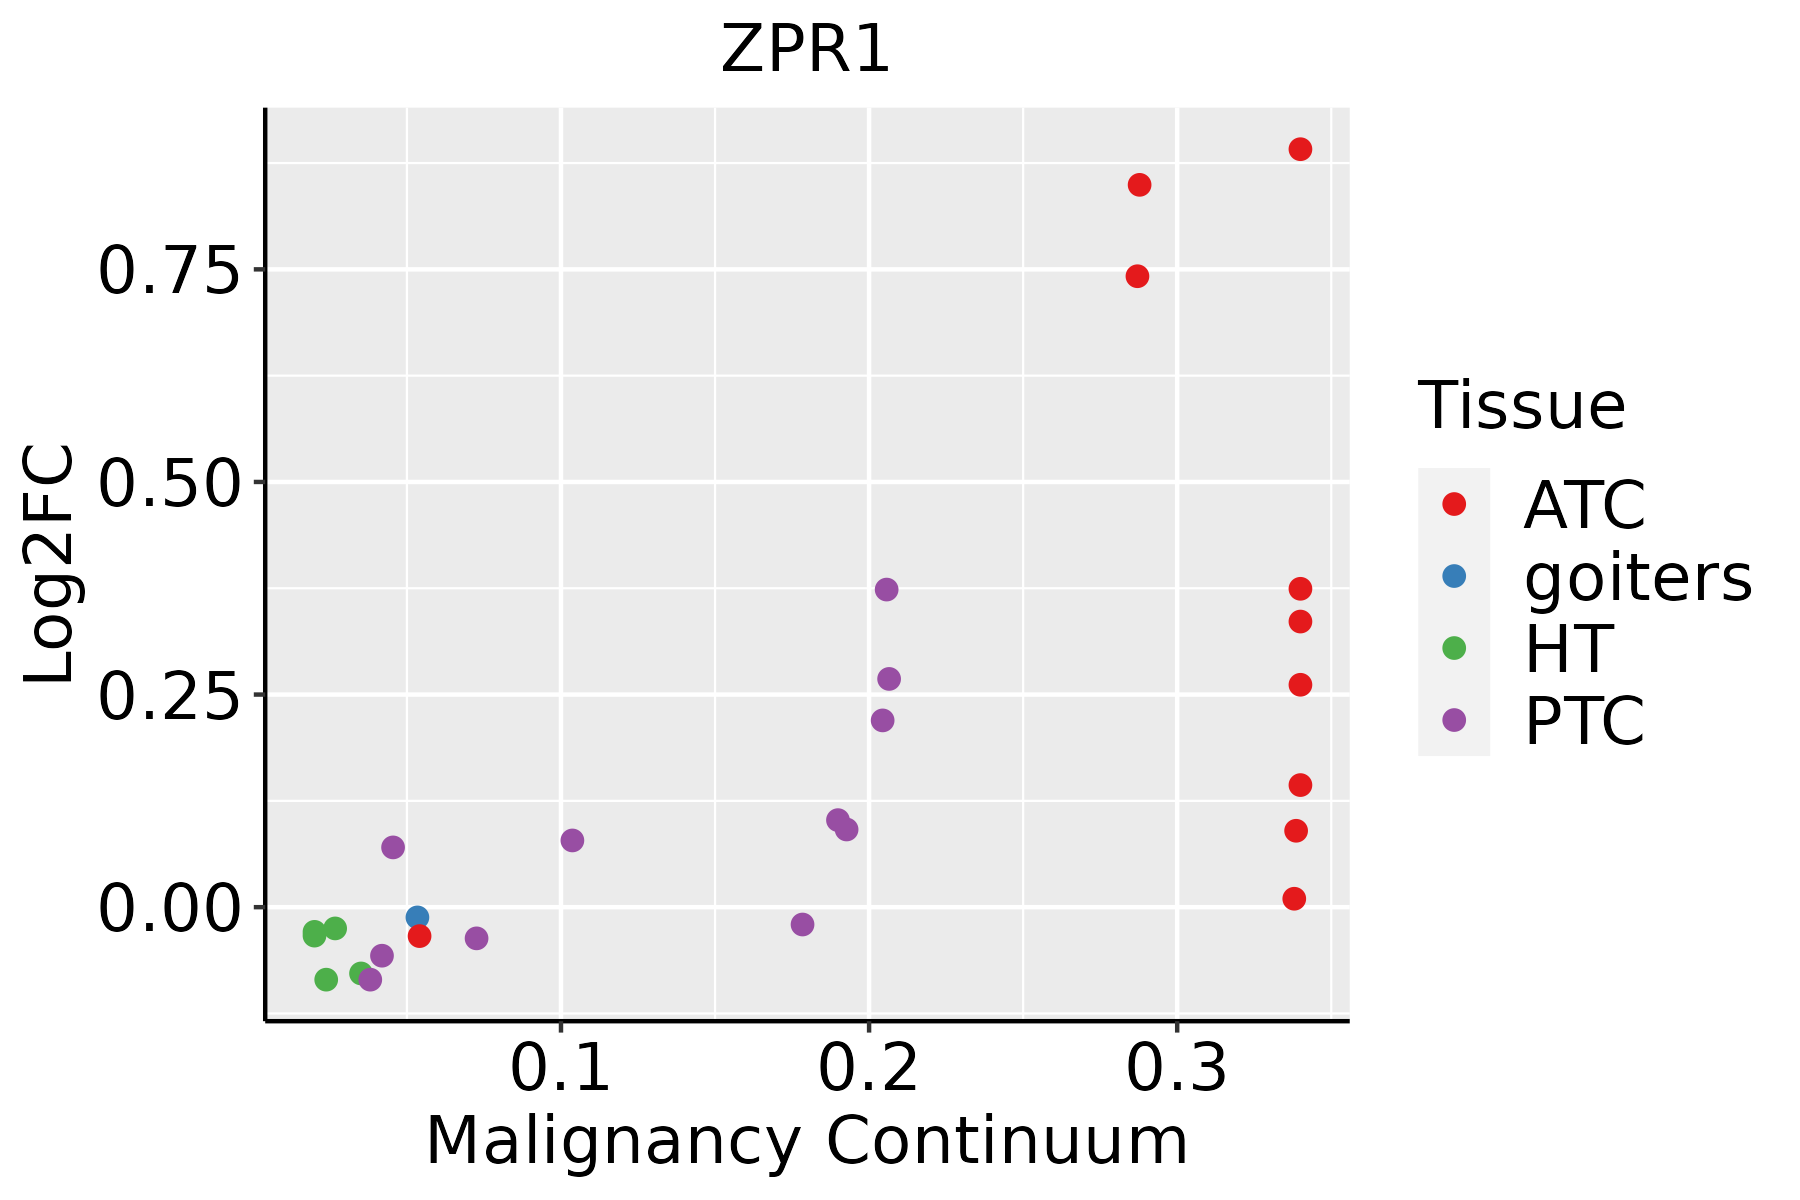 | ATC: Anaplastic thyroid cancer |
| HT: Hashimoto's thyroiditis | ||
| PTC: Papillary thyroid cancer |
| ∗log2FC in expression of this searched gene in stem-like cells from each diseased tissue sample relative to stem-like cells in normal samples in each tissue plotted against the malignancy continuum. Samples are colored based on if they are from different disease stage. |
Top |
Malignant transformation related pathway analysis |
| Find out the enriched GO biological processes and KEGG pathways involved in transition from healthy to precancer to cancer |
| Tissue | Disease Stage | Enriched GO biological Processes |
| Colorectum | AD |  |
| Colorectum | SER |  |
| Colorectum | MSS |  |
| Colorectum | MSI-H |  |
| Colorectum | FAP |  |
| ∗Top 15 enriched GO BP terms are showed in the bar plot of each disease state in each tissue. Each row represents a significant GO biological process which is colored according to the -log10(p.adjust). |
| Page: 1 2 3 4 5 6 7 8 9 |
| GO ID | Tissue | Disease Stage | Description | Gene Ratio | Bg Ratio | pvalue | p.adjust | Count |
| GO:0008380111 | Esophagus | ESCC | RNA splicing | 336/8552 | 434/18723 | 1.74e-42 | 3.67e-39 | 336 |
| GO:0072594110 | Esophagus | ESCC | establishment of protein localization to organelle | 311/8552 | 422/18723 | 3.02e-32 | 2.13e-29 | 311 |
| GO:0006913110 | Esophagus | ESCC | nucleocytoplasmic transport | 230/8552 | 301/18723 | 6.04e-28 | 2.02e-25 | 230 |
| GO:0051169110 | Esophagus | ESCC | nuclear transport | 230/8552 | 301/18723 | 6.04e-28 | 2.02e-25 | 230 |
| GO:003238618 | Esophagus | ESCC | regulation of intracellular transport | 243/8552 | 337/18723 | 3.20e-23 | 7.25e-21 | 243 |
| GO:0006401110 | Esophagus | ESCC | RNA catabolic process | 204/8552 | 278/18723 | 3.39e-21 | 5.66e-19 | 204 |
| GO:003450418 | Esophagus | ESCC | protein localization to nucleus | 211/8552 | 290/18723 | 4.06e-21 | 6.60e-19 | 211 |
| GO:1903829111 | Esophagus | ESCC | positive regulation of cellular protein localization | 199/8552 | 276/18723 | 2.99e-19 | 3.45e-17 | 199 |
| GO:0034655110 | Esophagus | ESCC | nucleobase-containing compound catabolic process | 272/8552 | 407/18723 | 2.92e-18 | 2.90e-16 | 272 |
| GO:0033157110 | Esophagus | ESCC | regulation of intracellular protein transport | 169/8552 | 229/18723 | 3.31e-18 | 3.23e-16 | 169 |
| GO:004477216 | Esophagus | ESCC | mitotic cell cycle phase transition | 281/8552 | 424/18723 | 4.63e-18 | 4.45e-16 | 281 |
| GO:0032388110 | Esophagus | ESCC | positive regulation of intracellular transport | 152/8552 | 202/18723 | 7.89e-18 | 7.36e-16 | 152 |
| GO:0043484111 | Esophagus | ESCC | regulation of RNA splicing | 116/8552 | 148/18723 | 3.18e-16 | 2.38e-14 | 116 |
| GO:000170119 | Esophagus | ESCC | in utero embryonic development | 243/8552 | 367/18723 | 1.00e-15 | 6.86e-14 | 243 |
| GO:1904951111 | Esophagus | ESCC | positive regulation of establishment of protein localization | 216/8552 | 319/18723 | 1.01e-15 | 6.86e-14 | 216 |
| GO:004670018 | Esophagus | ESCC | heterocycle catabolic process | 286/8552 | 445/18723 | 1.12e-15 | 7.47e-14 | 286 |
| GO:0046822110 | Esophagus | ESCC | regulation of nucleocytoplasmic transport | 88/8552 | 106/18723 | 1.88e-15 | 1.19e-13 | 88 |
| GO:009031617 | Esophagus | ESCC | positive regulation of intracellular protein transport | 122/8552 | 160/18723 | 2.45e-15 | 1.49e-13 | 122 |
| GO:004427019 | Esophagus | ESCC | cellular nitrogen compound catabolic process | 288/8552 | 451/18723 | 3.03e-15 | 1.79e-13 | 288 |
| GO:00062604 | Esophagus | ESCC | DNA replication | 181/8552 | 260/18723 | 3.55e-15 | 2.05e-13 | 181 |
| Page: 1 2 3 4 5 6 7 8 9 10 11 12 13 14 15 |
| Pathway ID | Tissue | Disease Stage | Description | Gene Ratio | Bg Ratio | pvalue | p.adjust | qvalue | Count |
| Page: 1 |
Top |
Cell-cell communication analysis |
| Identification of potential cell-cell interactions between two cell types and their ligand-receptor pairs for different disease states |
| Ligand | Receptor | LRpair | Pathway | Tissue | Disease Stage |
| Page: 1 |
Top |
Single-cell gene regulatory network inference analysis |
| Find out the significant the regulons (TFs) and the target genes of each regulon across cell types for different disease states |
| TF | Cell Type | Tissue | Disease Stage | Target Gene | RSS | Regulon Activity |
| ∗The dot plots of a searched regulon are shown for all cell subpopulations in each disease state of each tissue based on the regulon specific score inferred using pySCENIC and by calculating the average expression. |
| Page: 1 |
Top |
Somatic mutation of malignant transformation related genes |
| Annotation of somatic variants for genes involved in malignant transformation |
| Hugo Symbol | Variant Class | Variant Classification | dbSNP RS | HGVSc | HGVSp | HGVSp Short | SWISSPROT | BIOTYPE | SIFT | PolyPhen | Tumor Sample Barcode | Tissue | Histology | Sex | Age | Stage | Therapy Types | Drugs | Outcome |
| ZPR1 | SNV | Missense_Mutation | rs148642555 | c.1376N>A | p.Arg459Gln | p.R459Q | O75312 | protein_coding | tolerated_low_confidence(0.06) | probably_damaging(0.978) | TCGA-D8-A1XK-01 | Breast | breast invasive carcinoma | Female | <65 | I/II | Chemotherapy | doxorubicine+cyclophosphamide | SD |
| ZPR1 | SNV | Missense_Mutation | novel | c.1170N>T | p.Lys390Asn | p.K390N | O75312 | protein_coding | deleterious(0.04) | probably_damaging(0.923) | TCGA-D8-A4Z1-01 | Breast | breast invasive carcinoma | Female | >=65 | I/II | Hormone Therapy | tamoxiphen | SD |
| ZPR1 | SNV | Missense_Mutation | novel | c.346N>A | p.Glu116Lys | p.E116K | O75312 | protein_coding | deleterious(0.02) | benign(0.41) | TCGA-EW-A1OV-01 | Breast | breast invasive carcinoma | Female | <65 | I/II | Chemotherapy | epirubicin | SD |
| ZPR1 | SNV | Missense_Mutation | novel | c.509C>T | p.Ala170Val | p.A170V | O75312 | protein_coding | deleterious(0.05) | benign(0.053) | TCGA-ZJ-A8QR-01 | Cervix | cervical & endocervical cancer | Female | <65 | I/II | Unknown | Unknown | SD |
| ZPR1 | SNV | Missense_Mutation | c.233N>C | p.Phe78Ser | p.F78S | O75312 | protein_coding | deleterious(0) | probably_damaging(1) | TCGA-AA-3492-01 | Colorectum | colon adenocarcinoma | Female | >=65 | I/II | Unknown | Unknown | SD | |
| ZPR1 | SNV | Missense_Mutation | c.521N>T | p.Arg174Ile | p.R174I | O75312 | protein_coding | deleterious(0) | possibly_damaging(0.465) | TCGA-AA-3984-01 | Colorectum | colon adenocarcinoma | Female | <65 | I/II | Unknown | Unknown | SD | |
| ZPR1 | SNV | Missense_Mutation | novel | c.763N>C | p.Phe255Leu | p.F255L | O75312 | protein_coding | deleterious(0) | possibly_damaging(0.694) | TCGA-AD-6964-01 | Colorectum | colon adenocarcinoma | Male | <65 | III/IV | Chemotherapy | folfox | PD |
| ZPR1 | SNV | Missense_Mutation | c.521G>T | p.Arg174Ile | p.R174I | O75312 | protein_coding | deleterious(0) | possibly_damaging(0.465) | TCGA-CA-6718-01 | Colorectum | colon adenocarcinoma | Male | <65 | I/II | Unknown | Unknown | PD | |
| ZPR1 | SNV | Missense_Mutation | rs529843898 | c.796N>A | p.Ala266Thr | p.A266T | O75312 | protein_coding | tolerated(0.16) | benign(0.095) | TCGA-F4-6856-01 | Colorectum | colon adenocarcinoma | Male | <65 | I/II | Ancillary | leucovorin | CR |
| ZPR1 | SNV | Missense_Mutation | c.521N>T | p.Arg174Ile | p.R174I | O75312 | protein_coding | deleterious(0) | possibly_damaging(0.465) | TCGA-AG-A002-01 | Colorectum | rectum adenocarcinoma | Male | <65 | I/II | Unknown | Unknown | SD |
| Page: 1 2 3 4 |
Top |
Related drugs of malignant transformation related genes |
| Identification of chemicals and drugs interact with genes involved in malignant transfromation |
| (DGIdb 4.0) |
| Entrez ID | Symbol | Category | Interaction Types | Drug Claim Name | Drug Name | PMIDs |
| Page: 1 |

Copyright 2023-Present -The University of Texas Health Science Center at Houston |