
|
|||||
|
 | |
| |
| |
| |
| |
| |
|
Gene: ZNRF3 |
Gene summary for ZNRF3 |
| Gene information | Species | Human | Gene symbol | ZNRF3 | Gene ID | 84133 |
| Gene name | zinc and ring finger 3 | |
| Gene Alias | BK747E2.3 | |
| Cytomap | 22q12.1 | |
| Gene Type | protein-coding | GO ID | GO:0001736 | UniProtAcc | A0A024R1J1 |
Top |
Malignant transformation analysis |
| Identification of the aberrant gene expression in precancerous and cancerous lesions by comparing the gene expression of stem-like cells in diseased tissues with normal stem cells |
| Entrez ID | Symbol | Replicates | Species | Organ | Tissue | Adj P-value | Log2FC | Malignancy |
| 84133 | ZNRF3 | CA_HPV_1 | Human | Cervix | CC | 3.63e-03 | -9.93e-02 | 0.0264 |
| 84133 | ZNRF3 | CCI_2 | Human | Cervix | CC | 3.97e-05 | 7.61e-01 | 0.5249 |
| 84133 | ZNRF3 | CCI_3 | Human | Cervix | CC | 5.17e-08 | 8.69e-01 | 0.516 |
| 84133 | ZNRF3 | HTA11_2487_2000001011 | Human | Colorectum | SER | 5.15e-07 | -5.82e-01 | -0.1808 |
| 84133 | ZNRF3 | HTA11_2951_2000001011 | Human | Colorectum | AD | 3.21e-03 | 6.37e-01 | 0.0216 |
| 84133 | ZNRF3 | HTA11_411_2000001011 | Human | Colorectum | SER | 1.01e-02 | -6.91e-01 | -0.2602 |
| 84133 | ZNRF3 | HTA11_2112_2000001011 | Human | Colorectum | SER | 7.18e-03 | -7.52e-01 | -0.2196 |
| 84133 | ZNRF3 | HTA11_1391_2000001011 | Human | Colorectum | AD | 7.96e-03 | 7.29e-01 | -0.059 |
| 84133 | ZNRF3 | HTA11_2992_2000001011 | Human | Colorectum | SER | 1.28e-02 | -6.36e-01 | -0.1706 |
| 84133 | ZNRF3 | HTA11_5212_2000001011 | Human | Colorectum | AD | 1.26e-02 | -6.56e-01 | -0.2061 |
| 84133 | ZNRF3 | HTA11_866_3004761011 | Human | Colorectum | AD | 1.63e-09 | 7.73e-01 | 0.096 |
| 84133 | ZNRF3 | HTA11_7663_2000001011 | Human | Colorectum | SER | 5.31e-03 | 7.67e-01 | 0.0131 |
| 84133 | ZNRF3 | HTA11_10711_2000001011 | Human | Colorectum | AD | 2.51e-06 | 7.57e-01 | 0.0338 |
| 84133 | ZNRF3 | HTA11_7696_3000711011 | Human | Colorectum | AD | 4.25e-10 | 8.47e-01 | 0.0674 |
| 84133 | ZNRF3 | HTA11_99999970781_79442 | Human | Colorectum | MSS | 8.30e-03 | 4.69e-01 | 0.294 |
| 84133 | ZNRF3 | HTA11_99999965062_69753 | Human | Colorectum | MSI-H | 6.44e-05 | 9.05e-01 | 0.3487 |
| 84133 | ZNRF3 | HTA11_99999965104_69814 | Human | Colorectum | MSS | 8.66e-06 | 6.57e-01 | 0.281 |
| 84133 | ZNRF3 | HTA11_99999971662_82457 | Human | Colorectum | MSS | 1.87e-20 | 1.28e+00 | 0.3859 |
| 84133 | ZNRF3 | HTA11_99999973899_84307 | Human | Colorectum | MSS | 1.86e-17 | 1.68e+00 | 0.2585 |
| 84133 | ZNRF3 | HTA11_99999974143_84620 | Human | Colorectum | MSS | 2.61e-03 | 5.22e-01 | 0.3005 |
| Page: 1 2 3 4 5 |
| Tissue | Expression Dynamics | Abbreviation |
| Cervix |  | CC: Cervix cancer |
| HSIL_HPV: HPV-infected high-grade squamous intraepithelial lesions | ||
| N_HPV: HPV-infected normal cervix | ||
| Colorectum (GSE201348) |  | FAP: Familial adenomatous polyposis |
| CRC: Colorectal cancer | ||
| Colorectum (HTA11) |  | AD: Adenomas |
| SER: Sessile serrated lesions | ||
| MSI-H: Microsatellite-high colorectal cancer | ||
| MSS: Microsatellite stable colorectal cancer | ||
| Endometrium |  | AEH: Atypical endometrial hyperplasia |
| EEC: Endometrioid Cancer | ||
| Liver |  | HCC: Hepatocellular carcinoma |
| NAFLD: Non-alcoholic fatty liver disease | ||
| Lung | 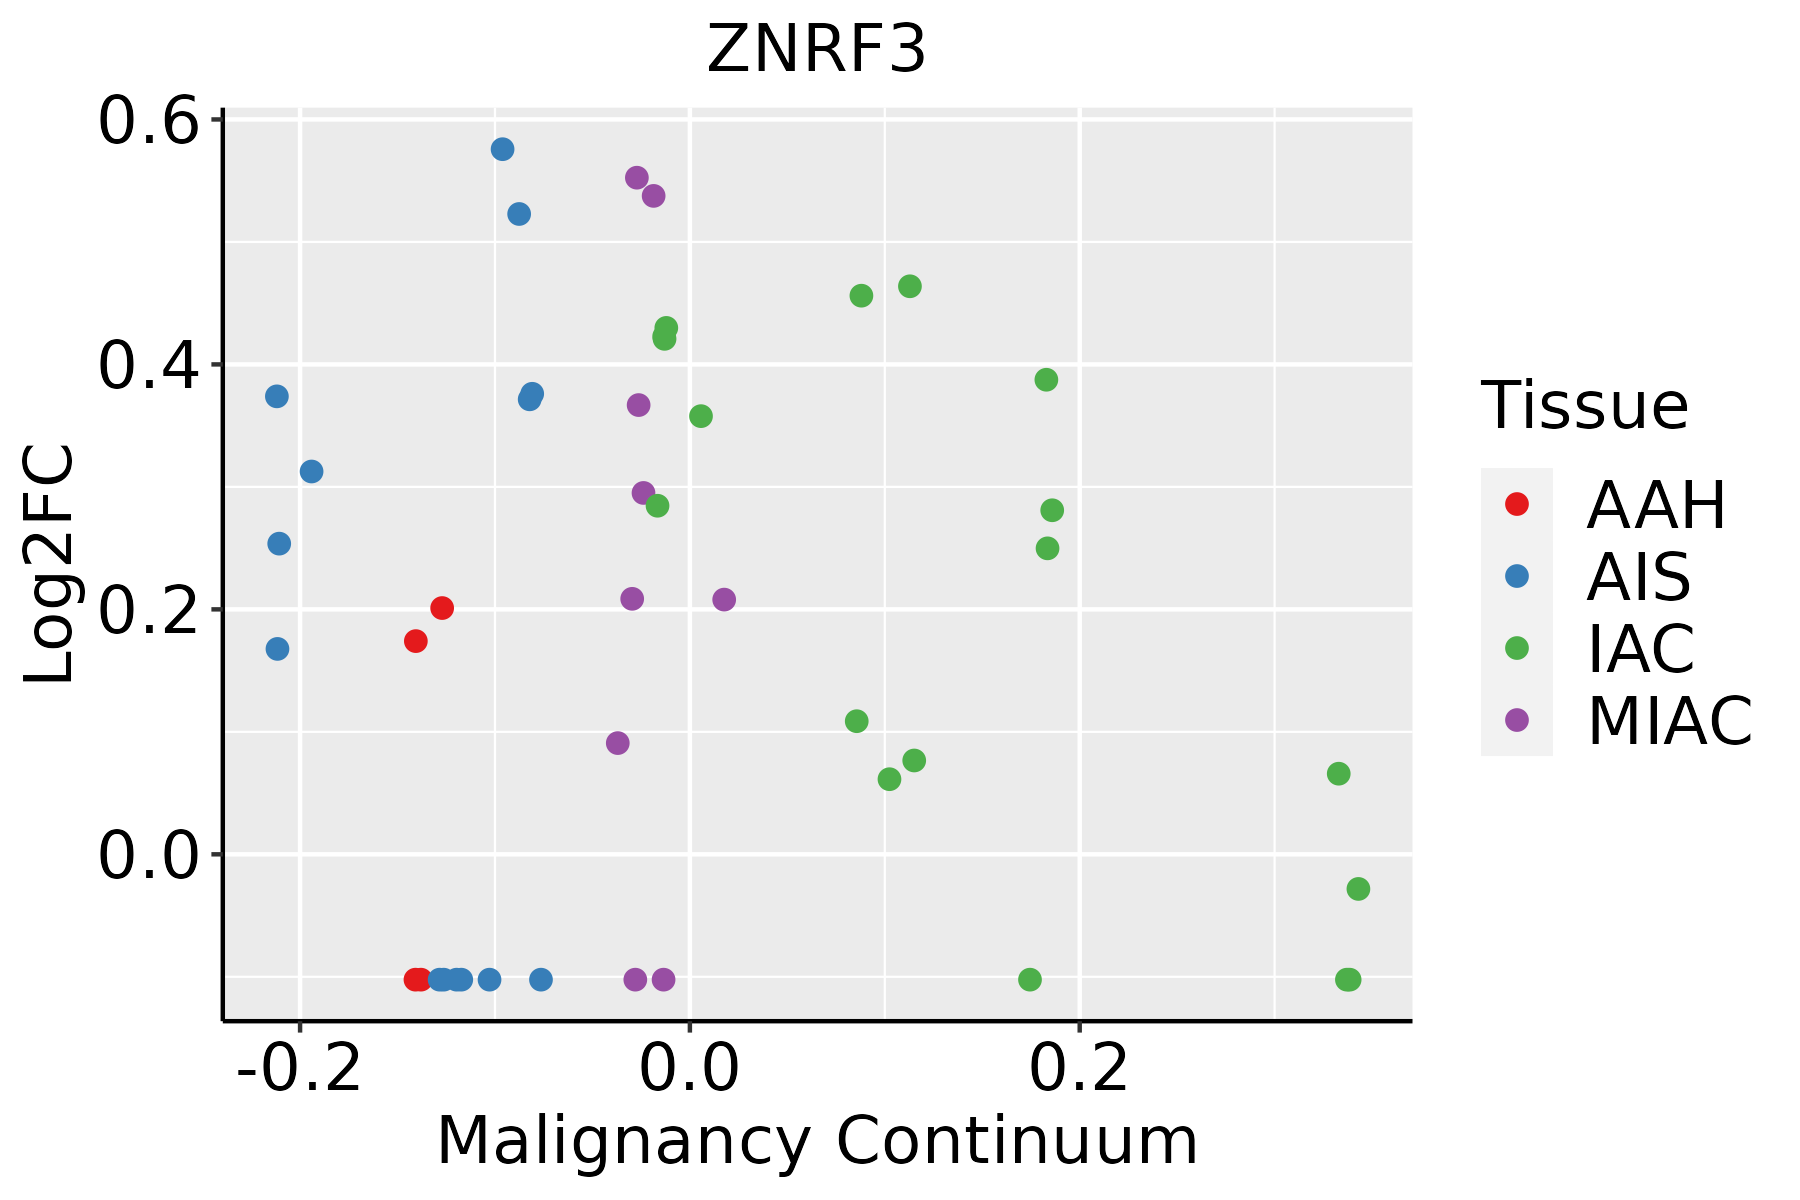 | AAH: Atypical adenomatous hyperplasia |
| AIS: Adenocarcinoma in situ | ||
| IAC: Invasive lung adenocarcinoma | ||
| MIA: Minimally invasive adenocarcinoma | ||
| Prostate | 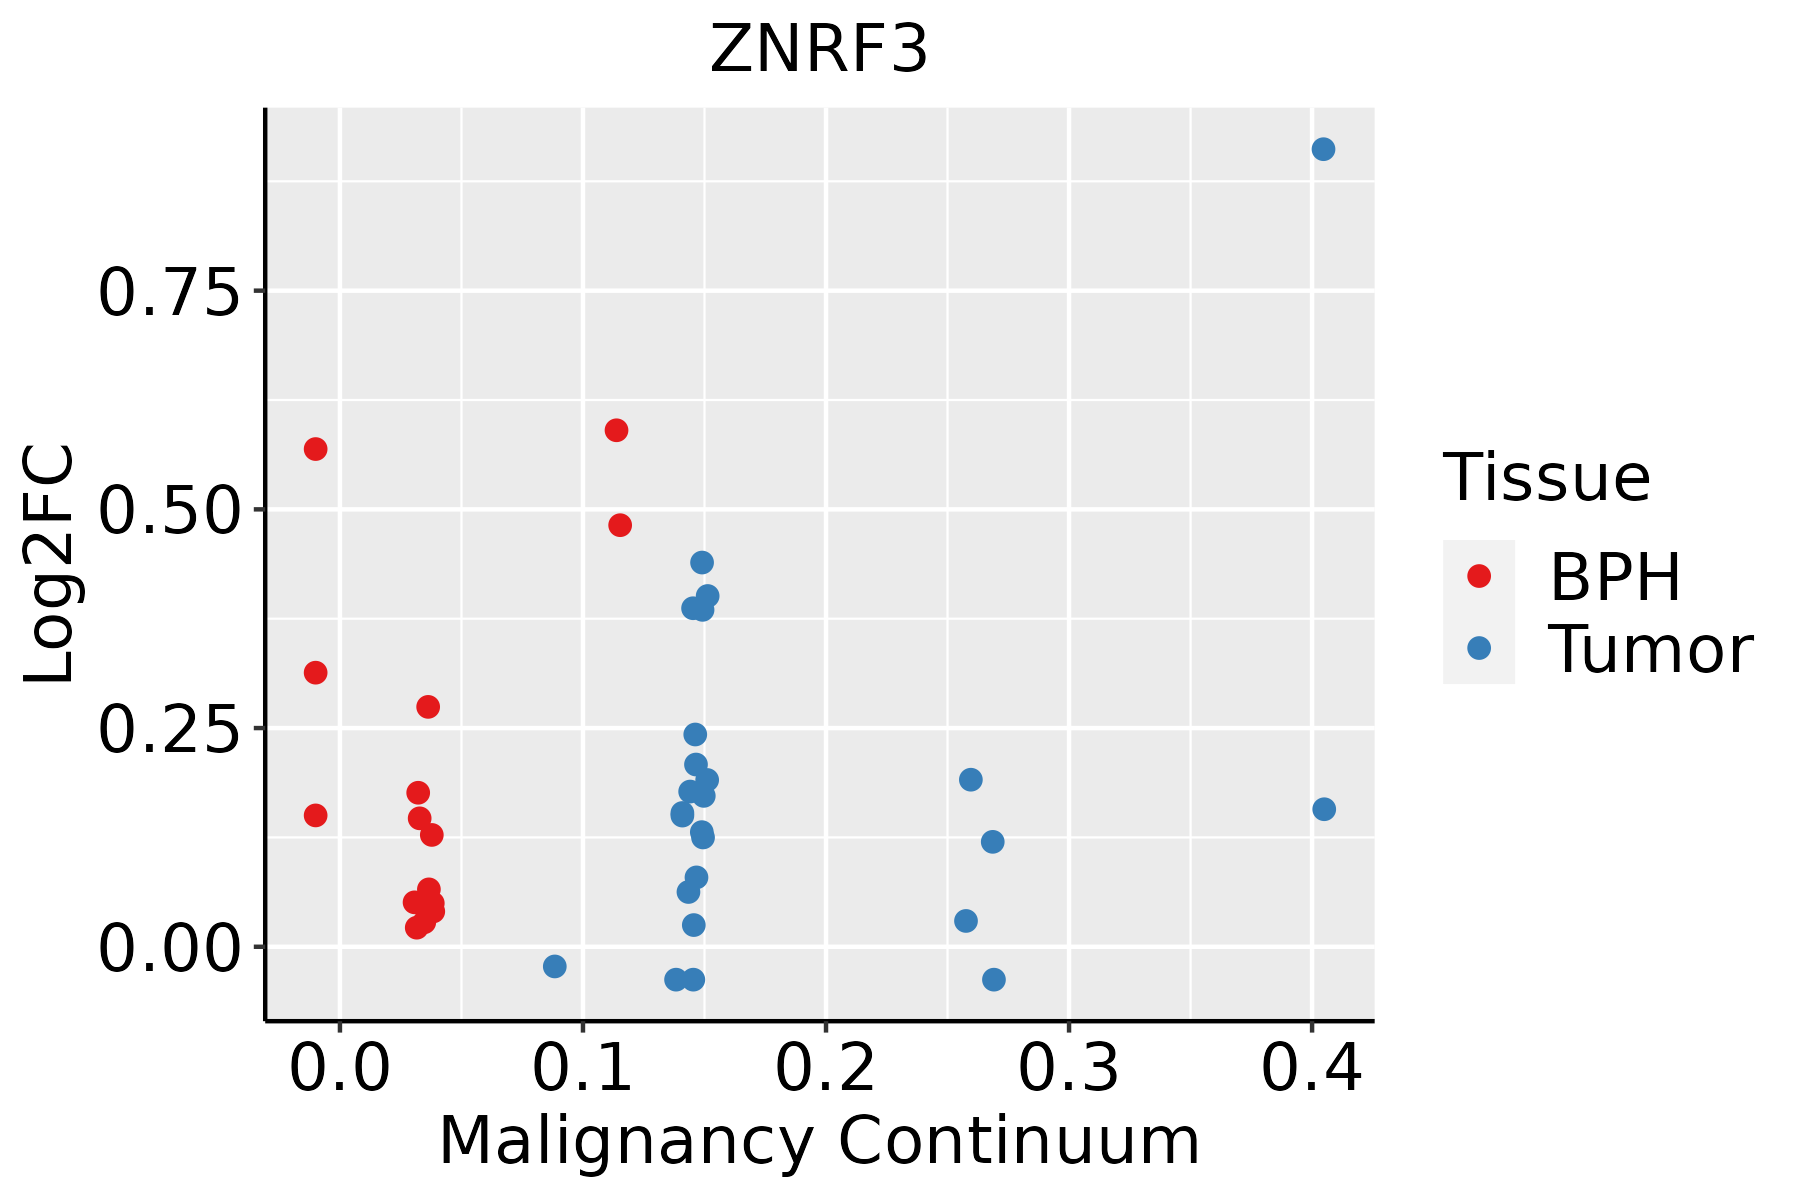 | BPH: Benign Prostatic Hyperplasia |
| ∗log2FC in expression of this searched gene in stem-like cells from each diseased tissue sample relative to stem-like cells in normal samples in each tissue plotted against the malignancy continuum. Samples are colored based on if they are from different disease stage. |
Top |
Malignant transformation related pathway analysis |
| Find out the enriched GO biological processes and KEGG pathways involved in transition from healthy to precancer to cancer |
| Tissue | Disease Stage | Enriched GO biological Processes |
| Colorectum | AD |  |
| Colorectum | SER |  |
| Colorectum | MSS |  |
| Colorectum | MSI-H |  |
| Colorectum | FAP |  |
| ∗Top 15 enriched GO BP terms are showed in the bar plot of each disease state in each tissue. Each row represents a significant GO biological process which is colored according to the -log10(p.adjust). |
| Page: 1 2 3 4 5 6 7 8 9 |
| GO ID | Tissue | Disease Stage | Description | Gene Ratio | Bg Ratio | pvalue | p.adjust | Count |
| GO:00160557 | Cervix | CC | Wnt signaling pathway | 98/2311 | 444/18723 | 4.82e-09 | 4.65e-07 | 98 |
| GO:01987387 | Cervix | CC | cell-cell signaling by wnt | 98/2311 | 446/18723 | 6.16e-09 | 5.58e-07 | 98 |
| GO:00301117 | Cervix | CC | regulation of Wnt signaling pathway | 76/2311 | 328/18723 | 3.05e-08 | 2.08e-06 | 76 |
| GO:00608287 | Cervix | CC | regulation of canonical Wnt signaling pathway | 58/2311 | 253/18723 | 1.83e-06 | 5.89e-05 | 58 |
| GO:00600707 | Cervix | CC | canonical Wnt signaling pathway | 66/2311 | 303/18723 | 2.47e-06 | 7.35e-05 | 66 |
| GO:00431127 | Cervix | CC | receptor metabolic process | 37/2311 | 166/18723 | 2.31e-04 | 2.58e-03 | 37 |
| GO:00301784 | Cervix | CC | negative regulation of Wnt signaling pathway | 35/2311 | 170/18723 | 1.52e-03 | 1.17e-02 | 35 |
| GO:00487365 | Cervix | CC | appendage development | 35/2311 | 172/18723 | 1.88e-03 | 1.39e-02 | 35 |
| GO:00601735 | Cervix | CC | limb development | 35/2311 | 172/18723 | 1.88e-03 | 1.39e-02 | 35 |
| GO:00017384 | Cervix | CC | morphogenesis of a polarized epithelium | 22/2311 | 94/18723 | 2.09e-03 | 1.52e-02 | 22 |
| GO:00900901 | Cervix | CC | negative regulation of canonical Wnt signaling pathway | 29/2311 | 137/18723 | 2.40e-03 | 1.70e-02 | 29 |
| GO:00901752 | Cervix | CC | regulation of establishment of planar polarity | 14/2311 | 56/18723 | 6.93e-03 | 3.74e-02 | 14 |
| GO:00600712 | Cervix | CC | Wnt signaling pathway, planar cell polarity pathway | 13/2311 | 52/18723 | 9.09e-03 | 4.60e-02 | 13 |
| GO:0043112 | Colorectum | AD | receptor metabolic process | 62/3918 | 166/18723 | 8.18e-07 | 2.85e-05 | 62 |
| GO:0030111 | Colorectum | AD | regulation of Wnt signaling pathway | 102/3918 | 328/18723 | 8.51e-06 | 2.03e-04 | 102 |
| GO:0016055 | Colorectum | AD | Wnt signaling pathway | 130/3918 | 444/18723 | 1.60e-05 | 3.37e-04 | 130 |
| GO:0198738 | Colorectum | AD | cell-cell signaling by wnt | 130/3918 | 446/18723 | 2.02e-05 | 4.10e-04 | 130 |
| GO:0060070 | Colorectum | AD | canonical Wnt signaling pathway | 90/3918 | 303/18723 | 1.76e-04 | 2.38e-03 | 90 |
| GO:0060828 | Colorectum | AD | regulation of canonical Wnt signaling pathway | 77/3918 | 253/18723 | 2.19e-04 | 2.87e-03 | 77 |
| GO:0048736 | Colorectum | AD | appendage development | 51/3918 | 172/18723 | 4.20e-03 | 2.89e-02 | 51 |
| Page: 1 2 3 4 5 6 7 |
| Pathway ID | Tissue | Disease Stage | Description | Gene Ratio | Bg Ratio | pvalue | p.adjust | qvalue | Count |
| hsa043109 | Cervix | CC | Wnt signaling pathway | 43/1267 | 171/8465 | 3.03e-04 | 1.64e-03 | 9.68e-04 | 43 |
| hsa0431012 | Cervix | CC | Wnt signaling pathway | 43/1267 | 171/8465 | 3.03e-04 | 1.64e-03 | 9.68e-04 | 43 |
| hsa04310 | Colorectum | AD | Wnt signaling pathway | 56/2092 | 171/8465 | 1.03e-02 | 3.93e-02 | 2.51e-02 | 56 |
| hsa043101 | Colorectum | AD | Wnt signaling pathway | 56/2092 | 171/8465 | 1.03e-02 | 3.93e-02 | 2.51e-02 | 56 |
| hsa043102 | Colorectum | MSS | Wnt signaling pathway | 53/1875 | 171/8465 | 4.24e-03 | 1.86e-02 | 1.14e-02 | 53 |
| hsa043103 | Colorectum | MSS | Wnt signaling pathway | 53/1875 | 171/8465 | 4.24e-03 | 1.86e-02 | 1.14e-02 | 53 |
| hsa043104 | Colorectum | FAP | Wnt signaling pathway | 46/1404 | 171/8465 | 3.94e-04 | 3.06e-03 | 1.86e-03 | 46 |
| hsa043105 | Colorectum | FAP | Wnt signaling pathway | 46/1404 | 171/8465 | 3.94e-04 | 3.06e-03 | 1.86e-03 | 46 |
| hsa0431010 | Endometrium | AEH | Wnt signaling pathway | 37/1197 | 171/8465 | 4.68e-03 | 2.53e-02 | 1.86e-02 | 37 |
| hsa0431013 | Endometrium | AEH | Wnt signaling pathway | 37/1197 | 171/8465 | 4.68e-03 | 2.53e-02 | 1.86e-02 | 37 |
| hsa0431022 | Endometrium | EEC | Wnt signaling pathway | 40/1237 | 171/8465 | 1.37e-03 | 8.99e-03 | 6.70e-03 | 40 |
| hsa0431032 | Endometrium | EEC | Wnt signaling pathway | 40/1237 | 171/8465 | 1.37e-03 | 8.99e-03 | 6.70e-03 | 40 |
| hsa043108 | Lung | IAC | Wnt signaling pathway | 40/1053 | 171/8465 | 4.56e-05 | 7.06e-04 | 4.69e-04 | 40 |
| hsa0431011 | Lung | IAC | Wnt signaling pathway | 40/1053 | 171/8465 | 4.56e-05 | 7.06e-04 | 4.69e-04 | 40 |
| hsa0431021 | Lung | AIS | Wnt signaling pathway | 39/961 | 171/8465 | 1.29e-05 | 3.32e-04 | 2.12e-04 | 39 |
| hsa0431031 | Lung | AIS | Wnt signaling pathway | 39/961 | 171/8465 | 1.29e-05 | 3.32e-04 | 2.12e-04 | 39 |
| hsa0431014 | Prostate | BPH | Wnt signaling pathway | 50/1718 | 171/8465 | 3.11e-03 | 1.15e-02 | 7.14e-03 | 50 |
| hsa0431015 | Prostate | BPH | Wnt signaling pathway | 50/1718 | 171/8465 | 3.11e-03 | 1.15e-02 | 7.14e-03 | 50 |
| hsa0431023 | Prostate | Tumor | Wnt signaling pathway | 50/1791 | 171/8465 | 7.32e-03 | 2.37e-02 | 1.47e-02 | 50 |
| hsa0431033 | Prostate | Tumor | Wnt signaling pathway | 50/1791 | 171/8465 | 7.32e-03 | 2.37e-02 | 1.47e-02 | 50 |
| Page: 1 |
Top |
Cell-cell communication analysis |
| Identification of potential cell-cell interactions between two cell types and their ligand-receptor pairs for different disease states |
| Ligand | Receptor | LRpair | Pathway | Tissue | Disease Stage |
| Page: 1 |
Top |
Single-cell gene regulatory network inference analysis |
| Find out the significant the regulons (TFs) and the target genes of each regulon across cell types for different disease states |
| TF | Cell Type | Tissue | Disease Stage | Target Gene | RSS | Regulon Activity |
| ∗The dot plots of a searched regulon are shown for all cell subpopulations in each disease state of each tissue based on the regulon specific score inferred using pySCENIC and by calculating the average expression. |
| Page: 1 |
Top |
Somatic mutation of malignant transformation related genes |
| Annotation of somatic variants for genes involved in malignant transformation |
| Hugo Symbol | Variant Class | Variant Classification | dbSNP RS | HGVSc | HGVSp | HGVSp Short | SWISSPROT | BIOTYPE | SIFT | PolyPhen | Tumor Sample Barcode | Tissue | Histology | Sex | Age | Stage | Therapy Types | Drugs | Outcome |
| ZNRF3 | SNV | Missense_Mutation | rs758750767 | c.2434G>A | p.Glu812Lys | p.E812K | Q9ULT6 | protein_coding | deleterious_low_confidence(0.01) | benign(0.124) | TCGA-5L-AAT0-01 | Breast | breast invasive carcinoma | Female | <65 | I/II | Hormone Therapy | tamoxiphen | SD |
| ZNRF3 | SNV | Missense_Mutation | novel | c.836N>A | p.Cys279Tyr | p.C279Y | Q9ULT6 | protein_coding | tolerated(0.13) | benign(0.231) | TCGA-A2-A25B-01 | Breast | breast invasive carcinoma | Female | <65 | I/II | Chemotherapy | taxotere | PD |
| ZNRF3 | SNV | Missense_Mutation | c.2332N>T | p.Pro778Ser | p.P778S | Q9ULT6 | protein_coding | deleterious_low_confidence(0.01) | probably_damaging(0.999) | TCGA-A8-A09Z-01 | Breast | breast invasive carcinoma | Female | >=65 | I/II | Unknown | Unknown | SD | |
| ZNRF3 | SNV | Missense_Mutation | novel | c.1492G>T | p.Ala498Ser | p.A498S | Q9ULT6 | protein_coding | tolerated(0.12) | benign(0.038) | TCGA-AR-A1AL-01 | Breast | breast invasive carcinoma | Female | <65 | III/IV | Hormone Therapy | anastrozole | SD |
| ZNRF3 | SNV | Missense_Mutation | c.1066C>T | p.Arg356Cys | p.R356C | Q9ULT6 | protein_coding | deleterious(0.01) | probably_damaging(0.912) | TCGA-B6-A0WX-01 | Breast | breast invasive carcinoma | Female | <65 | III/IV | Unknown | Unknown | PD | |
| ZNRF3 | SNV | Missense_Mutation | c.810N>C | p.Lys270Asn | p.K270N | Q9ULT6 | protein_coding | deleterious(0.05) | possibly_damaging(0.621) | TCGA-D8-A1JA-01 | Breast | breast invasive carcinoma | Female | <65 | III/IV | Chemotherapy | adriamycin | PD | |
| ZNRF3 | insertion | Frame_Shift_Ins | novel | c.893_894insCAACCTCCACCTCCCGGGGTCAACT | p.Glu298AspfsTer13 | p.E298Dfs*13 | Q9ULT6 | protein_coding | TCGA-BH-A0HF-01 | Breast | breast invasive carcinoma | Female | >=65 | I/II | Hormone Therapy | arimidex | SD | ||
| ZNRF3 | insertion | Nonsense_Mutation | novel | c.895_896insGTCTCATGCCTTAGCCTCCC | p.Lys299SerfsTer5 | p.K299Sfs*5 | Q9ULT6 | protein_coding | TCGA-BH-A0HF-01 | Breast | breast invasive carcinoma | Female | >=65 | I/II | Hormone Therapy | arimidex | SD | ||
| ZNRF3 | deletion | Frame_Shift_Del | novel | c.1486delG | p.Ala496ProfsTer74 | p.A496Pfs*74 | Q9ULT6 | protein_coding | TCGA-EW-A2FV-01 | Breast | breast invasive carcinoma | Female | <65 | III/IV | Chemotherapy | docetaxel | SD | ||
| ZNRF3 | SNV | Missense_Mutation | c.622C>T | p.Arg208Cys | p.R208C | Q9ULT6 | protein_coding | deleterious(0) | possibly_damaging(0.739) | TCGA-MY-A5BF-01 | Cervix | cervical & endocervical cancer | Female | >=65 | I/II | Chemotherapy | cisplatin | CR |
| Page: 1 2 3 4 5 6 7 8 |
Top |
Related drugs of malignant transformation related genes |
| Identification of chemicals and drugs interact with genes involved in malignant transfromation |
| (DGIdb 4.0) |
| Entrez ID | Symbol | Category | Interaction Types | Drug Claim Name | Drug Name | PMIDs |
| Page: 1 |

Copyright 2023-Present -The University of Texas Health Science Center at Houston |