
|
|||||
|
 | |
| |
| |
| |
| |
| |
|
Gene: ZNHIT3 |
Gene summary for ZNHIT3 |
| Gene information | Species | Human | Gene symbol | ZNHIT3 | Gene ID | 9326 |
| Gene name | zinc finger HIT-type containing 3 | |
| Gene Alias | Hit1 | |
| Cytomap | 17q12 | |
| Gene Type | protein-coding | GO ID | GO:0000463 | UniProtAcc | Q15649 |
Top |
Malignant transformation analysis |
| Identification of the aberrant gene expression in precancerous and cancerous lesions by comparing the gene expression of stem-like cells in diseased tissues with normal stem cells |
| Entrez ID | Symbol | Replicates | Species | Organ | Tissue | Adj P-value | Log2FC | Malignancy |
| 9326 | ZNHIT3 | LZE4T | Human | Esophagus | ESCC | 5.38e-13 | 3.74e-01 | 0.0811 |
| 9326 | ZNHIT3 | LZE7T | Human | Esophagus | ESCC | 2.73e-06 | 5.65e-01 | 0.0667 |
| 9326 | ZNHIT3 | LZE8T | Human | Esophagus | ESCC | 9.56e-06 | 4.99e-02 | 0.067 |
| 9326 | ZNHIT3 | LZE20T | Human | Esophagus | ESCC | 9.81e-05 | 1.59e-01 | 0.0662 |
| 9326 | ZNHIT3 | LZE22D1 | Human | Esophagus | HGIN | 2.01e-03 | 1.54e-01 | 0.0595 |
| 9326 | ZNHIT3 | LZE22T | Human | Esophagus | ESCC | 3.11e-02 | 4.35e-01 | 0.068 |
| 9326 | ZNHIT3 | LZE24T | Human | Esophagus | ESCC | 9.79e-15 | 5.36e-01 | 0.0596 |
| 9326 | ZNHIT3 | LZE21T | Human | Esophagus | ESCC | 1.60e-06 | 2.36e-01 | 0.0655 |
| 9326 | ZNHIT3 | LZE6T | Human | Esophagus | ESCC | 2.75e-05 | 5.68e-01 | 0.0845 |
| 9326 | ZNHIT3 | P1T-E | Human | Esophagus | ESCC | 1.33e-09 | 5.25e-01 | 0.0875 |
| 9326 | ZNHIT3 | P2T-E | Human | Esophagus | ESCC | 1.20e-30 | 6.98e-01 | 0.1177 |
| 9326 | ZNHIT3 | P4T-E | Human | Esophagus | ESCC | 1.19e-47 | 1.19e+00 | 0.1323 |
| 9326 | ZNHIT3 | P5T-E | Human | Esophagus | ESCC | 2.01e-33 | 7.45e-01 | 0.1327 |
| 9326 | ZNHIT3 | P8T-E | Human | Esophagus | ESCC | 5.13e-39 | 8.14e-01 | 0.0889 |
| 9326 | ZNHIT3 | P9T-E | Human | Esophagus | ESCC | 4.87e-23 | 5.20e-01 | 0.1131 |
| 9326 | ZNHIT3 | P10T-E | Human | Esophagus | ESCC | 4.96e-20 | 3.55e-01 | 0.116 |
| 9326 | ZNHIT3 | P11T-E | Human | Esophagus | ESCC | 1.16e-17 | 9.19e-01 | 0.1426 |
| 9326 | ZNHIT3 | P12T-E | Human | Esophagus | ESCC | 4.21e-40 | 7.11e-01 | 0.1122 |
| 9326 | ZNHIT3 | P15T-E | Human | Esophagus | ESCC | 2.31e-40 | 8.99e-01 | 0.1149 |
| 9326 | ZNHIT3 | P16T-E | Human | Esophagus | ESCC | 1.62e-30 | 6.88e-01 | 0.1153 |
| Page: 1 2 3 4 5 6 |
| Tissue | Expression Dynamics | Abbreviation |
| Esophagus | 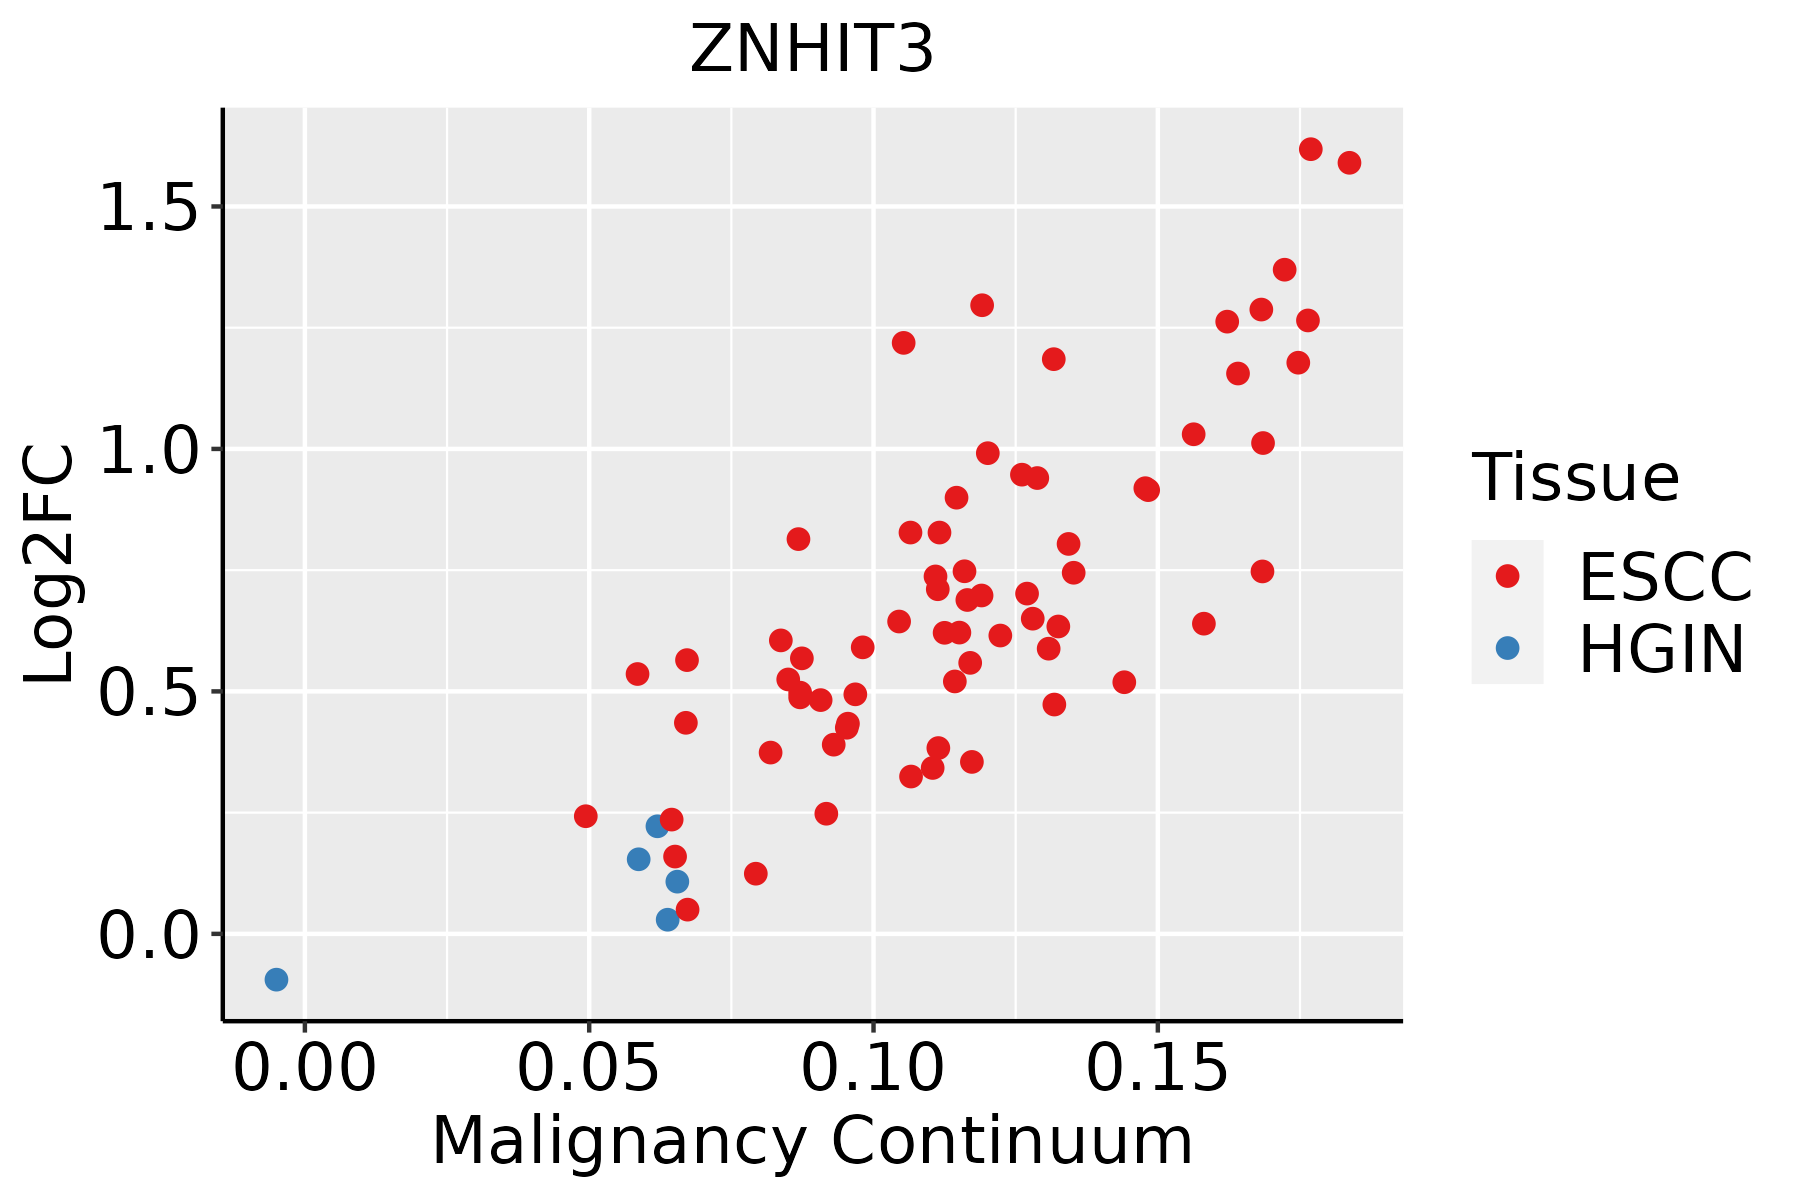 | ESCC: Esophageal squamous cell carcinoma |
| HGIN: High-grade intraepithelial neoplasias | ||
| LGIN: Low-grade intraepithelial neoplasias | ||
| Liver | 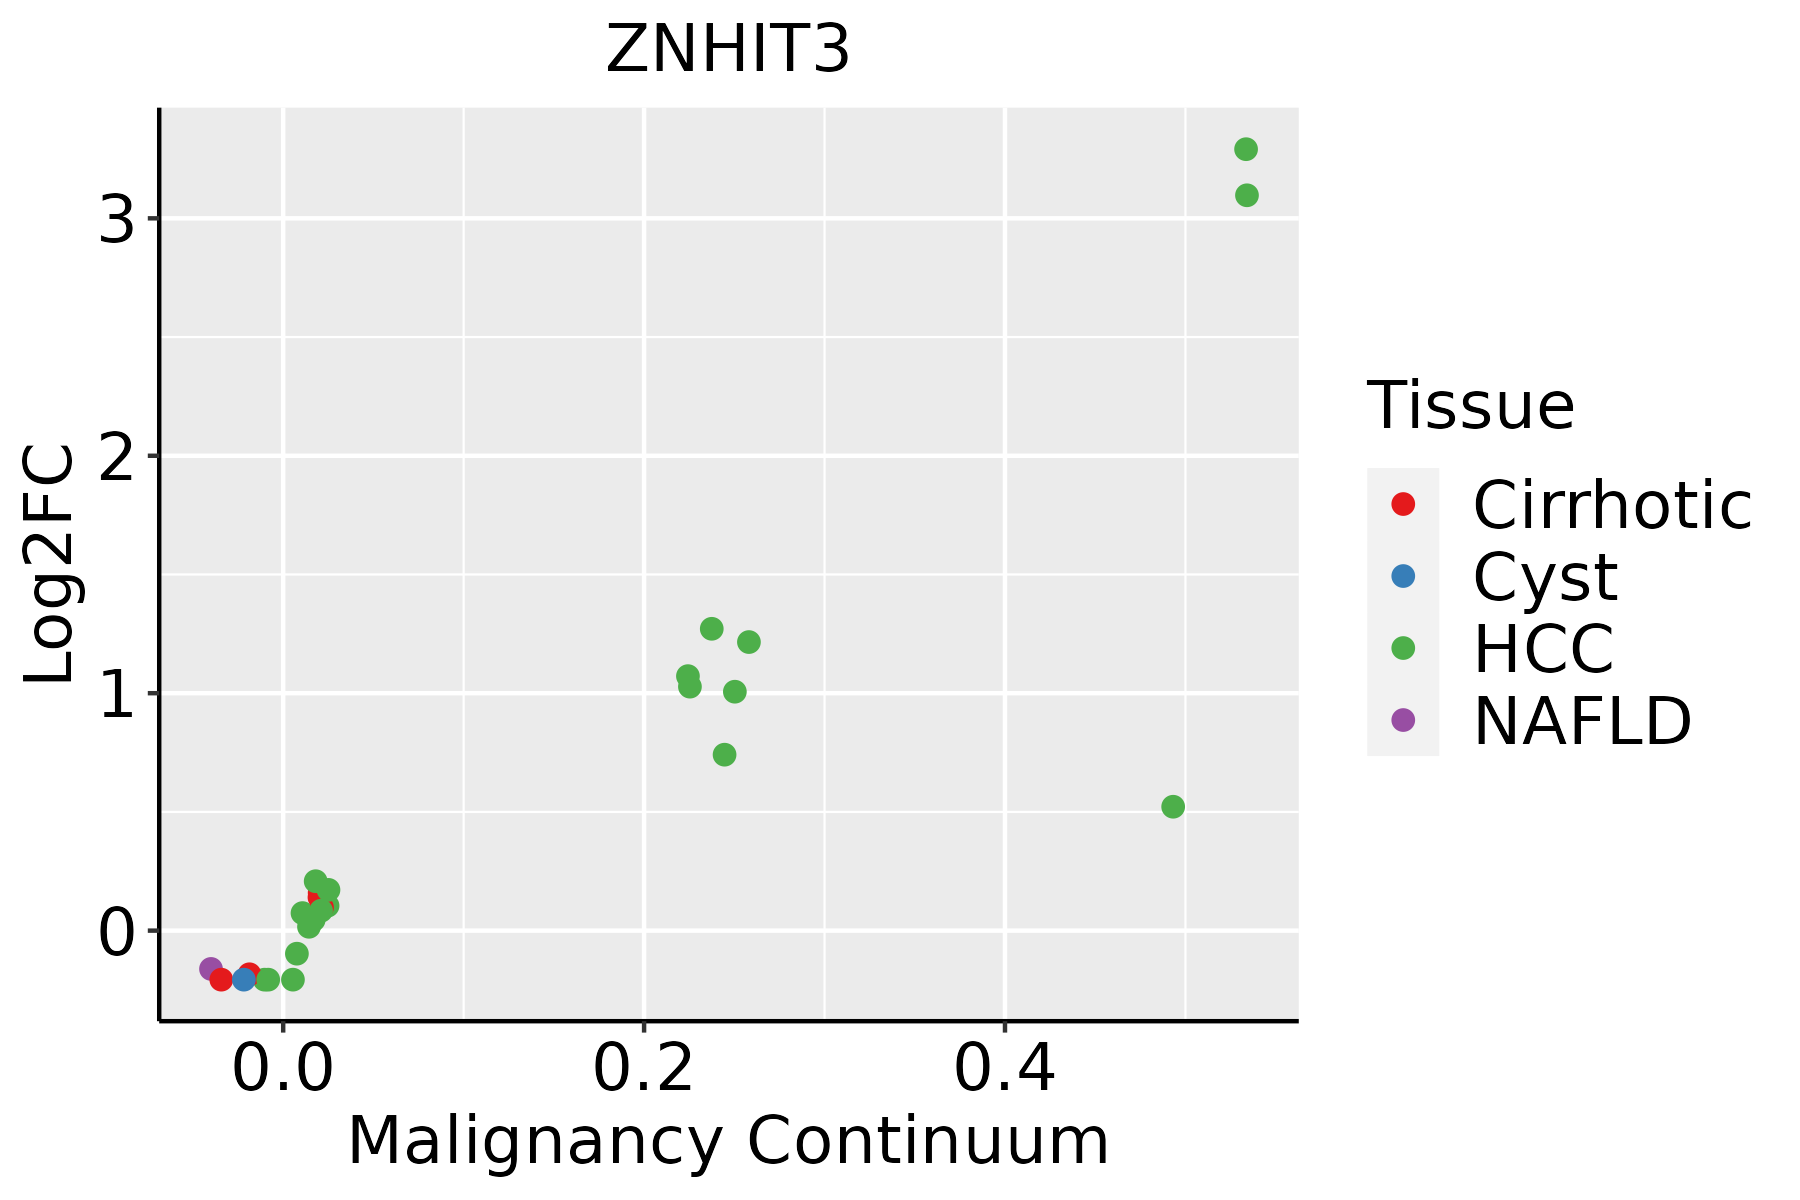 | HCC: Hepatocellular carcinoma |
| NAFLD: Non-alcoholic fatty liver disease | ||
| Oral Cavity |  | EOLP: Erosive Oral lichen planus |
| LP: leukoplakia | ||
| NEOLP: Non-erosive oral lichen planus | ||
| OSCC: Oral squamous cell carcinoma | ||
| Prostate | 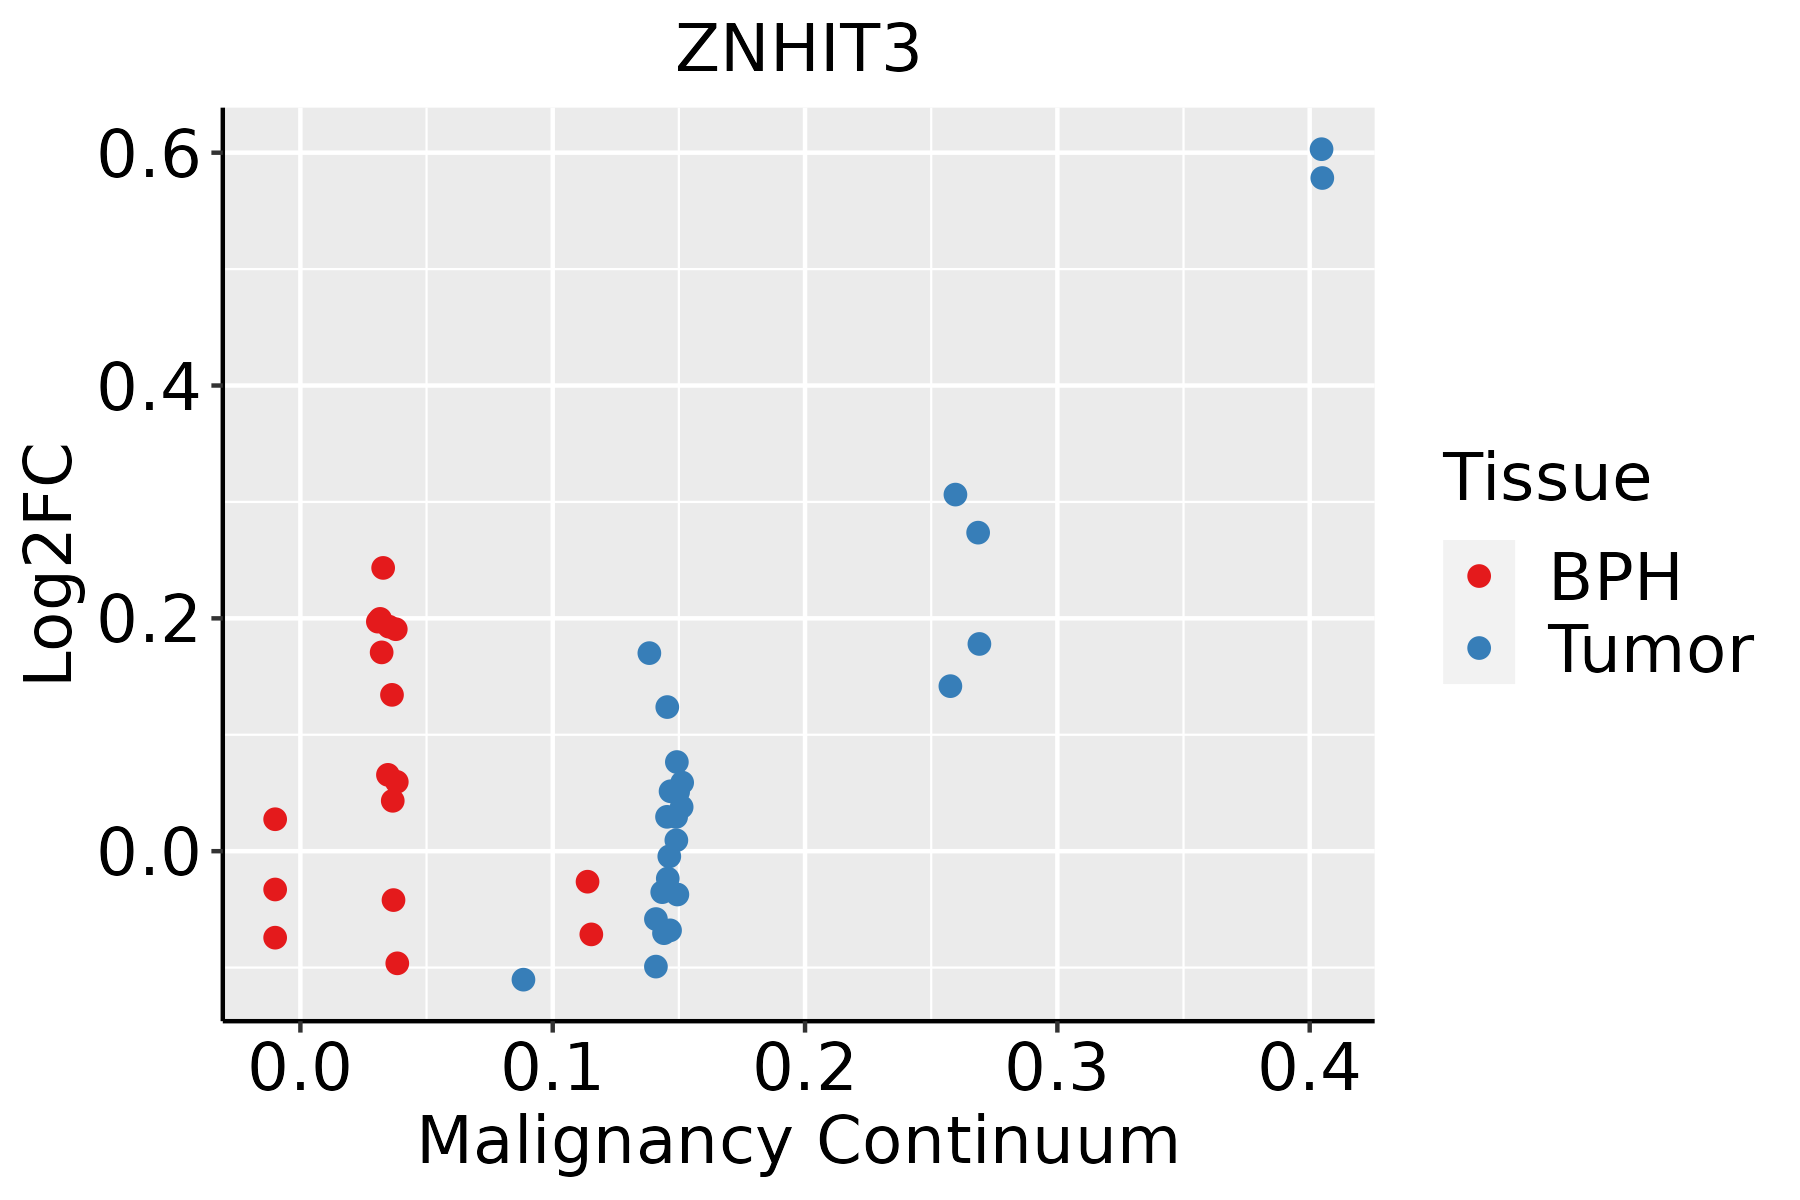 | BPH: Benign Prostatic Hyperplasia |
| Skin | 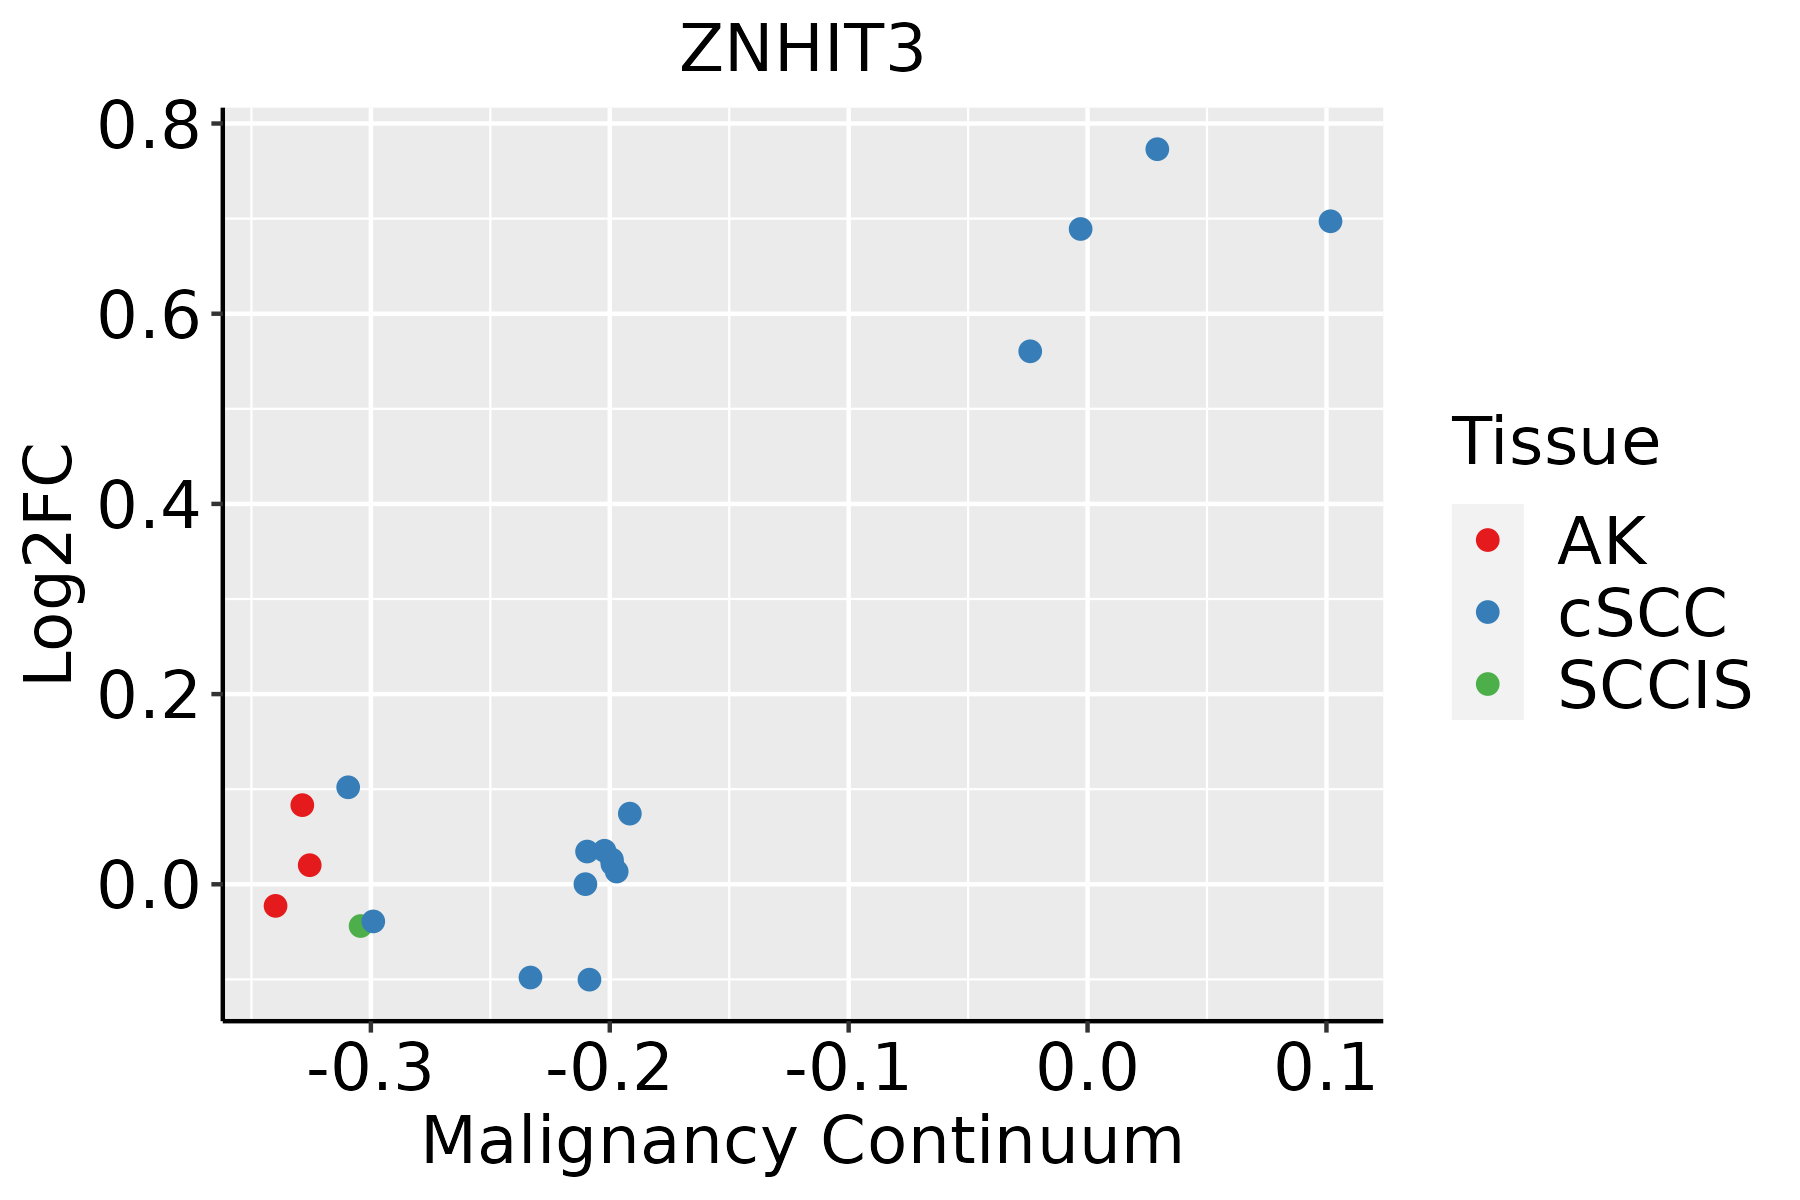 | AK: Actinic keratosis |
| cSCC: Cutaneous squamous cell carcinoma | ||
| SCCIS:squamous cell carcinoma in situ | ||
| Thyroid | 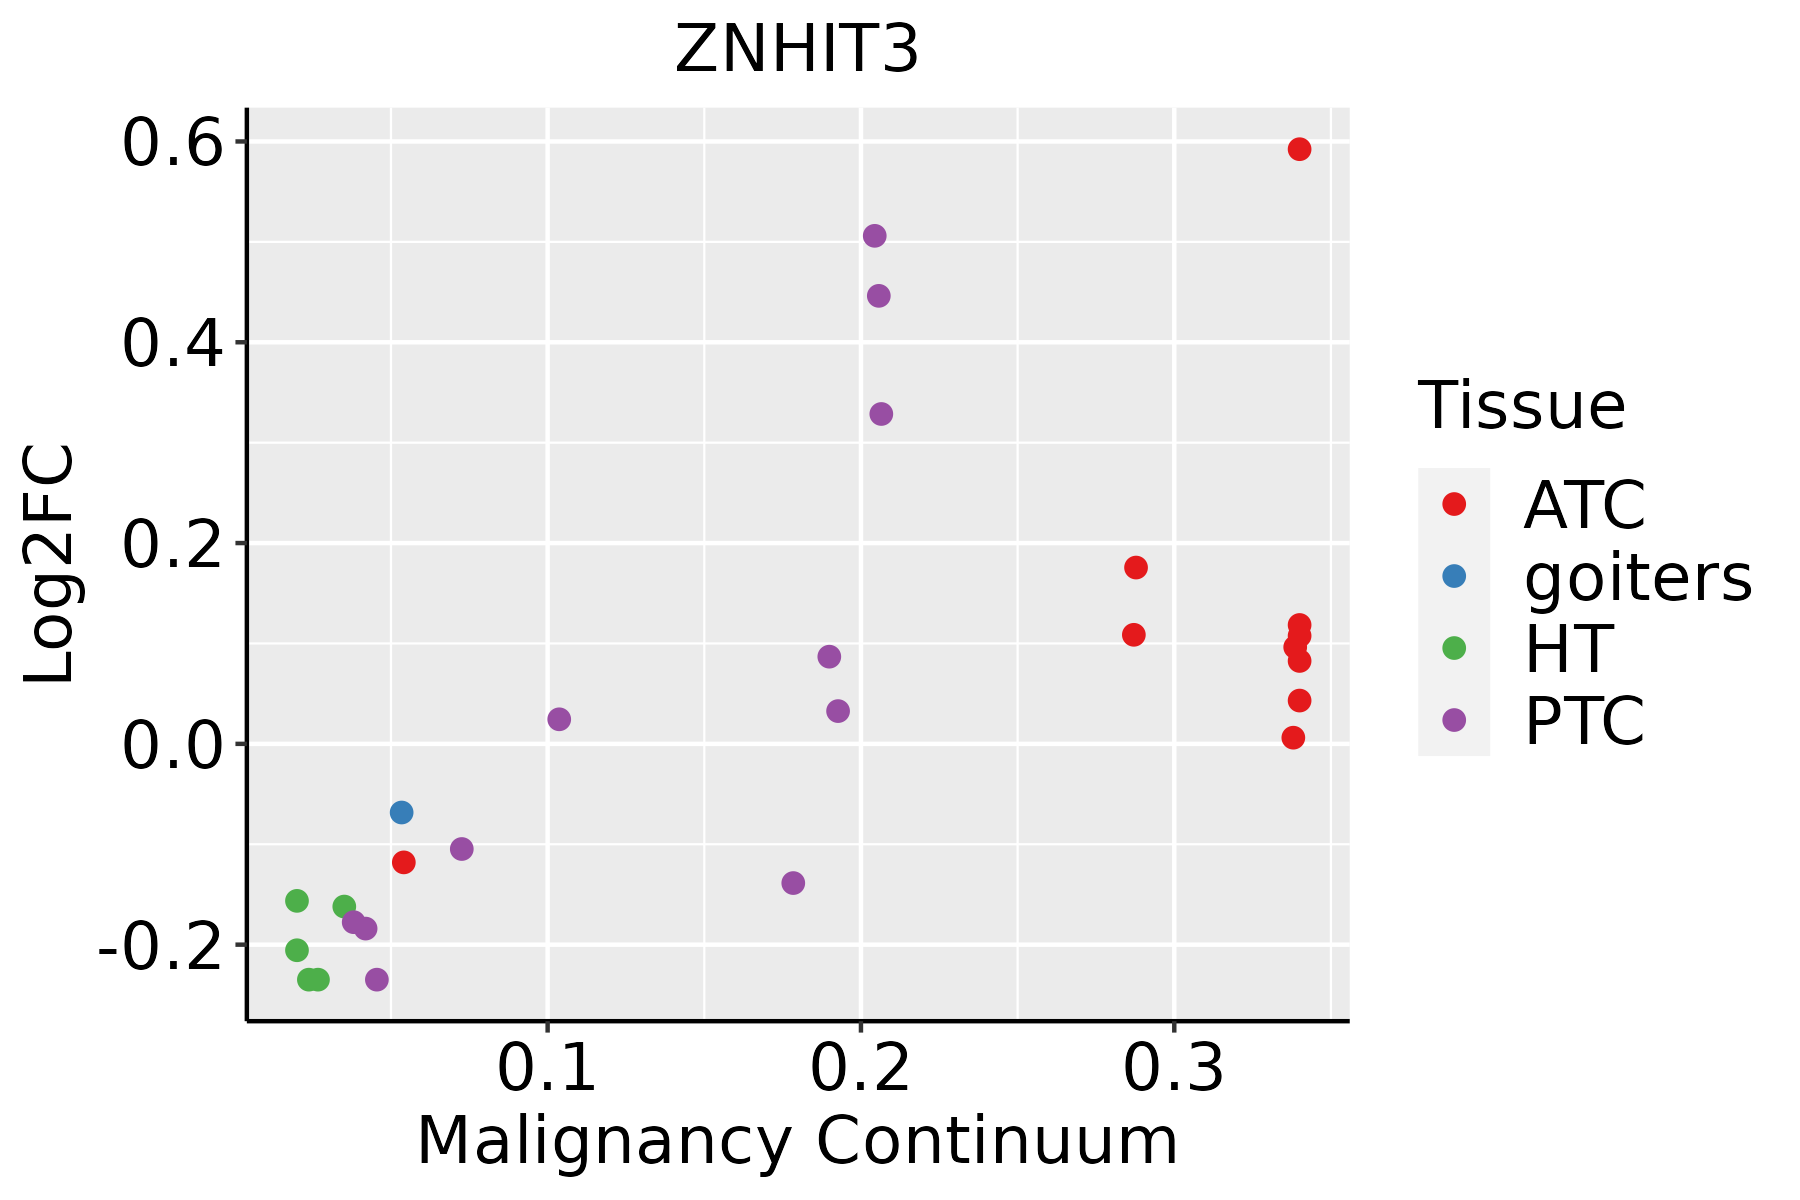 | ATC: Anaplastic thyroid cancer |
| HT: Hashimoto's thyroiditis | ||
| PTC: Papillary thyroid cancer |
| ∗log2FC in expression of this searched gene in stem-like cells from each diseased tissue sample relative to stem-like cells in normal samples in each tissue plotted against the malignancy continuum. Samples are colored based on if they are from different disease stage. |
Top |
Malignant transformation related pathway analysis |
| Find out the enriched GO biological processes and KEGG pathways involved in transition from healthy to precancer to cancer |
| Tissue | Disease Stage | Enriched GO biological Processes |
| Colorectum | AD |  |
| Colorectum | SER |  |
| Colorectum | MSS |  |
| Colorectum | MSI-H |  |
| Colorectum | FAP |  |
| ∗Top 15 enriched GO BP terms are showed in the bar plot of each disease state in each tissue. Each row represents a significant GO biological process which is colored according to the -log10(p.adjust). |
| Page: 1 2 3 4 5 6 7 8 9 |
| GO ID | Tissue | Disease Stage | Description | Gene Ratio | Bg Ratio | pvalue | p.adjust | Count |
| GO:002261327 | Esophagus | HGIN | ribonucleoprotein complex biogenesis | 158/2587 | 463/18723 | 2.61e-29 | 5.23e-26 | 158 |
| GO:004225426 | Esophagus | HGIN | ribosome biogenesis | 101/2587 | 299/18723 | 8.74e-19 | 4.03e-16 | 101 |
| GO:007182627 | Esophagus | HGIN | ribonucleoprotein complex subunit organization | 84/2587 | 227/18723 | 1.34e-18 | 5.37e-16 | 84 |
| GO:002261827 | Esophagus | HGIN | ribonucleoprotein complex assembly | 82/2587 | 220/18723 | 2.07e-18 | 7.36e-16 | 82 |
| GO:000640320 | Esophagus | HGIN | RNA localization | 66/2587 | 201/18723 | 4.06e-12 | 5.41e-10 | 66 |
| GO:004227326 | Esophagus | HGIN | ribosomal large subunit biogenesis | 34/2587 | 72/18723 | 8.82e-12 | 1.06e-09 | 34 |
| GO:001607219 | Esophagus | HGIN | rRNA metabolic process | 72/2587 | 236/18723 | 2.26e-11 | 2.56e-09 | 72 |
| GO:000636419 | Esophagus | HGIN | rRNA processing | 69/2587 | 225/18723 | 4.53e-11 | 5.04e-09 | 69 |
| GO:003447010 | Esophagus | HGIN | ncRNA processing | 97/2587 | 395/18723 | 5.92e-09 | 3.90e-07 | 97 |
| GO:00346606 | Esophagus | HGIN | ncRNA metabolic process | 104/2587 | 485/18723 | 2.26e-06 | 8.23e-05 | 104 |
| GO:00004707 | Esophagus | HGIN | maturation of LSU-rRNA | 10/2587 | 28/18723 | 3.04e-03 | 2.88e-02 | 10 |
| GO:0022613111 | Esophagus | ESCC | ribonucleoprotein complex biogenesis | 365/8552 | 463/18723 | 1.74e-49 | 1.11e-45 | 365 |
| GO:0042254111 | Esophagus | ESCC | ribosome biogenesis | 252/8552 | 299/18723 | 3.27e-44 | 1.04e-40 | 252 |
| GO:003447015 | Esophagus | ESCC | ncRNA processing | 300/8552 | 395/18723 | 3.09e-35 | 3.26e-32 | 300 |
| GO:0016072110 | Esophagus | ESCC | rRNA metabolic process | 197/8552 | 236/18723 | 1.31e-33 | 1.18e-30 | 197 |
| GO:0006364110 | Esophagus | ESCC | rRNA processing | 189/8552 | 225/18723 | 4.88e-33 | 3.87e-30 | 189 |
| GO:003466012 | Esophagus | ESCC | ncRNA metabolic process | 346/8552 | 485/18723 | 4.35e-31 | 2.51e-28 | 346 |
| GO:0006403110 | Esophagus | ESCC | RNA localization | 166/8552 | 201/18723 | 1.95e-27 | 6.18e-25 | 166 |
| GO:0071826111 | Esophagus | ESCC | ribonucleoprotein complex subunit organization | 166/8552 | 227/18723 | 2.94e-17 | 2.42e-15 | 166 |
| GO:0022618111 | Esophagus | ESCC | ribonucleoprotein complex assembly | 159/8552 | 220/18723 | 8.19e-16 | 5.71e-14 | 159 |
| Page: 1 2 3 4 5 6 |
| Pathway ID | Tissue | Disease Stage | Description | Gene Ratio | Bg Ratio | pvalue | p.adjust | qvalue | Count |
| Page: 1 |
Top |
Cell-cell communication analysis |
| Identification of potential cell-cell interactions between two cell types and their ligand-receptor pairs for different disease states |
| Ligand | Receptor | LRpair | Pathway | Tissue | Disease Stage |
| Page: 1 |
Top |
Single-cell gene regulatory network inference analysis |
| Find out the significant the regulons (TFs) and the target genes of each regulon across cell types for different disease states |
| TF | Cell Type | Tissue | Disease Stage | Target Gene | RSS | Regulon Activity |
| ∗The dot plots of a searched regulon are shown for all cell subpopulations in each disease state of each tissue based on the regulon specific score inferred using pySCENIC and by calculating the average expression. |
| Page: 1 |
Top |
Somatic mutation of malignant transformation related genes |
| Annotation of somatic variants for genes involved in malignant transformation |
| Hugo Symbol | Variant Class | Variant Classification | dbSNP RS | HGVSc | HGVSp | HGVSp Short | SWISSPROT | BIOTYPE | SIFT | PolyPhen | Tumor Sample Barcode | Tissue | Histology | Sex | Age | Stage | Therapy Types | Drugs | Outcome |
| ZNHIT3 | insertion | In_Frame_Ins | novel | c.444_445insCTAGTAATAGGTGTGAAAAATTTTACAGACTGTGAAGTA | p.Glu148_Pro149insLeuValIleGlyValLysAsnPheThrAspCysGluVal | p.E148_P149insLVIGVKNFTDCEV | Q15649 | protein_coding | TCGA-AQ-A04J-01 | Breast | breast invasive carcinoma | Female | <65 | I/II | Chemotherapy | cytoxan | SD | ||
| ZNHIT3 | SNV | Missense_Mutation | novel | c.181A>G | p.Thr61Ala | p.T61A | Q15649 | protein_coding | tolerated(0.76) | benign(0) | TCGA-5M-AAT6-01 | Colorectum | colon adenocarcinoma | Female | <65 | III/IV | Unknown | Unknown | PD |
| ZNHIT3 | SNV | Missense_Mutation | novel | c.399G>T | p.Glu133Asp | p.E133D | Q15649 | protein_coding | deleterious(0) | probably_damaging(0.994) | TCGA-D5-6540-01 | Colorectum | colon adenocarcinoma | Male | >=65 | I/II | Unknown | Unknown | SD |
| ZNHIT3 | deletion | Frame_Shift_Del | novel | c.151delN | p.Ile53Ter | p.I53* | Q15649 | protein_coding | TCGA-D5-6530-01 | Colorectum | colon adenocarcinoma | Male | <65 | I/II | Unknown | Unknown | SD | ||
| ZNHIT3 | SNV | Missense_Mutation | novel | c.257N>T | p.Arg86Ile | p.R86I | Q15649 | protein_coding | deleterious(0) | probably_damaging(0.98) | TCGA-A5-A0G2-01 | Endometrium | uterine corpus endometrioid carcinoma | Female | <65 | III/IV | Unknown | Unknown | SD |
| ZNHIT3 | SNV | Missense_Mutation | rs370588803 | c.279N>T | p.Lys93Asn | p.K93N | Q15649 | protein_coding | deleterious(0.02) | benign(0.444) | TCGA-DF-A2KV-01 | Endometrium | uterine corpus endometrioid carcinoma | Female | <65 | I/II | Unknown | Unknown | SD |
| ZNHIT3 | SNV | Missense_Mutation | novel | c.292N>A | p.Ser98Thr | p.S98T | Q15649 | protein_coding | deleterious(0.01) | benign(0.355) | TCGA-DI-A1BU-01 | Endometrium | uterine corpus endometrioid carcinoma | Female | <65 | I/II | Chemotherapy | paclitaxel | SD |
| ZNHIT3 | SNV | Missense_Mutation | novel | c.199A>C | p.Asn67His | p.N67H | Q15649 | protein_coding | deleterious(0.03) | possibly_damaging(0.467) | TCGA-EO-A22U-01 | Endometrium | uterine corpus endometrioid carcinoma | Female | >=65 | I/II | Unknown | Unknown | SD |
| ZNHIT3 | SNV | Missense_Mutation | novel | c.283T>G | p.Leu95Val | p.L95V | Q15649 | protein_coding | deleterious(0) | probably_damaging(0.994) | TCGA-EY-A1G8-01 | Endometrium | uterine corpus endometrioid carcinoma | Female | >=65 | I/II | Unknown | Unknown | SD |
| ZNHIT3 | SNV | Missense_Mutation | novel | c.375N>T | p.Lys125Asn | p.K125N | Q15649 | protein_coding | tolerated(0.17) | benign(0.026) | TCGA-FI-A2F4-01 | Endometrium | uterine corpus endometrioid carcinoma | Female | <65 | I/II | Unknown | Unknown | SD |
| Page: 1 2 |
Top |
Related drugs of malignant transformation related genes |
| Identification of chemicals and drugs interact with genes involved in malignant transfromation |
| (DGIdb 4.0) |
| Entrez ID | Symbol | Category | Interaction Types | Drug Claim Name | Drug Name | PMIDs |
| Page: 1 |

Copyright 2023-Present -The University of Texas Health Science Center at Houston |