Schematic overview of the cellular and molecular mechanisms involved in the cancer progression, including the proposed cellular and molecular mechanisms in cancer cells trajectory. AT1: alveolar type 1 cells; AT2: alveolar type 2 cells; AAH: atypical adenomatous hyperplasia; AIS: adenocarcinoma in situ; MIA: minimally invasive adenocarcinoma; IA: invasive adenocarcinoma; EMT: epithelial-mesenchymal transition

Home

Download

Statistics

Help

Contact

Center for Computational Systems Medicine
leaf

Gene summary

leaf

Malignant transformation analysis

leaf

Malignant transformation related pathway analysis

leaf

Cell-cell communication analysis

leaf

Single-cell gene regulatory network inference analysis

leaf

Somatic mutation of malignant transformation related genes

leaf

Related drugs of malignant transformation related genes

Gene: ZNFX1

Gene summary for ZNFX1

check button Gene summary.

Gene informationSpeciesHuman
Gene symbol

ZNFX1

Gene ID

57169

Gene namezinc finger NFX1-type containing 1
Gene AliasZNFX1
Cytomap20q13.13
Gene Typeprotein-coding
GO ID

GO:0006325

UniProtAcc

Q9P2E3


Top

Malignant transformation analysis

check button Identification of the aberrant gene expression in precancerous and cancerous lesions by comparing the gene expression of stem-like cells in diseased tissues with normal stem cells
check button Malignant transformation involving gene list.
Entrez IDSymbolReplicatesSpeciesOrganTissueAdj P-valueLog2FCMalignancy
57169ZNFX1HTA11_2487_2000001011HumanColorectumSER5.60e-043.91e-01-0.1808
57169ZNFX1HTA11_1938_2000001011HumanColorectumAD1.12e-023.54e-01-0.0811
57169ZNFX1HTA11_78_2000001011HumanColorectumAD1.01e-021.95e-01-0.1088
57169ZNFX1HTA11_347_2000001011HumanColorectumAD2.03e-032.67e-01-0.1954
57169ZNFX1HTA11_411_2000001011HumanColorectumSER1.91e-079.27e-01-0.2602
57169ZNFX1HTA11_1391_2000001011HumanColorectumAD2.97e-105.21e-01-0.059
57169ZNFX1HTA11_99999971662_82457HumanColorectumMSS1.54e-227.60e-010.3859
57169ZNFX1HTA11_99999973899_84307HumanColorectumMSS2.61e-096.81e-010.2585
57169ZNFX1HTA11_99999974143_84620HumanColorectumMSS1.43e-042.86e-010.3005
57169ZNFX1LZE4THumanEsophagusESCC1.39e-083.49e-010.0811
57169ZNFX1LZE5THumanEsophagusESCC2.51e-073.24e-010.0514
57169ZNFX1LZE8THumanEsophagusESCC2.32e-072.05e-010.067
57169ZNFX1LZE20THumanEsophagusESCC1.78e-113.27e-010.0662
57169ZNFX1LZE22THumanEsophagusESCC2.16e-033.99e-010.068
57169ZNFX1LZE24THumanEsophagusESCC2.75e-165.78e-010.0596
57169ZNFX1LZE21THumanEsophagusESCC1.21e-062.96e-010.0655
57169ZNFX1LZE6THumanEsophagusESCC6.06e-031.44e-010.0845
57169ZNFX1P1T-EHumanEsophagusESCC2.03e-074.34e-010.0875
57169ZNFX1P2T-EHumanEsophagusESCC2.52e-184.43e-010.1177
57169ZNFX1P4T-EHumanEsophagusESCC7.29e-061.63e-010.1323
Page: 1 2 3 4 5 6 

check button Transcriptomic changes along malignancy continuum.
TissueExpression DynamicsAbbreviation
Colorectum (GSE201348)The image shows the transcriptomic changes along malignancy continuum.log2FC in expression of this searched gene in stem-like cells from each diseased tissue sample relative to stem-like cells in normal samples in each tissue plotted against the malignancy continuum. Samples are colored based on if they are from different disease stage.FAP: Familial adenomatous polyposis
CRC: Colorectal cancer
Colorectum (HTA11)The image shows the transcriptomic changes along malignancy continuum.log2FC in expression of this searched gene in stem-like cells from each diseased tissue sample relative to stem-like cells in normal samples in each tissue plotted against the malignancy continuum. Samples are colored based on if they are from different disease stage.AD: Adenomas
SER: Sessile serrated lesions
MSI-H: Microsatellite-high colorectal cancer
MSS: Microsatellite stable colorectal cancer
EsophagusThe image shows the transcriptomic changes along malignancy continuum.log2FC in expression of this searched gene in stem-like cells from each diseased tissue sample relative to stem-like cells in normal samples in each tissue plotted against the malignancy continuum. Samples are colored based on if they are from different disease stage.
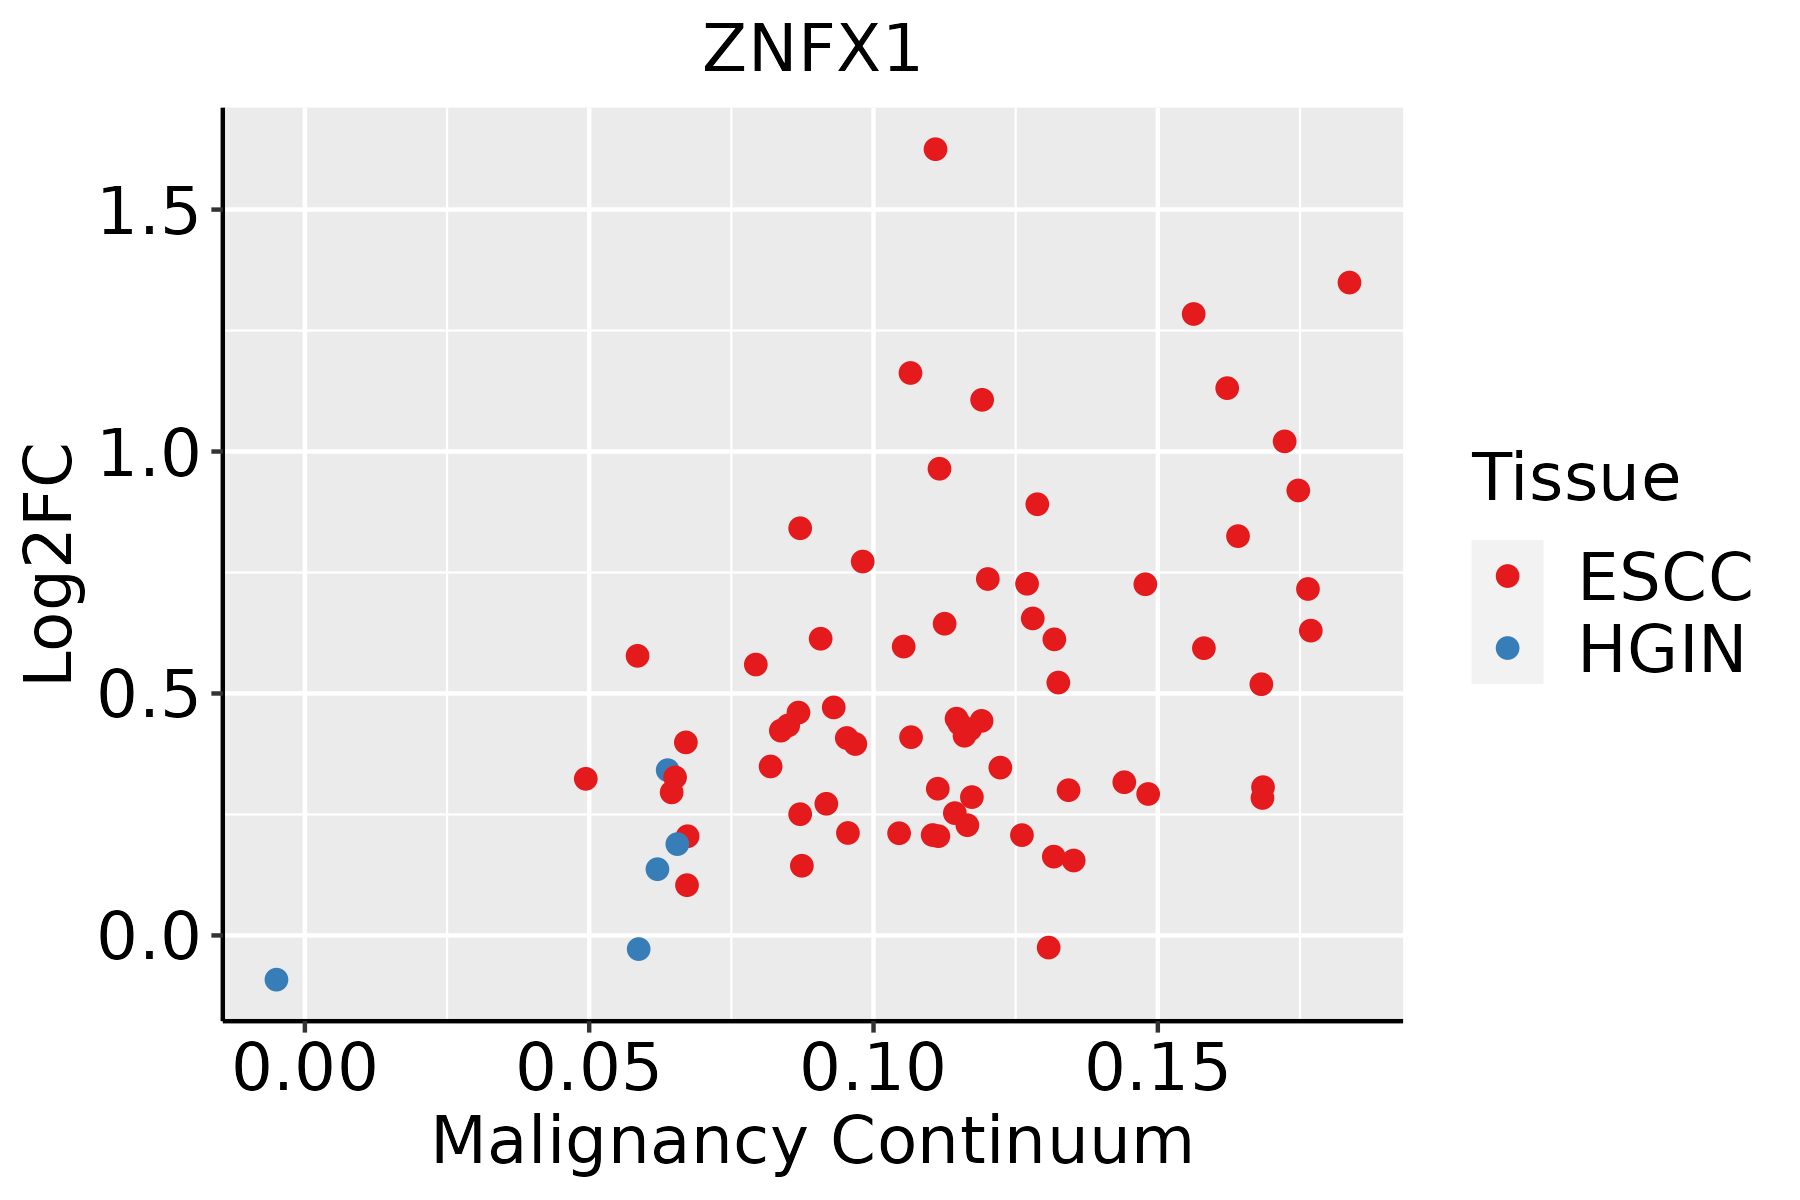
ESCC: Esophageal squamous cell carcinoma
HGIN: High-grade intraepithelial neoplasias
LGIN: Low-grade intraepithelial neoplasias
LiverThe image shows the transcriptomic changes along malignancy continuum.log2FC in expression of this searched gene in stem-like cells from each diseased tissue sample relative to stem-like cells in normal samples in each tissue plotted against the malignancy continuum. Samples are colored based on if they are from different disease stage.HCC: Hepatocellular carcinoma
NAFLD: Non-alcoholic fatty liver disease
Oral CavityThe image shows the transcriptomic changes along malignancy continuum.log2FC in expression of this searched gene in stem-like cells from each diseased tissue sample relative to stem-like cells in normal samples in each tissue plotted against the malignancy continuum. Samples are colored based on if they are from different disease stage.EOLP: Erosive Oral lichen planus
LP: leukoplakia
NEOLP: Non-erosive oral lichen planus
OSCC: Oral squamous cell carcinoma
ThyroidThe image shows the transcriptomic changes along malignancy continuum.log2FC in expression of this searched gene in stem-like cells from each diseased tissue sample relative to stem-like cells in normal samples in each tissue plotted against the malignancy continuum. Samples are colored based on if they are from different disease stage.ATC: Anaplastic thyroid cancer
HT: Hashimoto's thyroiditis
PTC: Papillary thyroid cancer
∗log2FC in expression of this searched gene in stem-like cells from each diseased tissue sample relative to stem-like cells in normal samples in each tissue plotted against the malignancy continuum. Samples are colored based on if they are from different disease stage.

Top

Malignant transformation related pathway analysis

check buttonFind out the enriched GO biological processes and KEGG pathways involved in transition from healthy to precancer to cancer
check button Figure of enriched GO biological processes.
TissueDisease StageEnriched GO biological Processes
ColorectumADGO analysis - Figure of enriched GO biological processes: Top 15 enriched GO BP terms are showed in the bar plot of each disease state in each tissue. Each row represents a significant GO biological process which is colored according to the -log10(p.adjust).
ColorectumSERGO analysis - Figure of enriched GO biological processes: Top 15 enriched GO BP terms are showed in the bar plot of each disease state in each tissue. Each row represents a significant GO biological process which is colored according to the -log10(p.adjust).
ColorectumMSSGO analysis - Figure of enriched GO biological processes: Top 15 enriched GO BP terms are showed in the bar plot of each disease state in each tissue. Each row represents a significant GO biological process which is colored according to the -log10(p.adjust).
ColorectumMSI-HGO analysis - Figure of enriched GO biological processes: Top 15 enriched GO BP terms are showed in the bar plot of each disease state in each tissue. Each row represents a significant GO biological process which is colored according to the -log10(p.adjust).
ColorectumFAPGO analysis - Figure of enriched GO biological processes: Top 15 enriched GO BP terms are showed in the bar plot of each disease state in each tissue. Each row represents a significant GO biological process which is colored according to the -log10(p.adjust).
∗Top 15 enriched GO BP terms are showed in the bar plot of each disease state in each tissue. Each row represents a significant GO biological process which is colored according to the -log10(p.adjust).
Page: 1 2 3 4 5 6 7 8 9 

check button Enriched GO biological processes.
GO IDTissueDisease StageDescriptionGene RatioBg Ratiopvaluep.adjustCount
GO:0006325ColorectumADchromatin organization119/3918409/187234.85e-058.33e-04119
GO:00063251ColorectumSERchromatin organization89/2897409/187234.15e-046.17e-0389
GO:00063252ColorectumMSSchromatin organization107/3467409/187237.22e-051.21e-03107
GO:000632517EsophagusESCCchromatin organization240/8552409/187236.52e-081.14e-06240
GO:00400295EsophagusESCCregulation of gene expression, epigenetic74/8552105/187232.24e-073.42e-0674
GO:00708281EsophagusESCCheterochromatin organization31/855246/187232.42e-031.06e-0231
GO:0045814EsophagusESCCnegative regulation of gene expression, epigenetic32/855250/187236.90e-032.52e-0232
GO:000632511LiverHCCchromatin organization206/7958409/187237.23e-044.41e-03206
GO:0040029LiverHCCregulation of gene expression, epigenetic61/7958105/187239.02e-045.31e-0361
GO:00400294Oral cavityOSCCregulation of gene expression, epigenetic59/7305105/187232.62e-041.68e-0359
GO:000632510Oral cavityOSCCchromatin organization190/7305409/187231.17e-035.97e-03190
GO:004002911Oral cavityLPregulation of gene expression, epigenetic39/4623105/187233.00e-032.05e-0239
GO:000632515Oral cavityEOLPchromatin organization84/2218409/187232.68e-078.16e-0684
GO:00400292Oral cavityEOLPregulation of gene expression, epigenetic24/2218105/187231.07e-037.87e-0324
GO:000632521Oral cavityNEOLPchromatin organization70/2005409/187234.97e-056.83e-0470
GO:00400293Oral cavityNEOLPregulation of gene expression, epigenetic24/2005105/187232.48e-042.55e-0324
GO:0070828Oral cavityNEOLPheterochromatin organization11/200546/187237.99e-033.95e-0211
GO:000632520ThyroidPTCchromatin organization183/5968409/187232.55e-085.70e-07183
GO:00400297ThyroidPTCregulation of gene expression, epigenetic57/5968105/187231.60e-062.25e-0557
GO:0031507ThyroidPTCheterochromatin assembly22/596839/187231.32e-037.47e-0322
Page: 1 2 

check button Enriched KEGG pathways.
Pathway IDTissueDisease StageDescriptionGene RatioBg Ratiopvaluep.adjustqvalueCount
Page: 1 

Top

Cell-cell communication analysis

check buttonIdentification of potential cell-cell interactions between two cell types and their ligand-receptor pairs for different disease states
LigandReceptorLRpairPathwayTissueDisease Stage
Page: 1 

Top

Single-cell gene regulatory network inference analysis

check buttonFind out the significant the regulons (TFs) and the target genes of each regulon across cell types for different disease states
TFCell TypeTissueDisease StageTarget GeneRSSRegulon Activity
∗The dot plots of a searched regulon are shown for all cell subpopulations in each disease state of each tissue based on the regulon specific score inferred using pySCENIC and by calculating the average expression.
Page: 1 

Top

Somatic mutation of malignant transformation related genes

check buttonAnnotation of somatic variants for genes involved in malignant transformation
Hugo SymbolVariant ClassVariant ClassificationdbSNP RSHGVScHGVSpHGVSp ShortSWISSPROTBIOTYPESIFTPolyPhenTumor Sample BarcodeTissueHistologySexAgeStageTherapy TypesDrugsOutcome
ZNFX1SNVMissense_Mutationc.2131N>Ap.Leu711Ilep.L711IQ9P2E3protein_codingtolerated(0.14)possibly_damaging(0.796)TCGA-A2-A0YI-01Breastbreast invasive carcinomaFemale<65I/IIUnspecificFemaraSD
ZNFX1SNVMissense_Mutationc.418N>Ap.Gln140Lysp.Q140KQ9P2E3protein_codingtolerated(0.06)benign(0.024)TCGA-A2-A25A-01Breastbreast invasive carcinomaFemale<65I/IIUnspecificCytoxanSD
ZNFX1SNVMissense_Mutationnovelc.2372N>Cp.Gly791Alap.G791AQ9P2E3protein_codingtolerated(0.59)benign(0.01)TCGA-A7-A6VX-01Breastbreast invasive carcinomaFemale>=65I/IIChemotherapydocetaxelCR
ZNFX1SNVMissense_Mutationc.3017N>Gp.Glu1006Glyp.E1006GQ9P2E3protein_codingdeleterious(0)probably_damaging(1)TCGA-BH-A18G-01Breastbreast invasive carcinomaFemale>=65I/IIUnknownUnknownSD
ZNFX1SNVMissense_Mutationc.4343N>Tp.Ser1448Phep.S1448FQ9P2E3protein_codingdeleterious(0)possibly_damaging(0.448)TCGA-C8-A138-01Breastbreast invasive carcinomaFemale<65III/IVUnknownUnknownSD
ZNFX1SNVMissense_Mutationc.617A>Cp.His206Prop.H206PQ9P2E3protein_codingdeleterious(0.01)possibly_damaging(0.601)TCGA-D8-A1J8-01Breastbreast invasive carcinomaFemale>=65I/IIHormone TherapynolvadexSD
ZNFX1insertionFrame_Shift_Insnovelc.3357_3358insGTGTGGGCACAGTCAACCGGTAAAATp.Gln1120ValfsTer28p.Q1120Vfs*28Q9P2E3protein_codingTCGA-A2-A0EM-01Breastbreast invasive carcinomaFemale>=65I/IIHormone TherapytamoxiphenSD
ZNFX1insertionFrame_Shift_Insnovelc.4995_4996insACp.Ala1666ThrfsTer19p.A1666Tfs*19Q9P2E3protein_codingTCGA-A8-A09E-01Breastbreast invasive carcinomaFemale>=65III/IVHormone TherapyanastrozoleSD
ZNFX1insertionNonsense_Mutationnovelc.4994_4995insCAAATCTCACCCCTTCTCTCCTGCAAATTAGTGGACAp.Lys1665AsnfsTer11p.K1665Nfs*11Q9P2E3protein_codingTCGA-A8-A09E-01Breastbreast invasive carcinomaFemale>=65III/IVHormone TherapyanastrozoleSD
ZNFX1insertionFrame_Shift_Insnovelc.4203_4204insTGTAGTCCCTGCGTGGAACp.Val1402CysfsTer64p.V1402Cfs*64Q9P2E3protein_codingTCGA-A8-A0AB-01Breastbreast invasive carcinomaFemale<65I/IIChemotherapy5-fluorouracilCR
Page: 1 2 3 4 5 6 7 8 9 10 11 12 13 14 15 16 17 18 19 20 21 22 

Top

Related drugs of malignant transformation related genes

check buttonIdentification of chemicals and drugs interact with genes involved in malignant transfromation
(DGIdb 4.0)
Entrez IDSymbolCategoryInteraction TypesDrug Claim NameDrug NamePMIDs
Page: 1