
|
|||||
|
 | |
| |
| |
| |
| |
| |
|
Gene: ZNF92 |
Gene summary for ZNF92 |
| Gene information | Species | Human | Gene symbol | ZNF92 | Gene ID | 168374 |
| Gene name | zinc finger protein 92 | |
| Gene Alias | HEL-203 | |
| Cytomap | 7q11.21 | |
| Gene Type | protein-coding | GO ID | GO:0006139 | UniProtAcc | Q03936 |
Top |
Malignant transformation analysis |
| Identification of the aberrant gene expression in precancerous and cancerous lesions by comparing the gene expression of stem-like cells in diseased tissues with normal stem cells |
| Entrez ID | Symbol | Replicates | Species | Organ | Tissue | Adj P-value | Log2FC | Malignancy |
| 168374 | ZNF92 | LZE4T | Human | Esophagus | ESCC | 2.13e-05 | 1.49e-01 | 0.0811 |
| 168374 | ZNF92 | LZE7T | Human | Esophagus | ESCC | 2.31e-03 | 1.33e-01 | 0.0667 |
| 168374 | ZNF92 | LZE8T | Human | Esophagus | ESCC | 2.34e-03 | 8.91e-02 | 0.067 |
| 168374 | ZNF92 | LZE20T | Human | Esophagus | ESCC | 9.71e-06 | 1.64e-01 | 0.0662 |
| 168374 | ZNF92 | LZE24T | Human | Esophagus | ESCC | 2.34e-10 | 2.28e-01 | 0.0596 |
| 168374 | ZNF92 | P1T-E | Human | Esophagus | ESCC | 1.98e-02 | 2.34e-01 | 0.0875 |
| 168374 | ZNF92 | P2T-E | Human | Esophagus | ESCC | 6.39e-21 | 4.08e-01 | 0.1177 |
| 168374 | ZNF92 | P4T-E | Human | Esophagus | ESCC | 1.17e-10 | 2.60e-01 | 0.1323 |
| 168374 | ZNF92 | P5T-E | Human | Esophagus | ESCC | 1.35e-05 | 9.92e-02 | 0.1327 |
| 168374 | ZNF92 | P8T-E | Human | Esophagus | ESCC | 6.04e-12 | 2.61e-01 | 0.0889 |
| 168374 | ZNF92 | P9T-E | Human | Esophagus | ESCC | 2.63e-09 | 1.25e-01 | 0.1131 |
| 168374 | ZNF92 | P10T-E | Human | Esophagus | ESCC | 6.54e-16 | 3.52e-01 | 0.116 |
| 168374 | ZNF92 | P11T-E | Human | Esophagus | ESCC | 4.13e-11 | 5.30e-01 | 0.1426 |
| 168374 | ZNF92 | P12T-E | Human | Esophagus | ESCC | 1.51e-16 | 3.78e-01 | 0.1122 |
| 168374 | ZNF92 | P15T-E | Human | Esophagus | ESCC | 2.93e-19 | 3.07e-01 | 0.1149 |
| 168374 | ZNF92 | P16T-E | Human | Esophagus | ESCC | 6.57e-13 | 3.16e-01 | 0.1153 |
| 168374 | ZNF92 | P17T-E | Human | Esophagus | ESCC | 1.29e-03 | 2.10e-01 | 0.1278 |
| 168374 | ZNF92 | P20T-E | Human | Esophagus | ESCC | 3.03e-09 | 1.77e-01 | 0.1124 |
| 168374 | ZNF92 | P21T-E | Human | Esophagus | ESCC | 5.57e-04 | 9.99e-02 | 0.1617 |
| 168374 | ZNF92 | P22T-E | Human | Esophagus | ESCC | 2.15e-16 | 2.40e-01 | 0.1236 |
| Page: 1 2 3 4 |
| Tissue | Expression Dynamics | Abbreviation |
| Esophagus |  | ESCC: Esophageal squamous cell carcinoma |
| HGIN: High-grade intraepithelial neoplasias | ||
| LGIN: Low-grade intraepithelial neoplasias | ||
| Liver | 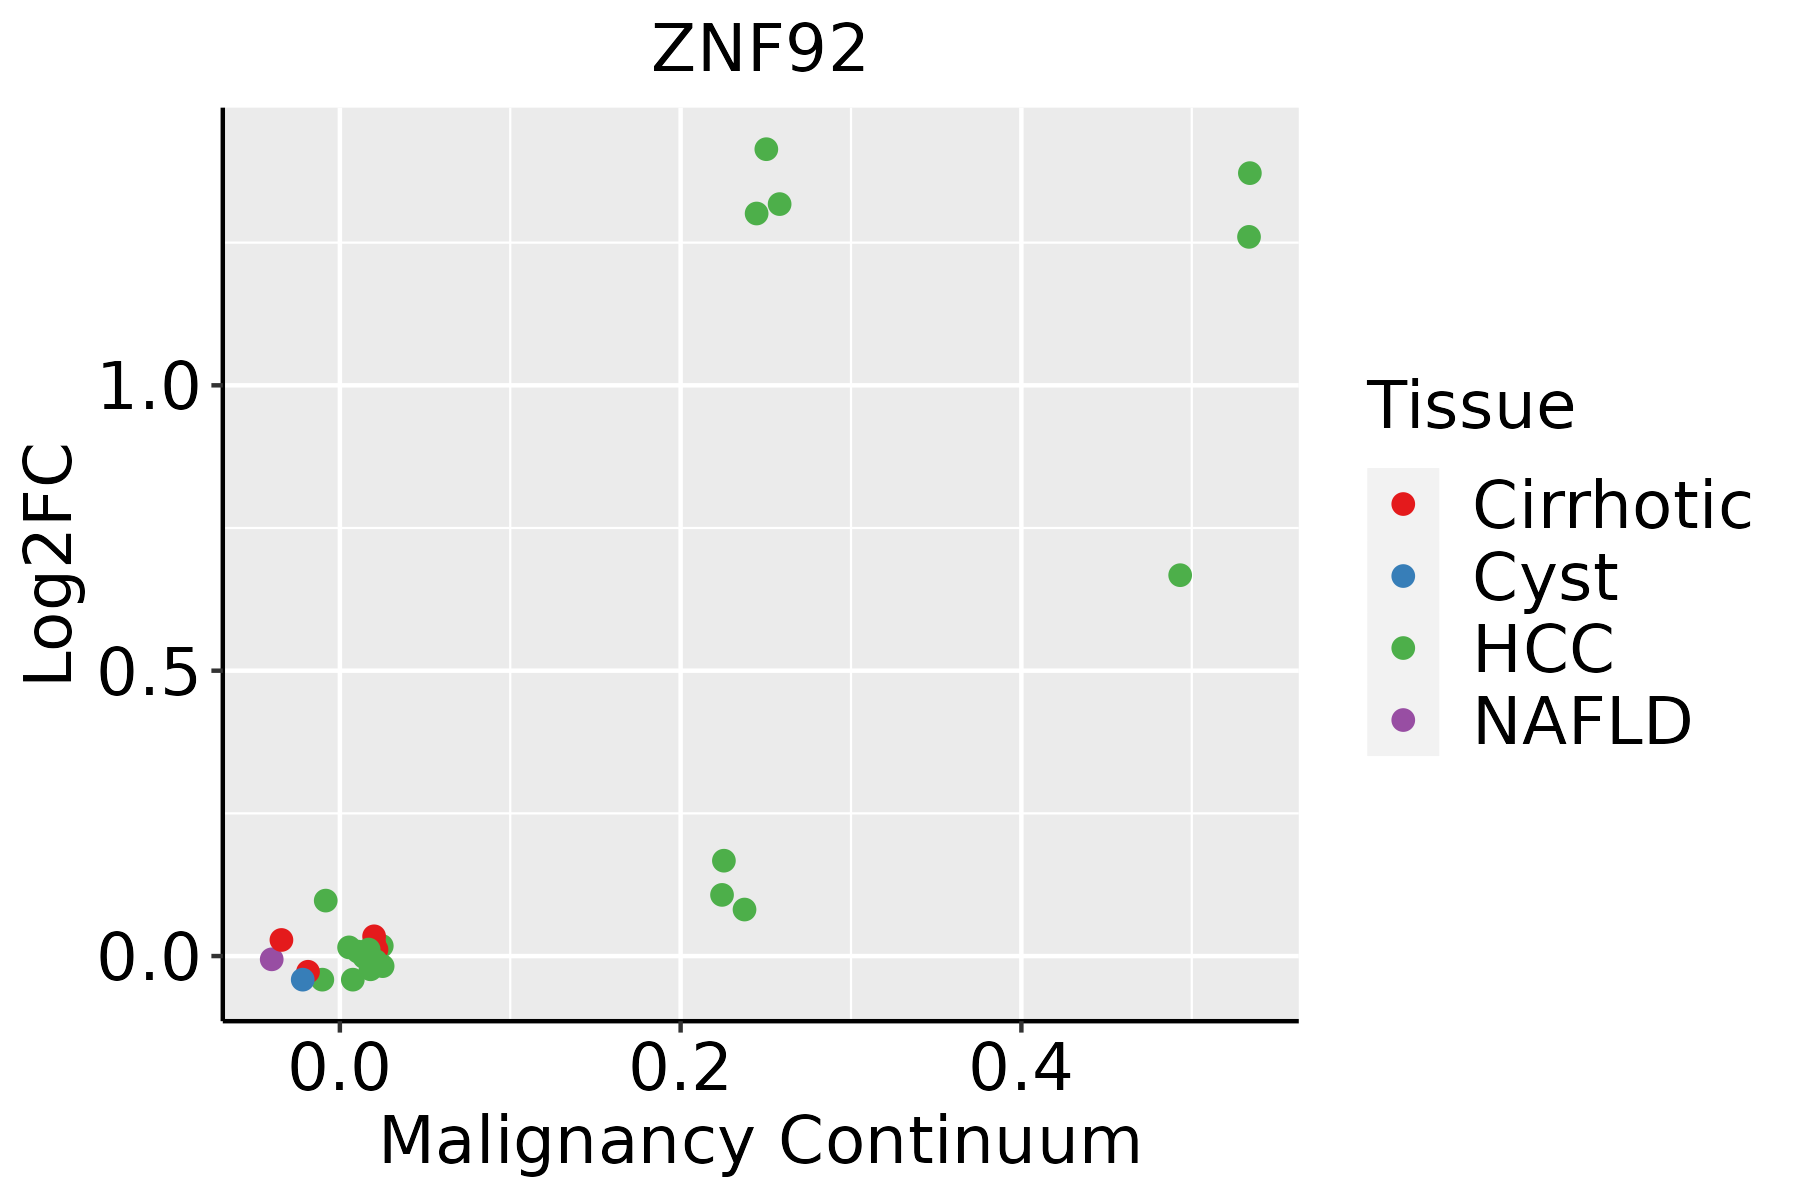 | HCC: Hepatocellular carcinoma |
| NAFLD: Non-alcoholic fatty liver disease | ||
| Thyroid | 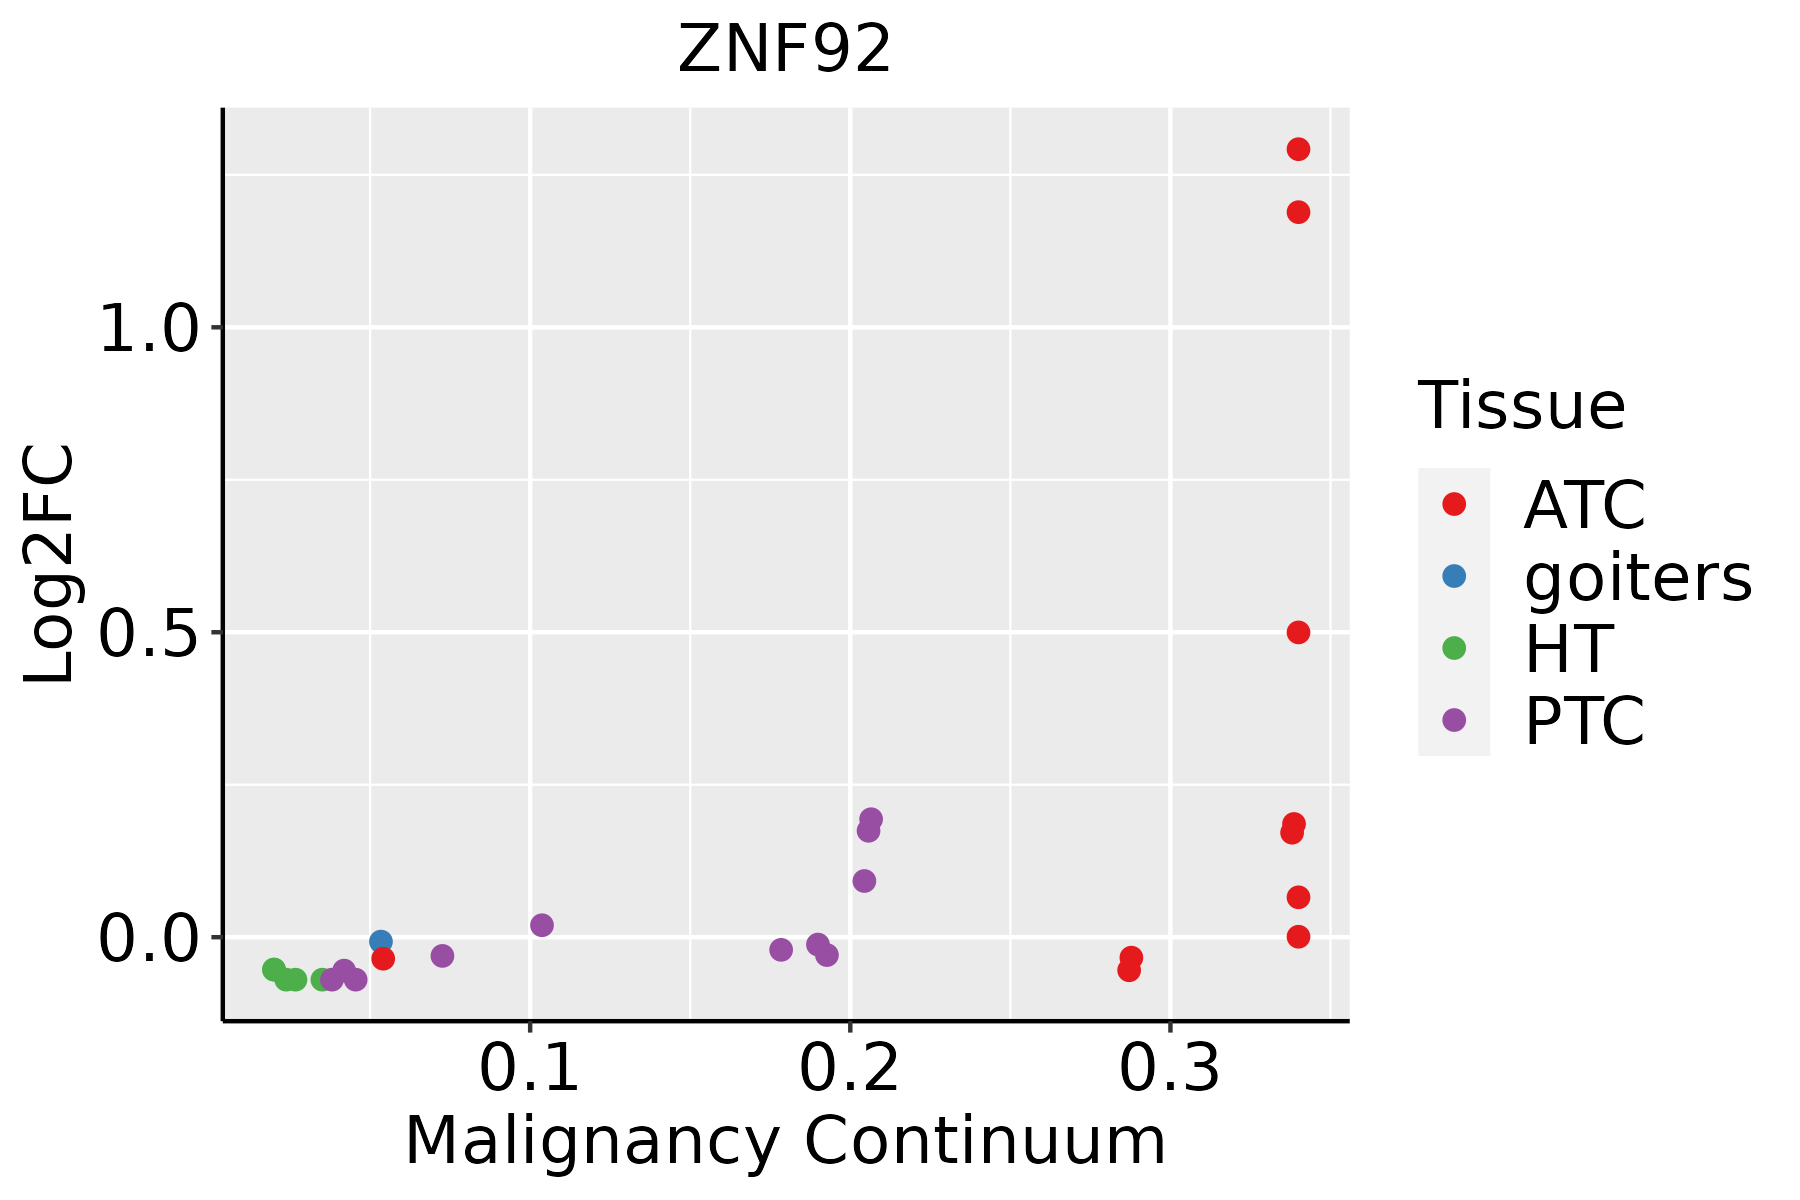 | ATC: Anaplastic thyroid cancer |
| HT: Hashimoto's thyroiditis | ||
| PTC: Papillary thyroid cancer |
| ∗log2FC in expression of this searched gene in stem-like cells from each diseased tissue sample relative to stem-like cells in normal samples in each tissue plotted against the malignancy continuum. Samples are colored based on if they are from different disease stage. |
Top |
Malignant transformation related pathway analysis |
| Find out the enriched GO biological processes and KEGG pathways involved in transition from healthy to precancer to cancer |
| Tissue | Disease Stage | Enriched GO biological Processes |
| Colorectum | AD |  |
| Colorectum | SER |  |
| Colorectum | MSS |  |
| Colorectum | MSI-H |  |
| Colorectum | FAP |  |
| ∗Top 15 enriched GO BP terms are showed in the bar plot of each disease state in each tissue. Each row represents a significant GO biological process which is colored according to the -log10(p.adjust). |
| Page: 1 2 3 4 5 6 7 8 9 |
| GO ID | Tissue | Disease Stage | Description | Gene Ratio | Bg Ratio | pvalue | p.adjust | Count |
| Page: 1 |
| Pathway ID | Tissue | Disease Stage | Description | Gene Ratio | Bg Ratio | pvalue | p.adjust | qvalue | Count |
| Page: 1 |
Top |
Cell-cell communication analysis |
| Identification of potential cell-cell interactions between two cell types and their ligand-receptor pairs for different disease states |
| Ligand | Receptor | LRpair | Pathway | Tissue | Disease Stage |
| Page: 1 |
Top |
Single-cell gene regulatory network inference analysis |
| Find out the significant the regulons (TFs) and the target genes of each regulon across cell types for different disease states |
| TF | Cell Type | Tissue | Disease Stage | Target Gene | RSS | Regulon Activity |
| ZNF92 | TRANS | Esophagus | ADJ | PSPH,BRI3,DMRTA1, etc. | 5.57e-01 |  |
| ZNF92 | TRANS | Esophagus | ESCC | PSPH,BRI3,DMRTA1, etc. | 2.03e-01 |  |
| ZNF92 | TRANS | Esophagus | HGIN | PSPH,BRI3,DMRTA1, etc. | 3.86e-01 |  |
| ZNF92 | KER | Esophagus | LGIN | PSPH,BRI3,DMRTA1, etc. | 3.00e-01 |  |
| ∗The dot plots of a searched regulon are shown for all cell subpopulations in each disease state of each tissue based on the regulon specific score inferred using pySCENIC and by calculating the average expression. |
| Page: 1 |
Top |
Somatic mutation of malignant transformation related genes |
| Annotation of somatic variants for genes involved in malignant transformation |
| Hugo Symbol | Variant Class | Variant Classification | dbSNP RS | HGVSc | HGVSp | HGVSp Short | SWISSPROT | BIOTYPE | SIFT | PolyPhen | Tumor Sample Barcode | Tissue | Histology | Sex | Age | Stage | Therapy Types | Drugs | Outcome |
| ZNF92 | SNV | Missense_Mutation | c.1166N>C | p.Arg389Thr | p.R389T | Q03936 | protein_coding | tolerated(0.15) | possibly_damaging(0.647) | TCGA-AC-A23H-01 | Breast | breast invasive carcinoma | Female | >=65 | I/II | Unknown | Unknown | PD | |
| ZNF92 | SNV | Missense_Mutation | novel | c.353A>C | p.Lys118Thr | p.K118T | Q03936 | protein_coding | tolerated(0.1) | benign(0.077) | TCGA-AN-A046-01 | Breast | breast invasive carcinoma | Female | >=65 | I/II | Unknown | Unknown | SD |
| ZNF92 | SNV | Missense_Mutation | c.1628N>G | p.Asp543Gly | p.D543G | Q03936 | protein_coding | tolerated(1) | benign(0.003) | TCGA-C5-A1BI-01 | Cervix | cervical & endocervical cancer | Female | <65 | III/IV | Chemotherapy | cisplatin | SD | |
| ZNF92 | SNV | Missense_Mutation | rs377733062 | c.463N>T | p.His155Tyr | p.H155Y | Q03936 | protein_coding | tolerated(0.25) | benign(0.026) | TCGA-JW-A5VL-01 | Cervix | cervical & endocervical cancer | Female | <65 | I/II | Unknown | Unknown | SD |
| ZNF92 | SNV | Missense_Mutation | c.341G>A | p.Arg114Lys | p.R114K | Q03936 | protein_coding | tolerated(0.45) | benign(0.013) | TCGA-JX-A3Q0-01 | Cervix | cervical & endocervical cancer | Female | <65 | III/IV | Unknown | Unknown | SD | |
| ZNF92 | SNV | Missense_Mutation | c.277N>T | p.Asp93Tyr | p.D93Y | Q03936 | protein_coding | deleterious(0.04) | benign(0.062) | TCGA-AA-3510-01 | Colorectum | colon adenocarcinoma | Male | >=65 | I/II | Unknown | Unknown | SD | |
| ZNF92 | SNV | Missense_Mutation | rs781442558 | c.1423N>A | p.His475Asn | p.H475N | Q03936 | protein_coding | deleterious(0.01) | probably_damaging(0.998) | TCGA-AA-3510-01 | Colorectum | colon adenocarcinoma | Male | >=65 | I/II | Unknown | Unknown | SD |
| ZNF92 | SNV | Missense_Mutation | novel | c.579N>C | p.Lys193Asn | p.K193N | Q03936 | protein_coding | tolerated(0.08) | benign(0.348) | TCGA-AZ-4315-01 | Colorectum | colon adenocarcinoma | Male | <65 | I/II | Unknown | Unknown | SD |
| ZNF92 | SNV | Missense_Mutation | novel | c.1059N>A | p.Phe353Leu | p.F353L | Q03936 | protein_coding | tolerated(0.43) | benign(0.013) | TCGA-AZ-4315-01 | Colorectum | colon adenocarcinoma | Male | <65 | I/II | Unknown | Unknown | SD |
| ZNF92 | SNV | Missense_Mutation | novel | c.467N>C | p.Lys156Thr | p.K156T | Q03936 | protein_coding | deleterious(0.03) | benign(0.117) | TCGA-AG-3892-01 | Colorectum | rectum adenocarcinoma | Female | <65 | I/II | Unknown | Unknown | SD |
| Page: 1 2 3 4 5 6 7 8 9 |
Top |
Related drugs of malignant transformation related genes |
| Identification of chemicals and drugs interact with genes involved in malignant transfromation |
| (DGIdb 4.0) |
| Entrez ID | Symbol | Category | Interaction Types | Drug Claim Name | Drug Name | PMIDs |
| Page: 1 |

Copyright 2023-Present -The University of Texas Health Science Center at Houston |