| Tissue | Expression Dynamics | Abbreviation |
| Colorectum (GSE201348) |  | FAP: Familial adenomatous polyposis |
| CRC: Colorectal cancer |
| Colorectum (HTA11) |  | AD: Adenomas |
| SER: Sessile serrated lesions |
| MSI-H: Microsatellite-high colorectal cancer |
| MSS: Microsatellite stable colorectal cancer |
| Esophagus | 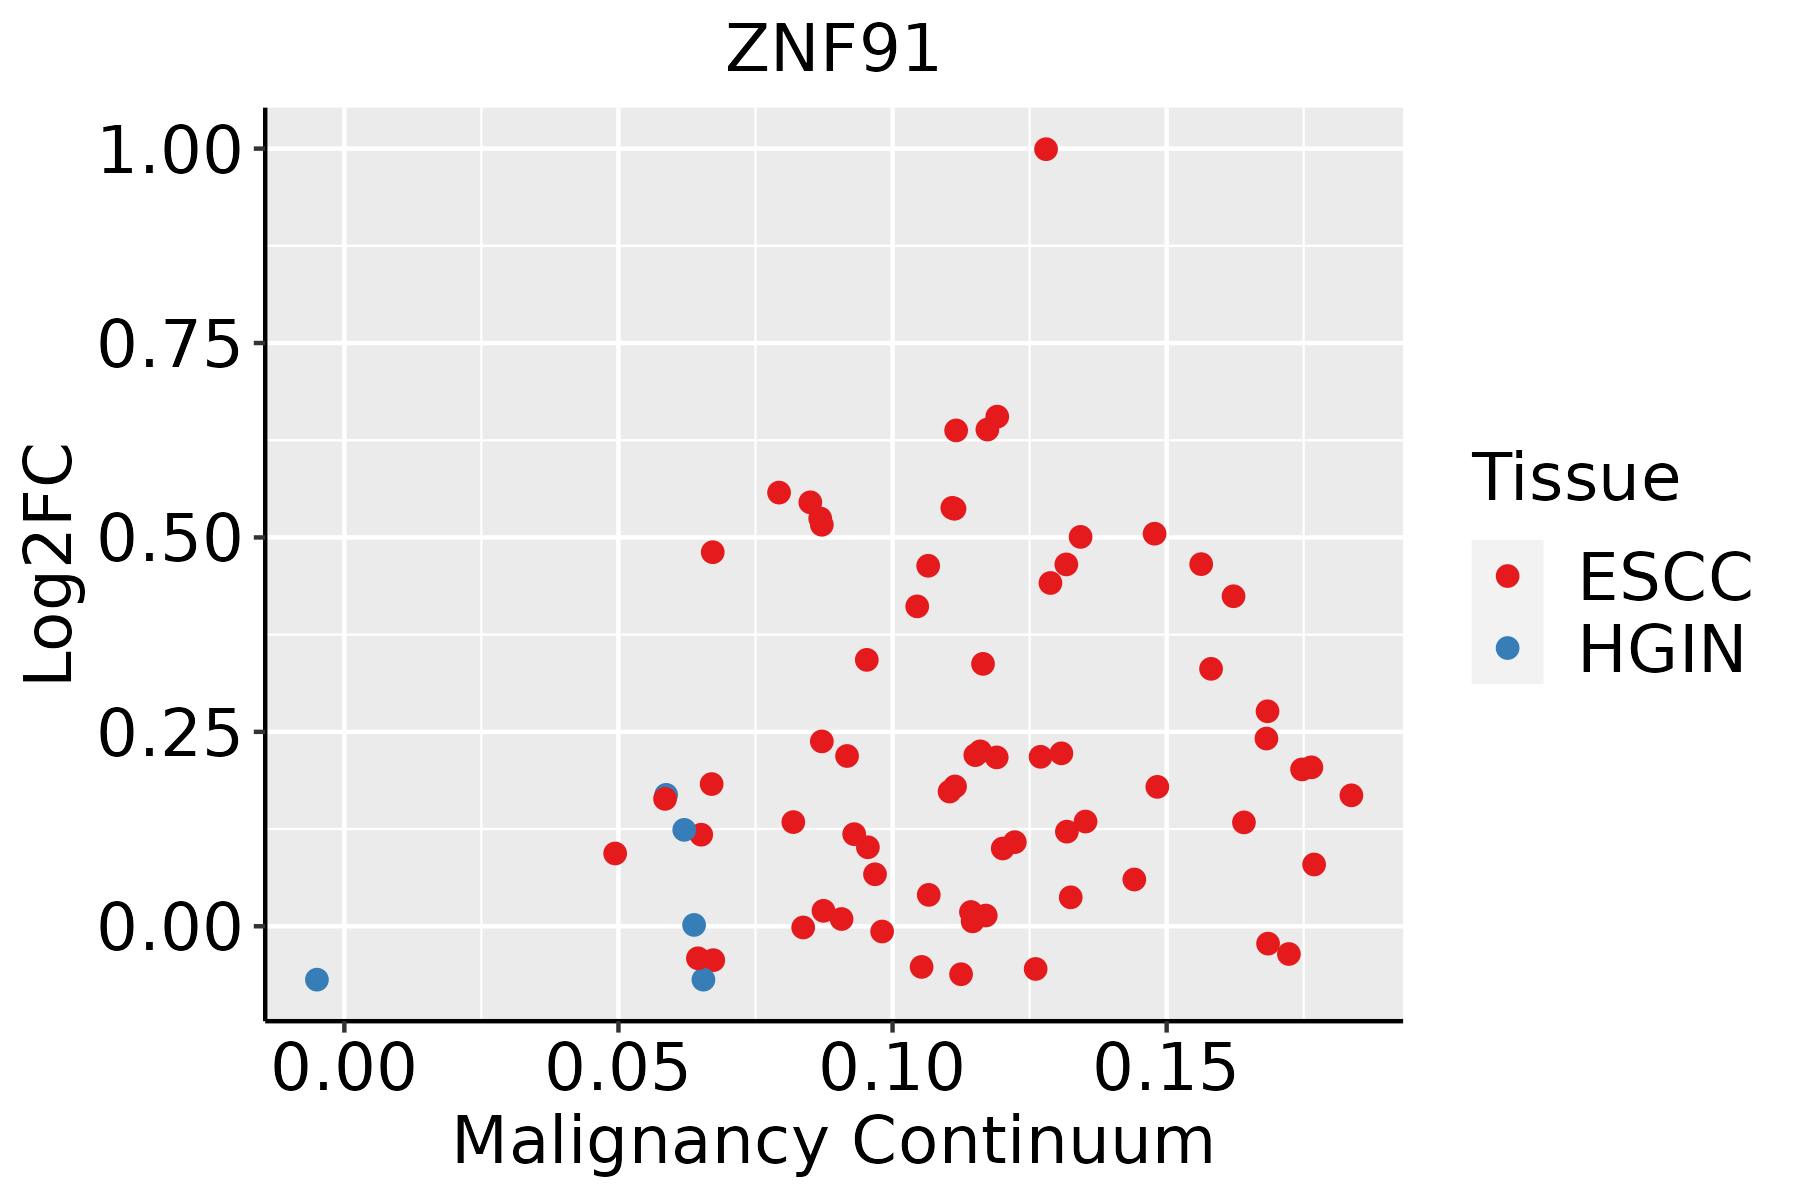 | ESCC: Esophageal squamous cell carcinoma |
| HGIN: High-grade intraepithelial neoplasias |
| LGIN: Low-grade intraepithelial neoplasias |
| Liver | 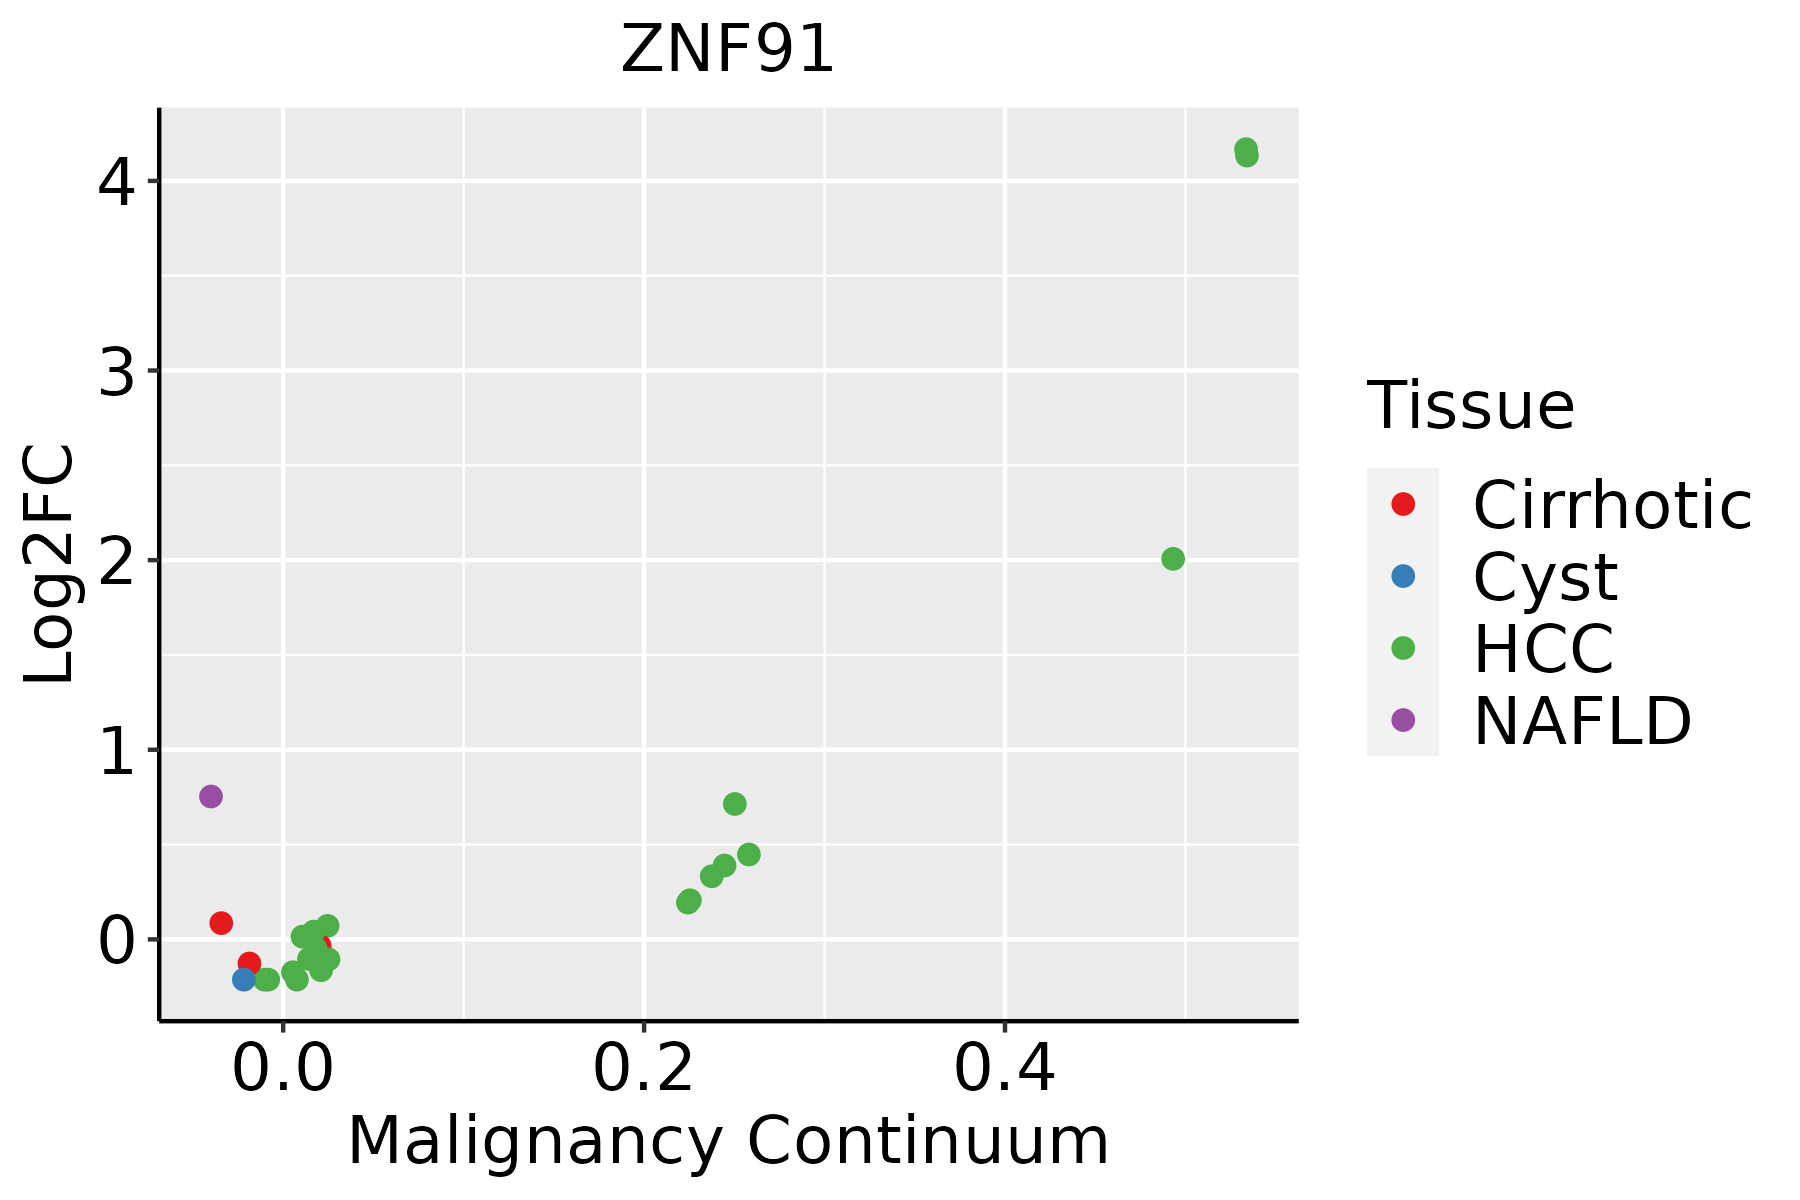 | HCC: Hepatocellular carcinoma |
| NAFLD: Non-alcoholic fatty liver disease |
| Prostate | 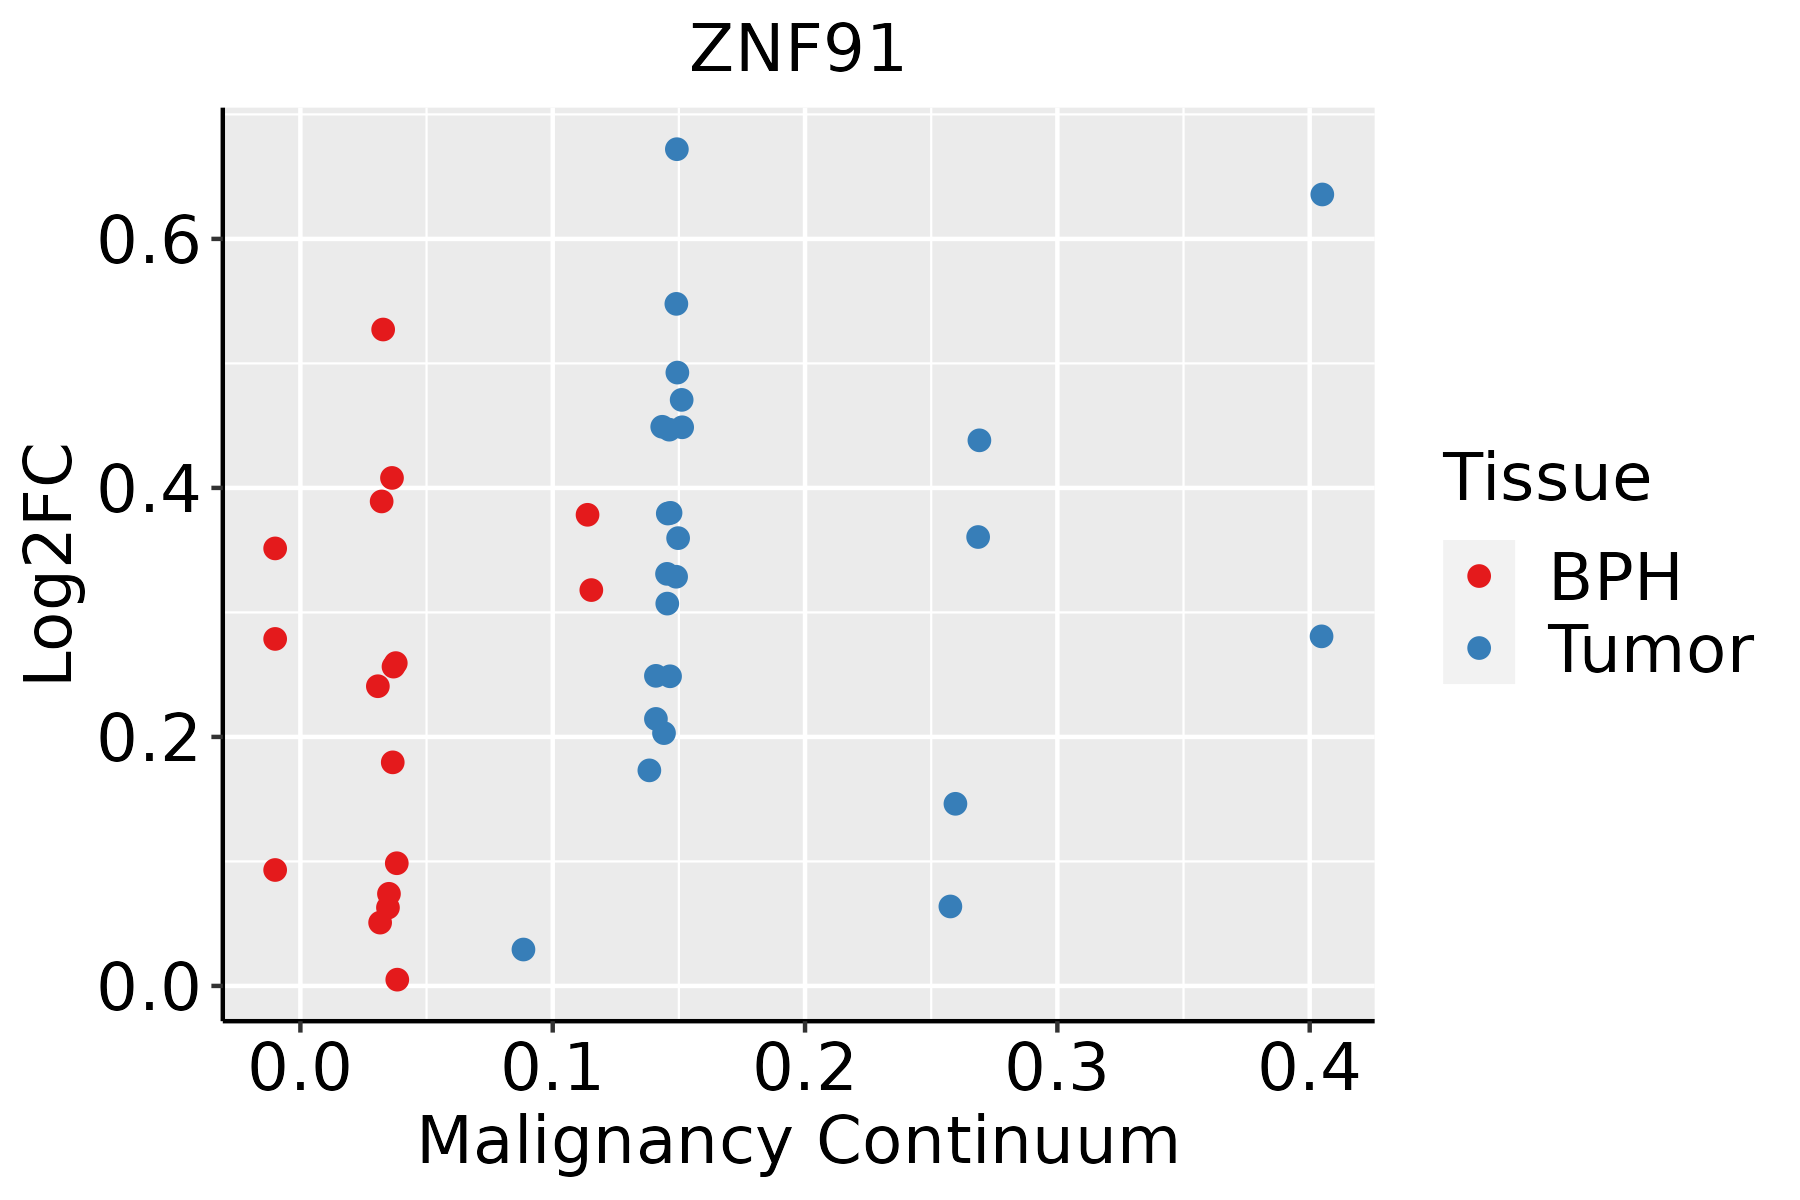 | BPH: Benign Prostatic Hyperplasia |
| Thyroid | 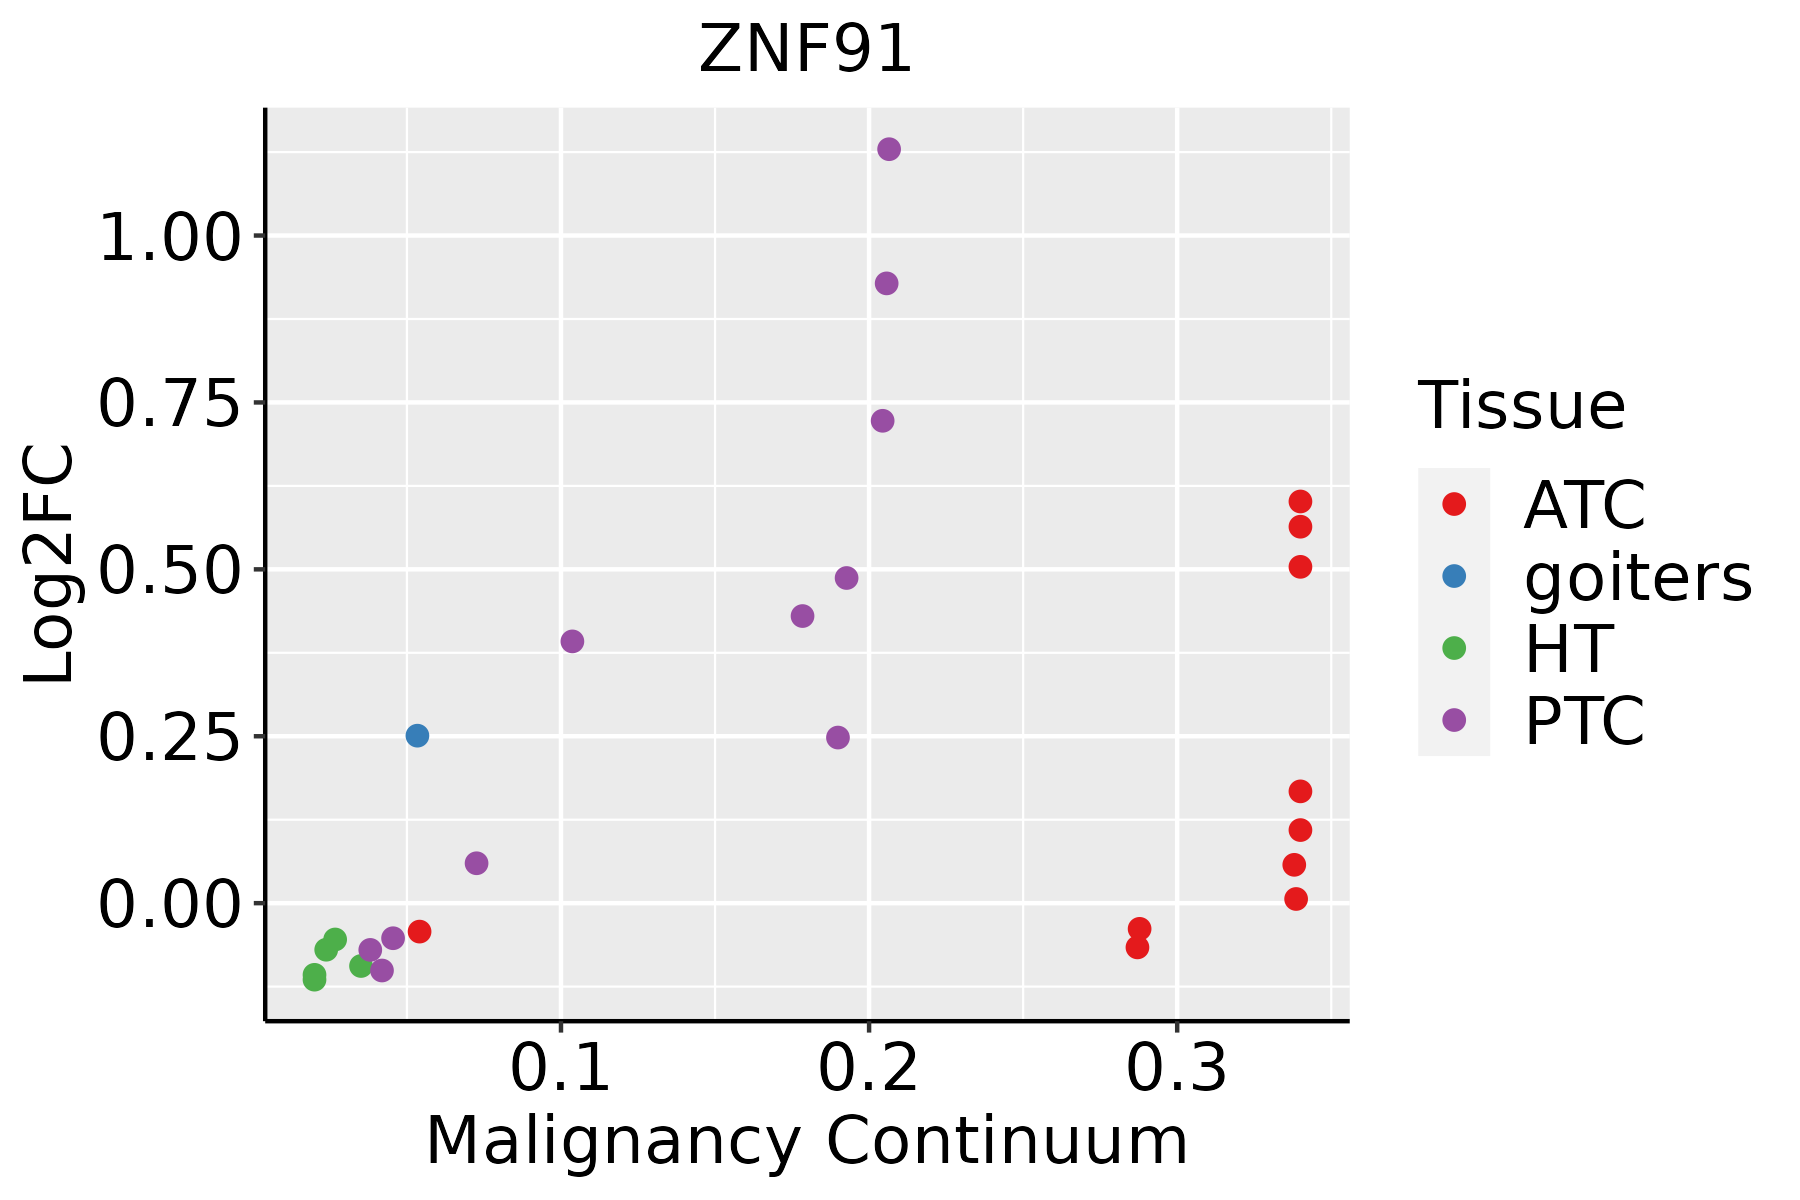 | ATC: Anaplastic thyroid cancer |
| HT: Hashimoto's thyroiditis |
| PTC: Papillary thyroid cancer |
| GO ID | Tissue | Disease Stage | Description | Gene Ratio | Bg Ratio | pvalue | p.adjust | Count |
| GO:0051052 | Colorectum | AD | regulation of DNA metabolic process | 116/3918 | 359/18723 | 2.47e-07 | 1.00e-05 | 116 |
| GO:00510521 | Colorectum | SER | regulation of DNA metabolic process | 83/2897 | 359/18723 | 8.03e-05 | 1.77e-03 | 83 |
| GO:00510522 | Colorectum | MSS | regulation of DNA metabolic process | 108/3467 | 359/18723 | 5.86e-08 | 3.10e-06 | 108 |
| GO:00510524 | Colorectum | FAP | regulation of DNA metabolic process | 84/2622 | 359/18723 | 9.80e-07 | 4.38e-05 | 84 |
| GO:00510525 | Colorectum | CRC | regulation of DNA metabolic process | 70/2078 | 359/18723 | 1.75e-06 | 8.92e-05 | 70 |
| GO:005105215 | Esophagus | ESCC | regulation of DNA metabolic process | 232/8552 | 359/18723 | 2.40e-13 | 1.13e-11 | 232 |
| GO:0051053 | Liver | NAFLD | negative regulation of DNA metabolic process | 26/1882 | 125/18723 | 2.52e-04 | 4.12e-03 | 26 |
| GO:00510526 | Liver | NAFLD | regulation of DNA metabolic process | 56/1882 | 359/18723 | 5.95e-04 | 7.92e-03 | 56 |
| GO:005105211 | Liver | Cirrhotic | regulation of DNA metabolic process | 114/4634 | 359/18723 | 1.48e-03 | 9.85e-03 | 114 |
| GO:005105221 | Liver | HCC | regulation of DNA metabolic process | 198/7958 | 359/18723 | 7.62e-07 | 1.17e-05 | 198 |
| GO:00510529 | Prostate | BPH | regulation of DNA metabolic process | 89/3107 | 359/18723 | 4.07e-05 | 4.36e-04 | 89 |
| GO:005105212 | Prostate | Tumor | regulation of DNA metabolic process | 88/3246 | 359/18723 | 3.23e-04 | 2.59e-03 | 88 |
| GO:005105218 | Thyroid | PTC | regulation of DNA metabolic process | 171/5968 | 359/18723 | 2.52e-10 | 8.33e-09 | 171 |
| GO:00510532 | Thyroid | PTC | negative regulation of DNA metabolic process | 53/5968 | 125/18723 | 8.39e-03 | 3.53e-02 | 53 |
| GO:005105219 | Thyroid | ATC | regulation of DNA metabolic process | 183/6293 | 359/18723 | 5.97e-12 | 2.30e-10 | 183 |
| GO:00510531 | Thyroid | ATC | negative regulation of DNA metabolic process | 57/6293 | 125/18723 | 3.47e-03 | 1.55e-02 | 57 |
| TF | Cell Type | Tissue | Disease Stage | Target Gene | RSS | Regulon Activity |
| ZNF91 | MLUM | Breast | IDC | N4BP2L2,XIST,SSFA2, etc. | 5.44e-01 |  |
| ZNF91 | CD8TCM | Cervix | N_HPV | ZNF708,ATM,MTHFR, etc. | 1.10e-01 |  |
| ZNF91 | M1MAC | Lung | ADJ | AC244131.2,SCGB3A2,SLC12A2, etc. | 1.24e-04 |  |
| ZNF91 | TFH | Lung | ADJ | AC244131.2,SCGB3A2,SLC12A2, etc. | 1.37e-05 | |
| ZNF91 | NEUT | Lung | ADJ | AC244131.2,SCGB3A2,SLC12A2, etc. | 2.62e-03 | |
| ZNF91 | MALTB | Lung | ADJ | AC244131.2,SCGB3A2,SLC12A2, etc. | 1.75e-04 | |
| ZNF91 | BMEM | Lung | ADJ | AC244131.2,SCGB3A2,SLC12A2, etc. | 8.21e-06 | |
| ZNF91 | GC | Lung | ADJ | AC244131.2,SCGB3A2,SLC12A2, etc. | 2.37e-04 | |
| ZNF91 | MDSC | Lung | ADJ | AC244131.2,SCGB3A2,SLC12A2, etc. | 0.00e+00 | |
| ZNF91 | CD4TN | Oral cavity | EOLP | CD200R1,JHY,PAXIP1-AS2, etc. | 1.44e-01 |  |
| Hugo Symbol | Variant Class | Variant Classification | dbSNP RS | HGVSc | HGVSp | HGVSp Short | SWISSPROT | BIOTYPE | SIFT | PolyPhen | Tumor Sample Barcode | Tissue | Histology | Sex | Age | Stage | Therapy Types | Drugs | Outcome |
| ZNF91 | SNV | Missense_Mutation | | c.2684N>T | p.Ser895Leu | p.S895L | Q05481 | protein_coding | deleterious(0) | possibly_damaging(0.807) | TCGA-A1-A0SF-01 | Breast | breast invasive carcinoma | Female | <65 | I/II | Chemotherapy | tc | SD |
| ZNF91 | SNV | Missense_Mutation | | c.635G>C | p.Cys212Ser | p.C212S | Q05481 | protein_coding | deleterious(0.01) | possibly_damaging(0.597) | TCGA-A2-A0YG-01 | Breast | breast invasive carcinoma | Female | <65 | III/IV | Chemotherapy | cytoxan | SD |
| ZNF91 | SNV | Missense_Mutation | | c.920N>T | p.Ser307Leu | p.S307L | Q05481 | protein_coding | deleterious(0.01) | benign(0.199) | TCGA-AC-A23H-01 | Breast | breast invasive carcinoma | Female | >=65 | I/II | Unknown | Unknown | PD |
| ZNF91 | SNV | Missense_Mutation | | c.1025N>A | p.Arg342Lys | p.R342K | Q05481 | protein_coding | tolerated(0.35) | benign(0.086) | TCGA-AN-A046-01 | Breast | breast invasive carcinoma | Female | >=65 | I/II | Unknown | Unknown | SD |
| ZNF91 | SNV | Missense_Mutation | novel | c.1676N>T | p.Ser559Leu | p.S559L | Q05481 | protein_coding | deleterious(0) | benign(0.078) | TCGA-BH-A0B6-01 | Breast | breast invasive carcinoma | Female | <65 | I/II | Unknown | Unknown | SD |
| ZNF91 | SNV | Missense_Mutation | | c.2905N>A | p.Glu969Lys | p.E969K | Q05481 | protein_coding | tolerated(0.72) | possibly_damaging(0.863) | TCGA-BH-A1FN-01 | Breast | breast invasive carcinoma | Female | <65 | I/II | Unknown | Unknown | PD |
| ZNF91 | SNV | Missense_Mutation | | c.3305G>C | p.Gly1102Ala | p.G1102A | Q05481 | protein_coding | deleterious(0.04) | probably_damaging(0.928) | TCGA-E2-A14X-01 | Breast | breast invasive carcinoma | Female | <65 | III/IV | Chemotherapy | doxorubicin | SD |
| ZNF91 | SNV | Missense_Mutation | novel | c.2635G>C | p.Glu879Gln | p.E879Q | Q05481 | protein_coding | deleterious(0.02) | probably_damaging(0.964) | TCGA-EW-A423-01 | Breast | breast invasive carcinoma | Female | >=65 | I/II | Hormone Therapy | anastrozole | SD |
| ZNF91 | SNV | Missense_Mutation | | c.2301G>C | p.Glu767Asp | p.E767D | Q05481 | protein_coding | deleterious(0.05) | possibly_damaging(0.598) | TCGA-EW-A423-01 | Breast | breast invasive carcinoma | Female | >=65 | I/II | Hormone Therapy | anastrozole | SD |
| ZNF91 | SNV | Missense_Mutation | novel | c.1961G>C | p.Gly654Ala | p.G654A | Q05481 | protein_coding | deleterious(0.01) | possibly_damaging(0.671) | TCGA-EW-A423-01 | Breast | breast invasive carcinoma | Female | >=65 | I/II | Hormone Therapy | anastrozole | SD |


