
|
|||||
|
 | |
| |
| |
| |
| |
| |
|
Gene: ZNF84 |
Gene summary for ZNF84 |
| Gene information | Species | Human | Gene symbol | ZNF84 | Gene ID | 7637 |
| Gene name | zinc finger protein 84 | |
| Gene Alias | HPF2 | |
| Cytomap | 12q24.33 | |
| Gene Type | protein-coding | GO ID | GO:0006139 | UniProtAcc | P51523 |
Top |
Malignant transformation analysis |
| Identification of the aberrant gene expression in precancerous and cancerous lesions by comparing the gene expression of stem-like cells in diseased tissues with normal stem cells |
| Entrez ID | Symbol | Replicates | Species | Organ | Tissue | Adj P-value | Log2FC | Malignancy |
| 7637 | ZNF84 | LZE4T | Human | Esophagus | ESCC | 2.04e-07 | 1.52e-01 | 0.0811 |
| 7637 | ZNF84 | LZE7T | Human | Esophagus | ESCC | 1.98e-03 | 3.96e-01 | 0.0667 |
| 7637 | ZNF84 | LZE22T | Human | Esophagus | ESCC | 2.46e-02 | 3.12e-01 | 0.068 |
| 7637 | ZNF84 | LZE24T | Human | Esophagus | ESCC | 1.31e-07 | 2.22e-01 | 0.0596 |
| 7637 | ZNF84 | P1T-E | Human | Esophagus | ESCC | 3.01e-05 | 2.27e-01 | 0.0875 |
| 7637 | ZNF84 | P2T-E | Human | Esophagus | ESCC | 3.59e-46 | 7.58e-01 | 0.1177 |
| 7637 | ZNF84 | P4T-E | Human | Esophagus | ESCC | 1.25e-22 | 5.40e-01 | 0.1323 |
| 7637 | ZNF84 | P5T-E | Human | Esophagus | ESCC | 5.29e-16 | 2.40e-01 | 0.1327 |
| 7637 | ZNF84 | P8T-E | Human | Esophagus | ESCC | 3.47e-25 | 3.82e-01 | 0.0889 |
| 7637 | ZNF84 | P9T-E | Human | Esophagus | ESCC | 7.02e-03 | 1.25e-01 | 0.1131 |
| 7637 | ZNF84 | P10T-E | Human | Esophagus | ESCC | 1.27e-37 | 6.17e-01 | 0.116 |
| 7637 | ZNF84 | P11T-E | Human | Esophagus | ESCC | 1.69e-10 | 3.90e-01 | 0.1426 |
| 7637 | ZNF84 | P12T-E | Human | Esophagus | ESCC | 2.22e-23 | 4.27e-01 | 0.1122 |
| 7637 | ZNF84 | P15T-E | Human | Esophagus | ESCC | 1.88e-13 | 3.60e-01 | 0.1149 |
| 7637 | ZNF84 | P16T-E | Human | Esophagus | ESCC | 5.42e-22 | 4.04e-01 | 0.1153 |
| 7637 | ZNF84 | P17T-E | Human | Esophagus | ESCC | 1.20e-03 | 1.72e-01 | 0.1278 |
| 7637 | ZNF84 | P19T-E | Human | Esophagus | ESCC | 2.73e-02 | 2.00e-01 | 0.1662 |
| 7637 | ZNF84 | P21T-E | Human | Esophagus | ESCC | 1.02e-21 | 2.91e-01 | 0.1617 |
| 7637 | ZNF84 | P22T-E | Human | Esophagus | ESCC | 2.00e-17 | 3.36e-01 | 0.1236 |
| 7637 | ZNF84 | P23T-E | Human | Esophagus | ESCC | 2.04e-10 | 2.53e-01 | 0.108 |
| Page: 1 2 3 4 |
| Tissue | Expression Dynamics | Abbreviation |
| Esophagus | 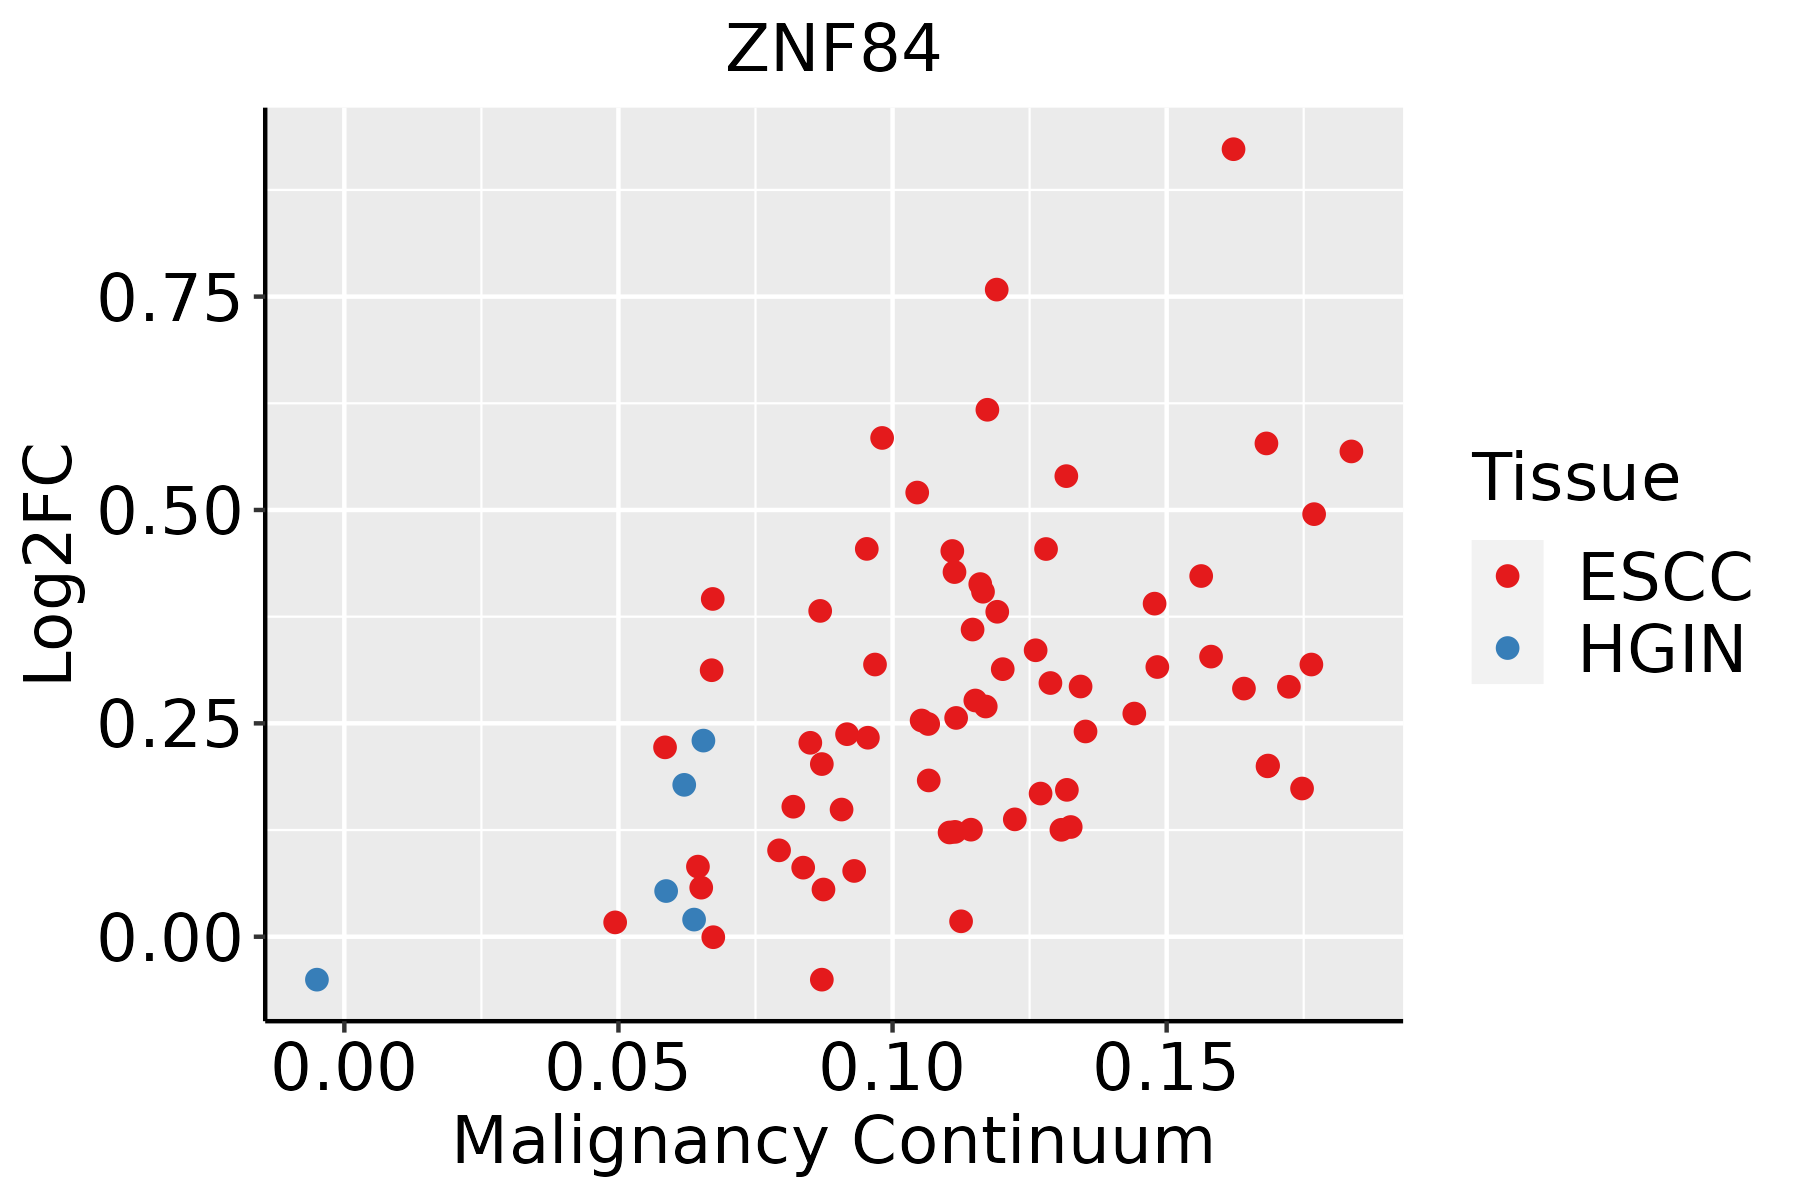 | ESCC: Esophageal squamous cell carcinoma |
| HGIN: High-grade intraepithelial neoplasias | ||
| LGIN: Low-grade intraepithelial neoplasias | ||
| Liver |  | HCC: Hepatocellular carcinoma |
| NAFLD: Non-alcoholic fatty liver disease |
| ∗log2FC in expression of this searched gene in stem-like cells from each diseased tissue sample relative to stem-like cells in normal samples in each tissue plotted against the malignancy continuum. Samples are colored based on if they are from different disease stage. |
Top |
Malignant transformation related pathway analysis |
| Find out the enriched GO biological processes and KEGG pathways involved in transition from healthy to precancer to cancer |
| Tissue | Disease Stage | Enriched GO biological Processes |
| Colorectum | AD |  |
| Colorectum | SER |  |
| Colorectum | MSS |  |
| Colorectum | MSI-H |  |
| Colorectum | FAP |  |
| ∗Top 15 enriched GO BP terms are showed in the bar plot of each disease state in each tissue. Each row represents a significant GO biological process which is colored according to the -log10(p.adjust). |
| Page: 1 2 3 4 5 6 7 8 9 |
| GO ID | Tissue | Disease Stage | Description | Gene Ratio | Bg Ratio | pvalue | p.adjust | Count |
| Page: 1 |
| Pathway ID | Tissue | Disease Stage | Description | Gene Ratio | Bg Ratio | pvalue | p.adjust | qvalue | Count |
| Page: 1 |
Top |
Cell-cell communication analysis |
| Identification of potential cell-cell interactions between two cell types and their ligand-receptor pairs for different disease states |
| Ligand | Receptor | LRpair | Pathway | Tissue | Disease Stage |
| Page: 1 |
Top |
Single-cell gene regulatory network inference analysis |
| Find out the significant the regulons (TFs) and the target genes of each regulon across cell types for different disease states |
| TF | Cell Type | Tissue | Disease Stage | Target Gene | RSS | Regulon Activity |
| ZNF84 | ECM | Thyroid | Healthy | MEGF6,ZNF629,UBE2D4, etc. | 4.42e-01 |  |
| ∗The dot plots of a searched regulon are shown for all cell subpopulations in each disease state of each tissue based on the regulon specific score inferred using pySCENIC and by calculating the average expression. |
| Page: 1 |
Top |
Somatic mutation of malignant transformation related genes |
| Annotation of somatic variants for genes involved in malignant transformation |
| Hugo Symbol | Variant Class | Variant Classification | dbSNP RS | HGVSc | HGVSp | HGVSp Short | SWISSPROT | BIOTYPE | SIFT | PolyPhen | Tumor Sample Barcode | Tissue | Histology | Sex | Age | Stage | Therapy Types | Drugs | Outcome |
| ZNF84 | SNV | Missense_Mutation | novel | c.920T>C | p.Ile307Thr | p.I307T | P51523 | protein_coding | tolerated(0.12) | benign(0.009) | TCGA-AN-A0AK-01 | Breast | breast invasive carcinoma | Female | >=65 | I/II | Unknown | Unknown | SD |
| ZNF84 | SNV | Missense_Mutation | novel | c.2080N>G | p.Gln694Glu | p.Q694E | P51523 | protein_coding | tolerated(0.72) | benign(0.006) | TCGA-C8-A12T-01 | Breast | breast invasive carcinoma | Female | <65 | I/II | Unknown | Unknown | SD |
| ZNF84 | SNV | Missense_Mutation | novel | c.1681C>T | p.His561Tyr | p.H561Y | P51523 | protein_coding | deleterious(0) | probably_damaging(0.977) | TCGA-E9-A1R0-01 | Breast | breast invasive carcinoma | Female | <65 | I/II | Chemotherapy | cyclophosphamide | SD |
| ZNF84 | insertion | Frame_Shift_Ins | novel | c.1282_1283insA | p.Lys429GlufsTer35 | p.K429Efs*35 | P51523 | protein_coding | TCGA-A2-A0EO-01 | Breast | breast invasive carcinoma | Female | <65 | I/II | Hormone Therapy | tamoxiphen | SD | ||
| ZNF84 | insertion | Nonsense_Mutation | novel | c.1284_1285insGAAATCAAACAGTGAAGGTGACTTAGATGGATTGATTTTA | p.Lys429GlufsTer5 | p.K429Efs*5 | P51523 | protein_coding | TCGA-A2-A0EO-01 | Breast | breast invasive carcinoma | Female | <65 | I/II | Hormone Therapy | tamoxiphen | SD | ||
| ZNF84 | insertion | Nonsense_Mutation | novel | c.929_930insAAAGCTTCTTCTAACCTTTTTTCTTTGCTTTTCATGT | p.Trp310Ter | p.W310* | P51523 | protein_coding | TCGA-A8-A09D-01 | Breast | breast invasive carcinoma | Female | <65 | I/II | Chemotherapy | doxorubicin | CR | ||
| ZNF84 | deletion | Frame_Shift_Del | novel | c.733delN | p.Gln246ArgfsTer206 | p.Q246Rfs*206 | P51523 | protein_coding | TCGA-EW-A2FV-01 | Breast | breast invasive carcinoma | Female | <65 | III/IV | Chemotherapy | docetaxel | SD | ||
| ZNF84 | SNV | Missense_Mutation | novel | c.268N>C | p.Trp90Arg | p.W90R | P51523 | protein_coding | tolerated(0.44) | benign(0.003) | TCGA-2W-A8YY-01 | Cervix | cervical & endocervical cancer | Female | <65 | I/II | Chemotherapy | cisplatin | CR |
| ZNF84 | SNV | Missense_Mutation | novel | c.137N>T | p.Ser46Leu | p.S46L | P51523 | protein_coding | deleterious(0.04) | possibly_damaging(0.528) | TCGA-C5-A902-01 | Cervix | cervical & endocervical cancer | Female | <65 | I/II | Chemotherapy | cisplatin | SD |
| ZNF84 | SNV | Missense_Mutation | novel | c.496N>A | p.Leu166Ile | p.L166I | P51523 | protein_coding | tolerated(0.27) | benign(0.081) | TCGA-DS-A0VK-01 | Cervix | cervical & endocervical cancer | Female | <65 | I/II | Chemotherapy | carboplatin | PD |
| Page: 1 2 3 4 5 6 7 8 9 10 11 12 |
Top |
Related drugs of malignant transformation related genes |
| Identification of chemicals and drugs interact with genes involved in malignant transfromation |
| (DGIdb 4.0) |
| Entrez ID | Symbol | Category | Interaction Types | Drug Claim Name | Drug Name | PMIDs |
| Page: 1 |

Copyright 2023-Present -The University of Texas Health Science Center at Houston |