
|
|||||
|
 | |
| |
| |
| |
| |
| |
|
Gene: ZNF830 |
Gene summary for ZNF830 |
| Gene information | Species | Human | Gene symbol | ZNF830 | Gene ID | 91603 |
| Gene name | zinc finger protein 830 | |
| Gene Alias | CCDC16 | |
| Cytomap | 17q12 | |
| Gene Type | protein-coding | GO ID | GO:0000003 | UniProtAcc | Q96NB3 |
Top |
Malignant transformation analysis |
| Identification of the aberrant gene expression in precancerous and cancerous lesions by comparing the gene expression of stem-like cells in diseased tissues with normal stem cells |
| Entrez ID | Symbol | Replicates | Species | Organ | Tissue | Adj P-value | Log2FC | Malignancy |
| 91603 | ZNF830 | LZE4T | Human | Esophagus | ESCC | 4.48e-11 | 2.95e-01 | 0.0811 |
| 91603 | ZNF830 | LZE7T | Human | Esophagus | ESCC | 1.66e-07 | 3.24e-01 | 0.0667 |
| 91603 | ZNF830 | LZE8T | Human | Esophagus | ESCC | 3.35e-07 | 6.36e-02 | 0.067 |
| 91603 | ZNF830 | LZE22T | Human | Esophagus | ESCC | 2.83e-04 | 4.02e-01 | 0.068 |
| 91603 | ZNF830 | LZE24T | Human | Esophagus | ESCC | 1.27e-14 | 3.70e-01 | 0.0596 |
| 91603 | ZNF830 | LZE6T | Human | Esophagus | ESCC | 4.02e-07 | 2.18e-01 | 0.0845 |
| 91603 | ZNF830 | P1T-E | Human | Esophagus | ESCC | 3.56e-05 | 3.73e-01 | 0.0875 |
| 91603 | ZNF830 | P2T-E | Human | Esophagus | ESCC | 1.15e-24 | 3.60e-01 | 0.1177 |
| 91603 | ZNF830 | P4T-E | Human | Esophagus | ESCC | 2.90e-24 | 5.02e-01 | 0.1323 |
| 91603 | ZNF830 | P5T-E | Human | Esophagus | ESCC | 4.48e-19 | 2.06e-01 | 0.1327 |
| 91603 | ZNF830 | P8T-E | Human | Esophagus | ESCC | 3.31e-13 | 2.53e-01 | 0.0889 |
| 91603 | ZNF830 | P9T-E | Human | Esophagus | ESCC | 5.23e-13 | 2.36e-01 | 0.1131 |
| 91603 | ZNF830 | P10T-E | Human | Esophagus | ESCC | 3.14e-17 | 1.67e-01 | 0.116 |
| 91603 | ZNF830 | P11T-E | Human | Esophagus | ESCC | 5.68e-13 | 6.70e-01 | 0.1426 |
| 91603 | ZNF830 | P12T-E | Human | Esophagus | ESCC | 1.55e-20 | 4.51e-01 | 0.1122 |
| 91603 | ZNF830 | P15T-E | Human | Esophagus | ESCC | 6.05e-19 | 4.16e-01 | 0.1149 |
| 91603 | ZNF830 | P16T-E | Human | Esophagus | ESCC | 3.64e-26 | 4.70e-01 | 0.1153 |
| 91603 | ZNF830 | P17T-E | Human | Esophagus | ESCC | 1.40e-03 | 1.17e-01 | 0.1278 |
| 91603 | ZNF830 | P19T-E | Human | Esophagus | ESCC | 1.57e-02 | 1.13e-01 | 0.1662 |
| 91603 | ZNF830 | P20T-E | Human | Esophagus | ESCC | 2.35e-12 | 4.39e-01 | 0.1124 |
| Page: 1 2 3 4 |
| Tissue | Expression Dynamics | Abbreviation |
| Esophagus | 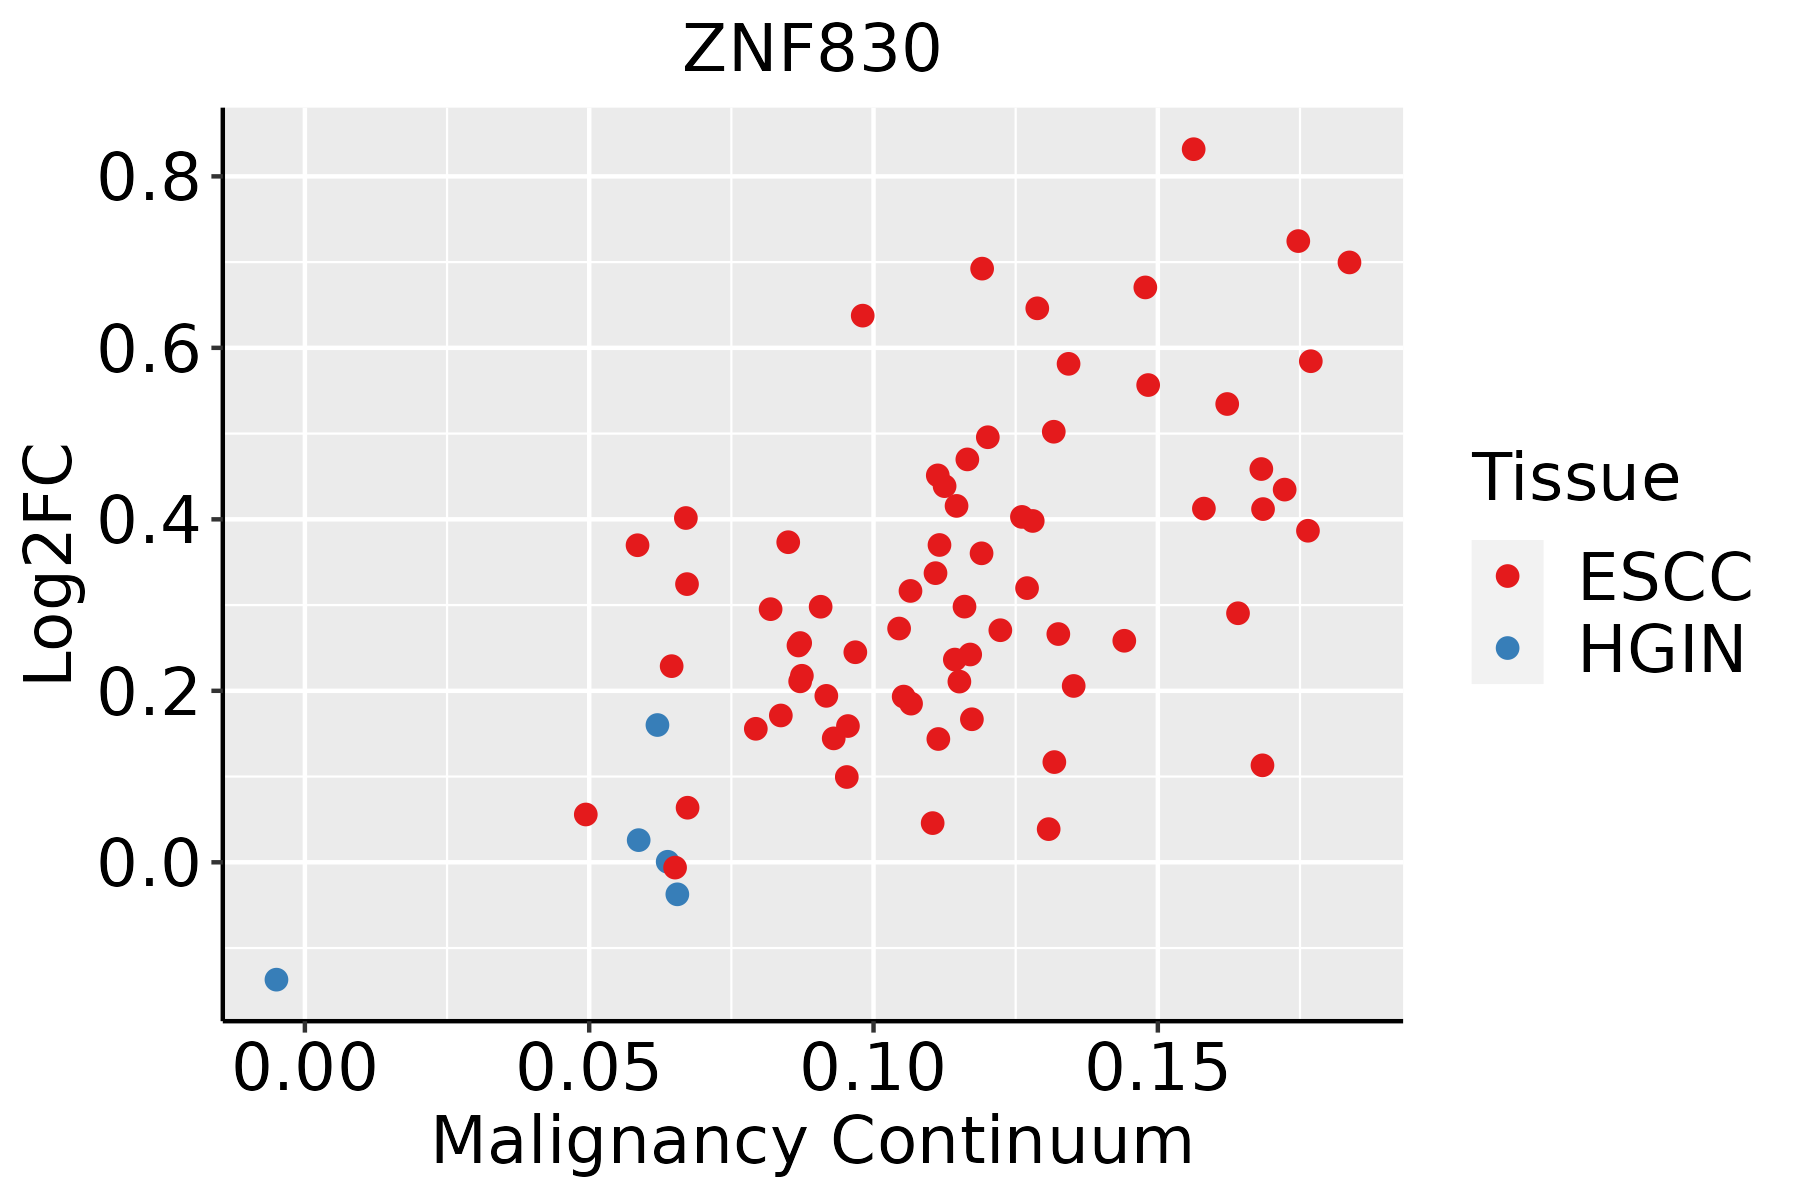 | ESCC: Esophageal squamous cell carcinoma |
| HGIN: High-grade intraepithelial neoplasias | ||
| LGIN: Low-grade intraepithelial neoplasias | ||
| Oral Cavity |  | EOLP: Erosive Oral lichen planus |
| LP: leukoplakia | ||
| NEOLP: Non-erosive oral lichen planus | ||
| OSCC: Oral squamous cell carcinoma |
| ∗log2FC in expression of this searched gene in stem-like cells from each diseased tissue sample relative to stem-like cells in normal samples in each tissue plotted against the malignancy continuum. Samples are colored based on if they are from different disease stage. |
Top |
Malignant transformation related pathway analysis |
| Find out the enriched GO biological processes and KEGG pathways involved in transition from healthy to precancer to cancer |
| Tissue | Disease Stage | Enriched GO biological Processes |
| Colorectum | AD |  |
| Colorectum | SER |  |
| Colorectum | MSS |  |
| Colorectum | MSI-H |  |
| Colorectum | FAP |  |
| ∗Top 15 enriched GO BP terms are showed in the bar plot of each disease state in each tissue. Each row represents a significant GO biological process which is colored according to the -log10(p.adjust). |
| Page: 1 2 3 4 5 6 7 8 9 |
| GO ID | Tissue | Disease Stage | Description | Gene Ratio | Bg Ratio | pvalue | p.adjust | Count |
| GO:0008380111 | Esophagus | ESCC | RNA splicing | 336/8552 | 434/18723 | 1.74e-42 | 3.67e-39 | 336 |
| GO:004477216 | Esophagus | ESCC | mitotic cell cycle phase transition | 281/8552 | 424/18723 | 4.63e-18 | 4.45e-16 | 281 |
| GO:000734615 | Esophagus | ESCC | regulation of mitotic cell cycle | 293/8552 | 457/18723 | 8.00e-16 | 5.64e-14 | 293 |
| GO:000170119 | Esophagus | ESCC | in utero embryonic development | 243/8552 | 367/18723 | 1.00e-15 | 6.86e-14 | 243 |
| GO:00062604 | Esophagus | ESCC | DNA replication | 181/8552 | 260/18723 | 3.55e-15 | 2.05e-13 | 181 |
| GO:190198713 | Esophagus | ESCC | regulation of cell cycle phase transition | 242/8552 | 390/18723 | 3.86e-11 | 1.26e-09 | 242 |
| GO:190199013 | Esophagus | ESCC | regulation of mitotic cell cycle phase transition | 191/8552 | 299/18723 | 1.35e-10 | 3.94e-09 | 191 |
| GO:00457865 | Esophagus | ESCC | negative regulation of cell cycle | 236/8552 | 385/18723 | 3.62e-10 | 9.93e-09 | 236 |
| GO:00000754 | Esophagus | ESCC | cell cycle checkpoint | 117/8552 | 169/18723 | 4.47e-10 | 1.17e-08 | 117 |
| GO:004277014 | Esophagus | ESCC | signal transduction in response to DNA damage | 117/8552 | 172/18723 | 2.38e-09 | 5.32e-08 | 117 |
| GO:00448394 | Esophagus | ESCC | cell cycle G2/M phase transition | 103/8552 | 148/18723 | 3.09e-09 | 6.67e-08 | 103 |
| GO:00000864 | Esophagus | ESCC | G2/M transition of mitotic cell cycle | 96/8552 | 137/18723 | 6.00e-09 | 1.23e-07 | 96 |
| GO:00070934 | Esophagus | ESCC | mitotic cell cycle checkpoint | 90/8552 | 129/18723 | 2.49e-08 | 4.69e-07 | 90 |
| GO:0061458110 | Esophagus | ESCC | reproductive system development | 247/8552 | 427/18723 | 2.24e-07 | 3.42e-06 | 247 |
| GO:00062612 | Esophagus | ESCC | DNA-dependent DNA replication | 100/8552 | 151/18723 | 2.61e-07 | 3.94e-06 | 100 |
| GO:004860818 | Esophagus | ESCC | reproductive structure development | 245/8552 | 424/18723 | 2.82e-07 | 4.14e-06 | 245 |
| GO:00109484 | Esophagus | ESCC | negative regulation of cell cycle process | 177/8552 | 294/18723 | 3.26e-07 | 4.59e-06 | 177 |
| GO:00315705 | Esophagus | ESCC | DNA integrity checkpoint | 83/8552 | 123/18723 | 8.17e-07 | 1.06e-05 | 83 |
| GO:000182412 | Esophagus | ESCC | blastocyst development | 73/8552 | 106/18723 | 1.13e-06 | 1.40e-05 | 73 |
| GO:00000775 | Esophagus | ESCC | DNA damage checkpoint | 78/8552 | 115/18723 | 1.27e-06 | 1.56e-05 | 78 |
| Page: 1 2 3 4 |
| Pathway ID | Tissue | Disease Stage | Description | Gene Ratio | Bg Ratio | pvalue | p.adjust | qvalue | Count |
| Page: 1 |
Top |
Cell-cell communication analysis |
| Identification of potential cell-cell interactions between two cell types and their ligand-receptor pairs for different disease states |
| Ligand | Receptor | LRpair | Pathway | Tissue | Disease Stage |
| Page: 1 |
Top |
Single-cell gene regulatory network inference analysis |
| Find out the significant the regulons (TFs) and the target genes of each regulon across cell types for different disease states |
| TF | Cell Type | Tissue | Disease Stage | Target Gene | RSS | Regulon Activity |
| ∗The dot plots of a searched regulon are shown for all cell subpopulations in each disease state of each tissue based on the regulon specific score inferred using pySCENIC and by calculating the average expression. |
| Page: 1 |
Top |
Somatic mutation of malignant transformation related genes |
| Annotation of somatic variants for genes involved in malignant transformation |
| Hugo Symbol | Variant Class | Variant Classification | dbSNP RS | HGVSc | HGVSp | HGVSp Short | SWISSPROT | BIOTYPE | SIFT | PolyPhen | Tumor Sample Barcode | Tissue | Histology | Sex | Age | Stage | Therapy Types | Drugs | Outcome |
| ZNF830 | SNV | Missense_Mutation | c.20N>A | p.Ala7Asp | p.A7D | Q96NB3 | protein_coding | deleterious(0.02) | benign(0.07) | TCGA-AR-A24H-01 | Breast | breast invasive carcinoma | Female | >=65 | I/II | Hormone Therapy | tamoxiphen | SD | |
| ZNF830 | insertion | Frame_Shift_Ins | novel | c.68_69insCT | p.Leu24CysfsTer2 | p.L24Cfs*2 | Q96NB3 | protein_coding | TCGA-A8-A093-01 | Breast | breast invasive carcinoma | Female | <65 | I/II | Hormone Therapy | tamoxiphen | SD | ||
| ZNF830 | insertion | In_Frame_Ins | novel | c.70_71insCTCACATTTTCATGGTGCCTT | p.Arg23_Leu24insSerHisIlePheMetValPro | p.R23_L24insSHIFMVP | Q96NB3 | protein_coding | TCGA-A8-A093-01 | Breast | breast invasive carcinoma | Female | <65 | I/II | Hormone Therapy | tamoxiphen | SD | ||
| ZNF830 | insertion | Frame_Shift_Ins | novel | c.493_494insCTGCACTCCAGCCTGGGCGACACAGTGAGACTCC | p.Glu165AlafsTer50 | p.E165Afs*50 | Q96NB3 | protein_coding | TCGA-AN-A03X-01 | Breast | breast invasive carcinoma | Female | >=65 | I/II | Unknown | Unknown | SD | ||
| ZNF830 | SNV | Missense_Mutation | c.223N>T | p.His75Tyr | p.H75Y | Q96NB3 | protein_coding | deleterious(0) | possibly_damaging(0.767) | TCGA-DR-A0ZL-01 | Cervix | cervical & endocervical cancer | Female | <65 | I/II | Unknown | Unknown | SD | |
| ZNF830 | SNV | Missense_Mutation | c.484G>C | p.Glu162Gln | p.E162Q | Q96NB3 | protein_coding | deleterious(0.02) | possibly_damaging(0.522) | TCGA-JW-A5VL-01 | Cervix | cervical & endocervical cancer | Female | <65 | I/II | Unknown | Unknown | SD | |
| ZNF830 | SNV | Missense_Mutation | novel | c.100A>C | p.Ser34Arg | p.S34R | Q96NB3 | protein_coding | tolerated(0.44) | benign(0.024) | TCGA-AA-3666-01 | Colorectum | colon adenocarcinoma | Male | >=65 | III/IV | Unknown | Unknown | PD |
| ZNF830 | SNV | Missense_Mutation | c.161N>T | p.Ala54Val | p.A54V | Q96NB3 | protein_coding | tolerated(0.54) | benign(0) | TCGA-AZ-6598-01 | Colorectum | colon adenocarcinoma | Female | >=65 | I/II | Unknown | Unknown | SD | |
| ZNF830 | SNV | Missense_Mutation | c.880N>A | p.Glu294Lys | p.E294K | Q96NB3 | protein_coding | deleterious(0) | probably_damaging(0.999) | TCGA-AG-3890-01 | Colorectum | rectum adenocarcinoma | Male | <65 | I/II | Unknown | Unknown | SD | |
| ZNF830 | SNV | Missense_Mutation | novel | c.627N>A | p.Phe209Leu | p.F209L | Q96NB3 | protein_coding | deleterious(0.02) | benign(0.156) | TCGA-F5-6814-01 | Colorectum | rectum adenocarcinoma | Male | <65 | I/II | Unknown | Unknown | SD |
| Page: 1 2 3 |
Top |
Related drugs of malignant transformation related genes |
| Identification of chemicals and drugs interact with genes involved in malignant transfromation |
| (DGIdb 4.0) |
| Entrez ID | Symbol | Category | Interaction Types | Drug Claim Name | Drug Name | PMIDs |
| Page: 1 |

Copyright 2023-Present -The University of Texas Health Science Center at Houston |