
|
|||||
|
 | |
| |
| |
| |
| |
| |
|
Gene: ZNF827 |
Gene summary for ZNF827 |
| Gene information | Species | Human | Gene symbol | ZNF827 | Gene ID | 152485 |
| Gene name | zinc finger protein 827 | |
| Gene Alias | ZNF827 | |
| Cytomap | 4q31.21-q31.22 | |
| Gene Type | protein-coding | GO ID | GO:0006139 | UniProtAcc | B3KSR1 |
Top |
Malignant transformation analysis |
| Identification of the aberrant gene expression in precancerous and cancerous lesions by comparing the gene expression of stem-like cells in diseased tissues with normal stem cells |
| Entrez ID | Symbol | Replicates | Species | Organ | Tissue | Adj P-value | Log2FC | Malignancy |
| 152485 | ZNF827 | LZE4T | Human | Esophagus | ESCC | 2.79e-02 | 1.97e-01 | 0.0811 |
| 152485 | ZNF827 | LZE8T | Human | Esophagus | ESCC | 4.06e-02 | 9.99e-02 | 0.067 |
| 152485 | ZNF827 | LZE24T | Human | Esophagus | ESCC | 1.98e-03 | 9.08e-02 | 0.0596 |
| 152485 | ZNF827 | P2T-E | Human | Esophagus | ESCC | 2.63e-33 | 5.23e-01 | 0.1177 |
| 152485 | ZNF827 | P4T-E | Human | Esophagus | ESCC | 3.19e-15 | 1.91e-01 | 0.1323 |
| 152485 | ZNF827 | P8T-E | Human | Esophagus | ESCC | 2.56e-10 | 2.27e-01 | 0.0889 |
| 152485 | ZNF827 | P9T-E | Human | Esophagus | ESCC | 4.82e-09 | 1.31e-01 | 0.1131 |
| 152485 | ZNF827 | P10T-E | Human | Esophagus | ESCC | 4.25e-13 | 2.24e-01 | 0.116 |
| 152485 | ZNF827 | P11T-E | Human | Esophagus | ESCC | 5.15e-09 | 2.91e-01 | 0.1426 |
| 152485 | ZNF827 | P12T-E | Human | Esophagus | ESCC | 1.13e-20 | 4.85e-01 | 0.1122 |
| 152485 | ZNF827 | P15T-E | Human | Esophagus | ESCC | 1.21e-23 | 4.32e-01 | 0.1149 |
| 152485 | ZNF827 | P16T-E | Human | Esophagus | ESCC | 7.96e-15 | 3.14e-01 | 0.1153 |
| 152485 | ZNF827 | P20T-E | Human | Esophagus | ESCC | 1.66e-08 | 1.52e-01 | 0.1124 |
| 152485 | ZNF827 | P21T-E | Human | Esophagus | ESCC | 1.26e-05 | 1.19e-01 | 0.1617 |
| 152485 | ZNF827 | P22T-E | Human | Esophagus | ESCC | 1.49e-03 | 9.59e-02 | 0.1236 |
| 152485 | ZNF827 | P23T-E | Human | Esophagus | ESCC | 1.15e-06 | 1.62e-01 | 0.108 |
| 152485 | ZNF827 | P26T-E | Human | Esophagus | ESCC | 2.80e-12 | 2.86e-01 | 0.1276 |
| 152485 | ZNF827 | P27T-E | Human | Esophagus | ESCC | 6.51e-08 | 2.48e-01 | 0.1055 |
| 152485 | ZNF827 | P28T-E | Human | Esophagus | ESCC | 1.40e-05 | 2.05e-01 | 0.1149 |
| 152485 | ZNF827 | P30T-E | Human | Esophagus | ESCC | 8.05e-05 | 2.24e-01 | 0.137 |
| Page: 1 2 3 |
| Tissue | Expression Dynamics | Abbreviation |
| Esophagus | 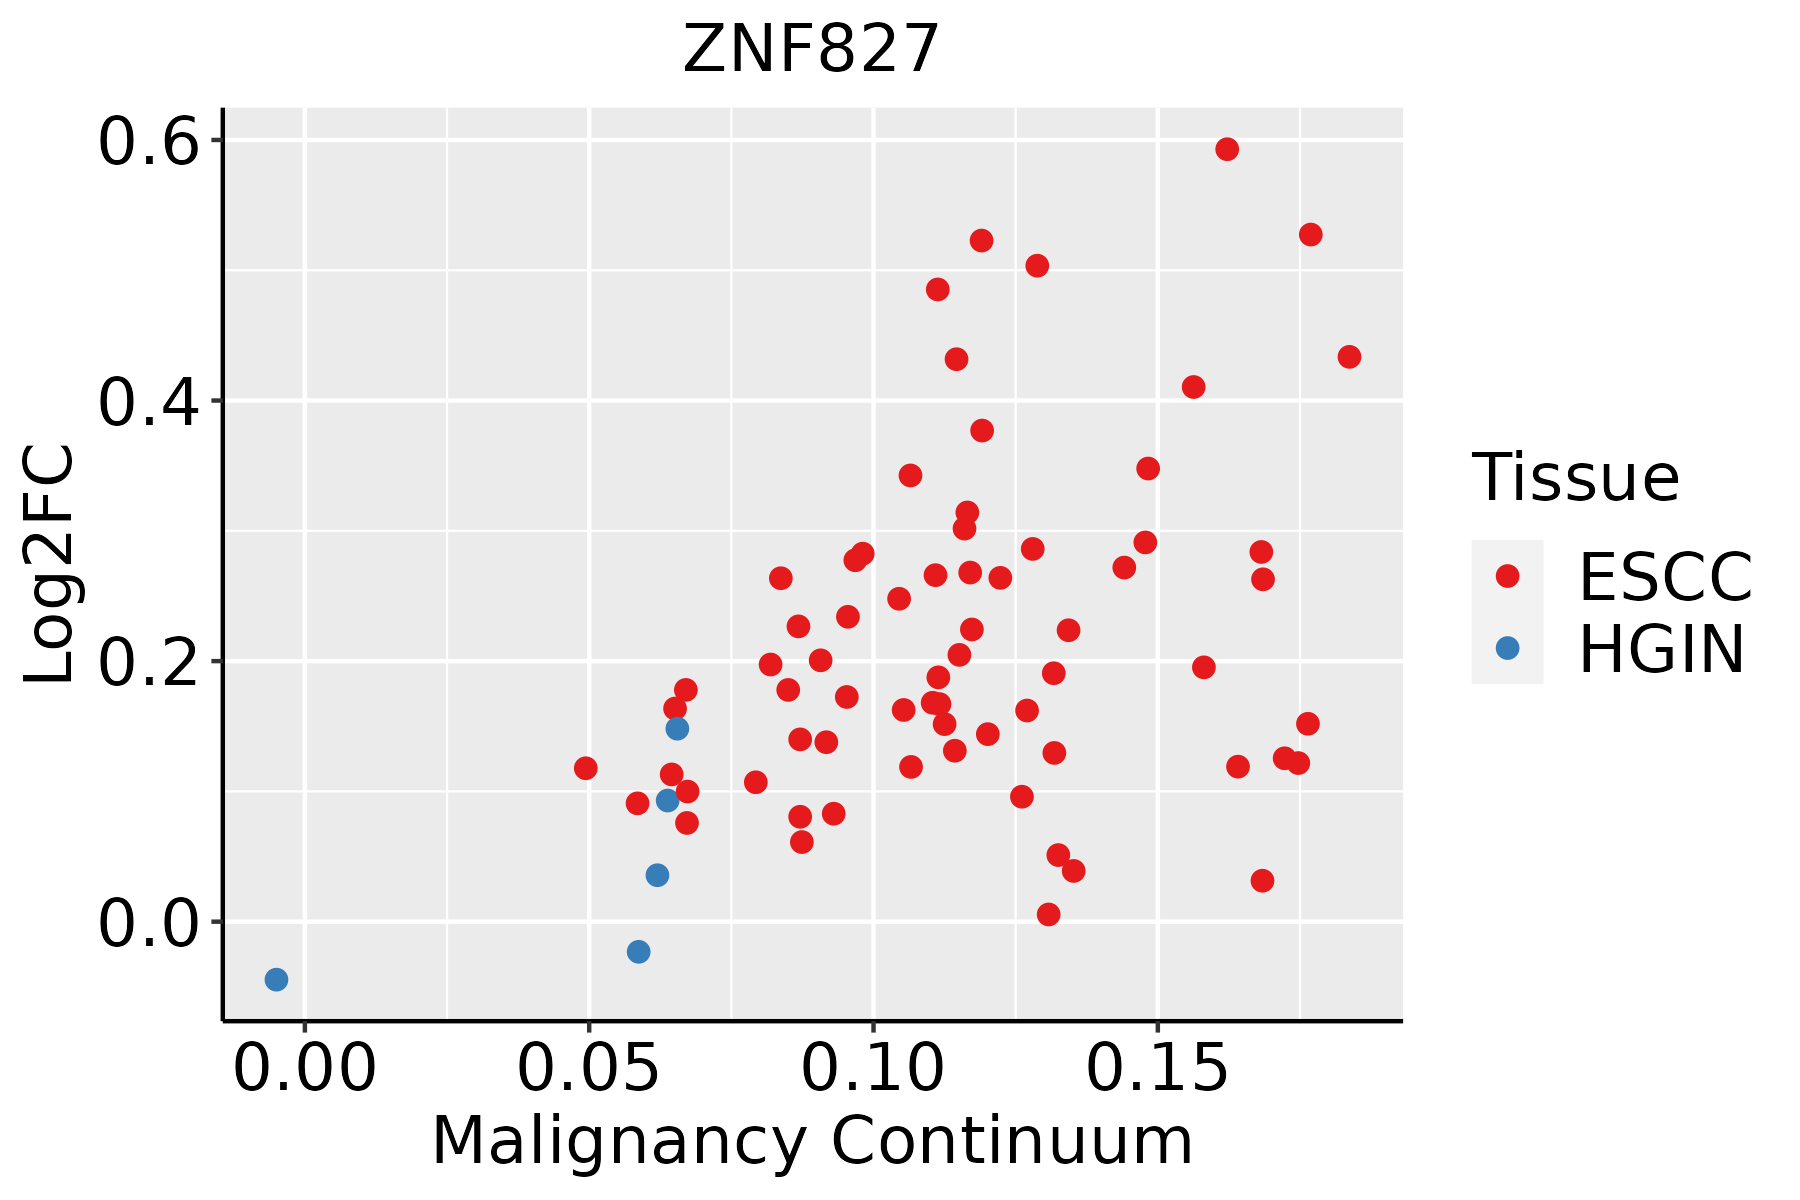 | ESCC: Esophageal squamous cell carcinoma |
| HGIN: High-grade intraepithelial neoplasias | ||
| LGIN: Low-grade intraepithelial neoplasias |
| ∗log2FC in expression of this searched gene in stem-like cells from each diseased tissue sample relative to stem-like cells in normal samples in each tissue plotted against the malignancy continuum. Samples are colored based on if they are from different disease stage. |
Top |
Malignant transformation related pathway analysis |
| Find out the enriched GO biological processes and KEGG pathways involved in transition from healthy to precancer to cancer |
| Tissue | Disease Stage | Enriched GO biological Processes |
| Colorectum | AD |  |
| Colorectum | SER |  |
| Colorectum | MSS |  |
| Colorectum | MSI-H |  |
| Colorectum | FAP |  |
| ∗Top 15 enriched GO BP terms are showed in the bar plot of each disease state in each tissue. Each row represents a significant GO biological process which is colored according to the -log10(p.adjust). |
| Page: 1 2 3 4 5 6 7 8 9 |
| GO ID | Tissue | Disease Stage | Description | Gene Ratio | Bg Ratio | pvalue | p.adjust | Count |
| Page: 1 |
| Pathway ID | Tissue | Disease Stage | Description | Gene Ratio | Bg Ratio | pvalue | p.adjust | qvalue | Count |
| Page: 1 |
Top |
Cell-cell communication analysis |
| Identification of potential cell-cell interactions between two cell types and their ligand-receptor pairs for different disease states |
| Ligand | Receptor | LRpair | Pathway | Tissue | Disease Stage |
| Page: 1 |
Top |
Single-cell gene regulatory network inference analysis |
| Find out the significant the regulons (TFs) and the target genes of each regulon across cell types for different disease states |
| TF | Cell Type | Tissue | Disease Stage | Target Gene | RSS | Regulon Activity |
| ∗The dot plots of a searched regulon are shown for all cell subpopulations in each disease state of each tissue based on the regulon specific score inferred using pySCENIC and by calculating the average expression. |
| Page: 1 |
Top |
Somatic mutation of malignant transformation related genes |
| Annotation of somatic variants for genes involved in malignant transformation |
| Hugo Symbol | Variant Class | Variant Classification | dbSNP RS | HGVSc | HGVSp | HGVSp Short | SWISSPROT | BIOTYPE | SIFT | PolyPhen | Tumor Sample Barcode | Tissue | Histology | Sex | Age | Stage | Therapy Types | Drugs | Outcome |
| ZNF827 | SNV | Missense_Mutation | c.1913G>A | p.Gly638Glu | p.G638E | Q17R98 | protein_coding | deleterious(0.03) | benign(0.048) | TCGA-A2-A0T0-01 | Breast | breast invasive carcinoma | Female | <65 | I/II | Chemotherapy | taxotere | SD | |
| ZNF827 | SNV | Missense_Mutation | rs772895087 | c.1471N>A | p.Glu491Lys | p.E491K | Q17R98 | protein_coding | deleterious_low_confidence(0.01) | benign(0.052) | TCGA-BH-A0AW-01 | Breast | breast invasive carcinoma | Female | <65 | I/II | Chemotherapy | carboplatin | SD |
| ZNF827 | SNV | Missense_Mutation | novel | c.1022N>T | p.Pro341Leu | p.P341L | Q17R98 | protein_coding | tolerated_low_confidence(0.07) | benign(0.003) | TCGA-BH-A0EB-01 | Breast | breast invasive carcinoma | Female | >=65 | I/II | Hormone Therapy | arimidex | SD |
| ZNF827 | SNV | Missense_Mutation | c.1425N>C | p.Lys475Asn | p.K475N | Q17R98 | protein_coding | deleterious(0) | possibly_damaging(0.666) | TCGA-BH-A1FU-01 | Breast | breast invasive carcinoma | Female | <65 | I/II | Unknown | Unknown | PD | |
| ZNF827 | SNV | Missense_Mutation | novel | c.1747G>T | p.Ala583Ser | p.A583S | Q17R98 | protein_coding | deleterious(0) | probably_damaging(0.968) | TCGA-EW-A6SC-01 | Breast | breast invasive carcinoma | Female | <65 | I/II | Hormone Therapy | aromatase | SD |
| ZNF827 | SNV | Missense_Mutation | c.2137G>C | p.Glu713Gln | p.E713Q | Q17R98 | protein_coding | tolerated(0.06) | possibly_damaging(0.474) | TCGA-GM-A2DO-01 | Breast | breast invasive carcinoma | Female | <65 | I/II | Hormone Therapy | tamoxiphen | CR | |
| ZNF827 | insertion | Frame_Shift_Ins | novel | c.2716_2717insTAACTTACAGAATCCCTATTAACAAATCAGCCCTAGAAAAG | p.Thr906IlefsTer53 | p.T906Ifs*53 | Q17R98 | protein_coding | TCGA-AN-A04C-01 | Breast | breast invasive carcinoma | Female | <65 | I/II | Unknown | Unknown | SD | ||
| ZNF827 | insertion | Frame_Shift_Ins | novel | c.1808_1809insT | p.Glu604GlyfsTer19 | p.E604Gfs*19 | Q17R98 | protein_coding | TCGA-B6-A0RE-01 | Breast | breast invasive carcinoma | Female | <65 | I/II | Unknown | Unknown | SD | ||
| ZNF827 | insertion | Nonsense_Mutation | novel | c.1807_1808insATTACTTGGCTTAAATTCCTGTGTTGTGT | p.Gly603AspfsTer5 | p.G603Dfs*5 | Q17R98 | protein_coding | TCGA-B6-A0RE-01 | Breast | breast invasive carcinoma | Female | <65 | I/II | Unknown | Unknown | SD | ||
| ZNF827 | insertion | Nonsense_Mutation | novel | c.2590_2591insAGATTGCTTAATGAACTGATT | p.His863_Leu864insTer | p.H863_L864ins* | Q17R98 | protein_coding | TCGA-BH-A0BD-01 | Breast | breast invasive carcinoma | Female | <65 | I/II | Chemotherapy | doxorubicin | SD |
| Page: 1 2 3 4 5 6 7 8 9 10 11 12 13 |
Top |
Related drugs of malignant transformation related genes |
| Identification of chemicals and drugs interact with genes involved in malignant transfromation |
| (DGIdb 4.0) |
| Entrez ID | Symbol | Category | Interaction Types | Drug Claim Name | Drug Name | PMIDs |
| Page: 1 |

Copyright 2023-Present -The University of Texas Health Science Center at Houston |