
|
|||||
|
 | |
| |
| |
| |
| |
| |
|
Gene: ZNF821 |
Gene summary for ZNF821 |
| Gene information | Species | Human | Gene symbol | ZNF821 | Gene ID | 55565 |
| Gene name | zinc finger protein 821 | |
| Gene Alias | ZNF821 | |
| Cytomap | 16q22.2 | |
| Gene Type | protein-coding | GO ID | GO:0006139 | UniProtAcc | O75541 |
Top |
Malignant transformation analysis |
| Identification of the aberrant gene expression in precancerous and cancerous lesions by comparing the gene expression of stem-like cells in diseased tissues with normal stem cells |
| Entrez ID | Symbol | Replicates | Species | Organ | Tissue | Adj P-value | Log2FC | Malignancy |
| 55565 | ZNF821 | LZE4T | Human | Esophagus | ESCC | 9.56e-12 | 3.39e-01 | 0.0811 |
| 55565 | ZNF821 | LZE5T | Human | Esophagus | ESCC | 1.57e-03 | 1.90e-01 | 0.0514 |
| 55565 | ZNF821 | LZE7T | Human | Esophagus | ESCC | 1.40e-08 | 2.68e-01 | 0.0667 |
| 55565 | ZNF821 | LZE20T | Human | Esophagus | ESCC | 1.74e-07 | 2.18e-01 | 0.0662 |
| 55565 | ZNF821 | LZE21D1 | Human | Esophagus | HGIN | 2.75e-06 | 4.53e-01 | 0.0632 |
| 55565 | ZNF821 | LZE22D1 | Human | Esophagus | HGIN | 3.26e-02 | 1.30e-01 | 0.0595 |
| 55565 | ZNF821 | LZE22T | Human | Esophagus | ESCC | 1.48e-05 | 2.76e-01 | 0.068 |
| 55565 | ZNF821 | LZE24T | Human | Esophagus | ESCC | 8.18e-15 | 3.22e-01 | 0.0596 |
| 55565 | ZNF821 | LZE21T | Human | Esophagus | ESCC | 1.78e-08 | 3.76e-01 | 0.0655 |
| 55565 | ZNF821 | P1T-E | Human | Esophagus | ESCC | 1.88e-22 | 1.00e+00 | 0.0875 |
| 55565 | ZNF821 | P2T-E | Human | Esophagus | ESCC | 2.42e-25 | 3.81e-01 | 0.1177 |
| 55565 | ZNF821 | P4T-E | Human | Esophagus | ESCC | 1.26e-16 | 3.43e-01 | 0.1323 |
| 55565 | ZNF821 | P5T-E | Human | Esophagus | ESCC | 4.18e-16 | 3.21e-01 | 0.1327 |
| 55565 | ZNF821 | P8T-E | Human | Esophagus | ESCC | 3.86e-22 | 3.14e-01 | 0.0889 |
| 55565 | ZNF821 | P9T-E | Human | Esophagus | ESCC | 2.38e-11 | 2.14e-01 | 0.1131 |
| 55565 | ZNF821 | P10T-E | Human | Esophagus | ESCC | 3.11e-26 | 2.88e-01 | 0.116 |
| 55565 | ZNF821 | P11T-E | Human | Esophagus | ESCC | 1.06e-12 | 3.83e-01 | 0.1426 |
| 55565 | ZNF821 | P12T-E | Human | Esophagus | ESCC | 1.90e-28 | 5.44e-01 | 0.1122 |
| 55565 | ZNF821 | P15T-E | Human | Esophagus | ESCC | 3.40e-20 | 3.58e-01 | 0.1149 |
| 55565 | ZNF821 | P16T-E | Human | Esophagus | ESCC | 3.86e-24 | 3.67e-01 | 0.1153 |
| Page: 1 2 3 4 |
| Tissue | Expression Dynamics | Abbreviation |
| Esophagus | 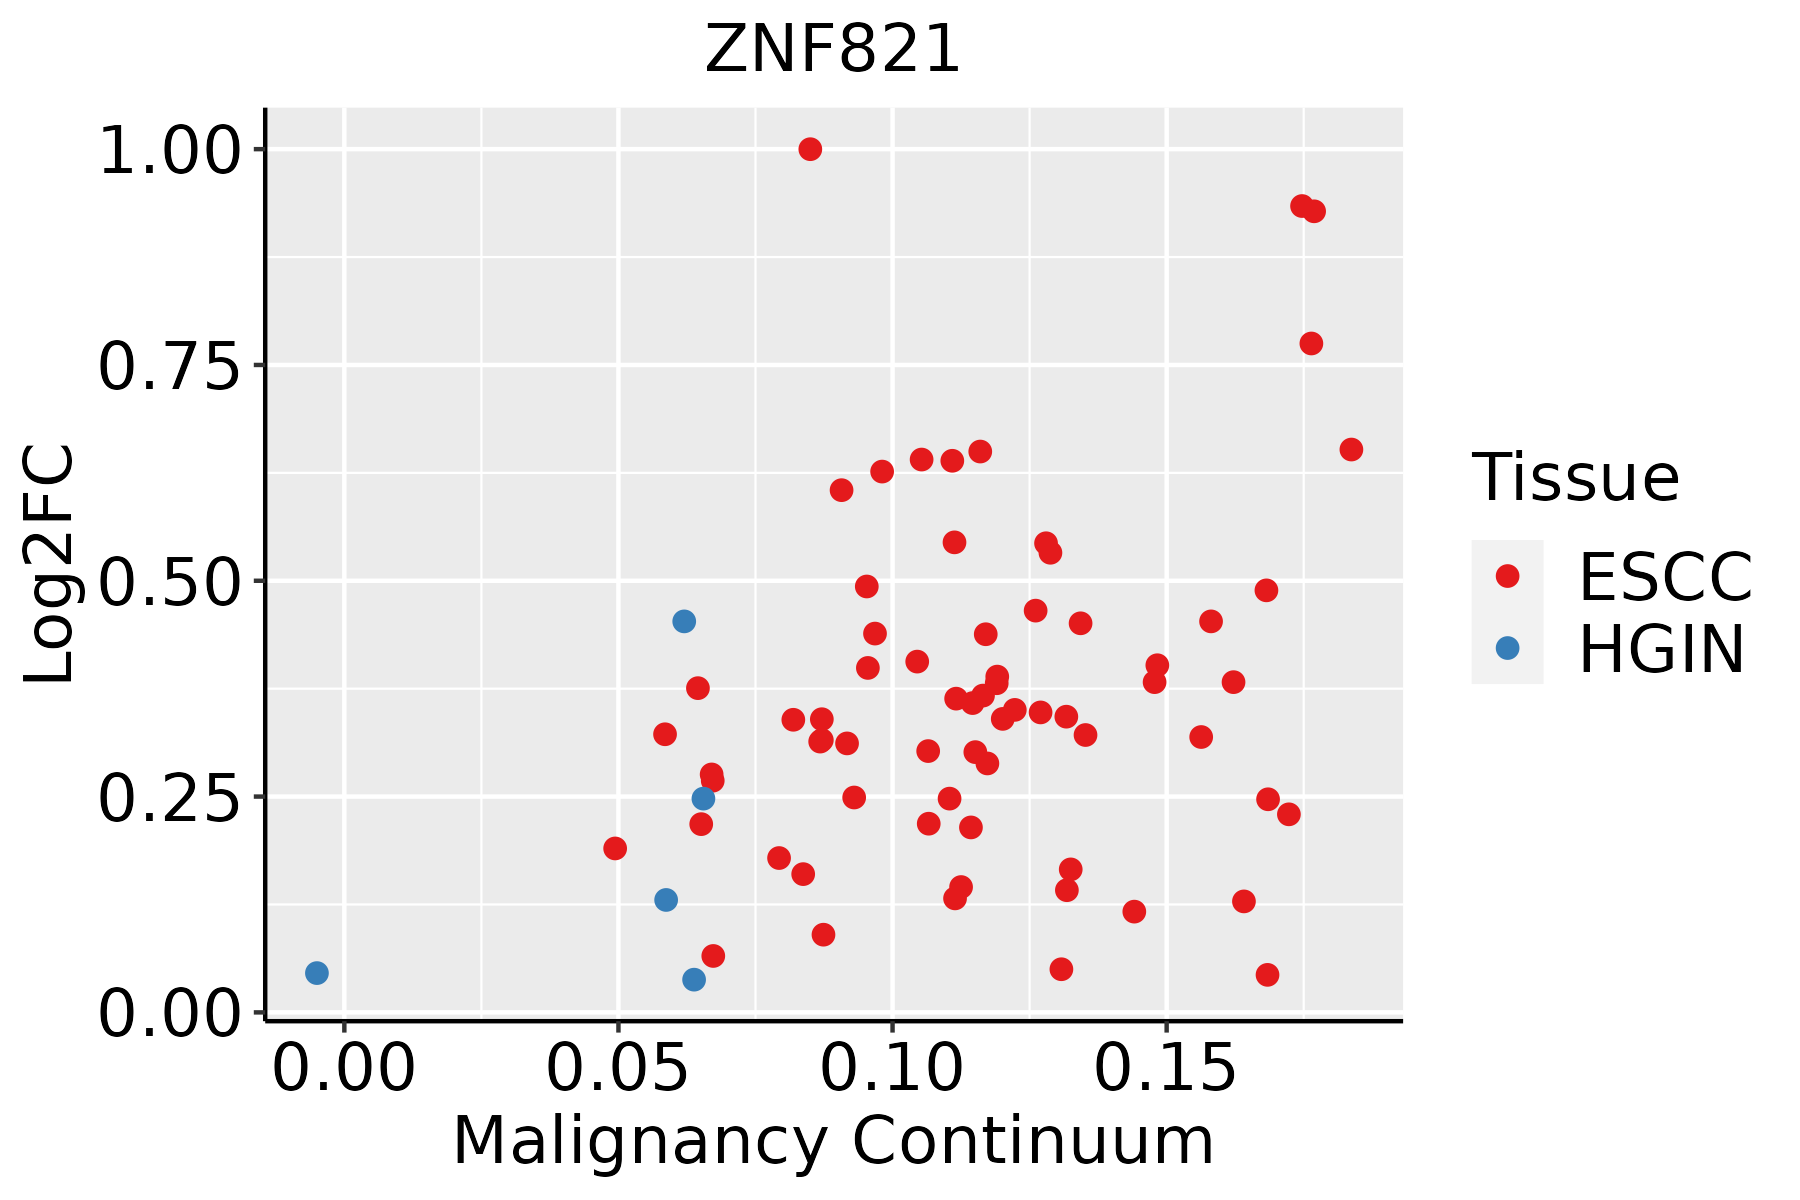 | ESCC: Esophageal squamous cell carcinoma |
| HGIN: High-grade intraepithelial neoplasias | ||
| LGIN: Low-grade intraepithelial neoplasias |
| ∗log2FC in expression of this searched gene in stem-like cells from each diseased tissue sample relative to stem-like cells in normal samples in each tissue plotted against the malignancy continuum. Samples are colored based on if they are from different disease stage. |
Top |
Malignant transformation related pathway analysis |
| Find out the enriched GO biological processes and KEGG pathways involved in transition from healthy to precancer to cancer |
| Tissue | Disease Stage | Enriched GO biological Processes |
| Colorectum | AD |  |
| Colorectum | SER |  |
| Colorectum | MSS |  |
| Colorectum | MSI-H |  |
| Colorectum | FAP |  |
| ∗Top 15 enriched GO BP terms are showed in the bar plot of each disease state in each tissue. Each row represents a significant GO biological process which is colored according to the -log10(p.adjust). |
| Page: 1 2 3 4 5 6 7 8 9 |
| GO ID | Tissue | Disease Stage | Description | Gene Ratio | Bg Ratio | pvalue | p.adjust | Count |
| Page: 1 |
| Pathway ID | Tissue | Disease Stage | Description | Gene Ratio | Bg Ratio | pvalue | p.adjust | qvalue | Count |
| Page: 1 |
Top |
Cell-cell communication analysis |
| Identification of potential cell-cell interactions between two cell types and their ligand-receptor pairs for different disease states |
| Ligand | Receptor | LRpair | Pathway | Tissue | Disease Stage |
| Page: 1 |
Top |
Single-cell gene regulatory network inference analysis |
| Find out the significant the regulons (TFs) and the target genes of each regulon across cell types for different disease states |
| TF | Cell Type | Tissue | Disease Stage | Target Gene | RSS | Regulon Activity |
| ZNF821 | CD8TEXP | Esophagus | ADJ | C15orf40,CXCL6,MFAP1, etc. | 4.89e-02 |  |
| ZNF821 | PLA | Esophagus | Healthy | C15orf40,CXCL6,MFAP1, etc. | 1.55e-01 |  |
| ZNF821 | pDC | Skin | Healthy | FBLN1,PCM1,NAXD, etc. | 7.72e-03 |  |
| ZNF821 | CD8TRM | Skin | Healthy | FBLN1,PCM1,NAXD, etc. | 1.46e-02 | |
| ZNF821 | MSC | Stomach | CAG with IM | NEDD4L,SELENOI,EGOT, etc. | 1.20e-01 |  |
| ZNF821 | LYMEND | Stomach | GC | NEDD4L,SELENOI,EGOT, etc. | 2.02e-02 |  |
| ZNF821 | CAF | Stomach | Healthy | NEDD4L,SELENOI,EGOT, etc. | 7.28e-02 |  |
| ∗The dot plots of a searched regulon are shown for all cell subpopulations in each disease state of each tissue based on the regulon specific score inferred using pySCENIC and by calculating the average expression. |
| Page: 1 |
Top |
Somatic mutation of malignant transformation related genes |
| Annotation of somatic variants for genes involved in malignant transformation |
| Hugo Symbol | Variant Class | Variant Classification | dbSNP RS | HGVSc | HGVSp | HGVSp Short | SWISSPROT | BIOTYPE | SIFT | PolyPhen | Tumor Sample Barcode | Tissue | Histology | Sex | Age | Stage | Therapy Types | Drugs | Outcome |
| ZNF821 | SNV | Missense_Mutation | c.1174N>C | p.Glu392Gln | p.E392Q | O75541 | protein_coding | tolerated_low_confidence(0.05) | benign(0.201) | TCGA-A2-A0CW-01 | Breast | breast invasive carcinoma | Female | >=65 | I/II | Hormone Therapy | anastrozole | SD | |
| ZNF821 | SNV | Missense_Mutation | novel | c.1205C>T | p.Ala402Val | p.A402V | O75541 | protein_coding | tolerated_low_confidence(0.05) | benign(0.007) | TCGA-AN-A046-01 | Breast | breast invasive carcinoma | Female | >=65 | I/II | Unknown | Unknown | SD |
| ZNF821 | SNV | Missense_Mutation | c.1069G>C | p.Glu357Gln | p.E357Q | O75541 | protein_coding | tolerated(0.07) | probably_damaging(0.986) | TCGA-AR-A0TX-01 | Breast | breast invasive carcinoma | Female | <65 | I/II | Unknown | Unknown | SD | |
| ZNF821 | SNV | Missense_Mutation | c.893T>C | p.Met298Thr | p.M298T | O75541 | protein_coding | deleterious(0.01) | benign(0.258) | TCGA-BH-A18G-01 | Breast | breast invasive carcinoma | Female | >=65 | I/II | Unknown | Unknown | SD | |
| ZNF821 | insertion | Frame_Shift_Ins | novel | c.456_457insGAGTTCTGCTTTCTGAAGTCAA | p.Pro153GlufsTer15 | p.P153Efs*15 | O75541 | protein_coding | TCGA-A8-A08G-01 | Breast | breast invasive carcinoma | Female | <65 | I/II | Chemotherapy | 5-fluorouracil | CR | ||
| ZNF821 | insertion | Frame_Shift_Ins | novel | c.603_604insACCTGGGTGGAAATTTTCAGACAGTGGCTTCTGGTGGCTTGCC | p.Leu202ThrfsTer26 | p.L202Tfs*26 | O75541 | protein_coding | TCGA-A8-A093-01 | Breast | breast invasive carcinoma | Female | <65 | I/II | Hormone Therapy | tamoxiphen | SD | ||
| ZNF821 | SNV | Missense_Mutation | c.327N>C | p.Leu109Phe | p.L109F | O75541 | protein_coding | tolerated(0.23) | benign(0.326) | TCGA-DG-A2KK-01 | Cervix | cervical & endocervical cancer | Female | <65 | III/IV | Chemotherapy | cisplatin | SD | |
| ZNF821 | SNV | Missense_Mutation | rs377750355 | c.439N>A | p.Ala147Thr | p.A147T | O75541 | protein_coding | tolerated(0.29) | benign(0.041) | TCGA-EA-A3HS-01 | Cervix | cervical & endocervical cancer | Female | <65 | I/II | Unknown | Unknown | SD |
| ZNF821 | SNV | Missense_Mutation | c.854G>A | p.Arg285Gln | p.R285Q | O75541 | protein_coding | deleterious(0) | probably_damaging(0.968) | TCGA-AA-3710-01 | Colorectum | colon adenocarcinoma | Female | >=65 | I/II | Unknown | Unknown | SD | |
| ZNF821 | SNV | Missense_Mutation | novel | c.731A>C | p.Tyr244Ser | p.Y244S | O75541 | protein_coding | deleterious(0) | probably_damaging(0.987) | TCGA-AA-A01D-01 | Colorectum | colon adenocarcinoma | Female | <65 | III/IV | Chemotherapy | capecitabine | PD |
| Page: 1 2 3 4 |
Top |
Related drugs of malignant transformation related genes |
| Identification of chemicals and drugs interact with genes involved in malignant transfromation |
| (DGIdb 4.0) |
| Entrez ID | Symbol | Category | Interaction Types | Drug Claim Name | Drug Name | PMIDs |
| Page: 1 |

Copyright 2023-Present -The University of Texas Health Science Center at Houston |