
|
|||||
|
 | |
| |
| |
| |
| |
| |
|
Gene: ZNF791 |
Gene summary for ZNF791 |
| Gene information | Species | Human | Gene symbol | ZNF791 | Gene ID | 163049 |
| Gene name | zinc finger protein 791 | |
| Gene Alias | ZNF791 | |
| Cytomap | 19p13.13 | |
| Gene Type | protein-coding | GO ID | GO:0006139 | UniProtAcc | Q3KP31 |
Top |
Malignant transformation analysis |
| Identification of the aberrant gene expression in precancerous and cancerous lesions by comparing the gene expression of stem-like cells in diseased tissues with normal stem cells |
| Entrez ID | Symbol | Replicates | Species | Organ | Tissue | Adj P-value | Log2FC | Malignancy |
| 163049 | ZNF791 | LZE4T | Human | Esophagus | ESCC | 6.95e-05 | 1.05e-01 | 0.0811 |
| 163049 | ZNF791 | LZE7T | Human | Esophagus | ESCC | 4.20e-12 | 6.24e-01 | 0.0667 |
| 163049 | ZNF791 | LZE24T | Human | Esophagus | ESCC | 5.81e-07 | 2.23e-01 | 0.0596 |
| 163049 | ZNF791 | LZE21T | Human | Esophagus | ESCC | 4.49e-04 | 2.11e-01 | 0.0655 |
| 163049 | ZNF791 | P1T-E | Human | Esophagus | ESCC | 1.55e-09 | 3.59e-01 | 0.0875 |
| 163049 | ZNF791 | P2T-E | Human | Esophagus | ESCC | 4.45e-14 | 1.24e-01 | 0.1177 |
| 163049 | ZNF791 | P4T-E | Human | Esophagus | ESCC | 4.36e-10 | 2.22e-01 | 0.1323 |
| 163049 | ZNF791 | P5T-E | Human | Esophagus | ESCC | 7.48e-12 | 8.70e-02 | 0.1327 |
| 163049 | ZNF791 | P8T-E | Human | Esophagus | ESCC | 3.06e-20 | 3.71e-01 | 0.0889 |
| 163049 | ZNF791 | P9T-E | Human | Esophagus | ESCC | 2.78e-15 | 2.08e-01 | 0.1131 |
| 163049 | ZNF791 | P10T-E | Human | Esophagus | ESCC | 3.99e-31 | 5.18e-01 | 0.116 |
| 163049 | ZNF791 | P11T-E | Human | Esophagus | ESCC | 5.53e-09 | 2.20e-01 | 0.1426 |
| 163049 | ZNF791 | P12T-E | Human | Esophagus | ESCC | 4.66e-17 | 3.25e-01 | 0.1122 |
| 163049 | ZNF791 | P15T-E | Human | Esophagus | ESCC | 4.81e-05 | 1.26e-01 | 0.1149 |
| 163049 | ZNF791 | P16T-E | Human | Esophagus | ESCC | 6.68e-12 | 2.21e-01 | 0.1153 |
| 163049 | ZNF791 | P17T-E | Human | Esophagus | ESCC | 1.55e-04 | 2.41e-01 | 0.1278 |
| 163049 | ZNF791 | P20T-E | Human | Esophagus | ESCC | 2.91e-09 | 2.08e-01 | 0.1124 |
| 163049 | ZNF791 | P21T-E | Human | Esophagus | ESCC | 5.82e-11 | 1.52e-01 | 0.1617 |
| 163049 | ZNF791 | P22T-E | Human | Esophagus | ESCC | 2.37e-23 | 2.51e-01 | 0.1236 |
| 163049 | ZNF791 | P23T-E | Human | Esophagus | ESCC | 2.30e-11 | 2.94e-01 | 0.108 |
| Page: 1 2 3 4 |
| Tissue | Expression Dynamics | Abbreviation |
| Esophagus | 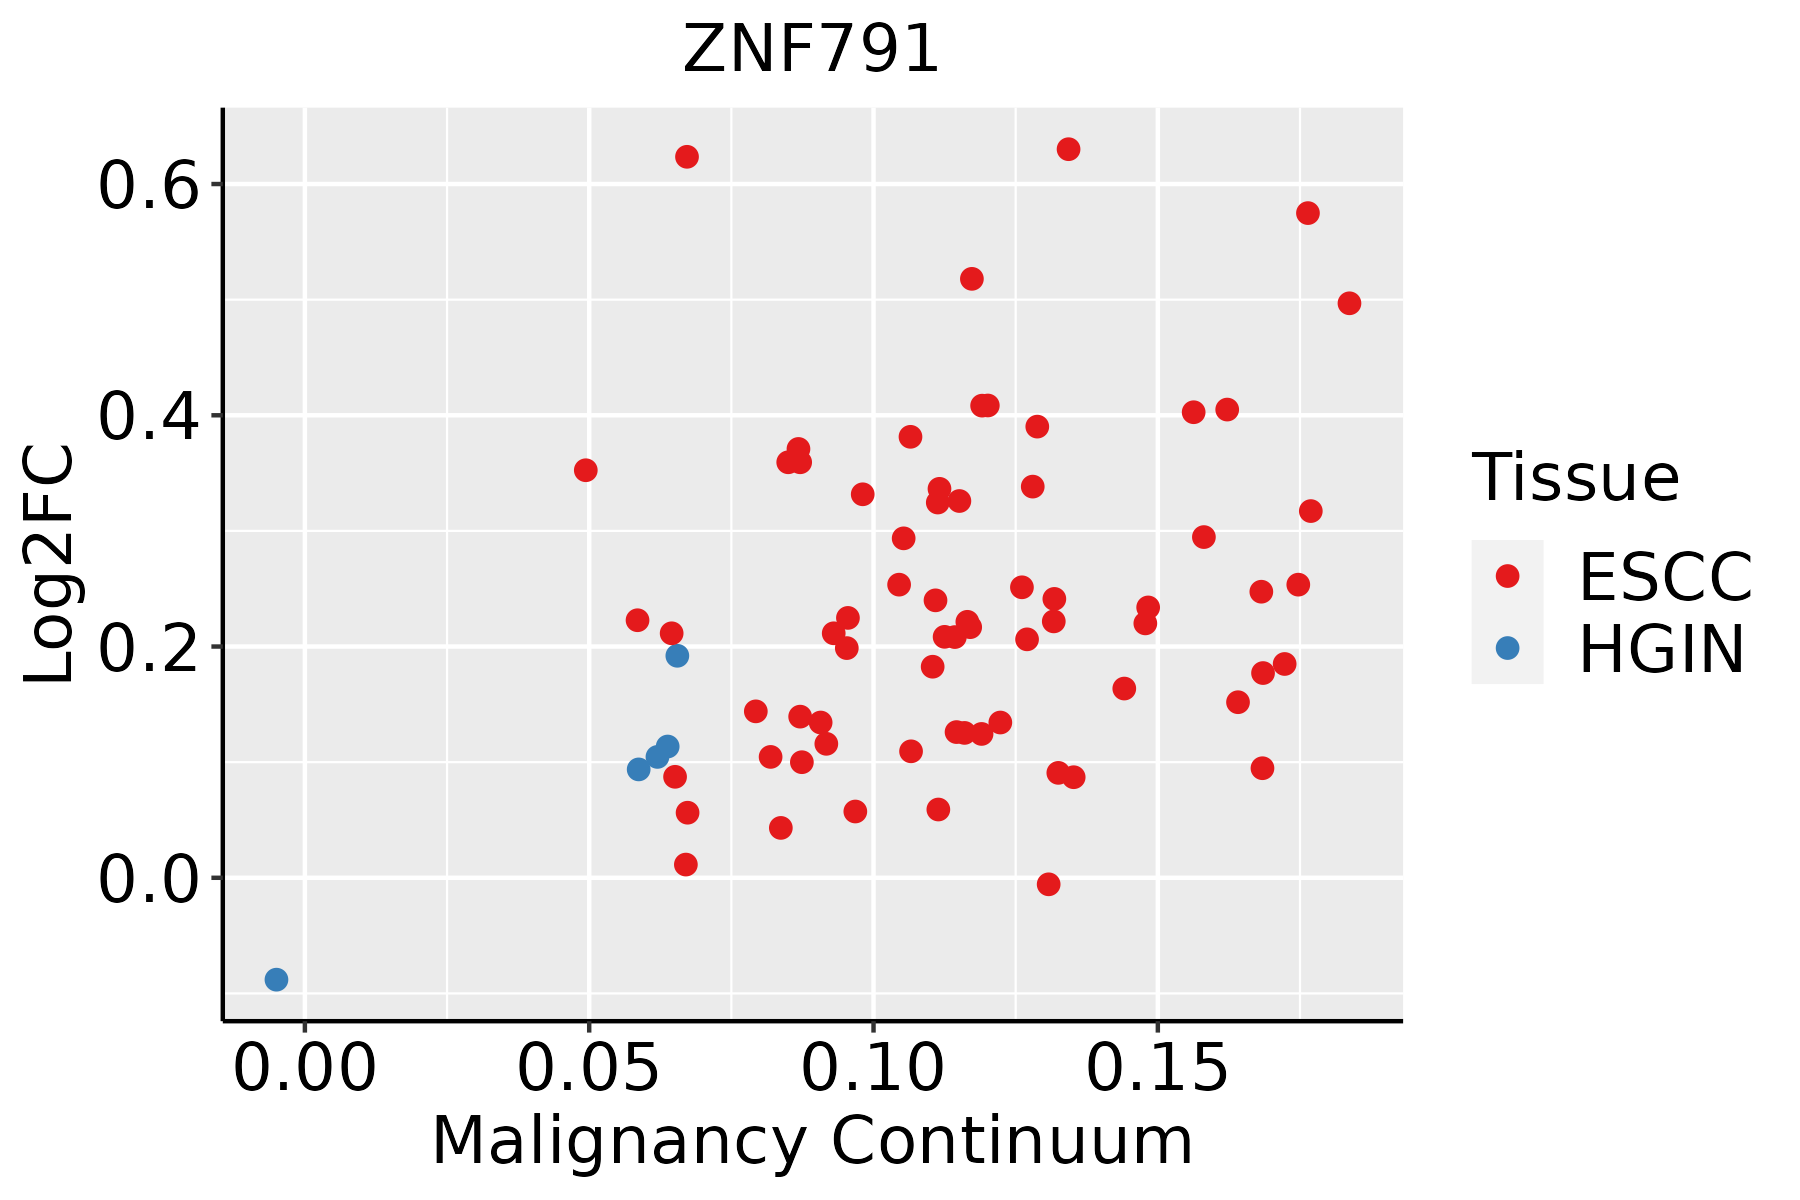 | ESCC: Esophageal squamous cell carcinoma |
| HGIN: High-grade intraepithelial neoplasias | ||
| LGIN: Low-grade intraepithelial neoplasias | ||
| Thyroid |  | ATC: Anaplastic thyroid cancer |
| HT: Hashimoto's thyroiditis | ||
| PTC: Papillary thyroid cancer |
| ∗log2FC in expression of this searched gene in stem-like cells from each diseased tissue sample relative to stem-like cells in normal samples in each tissue plotted against the malignancy continuum. Samples are colored based on if they are from different disease stage. |
Top |
Malignant transformation related pathway analysis |
| Find out the enriched GO biological processes and KEGG pathways involved in transition from healthy to precancer to cancer |
| Tissue | Disease Stage | Enriched GO biological Processes |
| Colorectum | AD |  |
| Colorectum | SER |  |
| Colorectum | MSS |  |
| Colorectum | MSI-H |  |
| Colorectum | FAP |  |
| ∗Top 15 enriched GO BP terms are showed in the bar plot of each disease state in each tissue. Each row represents a significant GO biological process which is colored according to the -log10(p.adjust). |
| Page: 1 2 3 4 5 6 7 8 9 |
| GO ID | Tissue | Disease Stage | Description | Gene Ratio | Bg Ratio | pvalue | p.adjust | Count |
| Page: 1 |
| Pathway ID | Tissue | Disease Stage | Description | Gene Ratio | Bg Ratio | pvalue | p.adjust | qvalue | Count |
| Page: 1 |
Top |
Cell-cell communication analysis |
| Identification of potential cell-cell interactions between two cell types and their ligand-receptor pairs for different disease states |
| Ligand | Receptor | LRpair | Pathway | Tissue | Disease Stage |
| Page: 1 |
Top |
Single-cell gene regulatory network inference analysis |
| Find out the significant the regulons (TFs) and the target genes of each regulon across cell types for different disease states |
| TF | Cell Type | Tissue | Disease Stage | Target Gene | RSS | Regulon Activity |
| ZNF791 | CD8TEX | Cervix | CC | PPP1R2C,ZNF737,CCDC152, etc. | 1.36e-02 |  |
| ZNF791 | GDT | Cervix | Healthy | PPP1R2C,ZNF737,CCDC152, etc. | 1.63e-01 |  |
| ZNF791 | GDT | Cervix | HSIL_HPV | PPP1R2C,ZNF737,CCDC152, etc. | 1.90e-01 |  |
| ZNF791 | GDT | Cervix | N_HPV | PPP1R2C,ZNF737,CCDC152, etc. | 1.37e-01 |  |
| ZNF791 | LYMEND | Endometrium | AEH | RECQL,MALAT1,PGF, etc. | 6.14e-02 |  |
| ∗The dot plots of a searched regulon are shown for all cell subpopulations in each disease state of each tissue based on the regulon specific score inferred using pySCENIC and by calculating the average expression. |
| Page: 1 |
Top |
Somatic mutation of malignant transformation related genes |
| Annotation of somatic variants for genes involved in malignant transformation |
| Hugo Symbol | Variant Class | Variant Classification | dbSNP RS | HGVSc | HGVSp | HGVSp Short | SWISSPROT | BIOTYPE | SIFT | PolyPhen | Tumor Sample Barcode | Tissue | Histology | Sex | Age | Stage | Therapy Types | Drugs | Outcome |
| ZNF791 | SNV | Missense_Mutation | c.10N>T | p.Val4Leu | p.V4L | Q3KP31 | protein_coding | tolerated(0.11) | benign(0.276) | TCGA-A2-A04N-01 | Breast | breast invasive carcinoma | Female | >=65 | I/II | Chemotherapy | cytoxan | SD | |
| ZNF791 | SNV | Missense_Mutation | c.593G>T | p.Ser198Ile | p.S198I | Q3KP31 | protein_coding | tolerated(0.5) | benign(0.107) | TCGA-A2-A25A-01 | Breast | breast invasive carcinoma | Female | <65 | I/II | Unspecific | Cytoxan | SD | |
| ZNF791 | SNV | Missense_Mutation | c.1405N>C | p.Glu469Gln | p.E469Q | Q3KP31 | protein_coding | tolerated(0.1) | benign(0.422) | TCGA-AC-A23H-01 | Breast | breast invasive carcinoma | Female | >=65 | I/II | Unknown | Unknown | PD | |
| ZNF791 | SNV | Missense_Mutation | c.1645N>A | p.Glu549Lys | p.E549K | Q3KP31 | protein_coding | deleterious(0.03) | benign(0.074) | TCGA-AC-A23H-01 | Breast | breast invasive carcinoma | Female | >=65 | I/II | Unknown | Unknown | PD | |
| ZNF791 | SNV | Missense_Mutation | c.1509N>T | p.Lys503Asn | p.K503N | Q3KP31 | protein_coding | deleterious(0.01) | probably_damaging(1) | TCGA-AN-A0AK-01 | Breast | breast invasive carcinoma | Female | >=65 | I/II | Unknown | Unknown | SD | |
| ZNF791 | SNV | Missense_Mutation | rs746552226 | c.703G>A | p.Glu235Lys | p.E235K | Q3KP31 | protein_coding | tolerated(0.24) | probably_damaging(0.978) | TCGA-AN-A0FN-01 | Breast | breast invasive carcinoma | Female | <65 | I/II | Unknown | Unknown | SD |
| ZNF791 | SNV | Missense_Mutation | c.1713N>C | p.Met571Ile | p.M571I | Q3KP31 | protein_coding | deleterious(0.05) | benign(0) | TCGA-C5-A1BM-01 | Cervix | cervical & endocervical cancer | Female | >=65 | I/II | Unknown | Unknown | SD | |
| ZNF791 | SNV | Missense_Mutation | c.778N>G | p.Leu260Val | p.L260V | Q3KP31 | protein_coding | deleterious(0.04) | benign(0.215) | TCGA-EA-A3HT-01 | Cervix | cervical & endocervical cancer | Female | >=65 | I/II | Unknown | Unknown | SD | |
| ZNF791 | SNV | Missense_Mutation | c.535N>A | p.Glu179Lys | p.E179K | Q3KP31 | protein_coding | tolerated(0.56) | benign(0.023) | TCGA-Q1-A73P-01 | Cervix | cervical & endocervical cancer | Female | <65 | I/II | Unknown | Unknown | SD | |
| ZNF791 | SNV | Missense_Mutation | novel | c.1391N>C | p.Gly464Ala | p.G464A | Q3KP31 | protein_coding | tolerated(0.05) | probably_damaging(0.985) | TCGA-ZJ-AAXU-01 | Cervix | cervical & endocervical cancer | Female | <65 | I/II | Unknown | Unknown | SD |
| Page: 1 2 3 4 5 6 |
Top |
Related drugs of malignant transformation related genes |
| Identification of chemicals and drugs interact with genes involved in malignant transfromation |
| (DGIdb 4.0) |
| Entrez ID | Symbol | Category | Interaction Types | Drug Claim Name | Drug Name | PMIDs |
| Page: 1 |

Copyright 2023-Present -The University of Texas Health Science Center at Houston |