
|
|||||
|
 | |
| |
| |
| |
| |
| |
|
Gene: ZNF790 |
Gene summary for ZNF790 |
| Gene information | Species | Human | Gene symbol | ZNF790 | Gene ID | 388536 |
| Gene name | zinc finger protein 790 | |
| Gene Alias | ZNF790 | |
| Cytomap | 19q13.12 | |
| Gene Type | protein-coding | GO ID | GO:0006139 | UniProtAcc | B4DMI3 |
Top |
Malignant transformation analysis |
| Identification of the aberrant gene expression in precancerous and cancerous lesions by comparing the gene expression of stem-like cells in diseased tissues with normal stem cells |
| Entrez ID | Symbol | Replicates | Species | Organ | Tissue | Adj P-value | Log2FC | Malignancy |
| 388536 | ZNF790 | PTC01 | Human | Thyroid | PTC | 1.21e-04 | 8.58e-02 | 0.1899 |
| 388536 | ZNF790 | PTC04 | Human | Thyroid | PTC | 1.09e-02 | 8.82e-02 | 0.1927 |
| 388536 | ZNF790 | PTC05 | Human | Thyroid | PTC | 2.19e-08 | 2.07e-01 | 0.2065 |
| 388536 | ZNF790 | PTC06 | Human | Thyroid | PTC | 2.62e-11 | 1.45e-01 | 0.2057 |
| 388536 | ZNF790 | PTC07 | Human | Thyroid | PTC | 2.74e-06 | 1.66e-01 | 0.2044 |
| 388536 | ZNF790 | ATC13 | Human | Thyroid | ATC | 9.49e-85 | 1.44e+00 | 0.34 |
| 388536 | ZNF790 | ATC4 | Human | Thyroid | ATC | 5.70e-07 | 9.98e-02 | 0.34 |
| 388536 | ZNF790 | ATC5 | Human | Thyroid | ATC | 2.90e-93 | 1.51e+00 | 0.34 |
| Page: 1 |
| Tissue | Expression Dynamics | Abbreviation |
| Thyroid | 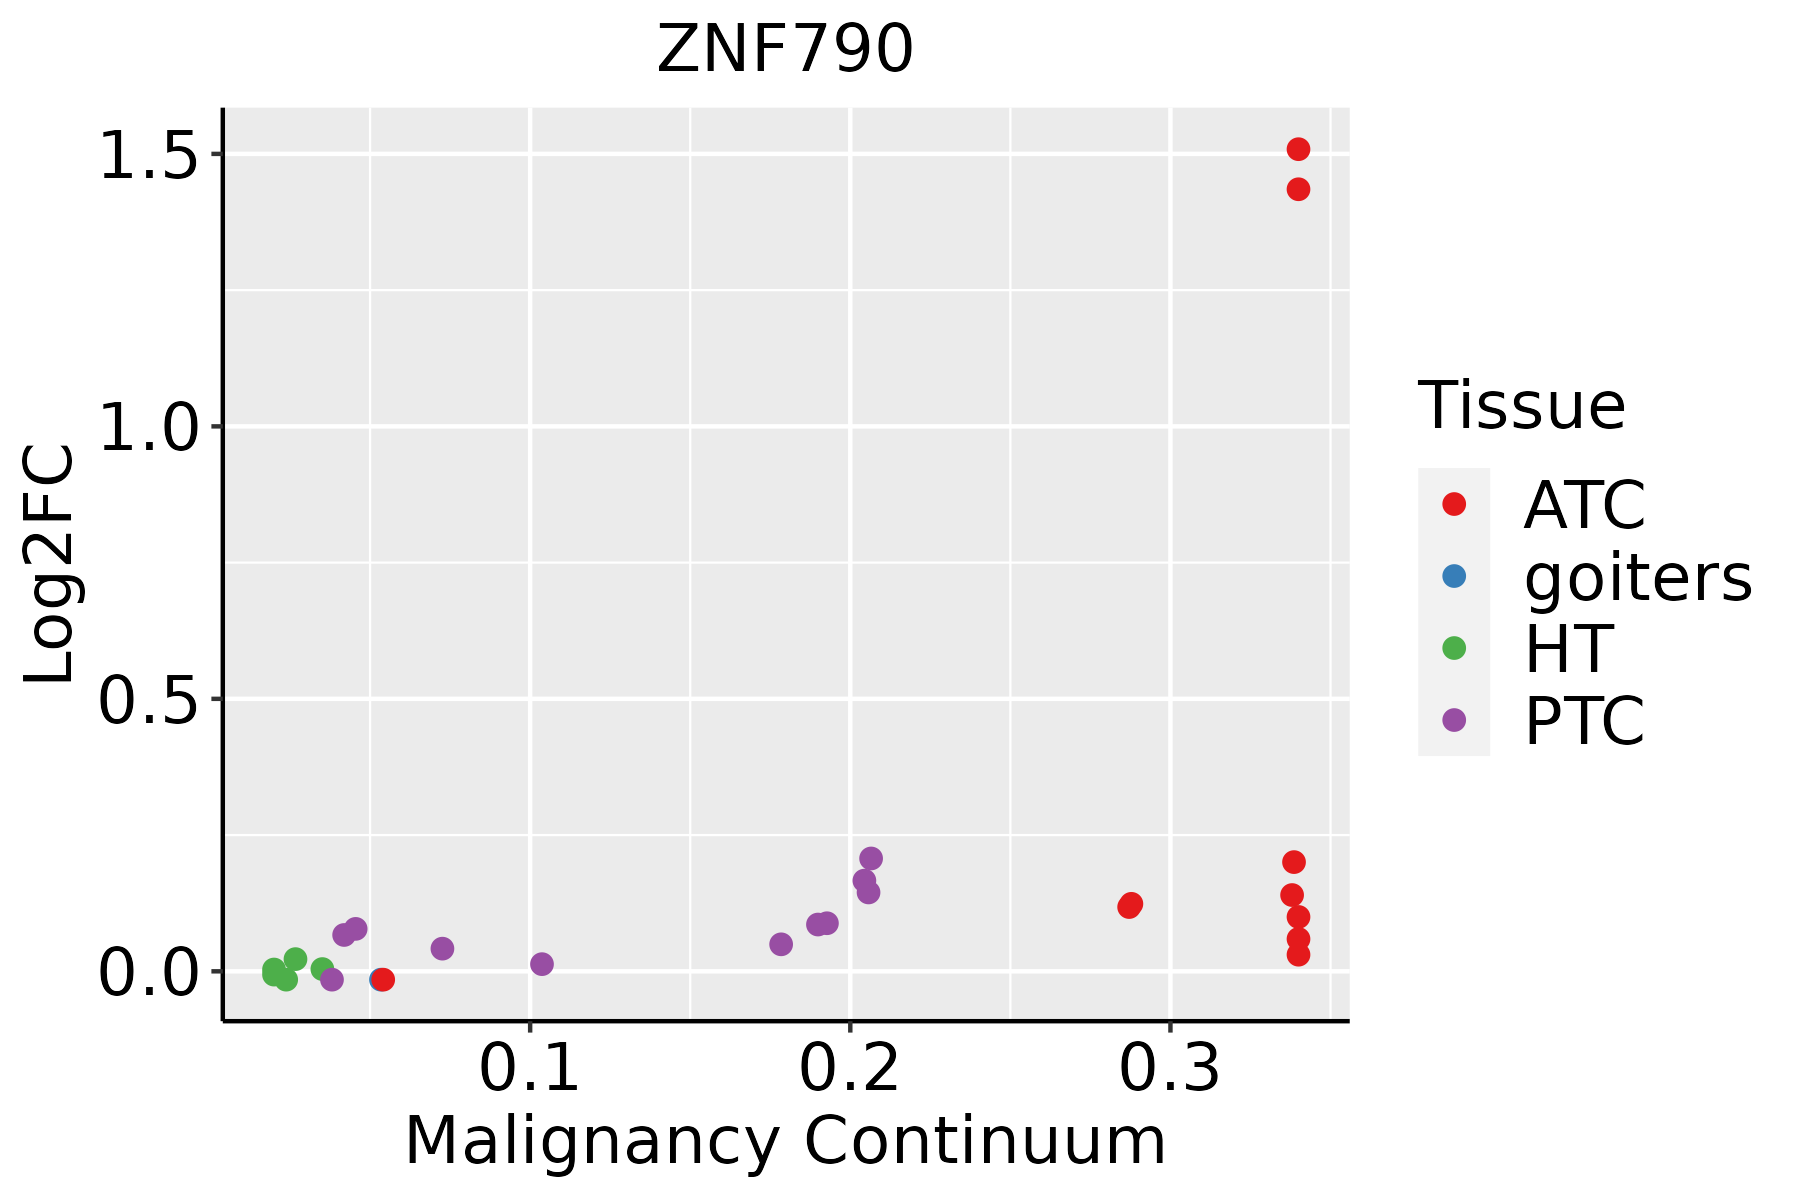 | ATC: Anaplastic thyroid cancer |
| HT: Hashimoto's thyroiditis | ||
| PTC: Papillary thyroid cancer |
| ∗log2FC in expression of this searched gene in stem-like cells from each diseased tissue sample relative to stem-like cells in normal samples in each tissue plotted against the malignancy continuum. Samples are colored based on if they are from different disease stage. |
Top |
Malignant transformation related pathway analysis |
| Find out the enriched GO biological processes and KEGG pathways involved in transition from healthy to precancer to cancer |
| Tissue | Disease Stage | Enriched GO biological Processes |
| Colorectum | AD |  |
| Colorectum | SER |  |
| Colorectum | MSS |  |
| Colorectum | MSI-H |  |
| Colorectum | FAP |  |
| ∗Top 15 enriched GO BP terms are showed in the bar plot of each disease state in each tissue. Each row represents a significant GO biological process which is colored according to the -log10(p.adjust). |
| Page: 1 2 3 4 5 6 7 8 9 |
| GO ID | Tissue | Disease Stage | Description | Gene Ratio | Bg Ratio | pvalue | p.adjust | Count |
| Page: 1 |
| Pathway ID | Tissue | Disease Stage | Description | Gene Ratio | Bg Ratio | pvalue | p.adjust | qvalue | Count |
| Page: 1 |
Top |
Cell-cell communication analysis |
| Identification of potential cell-cell interactions between two cell types and their ligand-receptor pairs for different disease states |
| Ligand | Receptor | LRpair | Pathway | Tissue | Disease Stage |
| Page: 1 |
Top |
Single-cell gene regulatory network inference analysis |
| Find out the significant the regulons (TFs) and the target genes of each regulon across cell types for different disease states |
| TF | Cell Type | Tissue | Disease Stage | Target Gene | RSS | Regulon Activity |
| ZNF790 | MAST | Esophagus | Healthy | C12orf66,CREB1,ORMDL1, etc. | 5.08e-02 |  |
| ZNF790 | PLA | Esophagus | Healthy | C12orf66,CREB1,ORMDL1, etc. | 4.71e-02 | |
| ZNF790 | CD8TEREX | Liver | Cirrhotic | FAM49A,ICE2,ANKRD36B, etc. | 1.68e-02 |  |
| ZNF790 | CD8TEREX | Liver | HCC | FAM49A,ICE2,ANKRD36B, etc. | 2.40e-01 |  |
| ZNF790 | PLA | Prostate | Healthy | EGFL7,AARS,AASDH, etc. | 2.29e-02 |  |
| ∗The dot plots of a searched regulon are shown for all cell subpopulations in each disease state of each tissue based on the regulon specific score inferred using pySCENIC and by calculating the average expression. |
| Page: 1 |
Top |
Somatic mutation of malignant transformation related genes |
| Annotation of somatic variants for genes involved in malignant transformation |
| Hugo Symbol | Variant Class | Variant Classification | dbSNP RS | HGVSc | HGVSp | HGVSp Short | SWISSPROT | BIOTYPE | SIFT | PolyPhen | Tumor Sample Barcode | Tissue | Histology | Sex | Age | Stage | Therapy Types | Drugs | Outcome |
| ZNF790 | SNV | Missense_Mutation | c.622N>T | p.Leu208Phe | p.L208F | Q6PG37 | protein_coding | tolerated(0.71) | benign(0) | TCGA-A1-A0SI-01 | Breast | breast invasive carcinoma | Female | <65 | I/II | Unknown | Unknown | SD | |
| ZNF790 | SNV | Missense_Mutation | novel | c.1234N>T | p.His412Tyr | p.H412Y | Q6PG37 | protein_coding | deleterious(0) | benign(0.329) | TCGA-A7-A425-01 | Breast | breast invasive carcinoma | Female | >=65 | III/IV | Chemotherapy | adriamycin | PD |
| ZNF790 | SNV | Missense_Mutation | c.15N>A | p.Met5Ile | p.M5I | Q6PG37 | protein_coding | deleterious(0.04) | benign(0.003) | TCGA-AC-A23H-01 | Breast | breast invasive carcinoma | Female | >=65 | I/II | Unknown | Unknown | PD | |
| ZNF790 | SNV | Missense_Mutation | novel | c.1869N>C | p.Glu623Asp | p.E623D | Q6PG37 | protein_coding | deleterious(0.05) | benign(0) | TCGA-AC-A2QI-01 | Breast | breast invasive carcinoma | Female | >=65 | III/IV | Chemotherapy | cytoxan | CR |
| ZNF790 | SNV | Missense_Mutation | novel | c.1691N>A | p.Cys564Tyr | p.C564Y | Q6PG37 | protein_coding | deleterious(0.01) | benign(0.046) | TCGA-AC-A2QI-01 | Breast | breast invasive carcinoma | Female | >=65 | III/IV | Chemotherapy | cytoxan | CR |
| ZNF790 | SNV | Missense_Mutation | rs772113109 | c.1336N>A | p.Glu446Lys | p.E446K | Q6PG37 | protein_coding | deleterious(0.01) | benign(0) | TCGA-AC-A2QI-01 | Breast | breast invasive carcinoma | Female | >=65 | III/IV | Chemotherapy | cytoxan | CR |
| ZNF790 | SNV | Missense_Mutation | c.1670N>T | p.Thr557Ile | p.T557I | Q6PG37 | protein_coding | deleterious(0.02) | possibly_damaging(0.675) | TCGA-AN-A0AK-01 | Breast | breast invasive carcinoma | Female | >=65 | I/II | Unknown | Unknown | SD | |
| ZNF790 | SNV | Missense_Mutation | rs759853220 | c.312N>A | p.Met104Ile | p.M104I | Q6PG37 | protein_coding | tolerated(0.34) | benign(0) | TCGA-BH-A0B6-01 | Breast | breast invasive carcinoma | Female | <65 | I/II | Unknown | Unknown | SD |
| ZNF790 | SNV | Missense_Mutation | novel | c.208N>A | p.Glu70Lys | p.E70K | Q6PG37 | protein_coding | tolerated(0.9) | benign(0.003) | TCGA-BH-A2L8-01 | Breast | breast invasive carcinoma | Female | <65 | I/II | Chemotherapy | cytoxan | CR |
| ZNF790 | SNV | Missense_Mutation | c.1457N>T | p.Thr486Ile | p.T486I | Q6PG37 | protein_coding | tolerated(0.07) | benign(0.024) | TCGA-D8-A1XK-01 | Breast | breast invasive carcinoma | Female | <65 | I/II | Chemotherapy | doxorubicine+cyclophosphamide | SD |
| Page: 1 2 3 4 5 6 7 8 9 10 |
Top |
Related drugs of malignant transformation related genes |
| Identification of chemicals and drugs interact with genes involved in malignant transfromation |
| (DGIdb 4.0) |
| Entrez ID | Symbol | Category | Interaction Types | Drug Claim Name | Drug Name | PMIDs |
| Page: 1 |

Copyright 2023-Present -The University of Texas Health Science Center at Houston |