
|
|||||
|
 | |
| |
| |
| |
| |
| |
|
Gene: ZNF780A |
Gene summary for ZNF780A |
| Gene information | Species | Human | Gene symbol | ZNF780A | Gene ID | 284323 |
| Gene name | zinc finger protein 780A | |
| Gene Alias | ZNF780 | |
| Cytomap | 19q13.2 | |
| Gene Type | protein-coding | GO ID | GO:0006139 | UniProtAcc | O75290 |
Top |
Malignant transformation analysis |
| Identification of the aberrant gene expression in precancerous and cancerous lesions by comparing the gene expression of stem-like cells in diseased tissues with normal stem cells |
| Entrez ID | Symbol | Replicates | Species | Organ | Tissue | Adj P-value | Log2FC | Malignancy |
| 284323 | ZNF780A | HCC1_Meng | Human | Liver | HCC | 2.70e-54 | 8.32e-02 | 0.0246 |
| 284323 | ZNF780A | HCC2_Meng | Human | Liver | HCC | 3.02e-10 | 5.05e-02 | 0.0107 |
| 284323 | ZNF780A | HCC2 | Human | Liver | HCC | 2.38e-05 | 2.27e+00 | 0.5341 |
| 284323 | ZNF780A | S014 | Human | Liver | HCC | 1.97e-12 | 4.01e-01 | 0.2254 |
| 284323 | ZNF780A | S015 | Human | Liver | HCC | 1.83e-14 | 5.73e-01 | 0.2375 |
| 284323 | ZNF780A | S016 | Human | Liver | HCC | 2.65e-13 | 3.69e-01 | 0.2243 |
| 284323 | ZNF780A | S028 | Human | Liver | HCC | 1.44e-05 | 2.58e-01 | 0.2503 |
| 284323 | ZNF780A | S029 | Human | Liver | HCC | 1.26e-05 | 3.08e-01 | 0.2581 |
| Page: 1 |
| Tissue | Expression Dynamics | Abbreviation |
| Liver | 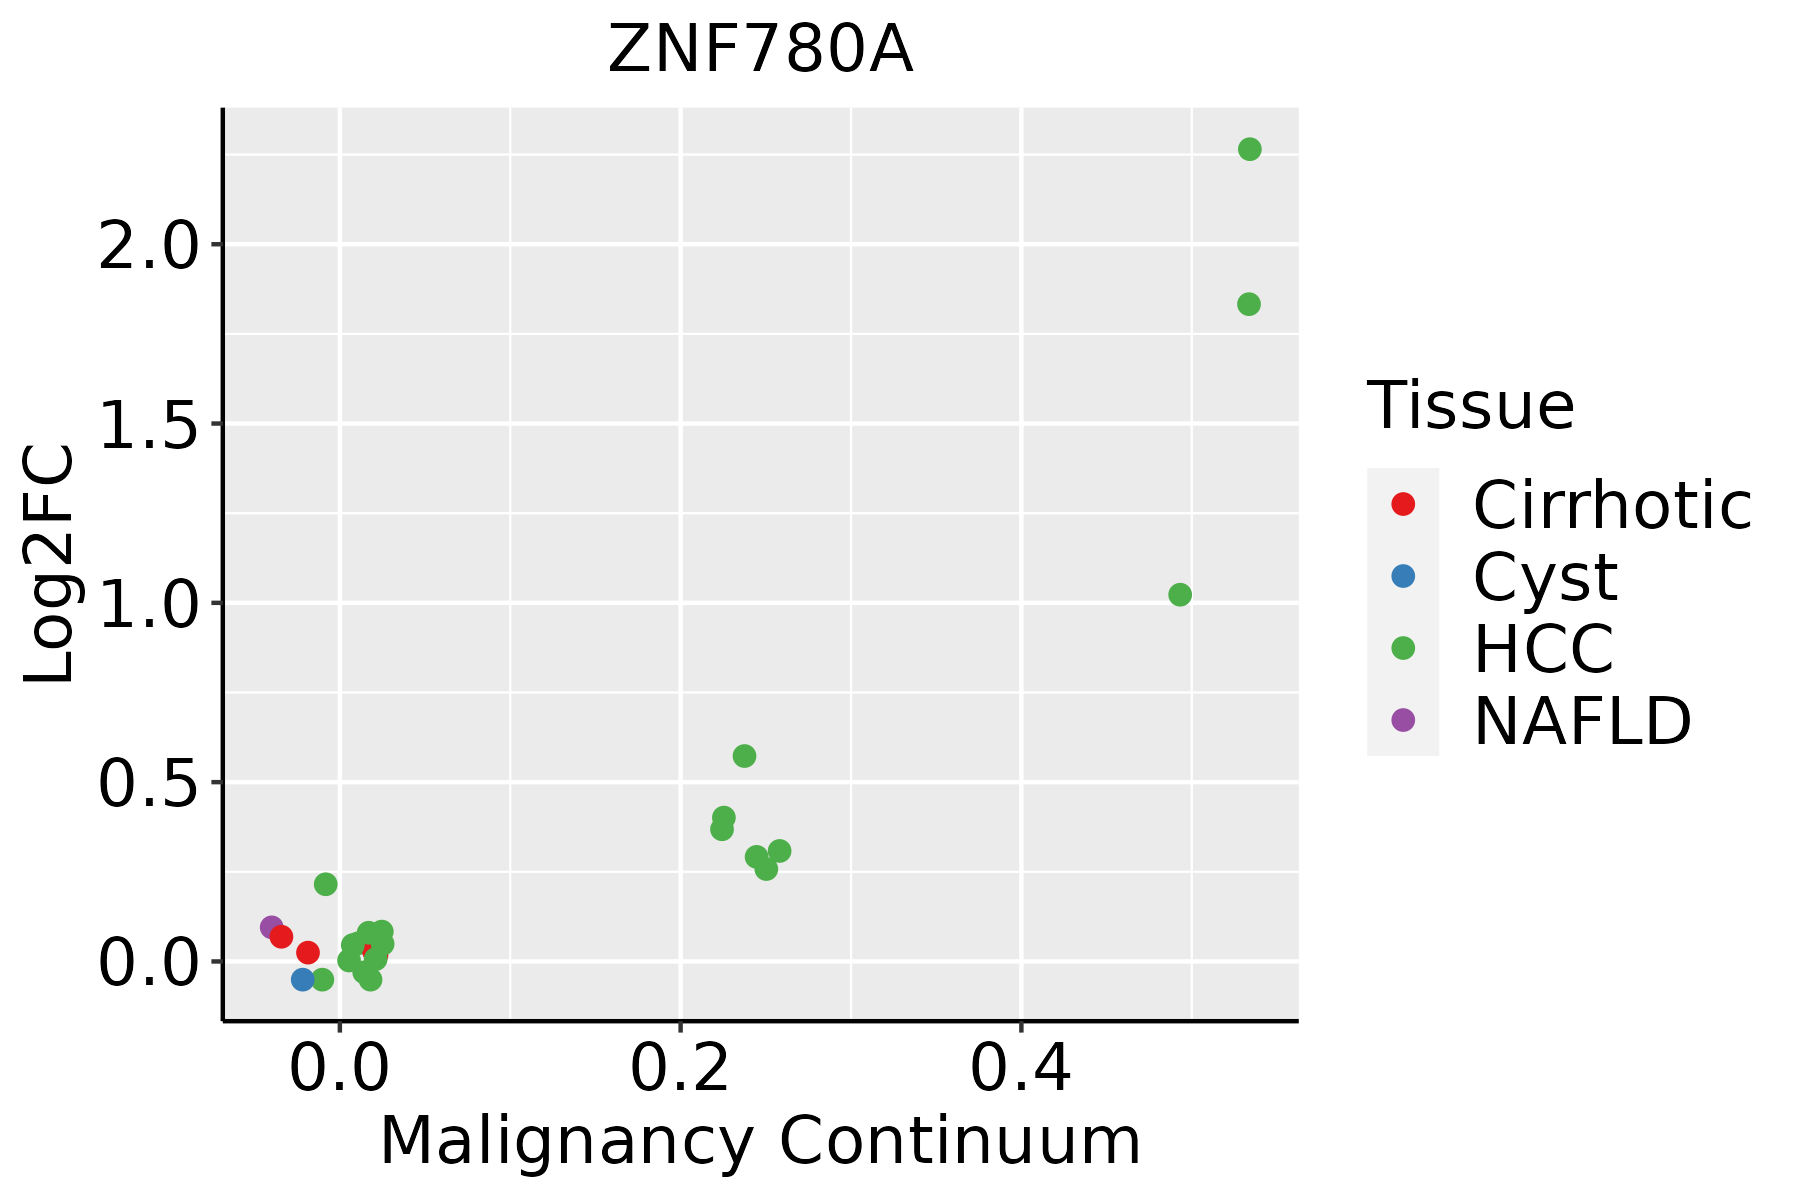 | HCC: Hepatocellular carcinoma |
| NAFLD: Non-alcoholic fatty liver disease |
| ∗log2FC in expression of this searched gene in stem-like cells from each diseased tissue sample relative to stem-like cells in normal samples in each tissue plotted against the malignancy continuum. Samples are colored based on if they are from different disease stage. |
Top |
Malignant transformation related pathway analysis |
| Find out the enriched GO biological processes and KEGG pathways involved in transition from healthy to precancer to cancer |
| Tissue | Disease Stage | Enriched GO biological Processes |
| Colorectum | AD |  |
| Colorectum | SER |  |
| Colorectum | MSS |  |
| Colorectum | MSI-H |  |
| Colorectum | FAP |  |
| ∗Top 15 enriched GO BP terms are showed in the bar plot of each disease state in each tissue. Each row represents a significant GO biological process which is colored according to the -log10(p.adjust). |
| Page: 1 2 3 4 5 6 7 8 9 |
| GO ID | Tissue | Disease Stage | Description | Gene Ratio | Bg Ratio | pvalue | p.adjust | Count |
| Page: 1 |
| Pathway ID | Tissue | Disease Stage | Description | Gene Ratio | Bg Ratio | pvalue | p.adjust | qvalue | Count |
| Page: 1 |
Top |
Cell-cell communication analysis |
| Identification of potential cell-cell interactions between two cell types and their ligand-receptor pairs for different disease states |
| Ligand | Receptor | LRpair | Pathway | Tissue | Disease Stage |
| Page: 1 |
Top |
Single-cell gene regulatory network inference analysis |
| Find out the significant the regulons (TFs) and the target genes of each regulon across cell types for different disease states |
| TF | Cell Type | Tissue | Disease Stage | Target Gene | RSS | Regulon Activity |
| ZNF780A | pDC | Oral cavity | ADJ | VCAM1,MED12,NLRP2, etc. | 2.18e-02 |  |
| ZNF780A | CD8TEXINT | Oral cavity | EOLP | VCAM1,MED12,NLRP2, etc. | 2.42e-02 |  |
| ZNF780A | pDC | Oral cavity | Healthy | VCAM1,MED12,NLRP2, etc. | 5.18e-02 |  |
| ZNF780A | CD8TEX | Oral cavity | LP | VCAM1,MED12,NLRP2, etc. | 8.25e-02 |  |
| ZNF780A | CD8TEFF | Oral cavity | LP | VCAM1,MED12,NLRP2, etc. | 1.60e-01 | |
| ZNF780A | CD8TEREX | Oral cavity | NEOLP | VCAM1,MED12,NLRP2, etc. | 2.25e-02 |  |
| ZNF780A | pDC | Oral cavity | OSCC | VCAM1,MED12,NLRP2, etc. | 1.29e-01 |  |
| ∗The dot plots of a searched regulon are shown for all cell subpopulations in each disease state of each tissue based on the regulon specific score inferred using pySCENIC and by calculating the average expression. |
| Page: 1 |
Top |
Somatic mutation of malignant transformation related genes |
| Annotation of somatic variants for genes involved in malignant transformation |
| Hugo Symbol | Variant Class | Variant Classification | dbSNP RS | HGVSc | HGVSp | HGVSp Short | SWISSPROT | BIOTYPE | SIFT | PolyPhen | Tumor Sample Barcode | Tissue | Histology | Sex | Age | Stage | Therapy Types | Drugs | Outcome |
| ZNF780A | SNV | Missense_Mutation | c.224G>T | p.Arg75Ile | p.R75I | O75290 | protein_coding | tolerated(0.19) | benign(0.396) | TCGA-A1-A0SO-01 | Breast | breast invasive carcinoma | Female | >=65 | I/II | Chemotherapy | SD | ||
| ZNF780A | SNV | Missense_Mutation | c.625N>G | p.Phe209Val | p.F209V | O75290 | protein_coding | deleterious(0.05) | benign(0.018) | TCGA-A2-A25D-01 | Breast | breast invasive carcinoma | Female | >=65 | III/IV | Hormone Therapy | tamoxiphen | SD | |
| ZNF780A | SNV | Missense_Mutation | rs776616074 | c.1724N>A | p.Arg575Gln | p.R575Q | O75290 | protein_coding | tolerated(1) | benign(0.133) | TCGA-AN-A046-01 | Breast | breast invasive carcinoma | Female | >=65 | I/II | Unknown | Unknown | SD |
| ZNF780A | SNV | Missense_Mutation | c.805N>G | p.Gln269Glu | p.Q269E | O75290 | protein_coding | deleterious(0.04) | benign(0.003) | TCGA-BH-A0DZ-01 | Breast | breast invasive carcinoma | Female | <65 | I/II | Chemotherapy | docetaxel | SD | |
| ZNF780A | SNV | Missense_Mutation | rs751835712 | c.1166N>T | p.Pro389Leu | p.P389L | O75290 | protein_coding | deleterious(0.01) | probably_damaging(0.995) | TCGA-BH-A18G-01 | Breast | breast invasive carcinoma | Female | >=65 | I/II | Unknown | Unknown | SD |
| ZNF780A | SNV | Missense_Mutation | c.1646N>A | p.Arg549Gln | p.R549Q | O75290 | protein_coding | tolerated(1) | benign(0.003) | TCGA-D8-A1XK-01 | Breast | breast invasive carcinoma | Female | <65 | I/II | Chemotherapy | doxorubicine+cyclophosphamide | SD | |
| ZNF780A | SNV | Missense_Mutation | c.1523N>T | p.Gly508Val | p.G508V | O75290 | protein_coding | deleterious(0) | probably_damaging(1) | TCGA-D8-A1XQ-01 | Breast | breast invasive carcinoma | Female | >=65 | I/II | Unknown | Unknown | SD | |
| ZNF780A | SNV | Missense_Mutation | c.1372C>G | p.His458Asp | p.H458D | O75290 | protein_coding | tolerated(0.37) | possibly_damaging(0.889) | TCGA-E9-A22E-01 | Breast | breast invasive carcinoma | Female | <65 | III/IV | Chemotherapy | cyclophosphane | SD | |
| ZNF780A | insertion | Frame_Shift_Ins | novel | c.1271_1272insTC | p.Lys425ArgfsTer315 | p.K425Rfs*315 | O75290 | protein_coding | TCGA-AR-A0TU-01 | Breast | breast invasive carcinoma | Female | <65 | I/II | Unspecific | Doxorubicin | SD | ||
| ZNF780A | insertion | Frame_Shift_Ins | novel | c.1270_1271insCATATGAA | p.Gly424AlafsTer318 | p.G424Afs*318 | O75290 | protein_coding | TCGA-AR-A0TU-01 | Breast | breast invasive carcinoma | Female | <65 | I/II | Unspecific | Doxorubicin | SD |
| Page: 1 2 3 4 5 6 7 8 9 10 |
Top |
Related drugs of malignant transformation related genes |
| Identification of chemicals and drugs interact with genes involved in malignant transfromation |
| (DGIdb 4.0) |
| Entrez ID | Symbol | Category | Interaction Types | Drug Claim Name | Drug Name | PMIDs |
| Page: 1 |

Copyright 2023-Present -The University of Texas Health Science Center at Houston |