
|
|||||
|
 | |
| |
| |
| |
| |
| |
|
Gene: ZNF775 |
Gene summary for ZNF775 |
| Gene information | Species | Human | Gene symbol | ZNF775 | Gene ID | 285971 |
| Gene name | zinc finger protein 775 | |
| Gene Alias | ZNF775 | |
| Cytomap | 7q36.1 | |
| Gene Type | protein-coding | GO ID | GO:0006139 | UniProtAcc | Q96BV0 |
Top |
Malignant transformation analysis |
| Identification of the aberrant gene expression in precancerous and cancerous lesions by comparing the gene expression of stem-like cells in diseased tissues with normal stem cells |
| Entrez ID | Symbol | Replicates | Species | Organ | Tissue | Adj P-value | Log2FC | Malignancy |
| 285971 | ZNF775 | HTA11_347_2000001011 | Human | Colorectum | AD | 4.71e-06 | 1.18e-01 | -0.1954 |
| 285971 | ZNF775 | HTA11_696_2000001011 | Human | Colorectum | AD | 4.50e-02 | 1.42e-01 | -0.1464 |
| 285971 | ZNF775 | HTA11_1391_2000001011 | Human | Colorectum | AD | 1.66e-02 | 6.11e-02 | -0.059 |
| 285971 | ZNF775 | HTA11_866_3004761011 | Human | Colorectum | AD | 9.89e-04 | 8.91e-02 | 0.096 |
| 285971 | ZNF775 | HTA11_7696_3000711011 | Human | Colorectum | AD | 6.50e-03 | 1.13e-01 | 0.0674 |
| 285971 | ZNF775 | HTA11_7469_2000001011 | Human | Colorectum | AD | 4.78e-06 | 8.07e-01 | -0.0124 |
| Page: 1 |
| Tissue | Expression Dynamics | Abbreviation |
| Colorectum (GSE201348) | 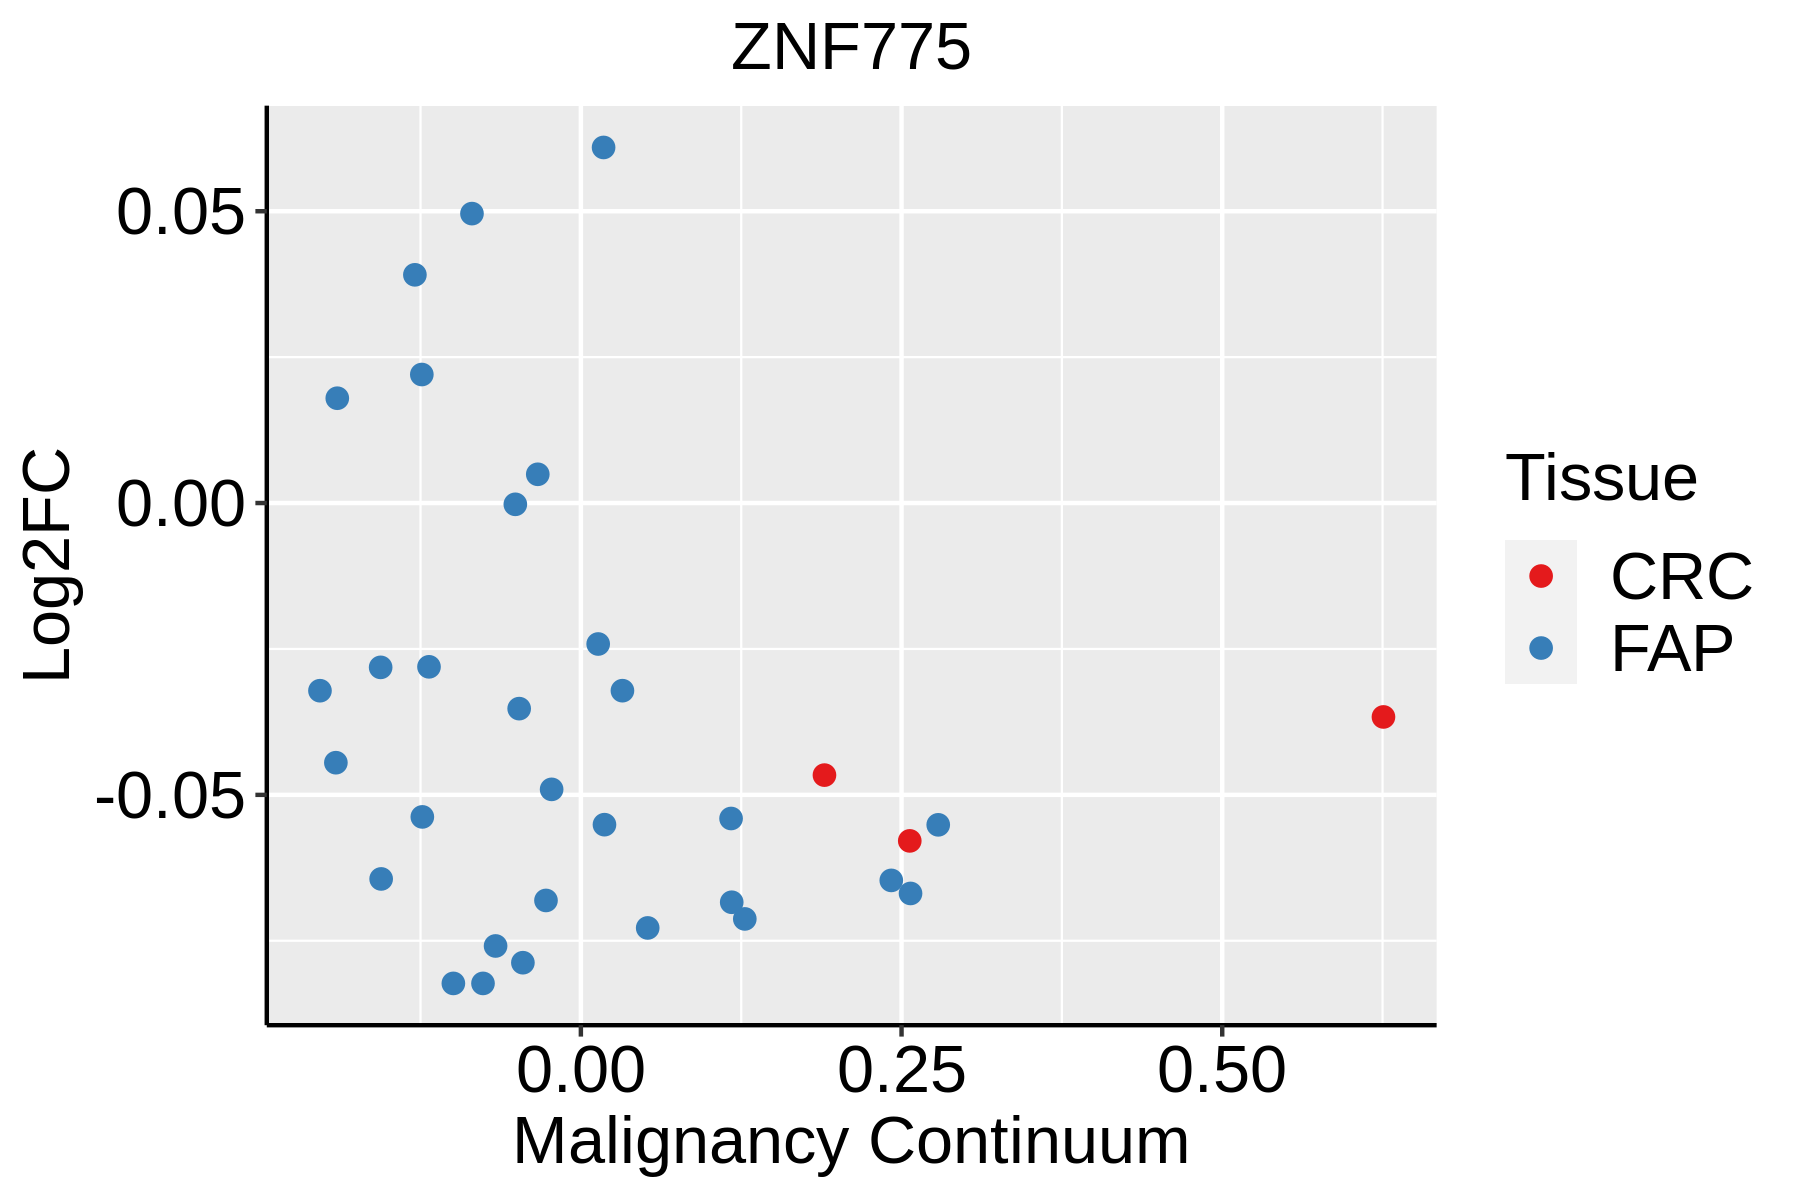 | FAP: Familial adenomatous polyposis |
| CRC: Colorectal cancer | ||
| Colorectum (HTA11) |  | AD: Adenomas |
| SER: Sessile serrated lesions | ||
| MSI-H: Microsatellite-high colorectal cancer | ||
| MSS: Microsatellite stable colorectal cancer |
| ∗log2FC in expression of this searched gene in stem-like cells from each diseased tissue sample relative to stem-like cells in normal samples in each tissue plotted against the malignancy continuum. Samples are colored based on if they are from different disease stage. |
Top |
Malignant transformation related pathway analysis |
| Find out the enriched GO biological processes and KEGG pathways involved in transition from healthy to precancer to cancer |
| Tissue | Disease Stage | Enriched GO biological Processes |
| Colorectum | AD |  |
| Colorectum | SER |  |
| Colorectum | MSS |  |
| Colorectum | MSI-H |  |
| Colorectum | FAP |  |
| ∗Top 15 enriched GO BP terms are showed in the bar plot of each disease state in each tissue. Each row represents a significant GO biological process which is colored according to the -log10(p.adjust). |
| Page: 1 2 3 4 5 6 7 8 9 |
| GO ID | Tissue | Disease Stage | Description | Gene Ratio | Bg Ratio | pvalue | p.adjust | Count |
| Page: 1 |
| Pathway ID | Tissue | Disease Stage | Description | Gene Ratio | Bg Ratio | pvalue | p.adjust | qvalue | Count |
| Page: 1 |
Top |
Cell-cell communication analysis |
| Identification of potential cell-cell interactions between two cell types and their ligand-receptor pairs for different disease states |
| Ligand | Receptor | LRpair | Pathway | Tissue | Disease Stage |
| Page: 1 |
Top |
Single-cell gene regulatory network inference analysis |
| Find out the significant the regulons (TFs) and the target genes of each regulon across cell types for different disease states |
| TF | Cell Type | Tissue | Disease Stage | Target Gene | RSS | Regulon Activity |
| ZNF775 | CD4TN | Breast | ADJ | MRPL19,EPHB6,MPV17L2, etc. | 1.62e-02 |  |
| ZNF775 | CD8TEREX | Breast | ADJ | MRPL19,EPHB6,MPV17L2, etc. | 8.21e-02 | |
| ZNF775 | CD8TEXP | Breast | DCIS | MRPL19,EPHB6,MPV17L2, etc. | 9.33e-02 |  |
| ZNF775 | CD8TEXP | Breast | Healthy | MRPL19,EPHB6,MPV17L2, etc. | 1.88e-02 |  |
| ZNF775 | TREG | Breast | Precancer | MRPL19,EPHB6,MPV17L2, etc. | 1.82e-02 |  |
| ZNF775 | TFH | Breast | Precancer | MRPL19,EPHB6,MPV17L2, etc. | 3.95e-02 | |
| ZNF775 | CD8TEX | Breast | Precancer | MRPL19,EPHB6,MPV17L2, etc. | 0.00e+00 | |
| ZNF775 | CD4TN | Breast | Precancer | MRPL19,EPHB6,MPV17L2, etc. | 0.00e+00 | |
| ZNF775 | GC | Breast | Precancer | MRPL19,EPHB6,MPV17L2, etc. | 0.00e+00 | |
| ZNF775 | pDC | Breast | Precancer | MRPL19,EPHB6,MPV17L2, etc. | 0.00e+00 | |
| ∗The dot plots of a searched regulon are shown for all cell subpopulations in each disease state of each tissue based on the regulon specific score inferred using pySCENIC and by calculating the average expression. |
| Page: 1 |
Top |
Somatic mutation of malignant transformation related genes |
| Annotation of somatic variants for genes involved in malignant transformation |
| Hugo Symbol | Variant Class | Variant Classification | dbSNP RS | HGVSc | HGVSp | HGVSp Short | SWISSPROT | BIOTYPE | SIFT | PolyPhen | Tumor Sample Barcode | Tissue | Histology | Sex | Age | Stage | Therapy Types | Drugs | Outcome |
| ZNF775 | SNV | Missense_Mutation | c.199N>C | p.Glu67Gln | p.E67Q | Q96BV0 | protein_coding | deleterious(0.01) | possibly_damaging(0.702) | TCGA-5L-AAT1-01 | Breast | breast invasive carcinoma | Female | <65 | III/IV | Hormone Therapy | letrozol | SD | |
| ZNF775 | SNV | Missense_Mutation | c.1432G>A | p.Glu478Lys | p.E478K | Q96BV0 | protein_coding | tolerated(0.11) | possibly_damaging(0.687) | TCGA-EK-A2R9-01 | Cervix | cervical & endocervical cancer | Female | <65 | I/II | Unknown | Unknown | SD | |
| ZNF775 | SNV | Missense_Mutation | c.269N>A | p.Gly90Glu | p.G90E | Q96BV0 | protein_coding | tolerated(0.2) | benign(0.095) | TCGA-FU-A3NI-01 | Cervix | cervical & endocervical cancer | Female | <65 | I/II | Unknown | Unknown | SD | |
| ZNF775 | SNV | Missense_Mutation | novel | c.894N>G | p.Ile298Met | p.I298M | Q96BV0 | protein_coding | deleterious(0.02) | probably_damaging(0.982) | TCGA-ZJ-AAXJ-01 | Cervix | cervical & endocervical cancer | Female | <65 | I/II | Unknown | Unknown | SD |
| ZNF775 | SNV | Missense_Mutation | c.1330N>T | p.Arg444Cys | p.R444C | Q96BV0 | protein_coding | deleterious(0) | possibly_damaging(0.891) | TCGA-A6-2686-01 | Colorectum | colon adenocarcinoma | Female | >=65 | I/II | Unknown | Unknown | SD | |
| ZNF775 | SNV | Missense_Mutation | c.1261N>T | p.Arg421Trp | p.R421W | Q96BV0 | protein_coding | deleterious(0.01) | benign(0.183) | TCGA-A6-5661-01 | Colorectum | colon adenocarcinoma | Female | >=65 | I/II | Unknown | Unknown | SD | |
| ZNF775 | SNV | Missense_Mutation | c.602G>A | p.Arg201His | p.R201H | Q96BV0 | protein_coding | deleterious(0.02) | probably_damaging(0.994) | TCGA-AA-3492-01 | Colorectum | colon adenocarcinoma | Female | >=65 | I/II | Unknown | Unknown | SD | |
| ZNF775 | SNV | Missense_Mutation | c.1570N>T | p.His524Tyr | p.H524Y | Q96BV0 | protein_coding | deleterious(0) | probably_damaging(0.946) | TCGA-CK-4951-01 | Colorectum | colon adenocarcinoma | Female | >=65 | I/II | Unknown | Unknown | PD | |
| ZNF775 | SNV | Missense_Mutation | c.1397N>A | p.Arg466His | p.R466H | Q96BV0 | protein_coding | deleterious(0) | probably_damaging(0.993) | TCGA-CK-5916-01 | Colorectum | colon adenocarcinoma | Female | >=65 | I/II | Unknown | Unknown | PD | |
| ZNF775 | SNV | Missense_Mutation | c.836N>A | p.Arg279His | p.R279H | Q96BV0 | protein_coding | deleterious(0.03) | probably_damaging(0.98) | TCGA-CK-6746-01 | Colorectum | colon adenocarcinoma | Female | >=65 | I/II | Unknown | Unknown | SD |
| Page: 1 2 3 4 |
Top |
Related drugs of malignant transformation related genes |
| Identification of chemicals and drugs interact with genes involved in malignant transfromation |
| (DGIdb 4.0) |
| Entrez ID | Symbol | Category | Interaction Types | Drug Claim Name | Drug Name | PMIDs |
| Page: 1 |

Copyright 2023-Present -The University of Texas Health Science Center at Houston |