
|
|||||
|
 | |
| |
| |
| |
| |
| |
|
Gene: ZNF750 |
Gene summary for ZNF750 |
| Gene information | Species | Human | Gene symbol | ZNF750 | Gene ID | 79755 |
| Gene name | zinc finger protein 750 | |
| Gene Alias | ZFP750 | |
| Cytomap | 17q25.3 | |
| Gene Type | protein-coding | GO ID | GO:0000122 | UniProtAcc | Q32MQ0 |
Top |
Malignant transformation analysis |
| Identification of the aberrant gene expression in precancerous and cancerous lesions by comparing the gene expression of stem-like cells in diseased tissues with normal stem cells |
| Entrez ID | Symbol | Replicates | Species | Organ | Tissue | Adj P-value | Log2FC | Malignancy |
| 79755 | ZNF750 | LZE4T | Human | Esophagus | ESCC | 1.89e-07 | 2.96e-01 | 0.0811 |
| 79755 | ZNF750 | LZE7T | Human | Esophagus | ESCC | 2.24e-02 | 1.56e-01 | 0.0667 |
| 79755 | ZNF750 | LZE20T | Human | Esophagus | ESCC | 1.09e-06 | 3.31e-01 | 0.0662 |
| 79755 | ZNF750 | LZE22T | Human | Esophagus | ESCC | 1.41e-03 | 6.12e-01 | 0.068 |
| 79755 | ZNF750 | LZE24T | Human | Esophagus | ESCC | 2.77e-10 | 6.64e-01 | 0.0596 |
| 79755 | ZNF750 | LZE21T | Human | Esophagus | ESCC | 3.98e-08 | 1.07e+00 | 0.0655 |
| 79755 | ZNF750 | P1T-E | Human | Esophagus | ESCC | 2.11e-09 | 5.31e-01 | 0.0875 |
| 79755 | ZNF750 | P2T-E | Human | Esophagus | ESCC | 2.05e-07 | 2.77e-01 | 0.1177 |
| 79755 | ZNF750 | P4T-E | Human | Esophagus | ESCC | 2.09e-08 | 3.06e-01 | 0.1323 |
| 79755 | ZNF750 | P5T-E | Human | Esophagus | ESCC | 1.80e-15 | 4.04e-01 | 0.1327 |
| 79755 | ZNF750 | P8T-E | Human | Esophagus | ESCC | 2.37e-08 | 2.23e-01 | 0.0889 |
| 79755 | ZNF750 | P9T-E | Human | Esophagus | ESCC | 8.33e-16 | 5.72e-01 | 0.1131 |
| 79755 | ZNF750 | P12T-E | Human | Esophagus | ESCC | 2.03e-29 | 1.14e+00 | 0.1122 |
| 79755 | ZNF750 | P15T-E | Human | Esophagus | ESCC | 6.59e-21 | 9.67e-01 | 0.1149 |
| 79755 | ZNF750 | P20T-E | Human | Esophagus | ESCC | 7.04e-14 | 6.18e-01 | 0.1124 |
| 79755 | ZNF750 | P23T-E | Human | Esophagus | ESCC | 1.29e-31 | 1.25e+00 | 0.108 |
| 79755 | ZNF750 | P24T-E | Human | Esophagus | ESCC | 1.30e-23 | 1.08e+00 | 0.1287 |
| 79755 | ZNF750 | P26T-E | Human | Esophagus | ESCC | 2.22e-16 | 5.69e-01 | 0.1276 |
| 79755 | ZNF750 | P27T-E | Human | Esophagus | ESCC | 1.57e-18 | 6.37e-01 | 0.1055 |
| 79755 | ZNF750 | P28T-E | Human | Esophagus | ESCC | 2.04e-71 | 1.90e+00 | 0.1149 |
| Page: 1 2 3 |
| Tissue | Expression Dynamics | Abbreviation |
| Esophagus | 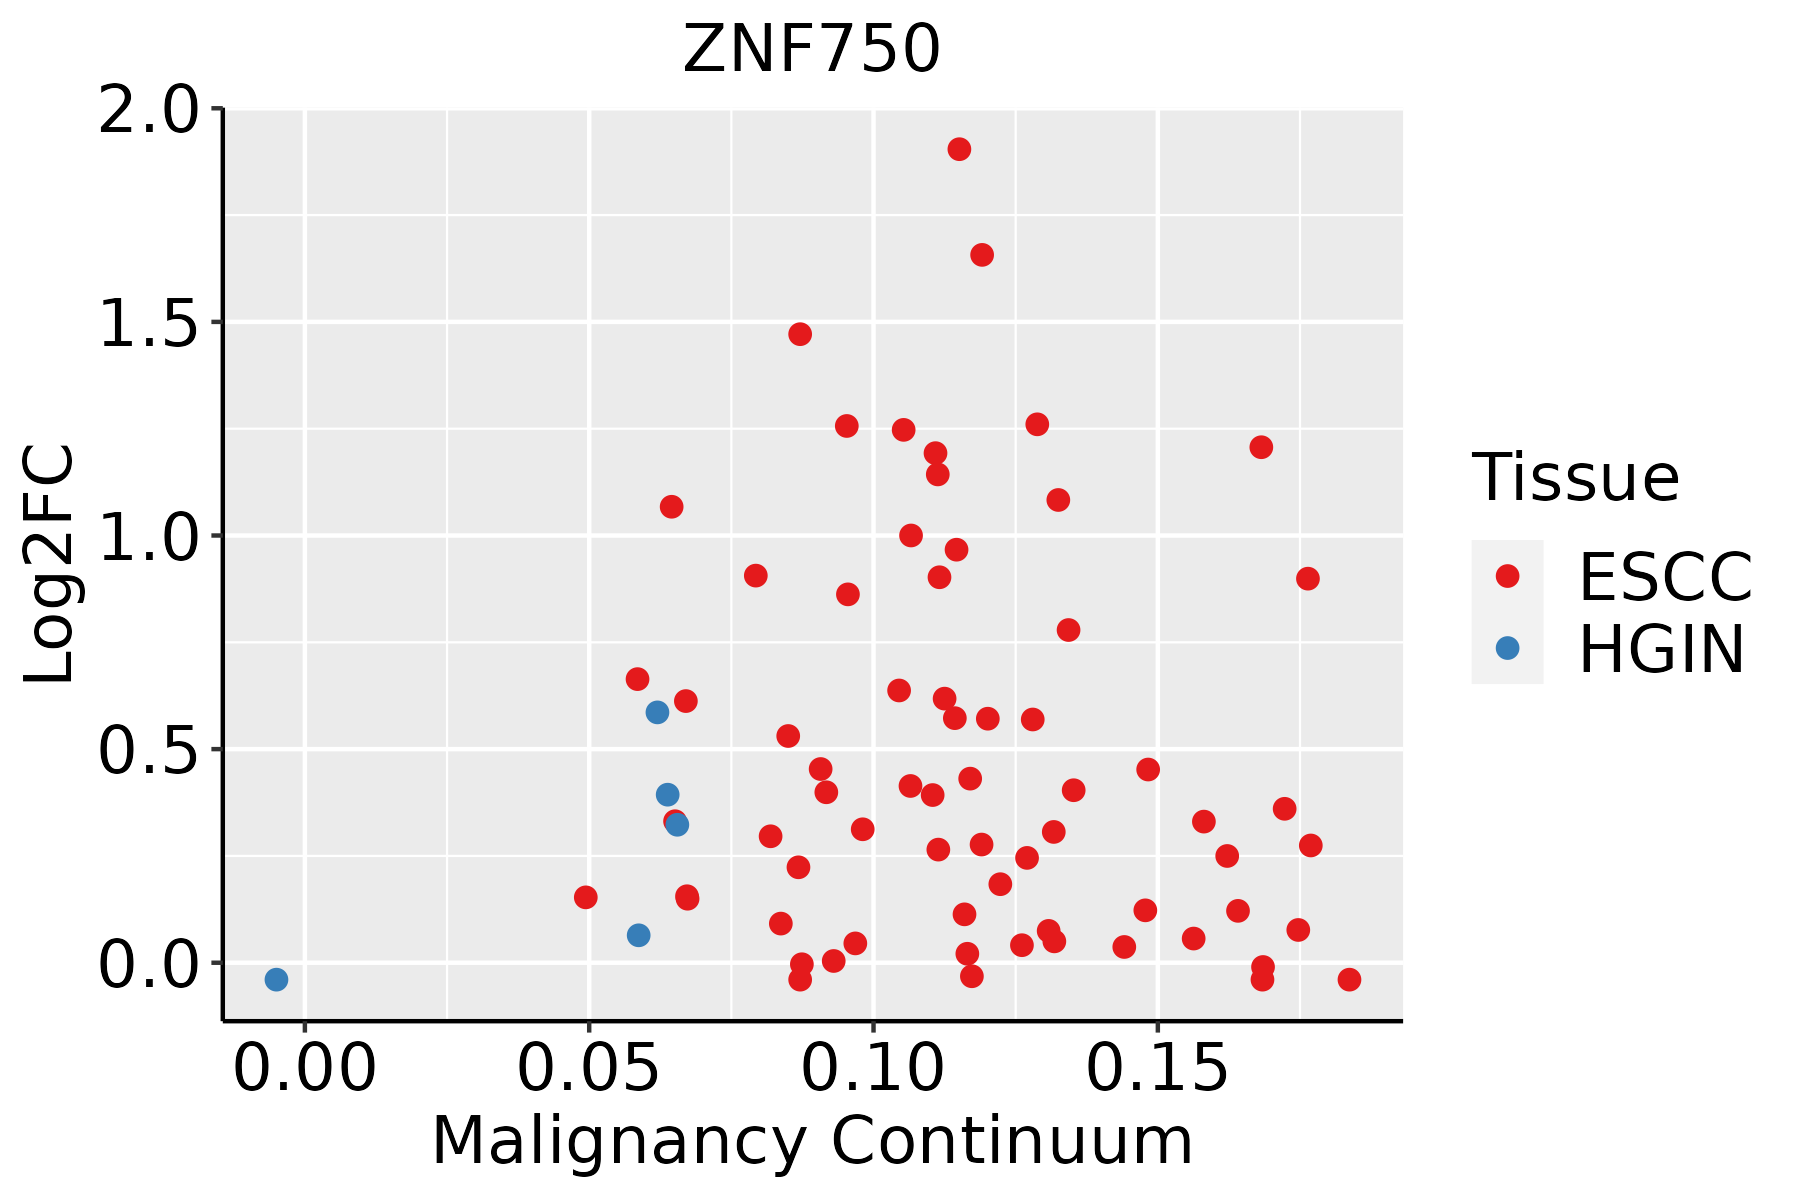 | ESCC: Esophageal squamous cell carcinoma |
| HGIN: High-grade intraepithelial neoplasias | ||
| LGIN: Low-grade intraepithelial neoplasias | ||
| Oral Cavity | 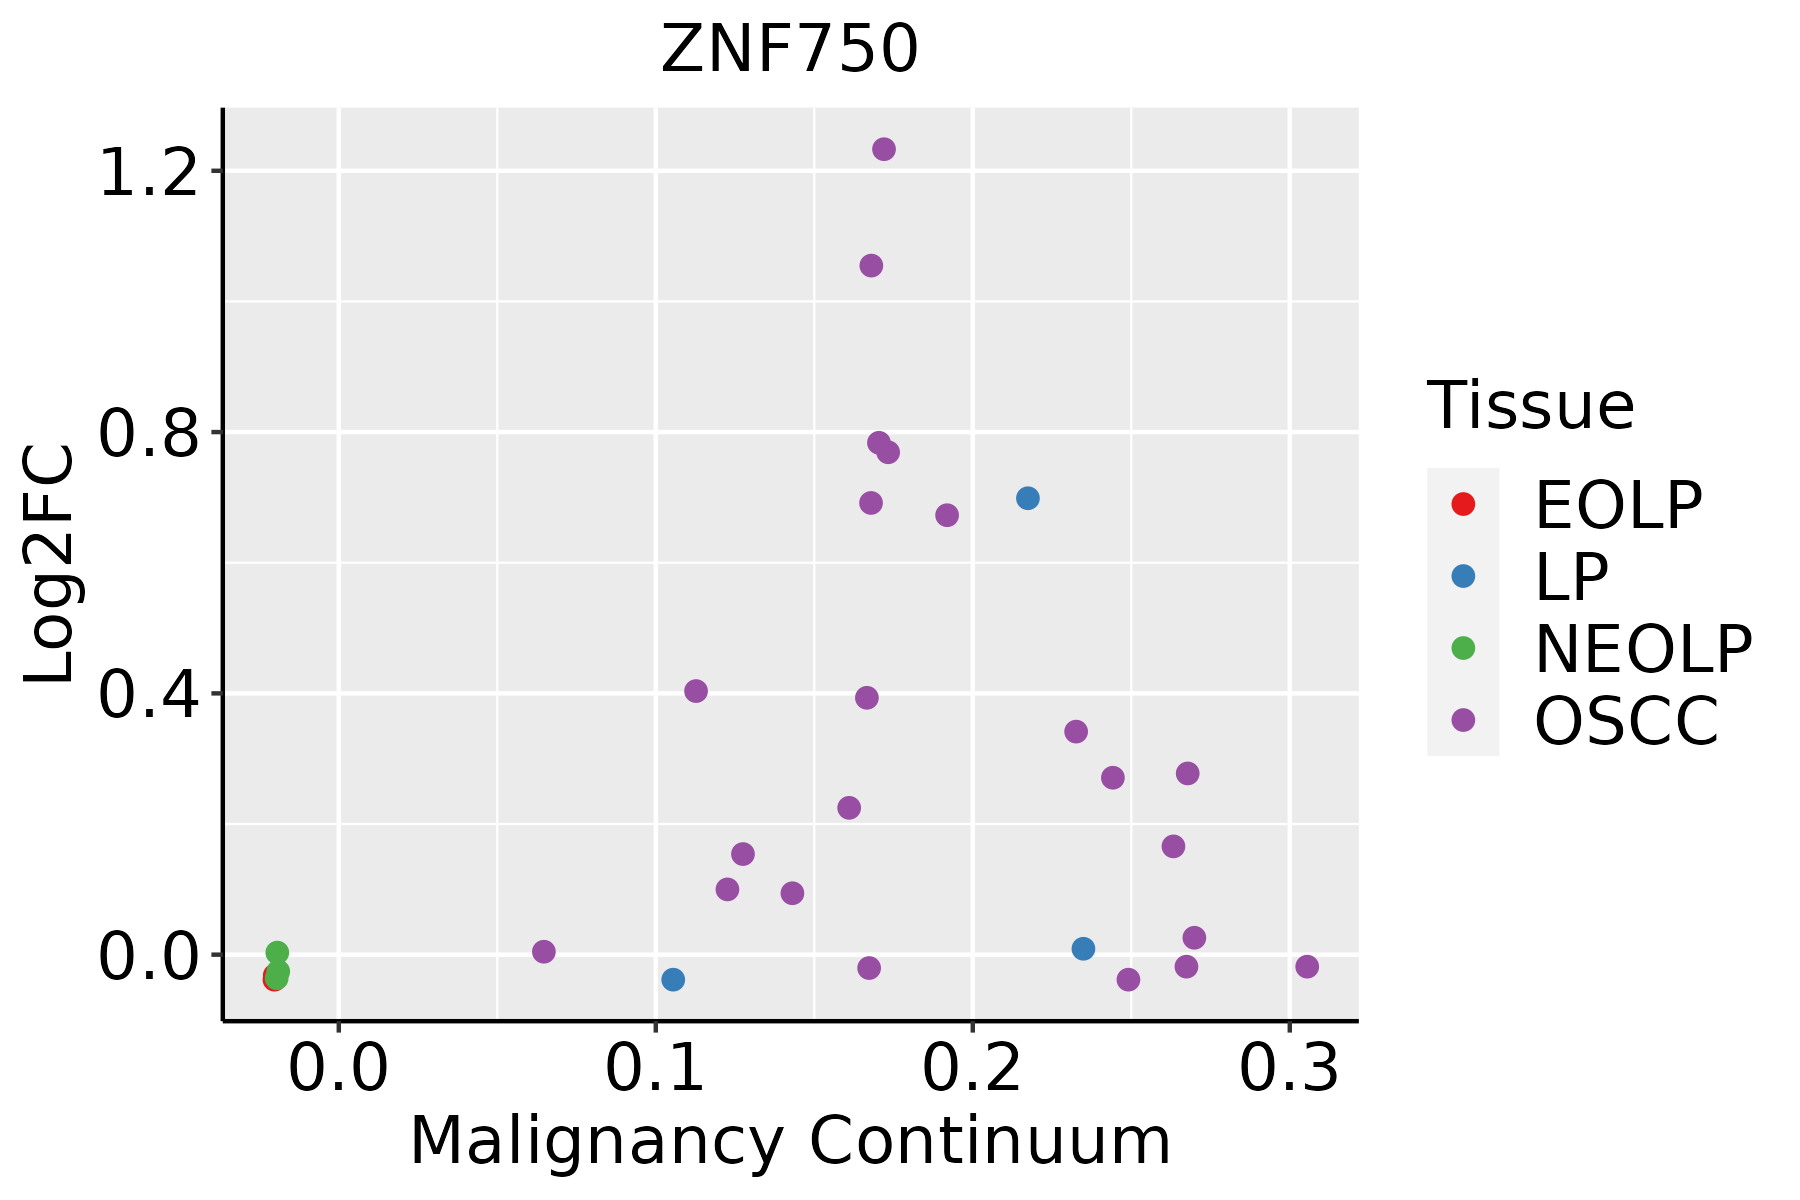 | EOLP: Erosive Oral lichen planus |
| LP: leukoplakia | ||
| NEOLP: Non-erosive oral lichen planus | ||
| OSCC: Oral squamous cell carcinoma |
| ∗log2FC in expression of this searched gene in stem-like cells from each diseased tissue sample relative to stem-like cells in normal samples in each tissue plotted against the malignancy continuum. Samples are colored based on if they are from different disease stage. |
Top |
Malignant transformation related pathway analysis |
| Find out the enriched GO biological processes and KEGG pathways involved in transition from healthy to precancer to cancer |
| Tissue | Disease Stage | Enriched GO biological Processes |
| Colorectum | AD |  |
| Colorectum | SER |  |
| Colorectum | MSS |  |
| Colorectum | MSI-H |  |
| Colorectum | FAP |  |
| ∗Top 15 enriched GO BP terms are showed in the bar plot of each disease state in each tissue. Each row represents a significant GO biological process which is colored according to the -log10(p.adjust). |
| Page: 1 2 3 4 5 6 7 8 9 |
| GO ID | Tissue | Disease Stage | Description | Gene Ratio | Bg Ratio | pvalue | p.adjust | Count |
| GO:000854410 | Esophagus | ESCC | epidermis development | 193/8552 | 324/18723 | 2.87e-07 | 4.19e-06 | 193 |
| GO:00018378 | Esophagus | ESCC | epithelial to mesenchymal transition | 95/8552 | 157/18723 | 1.25e-04 | 8.56e-04 | 95 |
| GO:00487628 | Esophagus | ESCC | mesenchymal cell differentiation | 133/8552 | 236/18723 | 5.94e-04 | 3.22e-03 | 133 |
| GO:00107174 | Esophagus | ESCC | regulation of epithelial to mesenchymal transition | 61/8552 | 99/18723 | 1.01e-03 | 5.09e-03 | 61 |
| GO:00604856 | Esophagus | ESCC | mesenchyme development | 156/8552 | 291/18723 | 3.76e-03 | 1.53e-02 | 156 |
| GO:00085449 | Oral cavity | OSCC | epidermis development | 171/7305 | 324/18723 | 2.89e-07 | 4.43e-06 | 171 |
| GO:00018377 | Oral cavity | OSCC | epithelial to mesenchymal transition | 82/7305 | 157/18723 | 5.09e-04 | 2.98e-03 | 82 |
| GO:00107173 | Oral cavity | OSCC | regulation of epithelial to mesenchymal transition | 54/7305 | 99/18723 | 1.21e-03 | 6.10e-03 | 54 |
| GO:00487627 | Oral cavity | OSCC | mesenchymal cell differentiation | 109/7305 | 236/18723 | 1.43e-02 | 4.69e-02 | 109 |
| Page: 1 |
| Pathway ID | Tissue | Disease Stage | Description | Gene Ratio | Bg Ratio | pvalue | p.adjust | qvalue | Count |
| Page: 1 |
Top |
Cell-cell communication analysis |
| Identification of potential cell-cell interactions between two cell types and their ligand-receptor pairs for different disease states |
| Ligand | Receptor | LRpair | Pathway | Tissue | Disease Stage |
| Page: 1 |
Top |
Single-cell gene regulatory network inference analysis |
| Find out the significant the regulons (TFs) and the target genes of each regulon across cell types for different disease states |
| TF | Cell Type | Tissue | Disease Stage | Target Gene | RSS | Regulon Activity |
| ∗The dot plots of a searched regulon are shown for all cell subpopulations in each disease state of each tissue based on the regulon specific score inferred using pySCENIC and by calculating the average expression. |
| Page: 1 |
Top |
Somatic mutation of malignant transformation related genes |
| Annotation of somatic variants for genes involved in malignant transformation |
| Hugo Symbol | Variant Class | Variant Classification | dbSNP RS | HGVSc | HGVSp | HGVSp Short | SWISSPROT | BIOTYPE | SIFT | PolyPhen | Tumor Sample Barcode | Tissue | Histology | Sex | Age | Stage | Therapy Types | Drugs | Outcome |
| ZNF750 | SNV | Missense_Mutation | novel | c.215N>G | p.Asp72Gly | p.D72G | Q32MQ0 | protein_coding | deleterious(0.01) | probably_damaging(0.935) | TCGA-AN-A046-01 | Breast | breast invasive carcinoma | Female | >=65 | I/II | Unknown | Unknown | SD |
| ZNF750 | SNV | Missense_Mutation | novel | c.1180N>A | p.Asp394Asn | p.D394N | Q32MQ0 | protein_coding | deleterious(0.01) | possibly_damaging(0.876) | TCGA-BH-A0C0-01 | Breast | breast invasive carcinoma | Female | <65 | I/II | Chemotherapy | carboplatin | SD |
| ZNF750 | insertion | Frame_Shift_Ins | novel | c.1614_1615insTATTTTC | p.Glu539TyrfsTer24 | p.E539Yfs*24 | Q32MQ0 | protein_coding | TCGA-A2-A04Y-01 | Breast | breast invasive carcinoma | Female | <65 | I/II | Chemotherapy | cytoxan | SD | ||
| ZNF750 | deletion | Frame_Shift_Del | novel | c.2095delN | p.Gln699SerfsTer85 | p.Q699Sfs*85 | Q32MQ0 | protein_coding | TCGA-D8-A27V-01 | Breast | breast invasive carcinoma | Female | <65 | I/II | Hormone Therapy | tamoxiphen | SD | ||
| ZNF750 | SNV | Missense_Mutation | c.40N>G | p.Tyr14Asp | p.Y14D | Q32MQ0 | protein_coding | deleterious(0) | probably_damaging(0.999) | TCGA-C5-A1BQ-01 | Cervix | cervical & endocervical cancer | Female | >=65 | III/IV | Chemotherapy | cisplatin | CR | |
| ZNF750 | SNV | Missense_Mutation | c.1896N>C | p.Gln632His | p.Q632H | Q32MQ0 | protein_coding | deleterious(0) | probably_damaging(0.999) | TCGA-C5-A3HE-01 | Cervix | cervical & endocervical cancer | Female | <65 | I/II | Unknown | Unknown | PD | |
| ZNF750 | SNV | Missense_Mutation | c.40N>G | p.Tyr14Asp | p.Y14D | Q32MQ0 | protein_coding | deleterious(0) | probably_damaging(0.999) | TCGA-C5-A3HL-01 | Cervix | cervical & endocervical cancer | Female | >=65 | I/II | Unknown | Unknown | SD | |
| ZNF750 | SNV | Missense_Mutation | c.362N>A | p.Gly121Glu | p.G121E | Q32MQ0 | protein_coding | tolerated(0.53) | benign(0.001) | TCGA-DR-A0ZM-01 | Cervix | cervical & endocervical cancer | Female | <65 | III/IV | Unspecific | Cisplatin | SD | |
| ZNF750 | SNV | Missense_Mutation | c.118N>G | p.Leu40Val | p.L40V | Q32MQ0 | protein_coding | deleterious(0) | probably_damaging(0.999) | TCGA-HM-A4S6-01 | Cervix | cervical & endocervical cancer | Female | <65 | III/IV | Chemotherapy | cisplatin | CR | |
| ZNF750 | SNV | Missense_Mutation | c.668N>T | p.Ser223Leu | p.S223L | Q32MQ0 | protein_coding | deleterious(0) | benign(0.229) | TCGA-MA-AA3Z-01 | Cervix | cervical & endocervical cancer | Female | <65 | I/II | Unknown | Unknown | SD |
| Page: 1 2 3 4 5 6 7 8 |
Top |
Related drugs of malignant transformation related genes |
| Identification of chemicals and drugs interact with genes involved in malignant transfromation |
| (DGIdb 4.0) |
| Entrez ID | Symbol | Category | Interaction Types | Drug Claim Name | Drug Name | PMIDs |
| Page: 1 |

Copyright 2023-Present -The University of Texas Health Science Center at Houston |