
|
|||||
|
 | |
| |
| |
| |
| |
| |
|
Gene: ZNF749 |
Gene summary for ZNF749 |
| Gene information | Species | Human | Gene symbol | ZNF749 | Gene ID | 388567 |
| Gene name | zinc finger protein 749 | |
| Gene Alias | ZNF749 | |
| Cytomap | 19q13.43 | |
| Gene Type | protein-coding | GO ID | GO:0000122 | UniProtAcc | O43361 |
Top |
Malignant transformation analysis |
| Identification of the aberrant gene expression in precancerous and cancerous lesions by comparing the gene expression of stem-like cells in diseased tissues with normal stem cells |
| Entrez ID | Symbol | Replicates | Species | Organ | Tissue | Adj P-value | Log2FC | Malignancy |
| 388567 | ZNF749 | LZE5T | Human | Esophagus | ESCC | 3.18e-06 | 4.04e-01 | 0.0514 |
| 388567 | ZNF749 | LZE20T | Human | Esophagus | ESCC | 7.80e-05 | 2.91e-01 | 0.0662 |
| 388567 | ZNF749 | LZE24T | Human | Esophagus | ESCC | 1.18e-12 | 3.26e-01 | 0.0596 |
| 388567 | ZNF749 | LZE21T | Human | Esophagus | ESCC | 1.61e-04 | 2.89e-01 | 0.0655 |
| 388567 | ZNF749 | LZE6T | Human | Esophagus | ESCC | 6.67e-11 | 5.56e-01 | 0.0845 |
| 388567 | ZNF749 | P1T-E | Human | Esophagus | ESCC | 2.36e-10 | 4.84e-01 | 0.0875 |
| 388567 | ZNF749 | P2T-E | Human | Esophagus | ESCC | 1.13e-16 | 2.68e-01 | 0.1177 |
| 388567 | ZNF749 | P4T-E | Human | Esophagus | ESCC | 1.51e-21 | 5.13e-01 | 0.1323 |
| 388567 | ZNF749 | P8T-E | Human | Esophagus | ESCC | 4.05e-32 | 5.61e-01 | 0.0889 |
| 388567 | ZNF749 | P9T-E | Human | Esophagus | ESCC | 1.20e-06 | 1.72e-01 | 0.1131 |
| 388567 | ZNF749 | P10T-E | Human | Esophagus | ESCC | 2.41e-29 | 4.79e-01 | 0.116 |
| 388567 | ZNF749 | P11T-E | Human | Esophagus | ESCC | 1.93e-12 | 4.43e-01 | 0.1426 |
| 388567 | ZNF749 | P12T-E | Human | Esophagus | ESCC | 1.62e-13 | 2.25e-01 | 0.1122 |
| 388567 | ZNF749 | P15T-E | Human | Esophagus | ESCC | 2.73e-19 | 3.85e-01 | 0.1149 |
| 388567 | ZNF749 | P16T-E | Human | Esophagus | ESCC | 1.68e-13 | 2.45e-01 | 0.1153 |
| 388567 | ZNF749 | P17T-E | Human | Esophagus | ESCC | 1.40e-13 | 5.99e-01 | 0.1278 |
| 388567 | ZNF749 | P19T-E | Human | Esophagus | ESCC | 2.85e-04 | 4.52e-01 | 0.1662 |
| 388567 | ZNF749 | P20T-E | Human | Esophagus | ESCC | 8.73e-12 | 2.69e-01 | 0.1124 |
| 388567 | ZNF749 | P21T-E | Human | Esophagus | ESCC | 7.98e-13 | 2.50e-01 | 0.1617 |
| 388567 | ZNF749 | P22T-E | Human | Esophagus | ESCC | 1.07e-50 | 7.38e-01 | 0.1236 |
| Page: 1 2 3 4 |
| Tissue | Expression Dynamics | Abbreviation |
| Esophagus |  | ESCC: Esophageal squamous cell carcinoma |
| HGIN: High-grade intraepithelial neoplasias | ||
| LGIN: Low-grade intraepithelial neoplasias | ||
| Liver | 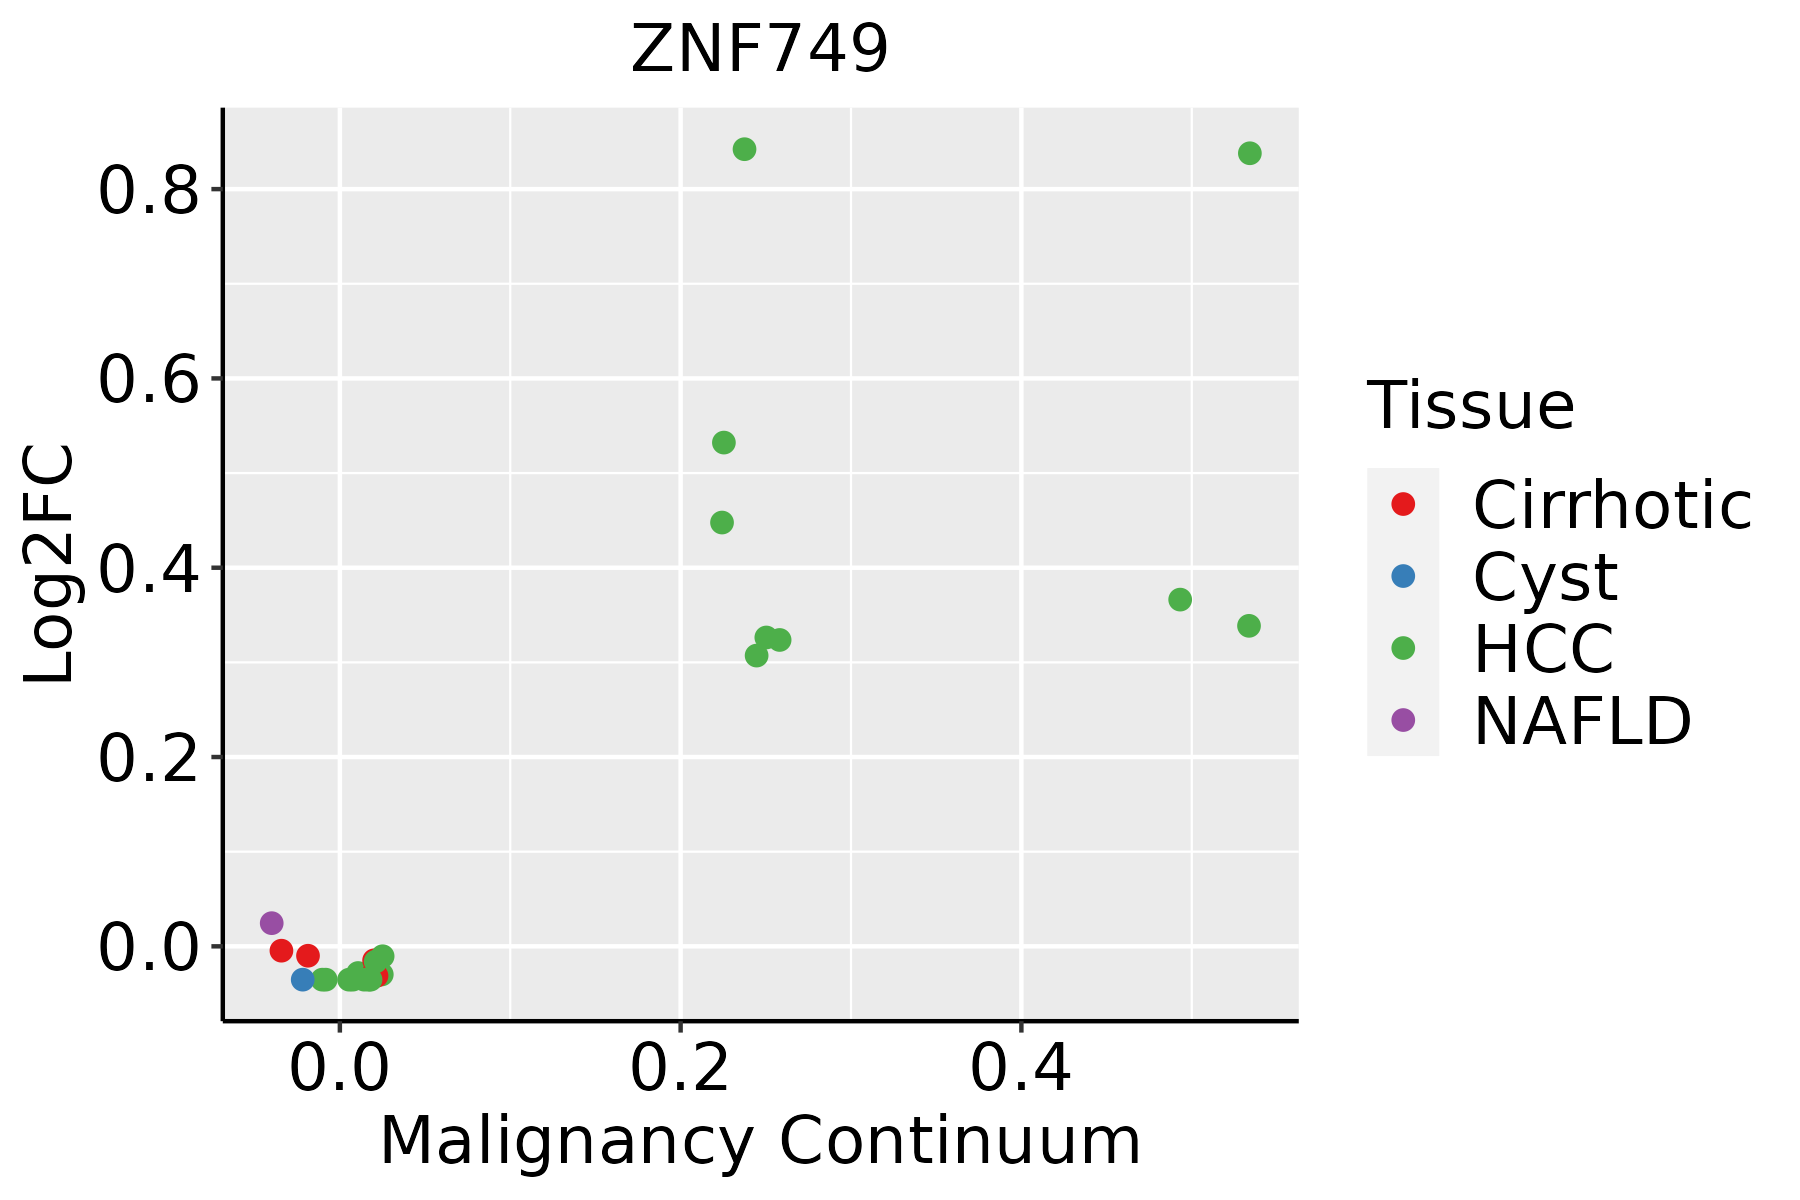 | HCC: Hepatocellular carcinoma |
| NAFLD: Non-alcoholic fatty liver disease |
| ∗log2FC in expression of this searched gene in stem-like cells from each diseased tissue sample relative to stem-like cells in normal samples in each tissue plotted against the malignancy continuum. Samples are colored based on if they are from different disease stage. |
Top |
Malignant transformation related pathway analysis |
| Find out the enriched GO biological processes and KEGG pathways involved in transition from healthy to precancer to cancer |
| Tissue | Disease Stage | Enriched GO biological Processes |
| Colorectum | AD |  |
| Colorectum | SER |  |
| Colorectum | MSS |  |
| Colorectum | MSI-H |  |
| Colorectum | FAP |  |
| ∗Top 15 enriched GO BP terms are showed in the bar plot of each disease state in each tissue. Each row represents a significant GO biological process which is colored according to the -log10(p.adjust). |
| Page: 1 2 3 4 5 6 7 8 9 |
| GO ID | Tissue | Disease Stage | Description | Gene Ratio | Bg Ratio | pvalue | p.adjust | Count |
| Page: 1 |
| Pathway ID | Tissue | Disease Stage | Description | Gene Ratio | Bg Ratio | pvalue | p.adjust | qvalue | Count |
| Page: 1 |
Top |
Cell-cell communication analysis |
| Identification of potential cell-cell interactions between two cell types and their ligand-receptor pairs for different disease states |
| Ligand | Receptor | LRpair | Pathway | Tissue | Disease Stage |
| Page: 1 |
Top |
Single-cell gene regulatory network inference analysis |
| Find out the significant the regulons (TFs) and the target genes of each regulon across cell types for different disease states |
| TF | Cell Type | Tissue | Disease Stage | Target Gene | RSS | Regulon Activity |
| ZNF749 | CD8TCM | Liver | Healthy | CMC1,FAM133B,PCBD1, etc. | 4.03e-03 |  |
| ZNF749 | PLA | Lung | AIS | TNFRSF18,FARSB,C12orf73, etc. | 7.45e-02 |  |
| ZNF749 | PLA | Lung | MIAC | FGFR1OP,TTN,MPHOSPH9, etc. | 4.39e-02 |  |
| ∗The dot plots of a searched regulon are shown for all cell subpopulations in each disease state of each tissue based on the regulon specific score inferred using pySCENIC and by calculating the average expression. |
| Page: 1 |
Top |
Somatic mutation of malignant transformation related genes |
| Annotation of somatic variants for genes involved in malignant transformation |
| Hugo Symbol | Variant Class | Variant Classification | dbSNP RS | HGVSc | HGVSp | HGVSp Short | SWISSPROT | BIOTYPE | SIFT | PolyPhen | Tumor Sample Barcode | Tissue | Histology | Sex | Age | Stage | Therapy Types | Drugs | Outcome |
| ZNF749 | SNV | Missense_Mutation | c.1315G>C | p.Glu439Gln | p.E439Q | O43361 | protein_coding | deleterious(0.02) | benign(0.125) | TCGA-A8-A06Q-01 | Breast | breast invasive carcinoma | Female | <65 | III/IV | Unknown | Unknown | SD | |
| ZNF749 | SNV | Missense_Mutation | c.387G>T | p.Lys129Asn | p.K129N | O43361 | protein_coding | tolerated(0.06) | benign(0.078) | TCGA-AO-A128-01 | Breast | breast invasive carcinoma | Female | <65 | I/II | Chemotherapy | doxorubicin | SD | |
| ZNF749 | insertion | Frame_Shift_Ins | novel | c.2030_2031insAACAAAGGCC | p.Arg678ThrfsTer4 | p.R678Tfs*4 | O43361 | protein_coding | TCGA-B6-A0IK-01 | Breast | breast invasive carcinoma | Female | <65 | III/IV | Unknown | Unknown | PD | ||
| ZNF749 | SNV | Missense_Mutation | c.436C>T | p.His146Tyr | p.H146Y | O43361 | protein_coding | tolerated(0.06) | benign(0.019) | TCGA-EK-A3GK-01 | Cervix | cervical & endocervical cancer | Female | <65 | I/II | Unknown | Unknown | SD | |
| ZNF749 | SNV | Missense_Mutation | c.941N>C | p.Val314Ala | p.V314A | O43361 | protein_coding | tolerated(0.2) | benign(0.003) | TCGA-FU-A3HZ-01 | Cervix | cervical & endocervical cancer | Female | <65 | I/II | Chemotherapy | cisplatin | CR | |
| ZNF749 | SNV | Missense_Mutation | c.2086C>T | p.His696Tyr | p.H696Y | O43361 | protein_coding | tolerated(1) | benign(0.003) | TCGA-A6-2679-01 | Colorectum | colon adenocarcinoma | Female | >=65 | I/II | Unknown | Unknown | SD | |
| ZNF749 | SNV | Missense_Mutation | c.95N>C | p.Leu32Pro | p.L32P | O43361 | protein_coding | deleterious(0) | probably_damaging(0.995) | TCGA-A6-5661-01 | Colorectum | colon adenocarcinoma | Female | >=65 | I/II | Unknown | Unknown | SD | |
| ZNF749 | SNV | Missense_Mutation | c.1111N>G | p.Arg371Gly | p.R371G | O43361 | protein_coding | tolerated(0.5) | benign(0.358) | TCGA-AA-3492-01 | Colorectum | colon adenocarcinoma | Female | >=65 | I/II | Unknown | Unknown | SD | |
| ZNF749 | SNV | Missense_Mutation | c.2096N>C | p.Ser699Thr | p.S699T | O43361 | protein_coding | tolerated(0.17) | benign(0.018) | TCGA-AA-3966-01 | Colorectum | colon adenocarcinoma | Female | >=65 | I/II | Unknown | Unknown | SD | |
| ZNF749 | SNV | Missense_Mutation | c.874C>T | p.Leu292Phe | p.L292F | O43361 | protein_coding | tolerated(0.69) | benign(0) | TCGA-AA-A010-01 | Colorectum | colon adenocarcinoma | Female | <65 | I/II | Chemotherapy | folinic | CR |
| Page: 1 2 3 4 5 6 7 8 |
Top |
Related drugs of malignant transformation related genes |
| Identification of chemicals and drugs interact with genes involved in malignant transfromation |
| (DGIdb 4.0) |
| Entrez ID | Symbol | Category | Interaction Types | Drug Claim Name | Drug Name | PMIDs |
| Page: 1 |

Copyright 2023-Present -The University of Texas Health Science Center at Houston |