
|
|||||
|
 | |
| |
| |
| |
| |
| |
|
Gene: ZNF707 |
Gene summary for ZNF707 |
| Gene information | Species | Human | Gene symbol | ZNF707 | Gene ID | 286075 |
| Gene name | zinc finger protein 707 | |
| Gene Alias | ZNF707 | |
| Cytomap | 8q24.3 | |
| Gene Type | protein-coding | GO ID | GO:0006139 | UniProtAcc | Q96C28 |
Top |
Malignant transformation analysis |
| Identification of the aberrant gene expression in precancerous and cancerous lesions by comparing the gene expression of stem-like cells in diseased tissues with normal stem cells |
| Entrez ID | Symbol | Replicates | Species | Organ | Tissue | Adj P-value | Log2FC | Malignancy |
| 286075 | ZNF707 | LZE24T | Human | Esophagus | ESCC | 2.83e-06 | 1.76e-01 | 0.0596 |
| 286075 | ZNF707 | P2T-E | Human | Esophagus | ESCC | 8.71e-05 | 1.25e-01 | 0.1177 |
| 286075 | ZNF707 | P4T-E | Human | Esophagus | ESCC | 4.19e-07 | 1.81e-01 | 0.1323 |
| 286075 | ZNF707 | P10T-E | Human | Esophagus | ESCC | 1.56e-02 | 1.03e-01 | 0.116 |
| 286075 | ZNF707 | P12T-E | Human | Esophagus | ESCC | 1.06e-05 | 1.88e-01 | 0.1122 |
| 286075 | ZNF707 | P15T-E | Human | Esophagus | ESCC | 3.16e-04 | 1.09e-01 | 0.1149 |
| 286075 | ZNF707 | P16T-E | Human | Esophagus | ESCC | 7.86e-08 | 2.22e-01 | 0.1153 |
| 286075 | ZNF707 | P23T-E | Human | Esophagus | ESCC | 1.23e-04 | 1.69e-01 | 0.108 |
| 286075 | ZNF707 | P26T-E | Human | Esophagus | ESCC | 3.22e-07 | 1.42e-01 | 0.1276 |
| 286075 | ZNF707 | P27T-E | Human | Esophagus | ESCC | 5.27e-04 | 1.26e-01 | 0.1055 |
| 286075 | ZNF707 | P28T-E | Human | Esophagus | ESCC | 2.83e-12 | 2.40e-01 | 0.1149 |
| 286075 | ZNF707 | P30T-E | Human | Esophagus | ESCC | 1.69e-05 | 2.27e-01 | 0.137 |
| 286075 | ZNF707 | P31T-E | Human | Esophagus | ESCC | 2.61e-02 | 1.20e-01 | 0.1251 |
| 286075 | ZNF707 | P36T-E | Human | Esophagus | ESCC | 1.17e-02 | 1.47e-01 | 0.1187 |
| 286075 | ZNF707 | P49T-E | Human | Esophagus | ESCC | 2.32e-07 | 5.17e-01 | 0.1768 |
| 286075 | ZNF707 | P52T-E | Human | Esophagus | ESCC | 1.65e-05 | 1.46e-01 | 0.1555 |
| 286075 | ZNF707 | P54T-E | Human | Esophagus | ESCC | 2.83e-10 | 1.96e-01 | 0.0975 |
| 286075 | ZNF707 | P62T-E | Human | Esophagus | ESCC | 1.34e-06 | 2.02e-01 | 0.1302 |
| 286075 | ZNF707 | P65T-E | Human | Esophagus | ESCC | 4.01e-02 | 1.09e-01 | 0.0978 |
| 286075 | ZNF707 | P74T-E | Human | Esophagus | ESCC | 5.65e-04 | 1.68e-01 | 0.1479 |
| Page: 1 2 |
| Tissue | Expression Dynamics | Abbreviation |
| Esophagus | 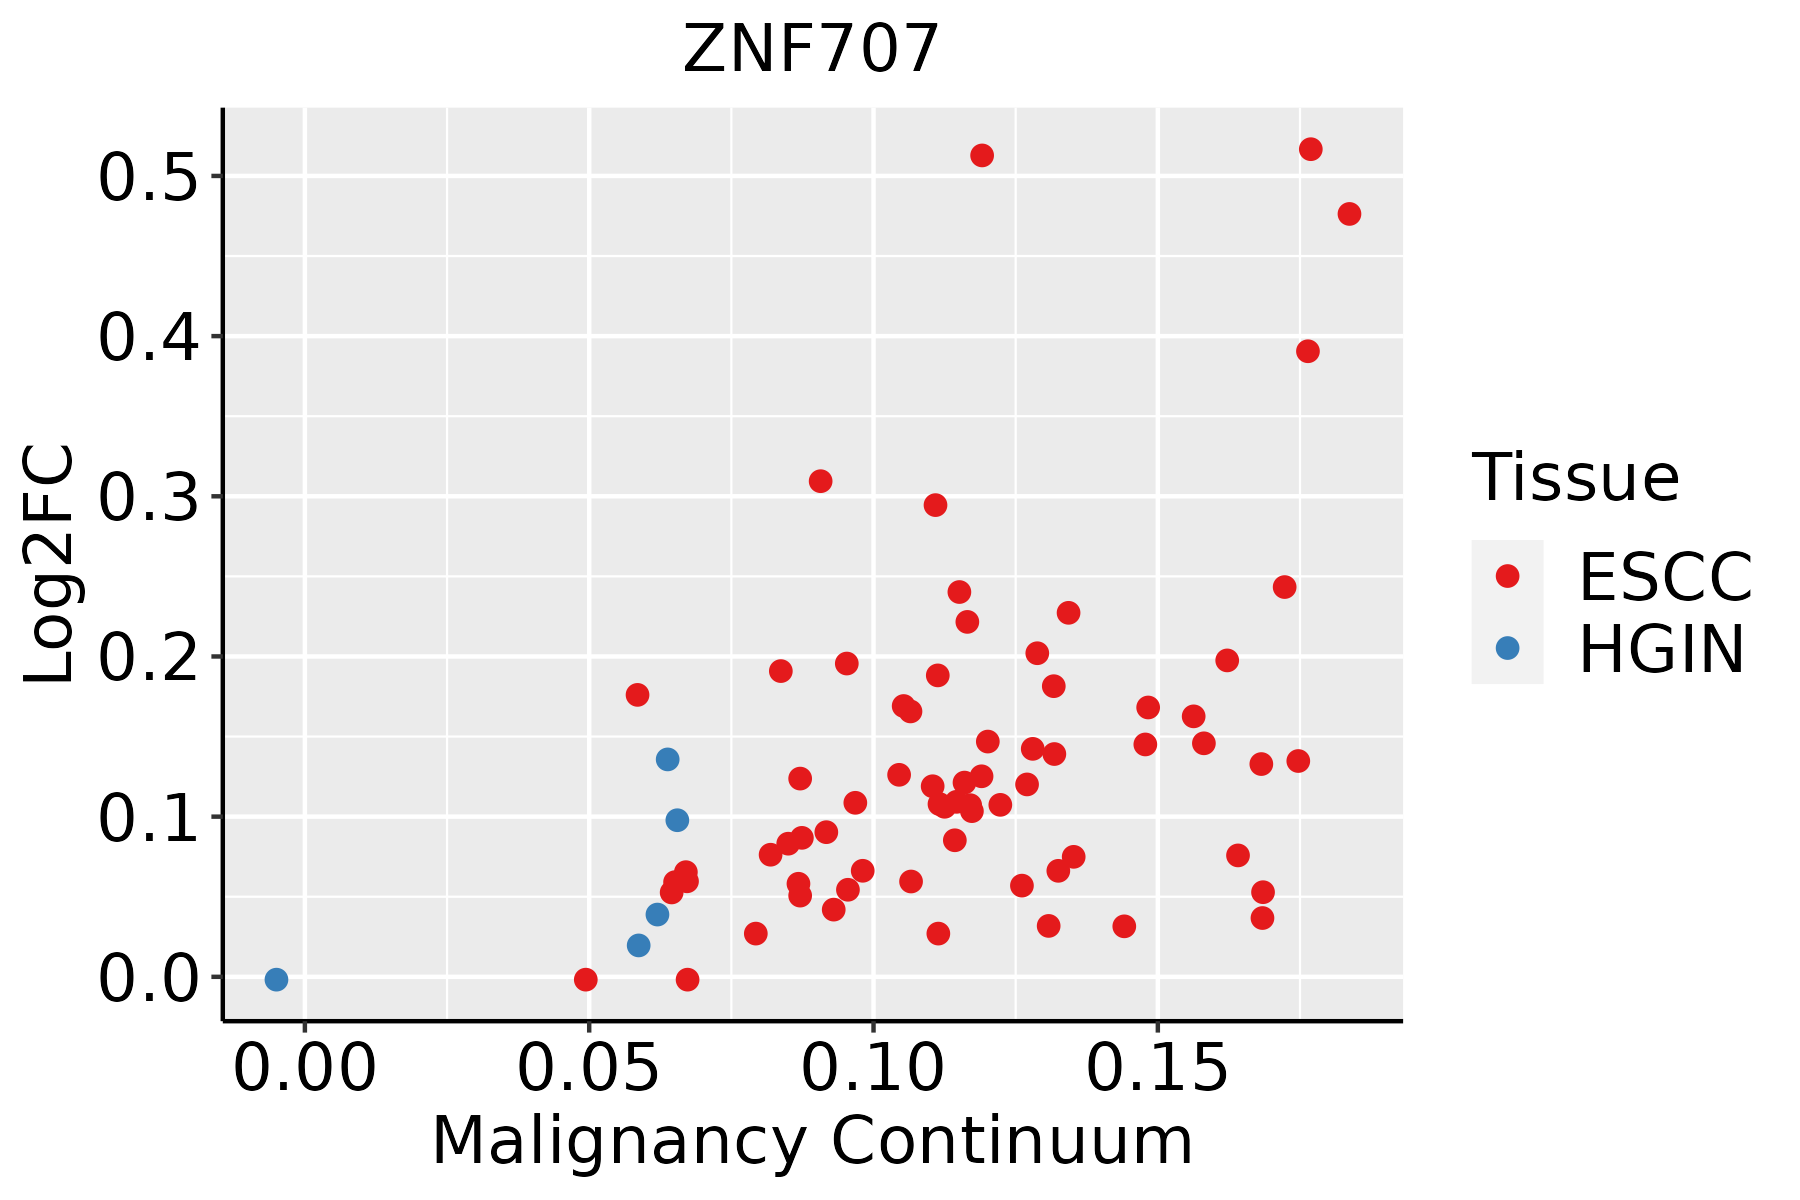 | ESCC: Esophageal squamous cell carcinoma |
| HGIN: High-grade intraepithelial neoplasias | ||
| LGIN: Low-grade intraepithelial neoplasias |
| ∗log2FC in expression of this searched gene in stem-like cells from each diseased tissue sample relative to stem-like cells in normal samples in each tissue plotted against the malignancy continuum. Samples are colored based on if they are from different disease stage. |
Top |
Malignant transformation related pathway analysis |
| Find out the enriched GO biological processes and KEGG pathways involved in transition from healthy to precancer to cancer |
| Tissue | Disease Stage | Enriched GO biological Processes |
| Colorectum | AD |  |
| Colorectum | SER |  |
| Colorectum | MSS |  |
| Colorectum | MSI-H |  |
| Colorectum | FAP |  |
| ∗Top 15 enriched GO BP terms are showed in the bar plot of each disease state in each tissue. Each row represents a significant GO biological process which is colored according to the -log10(p.adjust). |
| Page: 1 2 3 4 5 6 7 8 9 |
| GO ID | Tissue | Disease Stage | Description | Gene Ratio | Bg Ratio | pvalue | p.adjust | Count |
| Page: 1 |
| Pathway ID | Tissue | Disease Stage | Description | Gene Ratio | Bg Ratio | pvalue | p.adjust | qvalue | Count |
| Page: 1 |
Top |
Cell-cell communication analysis |
| Identification of potential cell-cell interactions between two cell types and their ligand-receptor pairs for different disease states |
| Ligand | Receptor | LRpair | Pathway | Tissue | Disease Stage |
| Page: 1 |
Top |
Single-cell gene regulatory network inference analysis |
| Find out the significant the regulons (TFs) and the target genes of each regulon across cell types for different disease states |
| TF | Cell Type | Tissue | Disease Stage | Target Gene | RSS | Regulon Activity |
| ∗The dot plots of a searched regulon are shown for all cell subpopulations in each disease state of each tissue based on the regulon specific score inferred using pySCENIC and by calculating the average expression. |
| Page: 1 |
Top |
Somatic mutation of malignant transformation related genes |
| Annotation of somatic variants for genes involved in malignant transformation |
| Hugo Symbol | Variant Class | Variant Classification | dbSNP RS | HGVSc | HGVSp | HGVSp Short | SWISSPROT | BIOTYPE | SIFT | PolyPhen | Tumor Sample Barcode | Tissue | Histology | Sex | Age | Stage | Therapy Types | Drugs | Outcome |
| ZNF707 | SNV | Missense_Mutation | c.181N>A | p.Glu61Lys | p.E61K | Q96C28 | protein_coding | deleterious(0.01) | benign(0.14) | TCGA-D8-A1JA-01 | Breast | breast invasive carcinoma | Female | <65 | III/IV | Chemotherapy | adriamycin | PD | |
| ZNF707 | SNV | Missense_Mutation | c.491N>C | p.Arg164Thr | p.R164T | Q96C28 | protein_coding | tolerated(0.6) | benign(0.021) | TCGA-IR-A3LK-01 | Cervix | cervical & endocervical cancer | Female | >=65 | I/II | Chemotherapy | cisplatin | PD | |
| ZNF707 | SNV | Missense_Mutation | rs782357335 | c.703N>A | p.Glu235Lys | p.E235K | Q96C28 | protein_coding | tolerated(0.27) | possibly_damaging(0.472) | TCGA-IR-A3LK-01 | Cervix | cervical & endocervical cancer | Female | >=65 | I/II | Chemotherapy | cisplatin | PD |
| ZNF707 | SNV | Missense_Mutation | rs782362747 | c.514N>A | p.Val172Ile | p.V172I | Q96C28 | protein_coding | tolerated(0.14) | benign(0.007) | TCGA-CK-4951-01 | Colorectum | colon adenocarcinoma | Female | >=65 | I/II | Unknown | Unknown | PD |
| ZNF707 | SNV | Missense_Mutation | rs782634200 | c.680N>T | p.Thr227Met | p.T227M | Q96C28 | protein_coding | deleterious(0) | probably_damaging(0.957) | TCGA-D5-6928-01 | Colorectum | colon adenocarcinoma | Male | >=65 | I/II | Unknown | Unknown | SD |
| ZNF707 | SNV | Missense_Mutation | c.943N>T | p.Pro315Ser | p.P315S | Q96C28 | protein_coding | deleterious(0.01) | probably_damaging(0.991) | TCGA-DM-A1DA-01 | Colorectum | colon adenocarcinoma | Female | >=65 | III/IV | Unknown | Unknown | SD | |
| ZNF707 | SNV | Missense_Mutation | c.718N>A | p.Ala240Thr | p.A240T | Q96C28 | protein_coding | deleterious(0) | possibly_damaging(0.587) | TCGA-WS-AB45-01 | Colorectum | colon adenocarcinoma | Female | <65 | I/II | Unknown | Unknown | SD | |
| ZNF707 | SNV | Missense_Mutation | c.89N>T | p.Arg30Met | p.R30M | Q96C28 | protein_coding | deleterious(0) | benign(0.184) | TCGA-AP-A0LM-01 | Endometrium | uterine corpus endometrioid carcinoma | Female | <65 | III/IV | Chemotherapy | cisplatin | SD | |
| ZNF707 | SNV | Missense_Mutation | novel | c.749A>G | p.His250Arg | p.H250R | Q96C28 | protein_coding | deleterious(0) | probably_damaging(0.999) | TCGA-AP-A1DK-01 | Endometrium | uterine corpus endometrioid carcinoma | Female | <65 | I/II | Unknown | Unknown | SD |
| ZNF707 | SNV | Missense_Mutation | novel | c.419G>T | p.Arg140Met | p.R140M | Q96C28 | protein_coding | tolerated(0.12) | possibly_damaging(0.615) | TCGA-AP-A1DV-01 | Endometrium | uterine corpus endometrioid carcinoma | Female | <65 | I/II | Unknown | Unknown | SD |
| Page: 1 2 3 4 5 |
Top |
Related drugs of malignant transformation related genes |
| Identification of chemicals and drugs interact with genes involved in malignant transfromation |
| (DGIdb 4.0) |
| Entrez ID | Symbol | Category | Interaction Types | Drug Claim Name | Drug Name | PMIDs |
| Page: 1 |

Copyright 2023-Present -The University of Texas Health Science Center at Houston |