
|
|||||
|
 | |
| |
| |
| |
| |
| |
|
Gene: ZNF706 |
Gene summary for ZNF706 |
| Gene information | Species | Human | Gene symbol | ZNF706 | Gene ID | 51123 |
| Gene name | zinc finger protein 706 | |
| Gene Alias | HSPC038 | |
| Cytomap | 8q22.3 | |
| Gene Type | protein-coding | GO ID | GO:0006139 | UniProtAcc | Q9Y5V0 |
Top |
Malignant transformation analysis |
| Identification of the aberrant gene expression in precancerous and cancerous lesions by comparing the gene expression of stem-like cells in diseased tissues with normal stem cells |
| Entrez ID | Symbol | Replicates | Species | Organ | Tissue | Adj P-value | Log2FC | Malignancy |
| 51123 | ZNF706 | GSM4909281 | Human | Breast | IDC | 5.04e-73 | 9.21e-01 | 0.21 |
| 51123 | ZNF706 | GSM4909286 | Human | Breast | IDC | 2.64e-09 | 3.30e-01 | 0.1081 |
| 51123 | ZNF706 | GSM4909287 | Human | Breast | IDC | 1.18e-03 | 3.16e-01 | 0.2057 |
| 51123 | ZNF706 | GSM4909288 | Human | Breast | IDC | 4.54e-03 | -1.62e-01 | 0.0988 |
| 51123 | ZNF706 | GSM4909290 | Human | Breast | IDC | 3.38e-19 | 6.22e-01 | 0.2096 |
| 51123 | ZNF706 | GSM4909291 | Human | Breast | IDC | 1.58e-26 | 7.10e-01 | 0.1753 |
| 51123 | ZNF706 | GSM4909294 | Human | Breast | IDC | 6.28e-12 | 2.74e-01 | 0.2022 |
| 51123 | ZNF706 | GSM4909296 | Human | Breast | IDC | 2.73e-09 | -9.43e-02 | 0.1524 |
| 51123 | ZNF706 | GSM4909297 | Human | Breast | IDC | 1.99e-16 | -9.22e-02 | 0.1517 |
| 51123 | ZNF706 | GSM4909302 | Human | Breast | IDC | 8.31e-03 | 2.52e-01 | 0.1545 |
| 51123 | ZNF706 | GSM4909306 | Human | Breast | IDC | 1.73e-11 | 4.28e-01 | 0.1564 |
| 51123 | ZNF706 | GSM4909308 | Human | Breast | IDC | 1.88e-05 | 3.46e-01 | 0.158 |
| 51123 | ZNF706 | GSM4909309 | Human | Breast | IDC | 1.43e-04 | 1.30e-01 | 0.0483 |
| 51123 | ZNF706 | GSM4909311 | Human | Breast | IDC | 6.66e-44 | -4.53e-02 | 0.1534 |
| 51123 | ZNF706 | GSM4909312 | Human | Breast | IDC | 2.32e-18 | 2.05e-01 | 0.1552 |
| 51123 | ZNF706 | GSM4909319 | Human | Breast | IDC | 2.43e-46 | -1.46e-01 | 0.1563 |
| 51123 | ZNF706 | GSM4909320 | Human | Breast | IDC | 1.68e-04 | -2.31e-01 | 0.1575 |
| 51123 | ZNF706 | GSM4909321 | Human | Breast | IDC | 8.50e-17 | -1.83e-01 | 0.1559 |
| 51123 | ZNF706 | brca1 | Human | Breast | Precancer | 3.48e-11 | 4.45e-01 | -0.0338 |
| 51123 | ZNF706 | brca3 | Human | Breast | Precancer | 5.87e-05 | 1.98e-01 | -0.0263 |
| Page: 1 2 3 4 5 6 7 8 9 10 11 12 |
| Tissue | Expression Dynamics | Abbreviation |
| Breast | 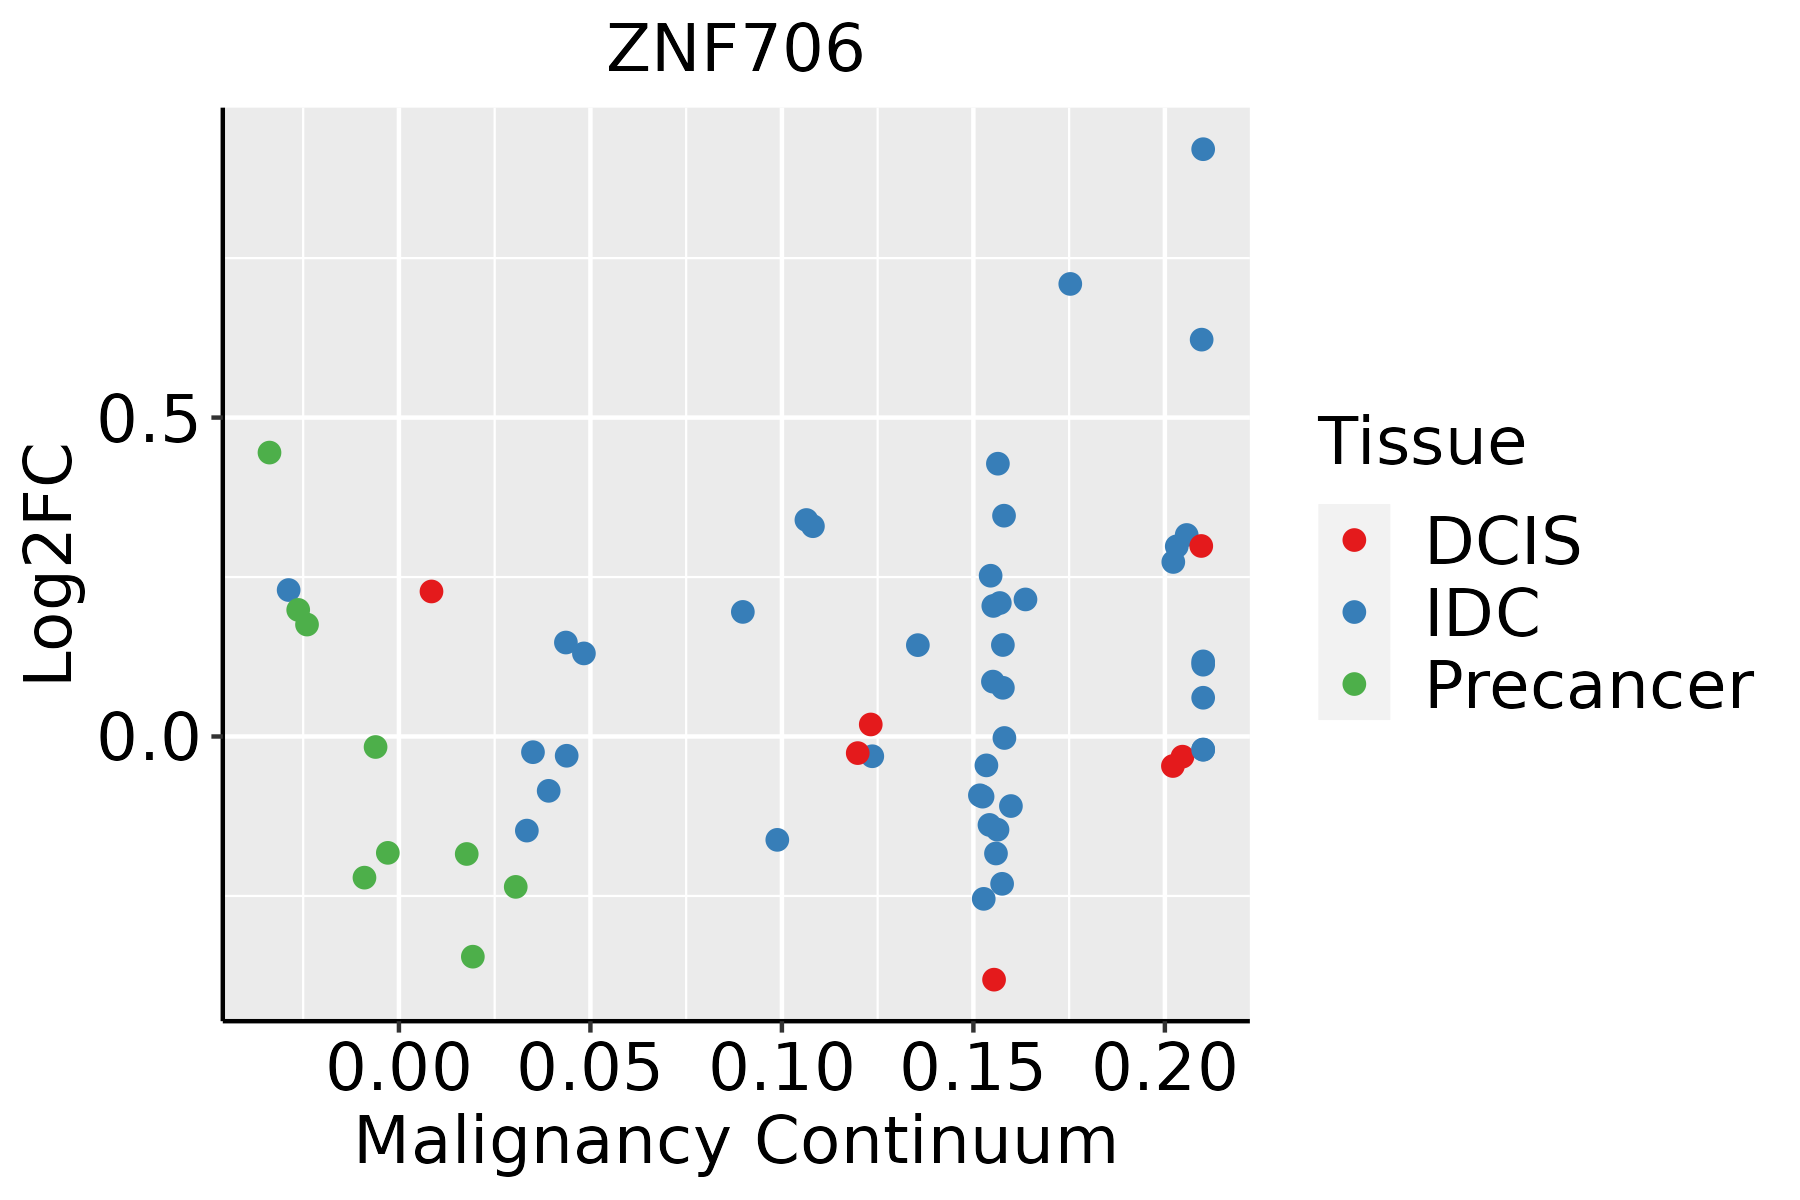 | IDC: Invasive ductal carcinoma |
| DCIS: Ductal carcinoma in situ | ||
| Precancer(BRCA1-mut): Precancerous lesion from BRCA1 mutation carriers | ||
| Colorectum (GSE201348) |  | FAP: Familial adenomatous polyposis |
| CRC: Colorectal cancer | ||
| Colorectum (HTA11) |  | AD: Adenomas |
| SER: Sessile serrated lesions | ||
| MSI-H: Microsatellite-high colorectal cancer | ||
| MSS: Microsatellite stable colorectal cancer | ||
| Endometrium |  | AEH: Atypical endometrial hyperplasia |
| EEC: Endometrioid Cancer | ||
| Esophagus |  | ESCC: Esophageal squamous cell carcinoma |
| HGIN: High-grade intraepithelial neoplasias | ||
| LGIN: Low-grade intraepithelial neoplasias | ||
| Liver |  | HCC: Hepatocellular carcinoma |
| NAFLD: Non-alcoholic fatty liver disease | ||
| Oral Cavity |  | EOLP: Erosive Oral lichen planus |
| LP: leukoplakia | ||
| NEOLP: Non-erosive oral lichen planus | ||
| OSCC: Oral squamous cell carcinoma | ||
| Prostate | 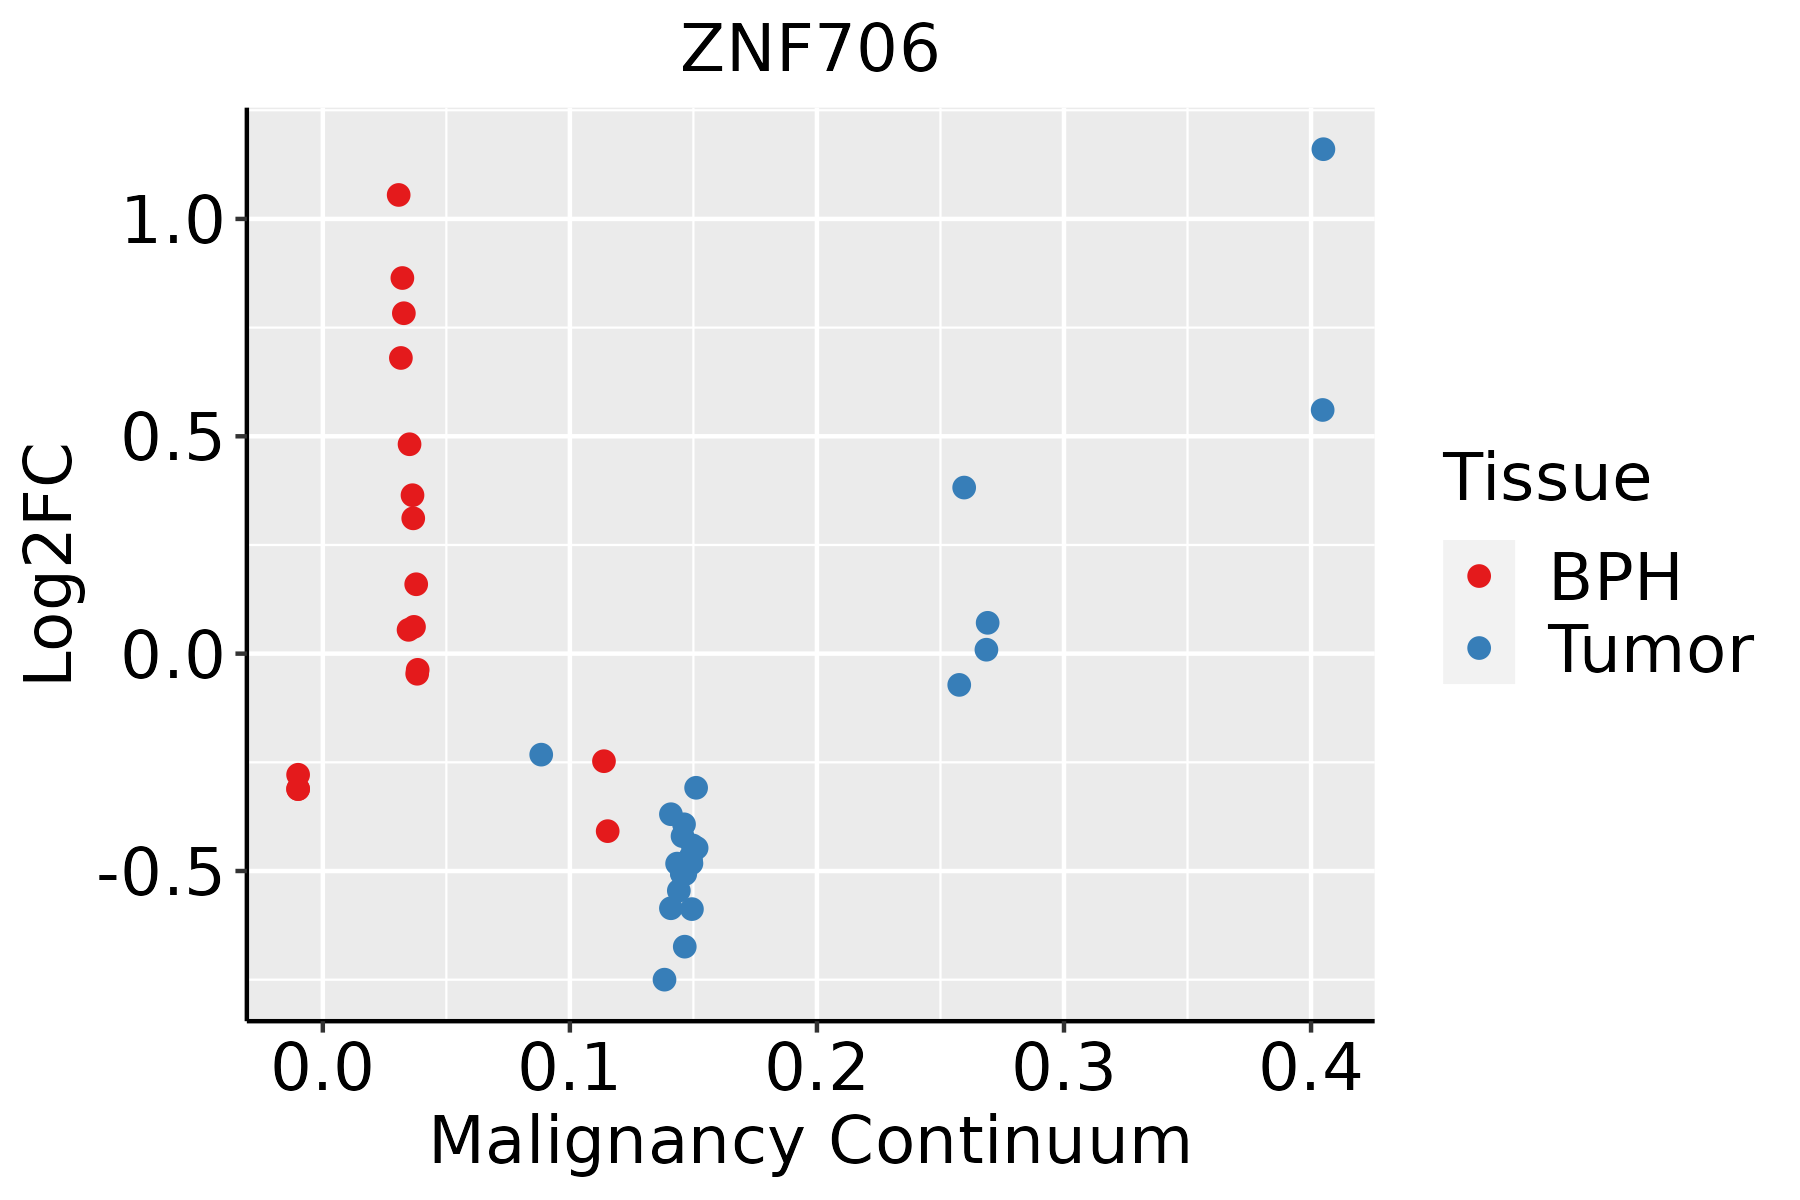 | BPH: Benign Prostatic Hyperplasia |
| Skin |  | AK: Actinic keratosis |
| cSCC: Cutaneous squamous cell carcinoma | ||
| SCCIS:squamous cell carcinoma in situ | ||
| Thyroid | 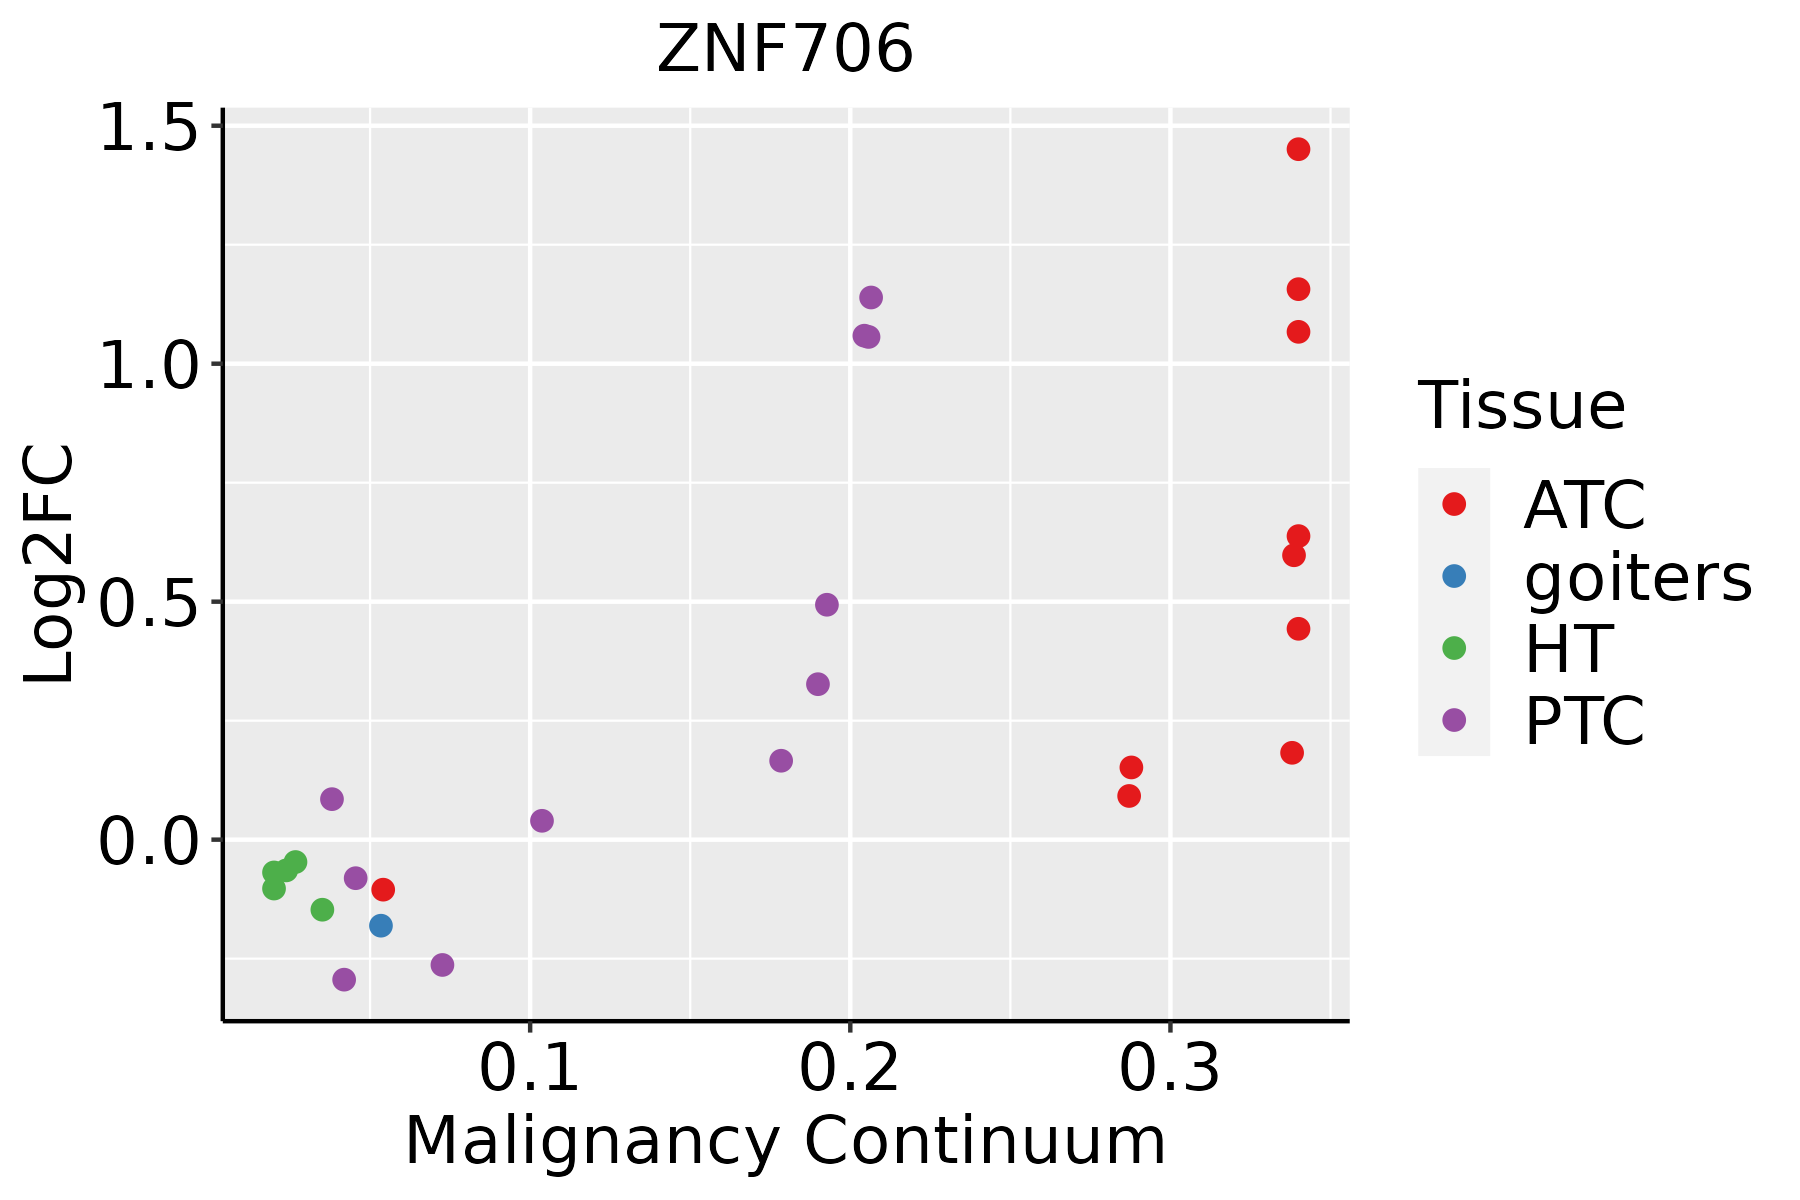 | ATC: Anaplastic thyroid cancer |
| HT: Hashimoto's thyroiditis | ||
| PTC: Papillary thyroid cancer |
| ∗log2FC in expression of this searched gene in stem-like cells from each diseased tissue sample relative to stem-like cells in normal samples in each tissue plotted against the malignancy continuum. Samples are colored based on if they are from different disease stage. |
Top |
Malignant transformation related pathway analysis |
| Find out the enriched GO biological processes and KEGG pathways involved in transition from healthy to precancer to cancer |
| Tissue | Disease Stage | Enriched GO biological Processes |
| Colorectum | AD |  |
| Colorectum | SER |  |
| Colorectum | MSS |  |
| Colorectum | MSI-H |  |
| Colorectum | FAP |  |
| ∗Top 15 enriched GO BP terms are showed in the bar plot of each disease state in each tissue. Each row represents a significant GO biological process which is colored according to the -log10(p.adjust). |
| Page: 1 2 3 4 5 6 7 8 9 |
| GO ID | Tissue | Disease Stage | Description | Gene Ratio | Bg Ratio | pvalue | p.adjust | Count |
| GO:00064179 | Breast | Precancer | regulation of translation | 67/1080 | 468/18723 | 4.71e-12 | 7.64e-10 | 67 |
| GO:000641714 | Breast | IDC | regulation of translation | 74/1434 | 468/18723 | 1.67e-09 | 1.53e-07 | 74 |
| GO:000641724 | Breast | DCIS | regulation of translation | 72/1390 | 468/18723 | 2.46e-09 | 2.17e-07 | 72 |
| GO:0006417 | Colorectum | AD | regulation of translation | 141/3918 | 468/18723 | 1.32e-06 | 4.22e-05 | 141 |
| GO:00064171 | Colorectum | SER | regulation of translation | 100/2897 | 468/18723 | 3.76e-04 | 5.74e-03 | 100 |
| GO:00064172 | Colorectum | MSS | regulation of translation | 134/3467 | 468/18723 | 4.43e-08 | 2.38e-06 | 134 |
| GO:00064174 | Colorectum | FAP | regulation of translation | 111/2622 | 468/18723 | 8.47e-09 | 1.13e-06 | 111 |
| GO:0019827 | Colorectum | FAP | stem cell population maintenance | 33/2622 | 131/18723 | 4.61e-04 | 5.39e-03 | 33 |
| GO:0098727 | Colorectum | FAP | maintenance of cell number | 33/2622 | 134/18723 | 7.09e-04 | 7.64e-03 | 33 |
| GO:000641716 | Endometrium | AEH | regulation of translation | 94/2100 | 468/18723 | 1.14e-08 | 7.62e-07 | 94 |
| GO:000641717 | Endometrium | EEC | regulation of translation | 94/2168 | 468/18723 | 5.37e-08 | 2.88e-06 | 94 |
| GO:000641727 | Esophagus | HGIN | regulation of translation | 139/2587 | 468/18723 | 1.46e-19 | 7.98e-17 | 139 |
| GO:00198277 | Esophagus | HGIN | stem cell population maintenance | 39/2587 | 131/18723 | 1.63e-06 | 6.14e-05 | 39 |
| GO:00987278 | Esophagus | HGIN | maintenance of cell number | 39/2587 | 134/18723 | 3.02e-06 | 1.03e-04 | 39 |
| GO:20000362 | Esophagus | HGIN | regulation of stem cell population maintenance | 11/2587 | 33/18723 | 3.55e-03 | 3.26e-02 | 11 |
| GO:0006417111 | Esophagus | ESCC | regulation of translation | 304/8552 | 468/18723 | 1.53e-17 | 1.33e-15 | 304 |
| GO:009872714 | Esophagus | ESCC | maintenance of cell number | 90/8552 | 134/18723 | 3.94e-07 | 5.43e-06 | 90 |
| GO:001982714 | Esophagus | ESCC | stem cell population maintenance | 88/8552 | 131/18723 | 5.23e-07 | 6.97e-06 | 88 |
| GO:20000361 | Esophagus | ESCC | regulation of stem cell population maintenance | 23/8552 | 33/18723 | 4.57e-03 | 1.78e-02 | 23 |
| GO:000641712 | Liver | Cirrhotic | regulation of translation | 194/4634 | 468/18723 | 7.28e-16 | 8.79e-14 | 194 |
| Page: 1 2 3 |
| Pathway ID | Tissue | Disease Stage | Description | Gene Ratio | Bg Ratio | pvalue | p.adjust | qvalue | Count |
| Page: 1 |
Top |
Cell-cell communication analysis |
| Identification of potential cell-cell interactions between two cell types and their ligand-receptor pairs for different disease states |
| Ligand | Receptor | LRpair | Pathway | Tissue | Disease Stage |
| Page: 1 |
Top |
Single-cell gene regulatory network inference analysis |
| Find out the significant the regulons (TFs) and the target genes of each regulon across cell types for different disease states |
| TF | Cell Type | Tissue | Disease Stage | Target Gene | RSS | Regulon Activity |
| ∗The dot plots of a searched regulon are shown for all cell subpopulations in each disease state of each tissue based on the regulon specific score inferred using pySCENIC and by calculating the average expression. |
| Page: 1 |
Top |
Somatic mutation of malignant transformation related genes |
| Annotation of somatic variants for genes involved in malignant transformation |
| Hugo Symbol | Variant Class | Variant Classification | dbSNP RS | HGVSc | HGVSp | HGVSp Short | SWISSPROT | BIOTYPE | SIFT | PolyPhen | Tumor Sample Barcode | Tissue | Histology | Sex | Age | Stage | Therapy Types | Drugs | Outcome |
| ZNF706 | SNV | Missense_Mutation | novel | c.41N>T | p.Asn14Ile | p.N14I | Q9Y5V0 | protein_coding | deleterious(0.01) | probably_damaging(0.983) | TCGA-AJ-A3EL-01 | Endometrium | uterine corpus endometrioid carcinoma | Female | <65 | I/II | Unknown | Unknown | SD |
| ZNF706 | SNV | Missense_Mutation | novel | c.21A>C | p.Lys7Asn | p.K7N | Q9Y5V0 | protein_coding | deleterious(0) | probably_damaging(0.975) | TCGA-EO-A22U-01 | Endometrium | uterine corpus endometrioid carcinoma | Female | >=65 | I/II | Unknown | Unknown | SD |
| ZNF706 | SNV | Missense_Mutation | novel | c.109N>G | p.Leu37Val | p.L37V | Q9Y5V0 | protein_coding | deleterious(0) | possibly_damaging(0.874) | TCGA-DD-AAE7-01 | Liver | liver hepatocellular carcinoma | Male | >=65 | I/II | Unknown | Unknown | SD |
| ZNF706 | SNV | Missense_Mutation | novel | c.134G>C | p.Arg45Thr | p.R45T | Q9Y5V0 | protein_coding | deleterious(0.02) | benign(0.044) | TCGA-L9-A444-01 | Lung | lung adenocarcinoma | Female | <65 | I/II | Unknown | Unknown | SD |
| ZNF706 | SNV | Missense_Mutation | novel | c.202N>T | p.Pro68Ser | p.P68S | Q9Y5V0 | protein_coding | deleterious(0) | probably_damaging(0.96) | TCGA-60-2695-01 | Lung | lung squamous cell carcinoma | Female | >=65 | I/II | Unknown | Unknown | SD |
| Page: 1 |
Top |
Related drugs of malignant transformation related genes |
| Identification of chemicals and drugs interact with genes involved in malignant transfromation |
| (DGIdb 4.0) |
| Entrez ID | Symbol | Category | Interaction Types | Drug Claim Name | Drug Name | PMIDs |
| Page: 1 |

Copyright 2023-Present -The University of Texas Health Science Center at Houston |