
|
|||||
|
 | |
| |
| |
| |
| |
| |
|
Gene: ZNF704 |
Gene summary for ZNF704 |
| Gene information | Species | Human | Gene symbol | ZNF704 | Gene ID | 619279 |
| Gene name | zinc finger protein 704 | |
| Gene Alias | Gig1 | |
| Cytomap | 8q21.13 | |
| Gene Type | protein-coding | GO ID | GO:0006139 | UniProtAcc | Q6ZNC4 |
Top |
Malignant transformation analysis |
| Identification of the aberrant gene expression in precancerous and cancerous lesions by comparing the gene expression of stem-like cells in diseased tissues with normal stem cells |
| Entrez ID | Symbol | Replicates | Species | Organ | Tissue | Adj P-value | Log2FC | Malignancy |
| 619279 | ZNF704 | HTA11_3410_2000001011 | Human | Colorectum | AD | 4.98e-29 | -7.78e-01 | 0.0155 |
| 619279 | ZNF704 | HTA11_2487_2000001011 | Human | Colorectum | SER | 1.78e-15 | -7.42e-01 | -0.1808 |
| 619279 | ZNF704 | HTA11_2951_2000001011 | Human | Colorectum | AD | 4.34e-04 | -8.07e-01 | 0.0216 |
| 619279 | ZNF704 | HTA11_1938_2000001011 | Human | Colorectum | AD | 4.60e-03 | -4.64e-01 | -0.0811 |
| 619279 | ZNF704 | HTA11_2112_2000001011 | Human | Colorectum | SER | 2.22e-02 | -6.04e-01 | -0.2196 |
| 619279 | ZNF704 | HTA11_3361_2000001011 | Human | Colorectum | AD | 1.04e-11 | -7.22e-01 | -0.1207 |
| 619279 | ZNF704 | HTA11_696_2000001011 | Human | Colorectum | AD | 8.19e-03 | -2.79e-01 | -0.1464 |
| 619279 | ZNF704 | HTA11_866_2000001011 | Human | Colorectum | AD | 3.04e-04 | -2.69e-01 | -0.1001 |
| 619279 | ZNF704 | HTA11_1391_2000001011 | Human | Colorectum | AD | 1.05e-07 | -4.81e-01 | -0.059 |
| 619279 | ZNF704 | HTA11_5212_2000001011 | Human | Colorectum | AD | 5.03e-05 | -7.20e-01 | -0.2061 |
| 619279 | ZNF704 | HTA11_5216_2000001011 | Human | Colorectum | SER | 2.65e-03 | -7.20e-01 | -0.1462 |
| 619279 | ZNF704 | HTA11_866_3004761011 | Human | Colorectum | AD | 7.15e-13 | -5.56e-01 | 0.096 |
| 619279 | ZNF704 | HTA11_8622_2000001021 | Human | Colorectum | SER | 7.33e-06 | -7.53e-01 | 0.0528 |
| 619279 | ZNF704 | HTA11_10711_2000001011 | Human | Colorectum | AD | 1.35e-03 | -4.19e-01 | 0.0338 |
| 619279 | ZNF704 | HTA11_7696_3000711011 | Human | Colorectum | AD | 6.63e-10 | -3.88e-01 | 0.0674 |
| 619279 | ZNF704 | HTA11_99999970781_79442 | Human | Colorectum | MSS | 2.04e-21 | -5.58e-01 | 0.294 |
| 619279 | ZNF704 | HTA11_99999973899_84307 | Human | Colorectum | MSS | 1.89e-12 | -8.30e-01 | 0.2585 |
| 619279 | ZNF704 | HTA11_99999974143_84620 | Human | Colorectum | MSS | 7.65e-33 | -7.83e-01 | 0.3005 |
| 619279 | ZNF704 | F007 | Human | Colorectum | FAP | 4.19e-03 | -1.91e-01 | 0.1176 |
| 619279 | ZNF704 | A015-C-203 | Human | Colorectum | FAP | 6.41e-23 | -3.66e-01 | -0.1294 |
| Page: 1 2 3 4 5 6 |
| Tissue | Expression Dynamics | Abbreviation |
| Colorectum (GSE201348) |  | FAP: Familial adenomatous polyposis |
| CRC: Colorectal cancer | ||
| Colorectum (HTA11) |  | AD: Adenomas |
| SER: Sessile serrated lesions | ||
| MSI-H: Microsatellite-high colorectal cancer | ||
| MSS: Microsatellite stable colorectal cancer | ||
| Endometrium | 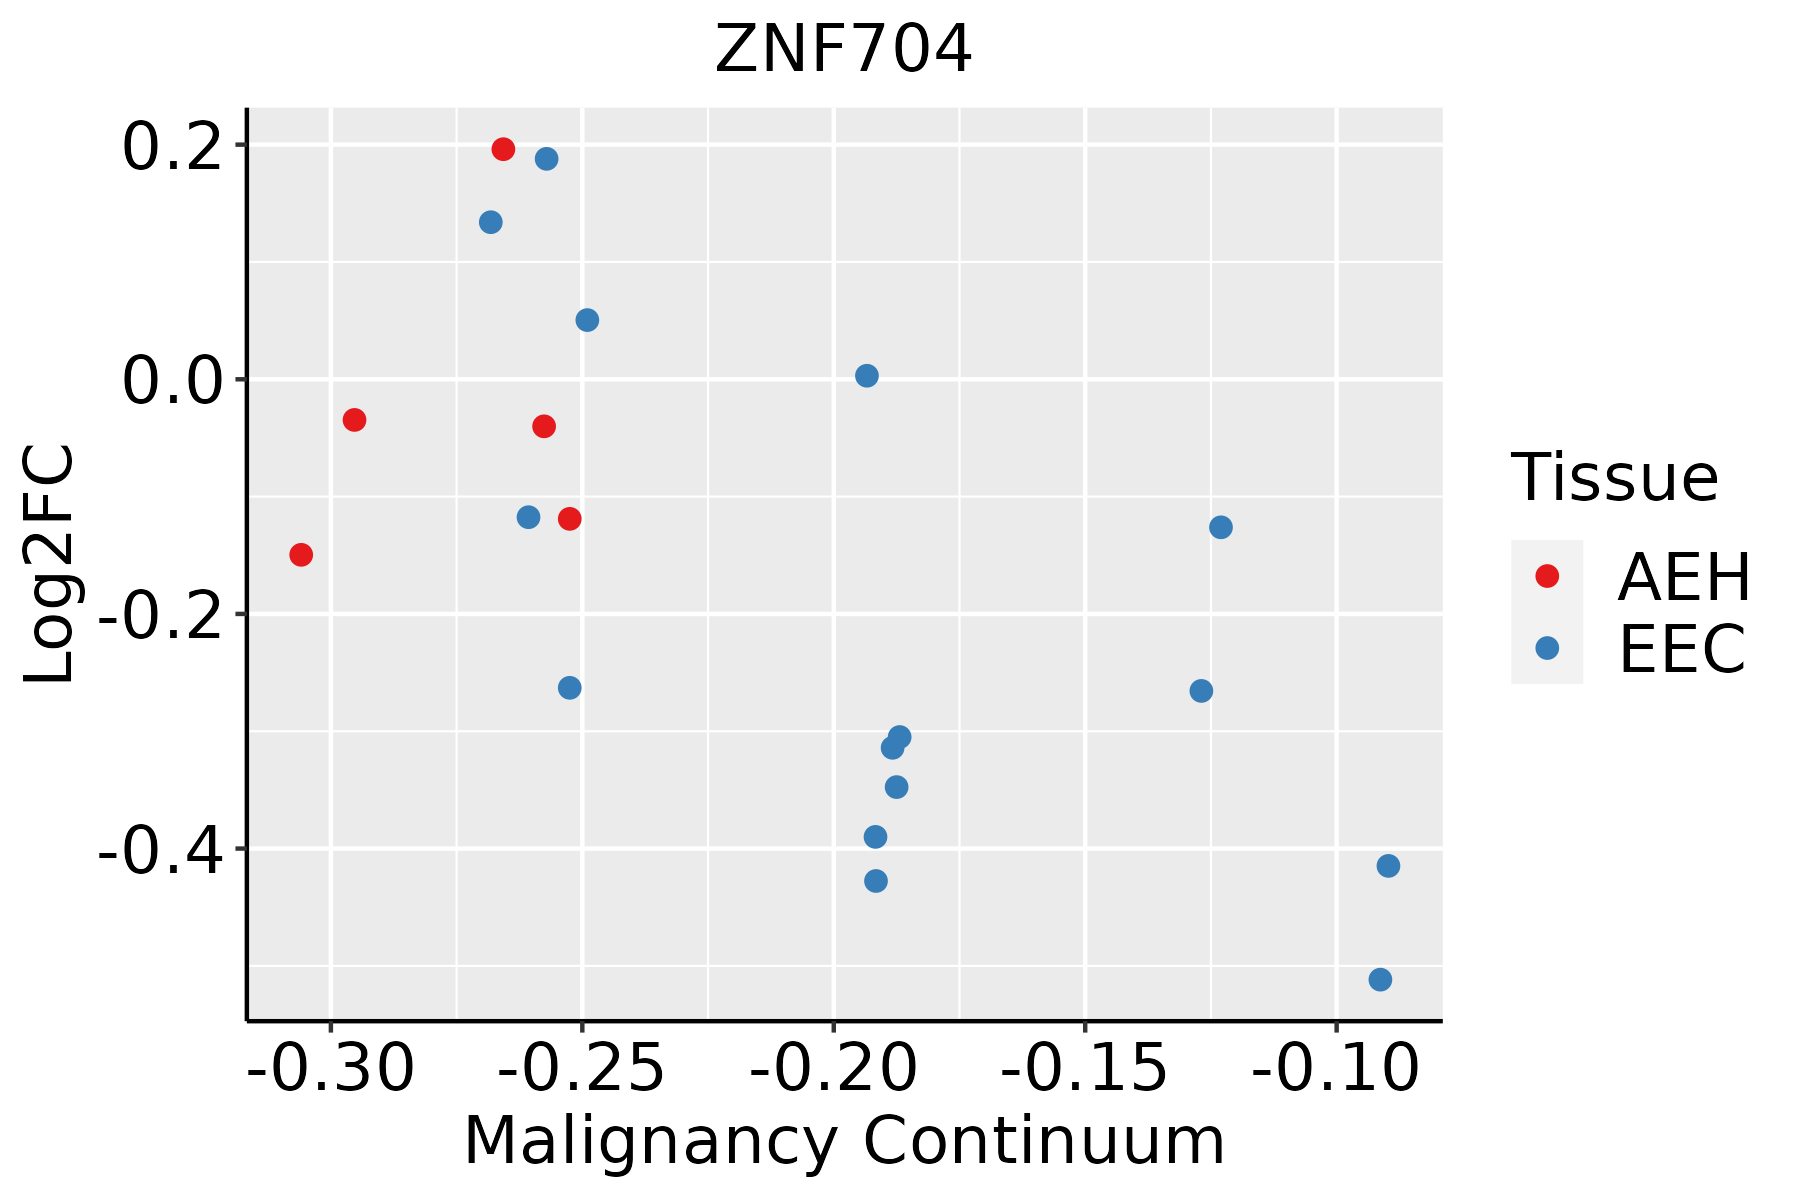 | AEH: Atypical endometrial hyperplasia |
| EEC: Endometrioid Cancer | ||
| Liver |  | HCC: Hepatocellular carcinoma |
| NAFLD: Non-alcoholic fatty liver disease | ||
| Lung | 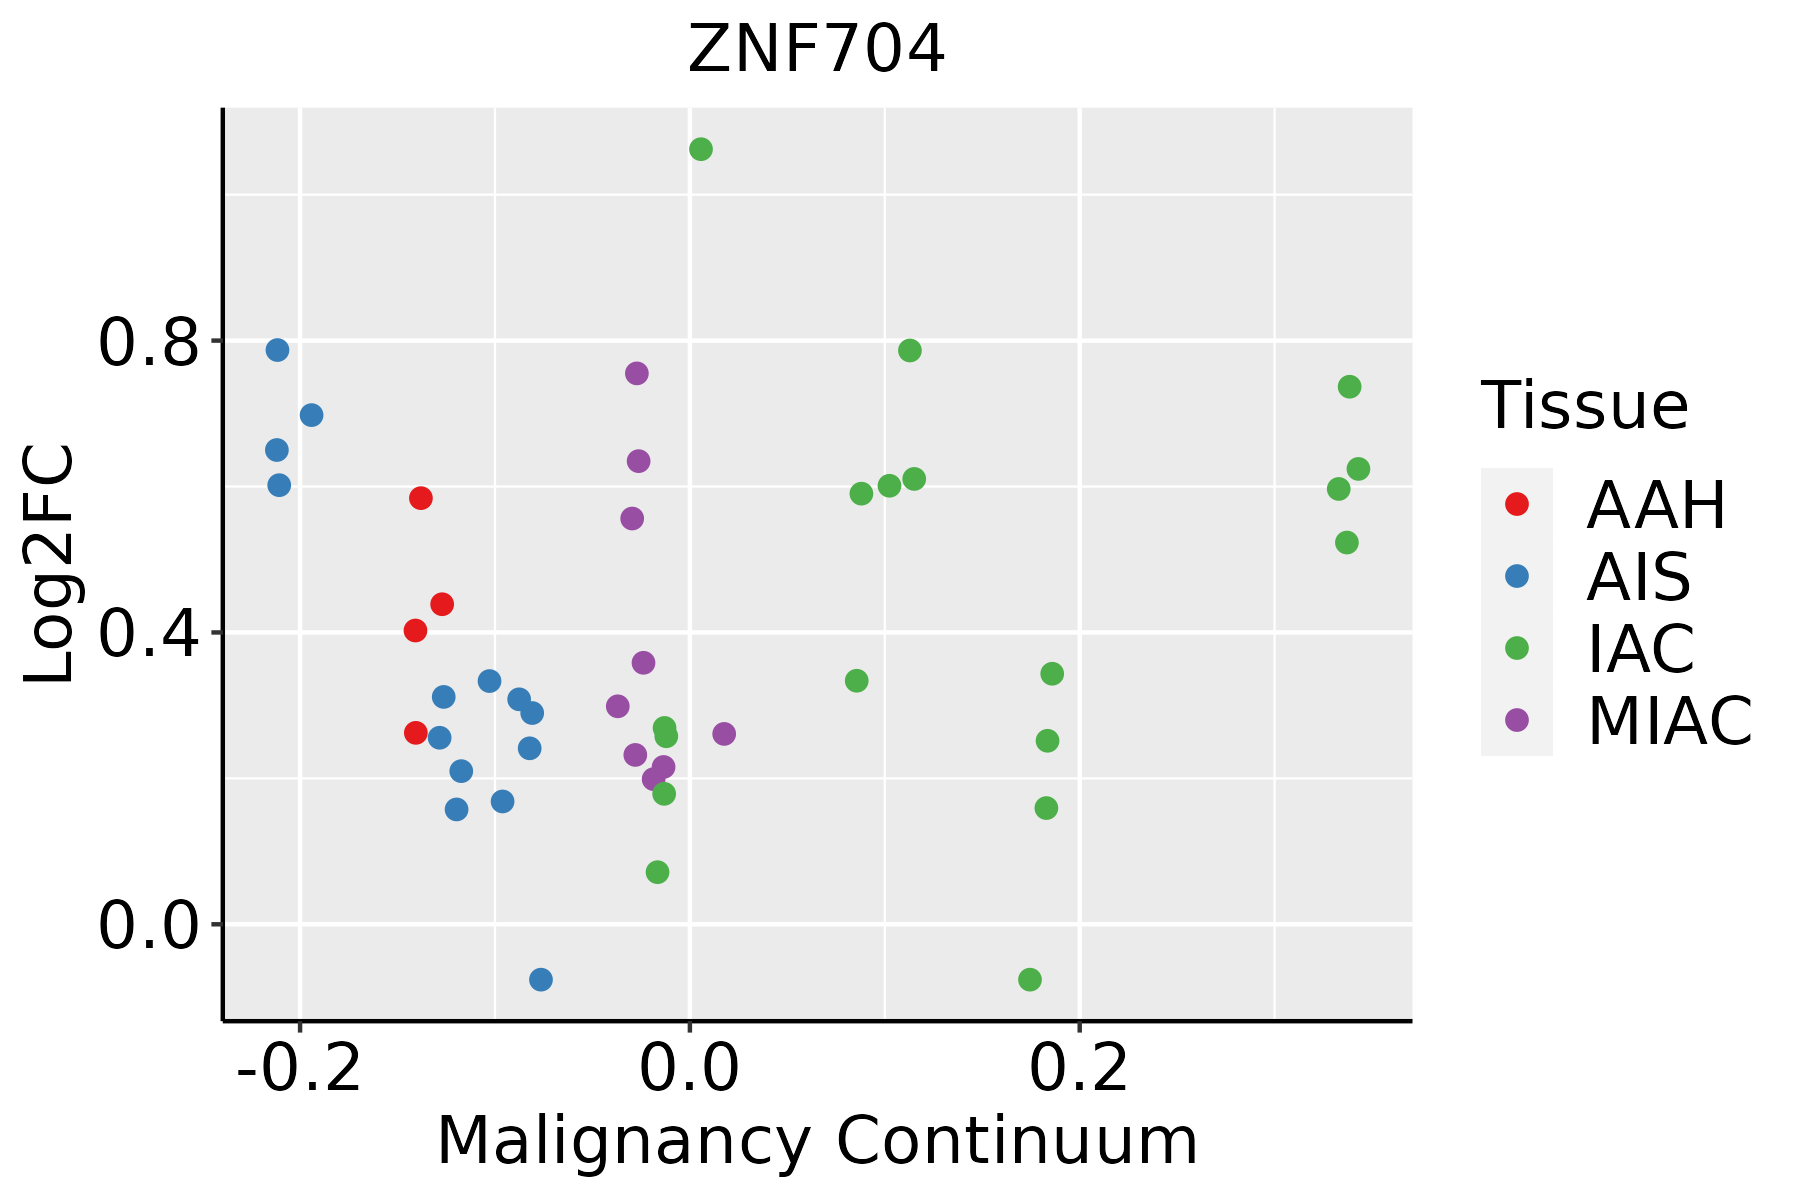 | AAH: Atypical adenomatous hyperplasia |
| AIS: Adenocarcinoma in situ | ||
| IAC: Invasive lung adenocarcinoma | ||
| MIA: Minimally invasive adenocarcinoma | ||
| Prostate | 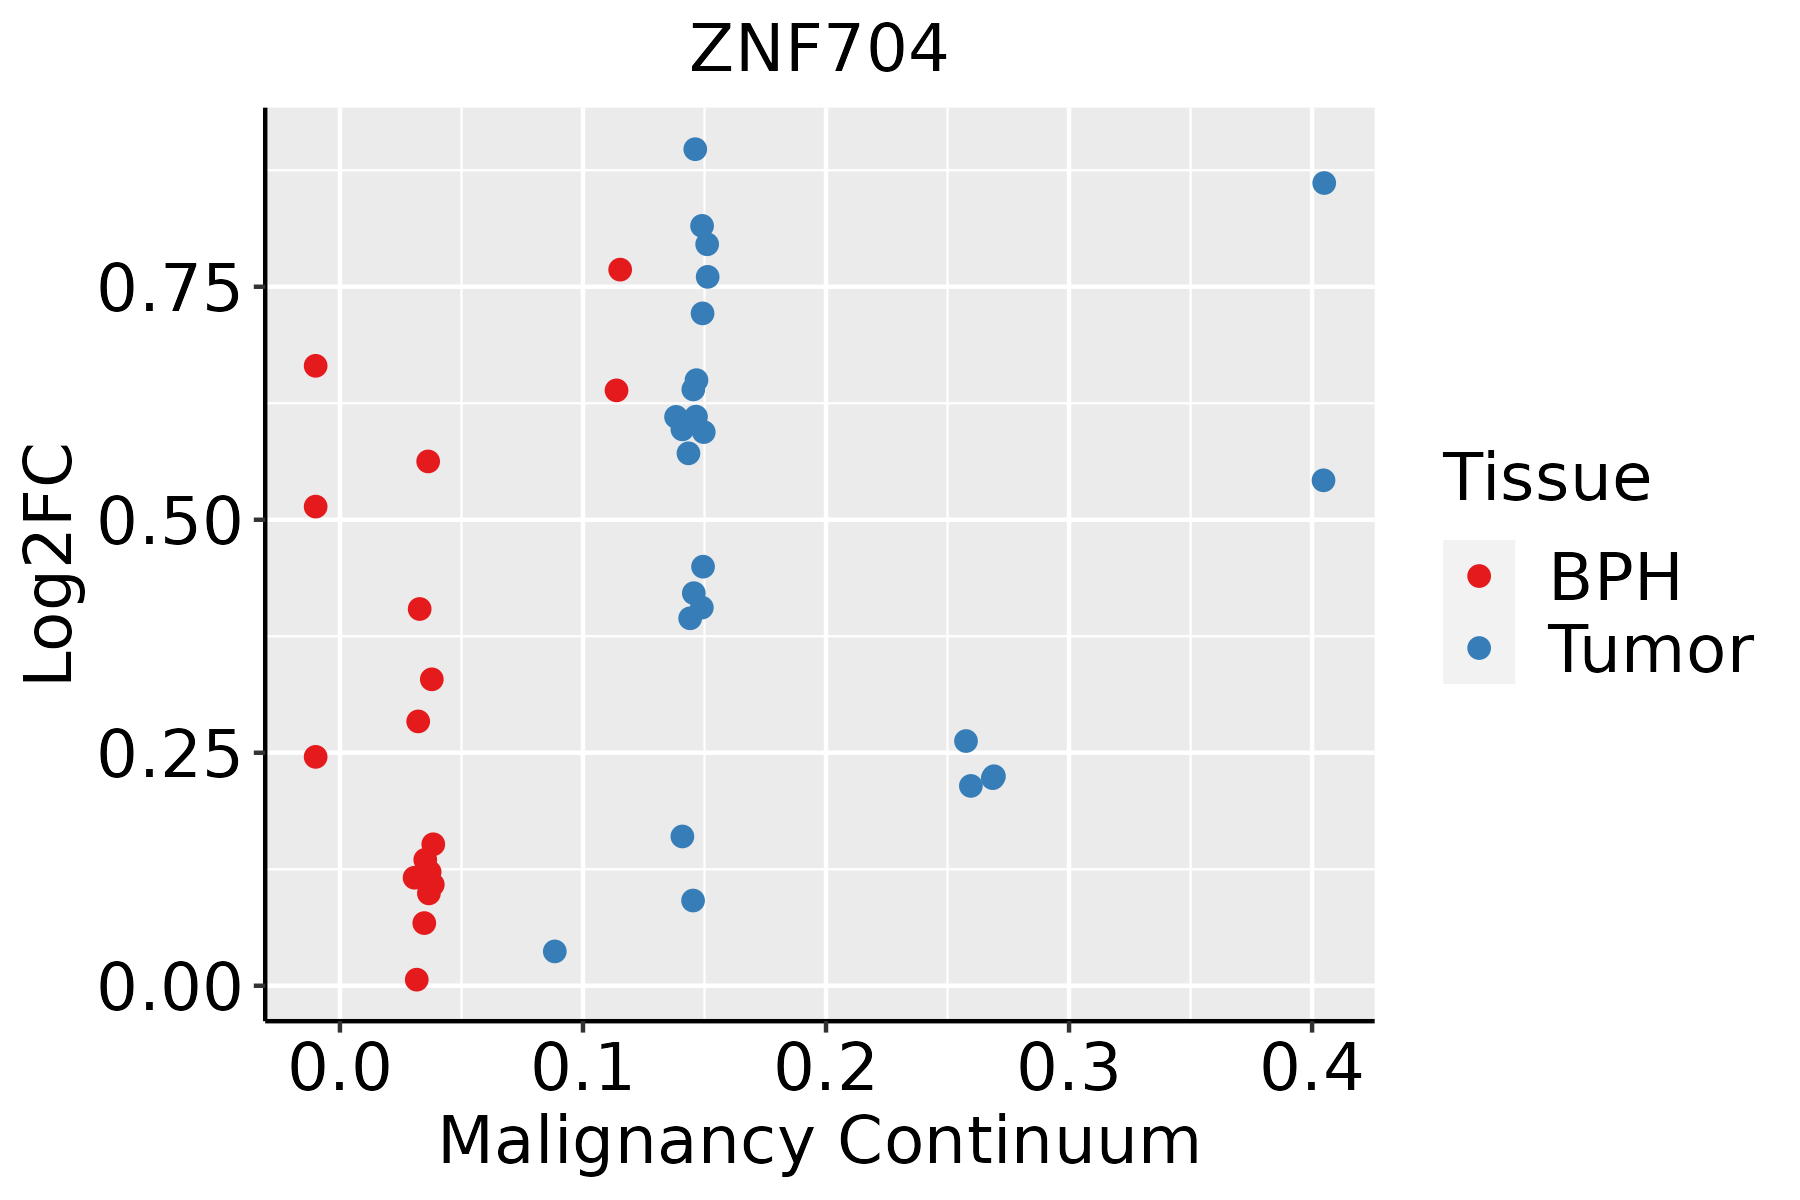 | BPH: Benign Prostatic Hyperplasia |
| Thyroid | 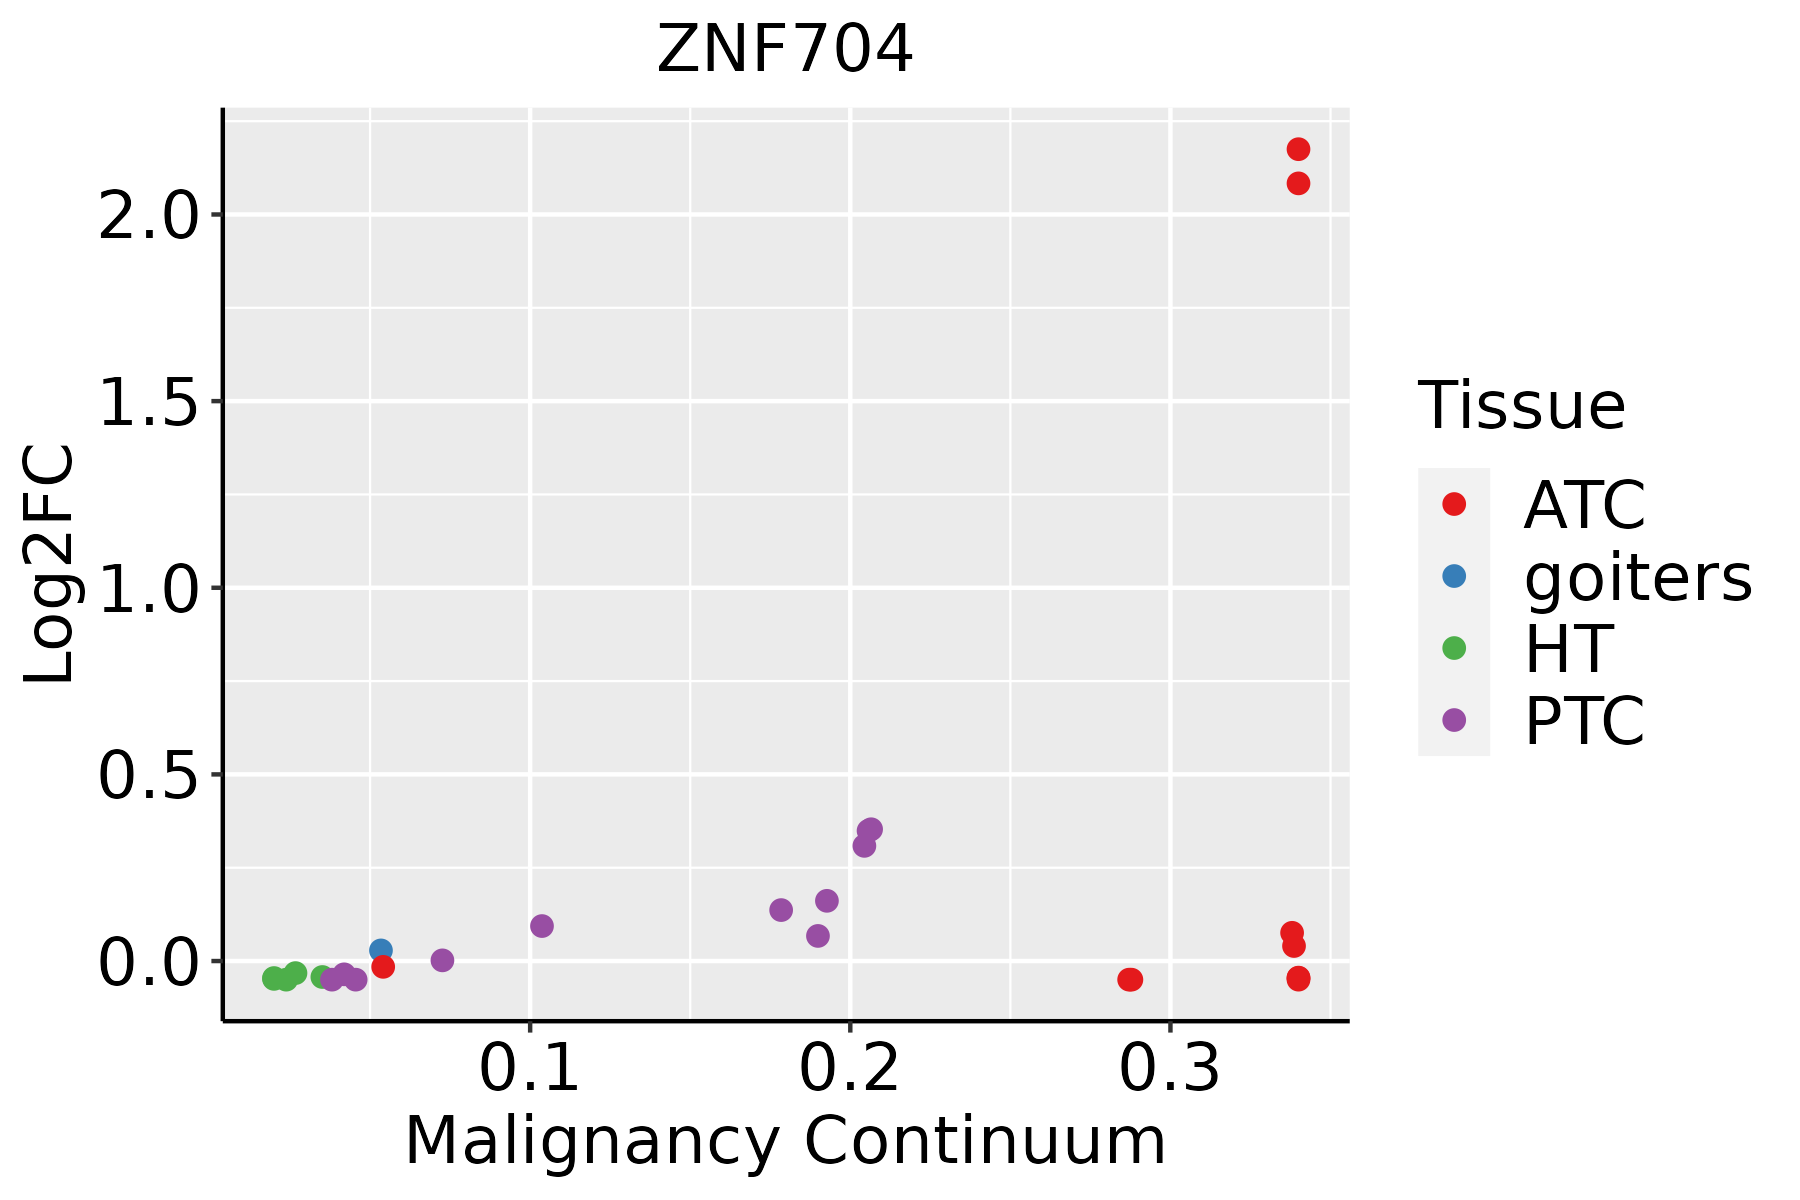 | ATC: Anaplastic thyroid cancer |
| HT: Hashimoto's thyroiditis | ||
| PTC: Papillary thyroid cancer |
| ∗log2FC in expression of this searched gene in stem-like cells from each diseased tissue sample relative to stem-like cells in normal samples in each tissue plotted against the malignancy continuum. Samples are colored based on if they are from different disease stage. |
Top |
Malignant transformation related pathway analysis |
| Find out the enriched GO biological processes and KEGG pathways involved in transition from healthy to precancer to cancer |
| Tissue | Disease Stage | Enriched GO biological Processes |
| Colorectum | AD |  |
| Colorectum | SER |  |
| Colorectum | MSS |  |
| Colorectum | MSI-H |  |
| Colorectum | FAP |  |
| ∗Top 15 enriched GO BP terms are showed in the bar plot of each disease state in each tissue. Each row represents a significant GO biological process which is colored according to the -log10(p.adjust). |
| Page: 1 2 3 4 5 6 7 8 9 |
| GO ID | Tissue | Disease Stage | Description | Gene Ratio | Bg Ratio | pvalue | p.adjust | Count |
| Page: 1 |
| Pathway ID | Tissue | Disease Stage | Description | Gene Ratio | Bg Ratio | pvalue | p.adjust | qvalue | Count |
| Page: 1 |
Top |
Cell-cell communication analysis |
| Identification of potential cell-cell interactions between two cell types and their ligand-receptor pairs for different disease states |
| Ligand | Receptor | LRpair | Pathway | Tissue | Disease Stage |
| Page: 1 |
Top |
Single-cell gene regulatory network inference analysis |
| Find out the significant the regulons (TFs) and the target genes of each regulon across cell types for different disease states |
| TF | Cell Type | Tissue | Disease Stage | Target Gene | RSS | Regulon Activity |
| ZNF704 | MAST | Pancreas | Healthy | FER,AGAP1,SLC24A3, etc. | 7.79e-02 |  |
| ZNF704 | MAST | Prostate | Healthy | IL18R1,SLC24A3,NUTM2A-AS1, etc. | 3.76e-01 |  |
| ZNF704 | MAST | Skin | ADJ | GATA2,LTC4S,TPSAB1, etc. | 3.29e-01 |  |
| ∗The dot plots of a searched regulon are shown for all cell subpopulations in each disease state of each tissue based on the regulon specific score inferred using pySCENIC and by calculating the average expression. |
| Page: 1 |
Top |
Somatic mutation of malignant transformation related genes |
| Annotation of somatic variants for genes involved in malignant transformation |
| Hugo Symbol | Variant Class | Variant Classification | dbSNP RS | HGVSc | HGVSp | HGVSp Short | SWISSPROT | BIOTYPE | SIFT | PolyPhen | Tumor Sample Barcode | Tissue | Histology | Sex | Age | Stage | Therapy Types | Drugs | Outcome |
| ZNF704 | SNV | Missense_Mutation | rs752885224 | c.1157G>A | p.Arg386Gln | p.R386Q | Q6ZNC4 | protein_coding | deleterious(0) | probably_damaging(0.996) | TCGA-A7-A4SD-01 | Breast | breast invasive carcinoma | Female | <65 | I/II | Chemotherapy | taxotere | CR |
| ZNF704 | SNV | Missense_Mutation | novel | c.119N>T | p.Ala40Val | p.A40V | Q6ZNC4 | protein_coding | tolerated_low_confidence(1) | benign(0) | TCGA-AN-A046-01 | Breast | breast invasive carcinoma | Female | >=65 | I/II | Unknown | Unknown | SD |
| ZNF704 | insertion | Nonsense_Mutation | novel | c.733_734insAAATAAAATGTAAGCATTGGAAAGCTTTGGCA | p.Ser245Ter | p.S245* | Q6ZNC4 | protein_coding | TCGA-A8-A07R-01 | Breast | breast invasive carcinoma | Female | >=65 | III/IV | Ancillary | zoledronic | SD | ||
| ZNF704 | SNV | Missense_Mutation | c.1063N>A | p.Gly355Arg | p.G355R | Q6ZNC4 | protein_coding | tolerated(0.28) | probably_damaging(0.911) | TCGA-A6-3809-01 | Colorectum | colon adenocarcinoma | Female | >=65 | I/II | Unknown | Unknown | SD | |
| ZNF704 | SNV | Missense_Mutation | c.824N>A | p.Arg275Gln | p.R275Q | Q6ZNC4 | protein_coding | tolerated(0.34) | benign(0.014) | TCGA-AZ-4315-01 | Colorectum | colon adenocarcinoma | Male | <65 | I/II | Unknown | Unknown | SD | |
| ZNF704 | SNV | Missense_Mutation | c.1040N>T | p.Pro347Leu | p.P347L | Q6ZNC4 | protein_coding | tolerated(0.14) | probably_damaging(0.998) | TCGA-AZ-6601-01 | Colorectum | colon adenocarcinoma | Male | >=65 | I/II | Unknown | Unknown | PD | |
| ZNF704 | SNV | Missense_Mutation | novel | c.46N>C | p.Lys16Gln | p.K16Q | Q6ZNC4 | protein_coding | tolerated_low_confidence(0.52) | benign(0.005) | TCGA-CA-6717-01 | Colorectum | colon adenocarcinoma | Male | <65 | I/II | Chemotherapy | oxaliplatin | CR |
| ZNF704 | SNV | Missense_Mutation | rs139476385 | c.1052C>T | p.Pro351Leu | p.P351L | Q6ZNC4 | protein_coding | tolerated(0.06) | benign(0.001) | TCGA-CM-6161-01 | Colorectum | colon adenocarcinoma | Female | <65 | I/II | Unknown | Unknown | SD |
| ZNF704 | SNV | Missense_Mutation | rs752885224 | c.1157G>A | p.Arg386Gln | p.R386Q | Q6ZNC4 | protein_coding | deleterious(0) | probably_damaging(0.996) | TCGA-D5-6530-01 | Colorectum | colon adenocarcinoma | Male | <65 | I/II | Unknown | Unknown | SD |
| ZNF704 | SNV | Missense_Mutation | c.980N>A | p.Ser327Asn | p.S327N | Q6ZNC4 | protein_coding | tolerated(0.58) | benign(0.003) | TCGA-G4-6294-01 | Colorectum | colon adenocarcinoma | Male | >=65 | III/IV | Chemotherapy | fluorouracil | PD |
| Page: 1 2 3 4 5 6 |
Top |
Related drugs of malignant transformation related genes |
| Identification of chemicals and drugs interact with genes involved in malignant transfromation |
| (DGIdb 4.0) |
| Entrez ID | Symbol | Category | Interaction Types | Drug Claim Name | Drug Name | PMIDs |
| Page: 1 |

Copyright 2023-Present -The University of Texas Health Science Center at Houston |