
|
|||||
|
 | |
| |
| |
| |
| |
| |
|
Gene: ZNF69 |
Gene summary for ZNF69 |
| Gene information | Species | Human | Gene symbol | ZNF69 | Gene ID | 7620 |
| Gene name | zinc finger protein 69 | |
| Gene Alias | Cos5 | |
| Cytomap | 19p13.2 | |
| Gene Type | protein-coding | GO ID | GO:0000122 | UniProtAcc | Q9UC07 |
Top |
Malignant transformation analysis |
| Identification of the aberrant gene expression in precancerous and cancerous lesions by comparing the gene expression of stem-like cells in diseased tissues with normal stem cells |
| Entrez ID | Symbol | Replicates | Species | Organ | Tissue | Adj P-value | Log2FC | Malignancy |
| 7620 | ZNF69 | HTA11_866_3004761011 | Human | Colorectum | AD | 9.82e-04 | -1.48e-01 | 0.096 |
| 7620 | ZNF69 | A015-C-203 | Human | Colorectum | FAP | 6.72e-23 | 1.71e-01 | -0.1294 |
| 7620 | ZNF69 | A015-C-204 | Human | Colorectum | FAP | 1.35e-04 | 3.22e-01 | -0.0228 |
| 7620 | ZNF69 | A014-C-040 | Human | Colorectum | FAP | 5.23e-04 | 3.77e-01 | -0.1184 |
| 7620 | ZNF69 | A002-C-201 | Human | Colorectum | FAP | 2.67e-07 | 1.44e-01 | 0.0324 |
| 7620 | ZNF69 | A002-C-203 | Human | Colorectum | FAP | 1.65e-02 | 1.83e-01 | 0.2786 |
| 7620 | ZNF69 | A001-C-119 | Human | Colorectum | FAP | 3.44e-06 | 3.71e-01 | -0.1557 |
| 7620 | ZNF69 | A001-C-108 | Human | Colorectum | FAP | 2.76e-28 | 6.08e-01 | -0.0272 |
| 7620 | ZNF69 | A002-C-021 | Human | Colorectum | FAP | 3.85e-09 | 4.81e-01 | 0.1171 |
| 7620 | ZNF69 | A002-C-205 | Human | Colorectum | FAP | 7.32e-19 | 2.57e-01 | -0.1236 |
| 7620 | ZNF69 | A001-C-104 | Human | Colorectum | FAP | 2.15e-13 | 5.01e-01 | 0.0184 |
| 7620 | ZNF69 | A015-C-005 | Human | Colorectum | FAP | 1.51e-07 | 4.73e-01 | -0.0336 |
| 7620 | ZNF69 | A015-C-006 | Human | Colorectum | FAP | 8.80e-08 | -1.33e-01 | -0.0994 |
| 7620 | ZNF69 | A015-C-106 | Human | Colorectum | FAP | 1.17e-13 | 3.50e-01 | -0.0511 |
| 7620 | ZNF69 | A002-C-114 | Human | Colorectum | FAP | 1.25e-16 | 3.60e-01 | -0.1561 |
| 7620 | ZNF69 | A015-C-104 | Human | Colorectum | FAP | 1.61e-31 | 4.12e-01 | -0.1899 |
| 7620 | ZNF69 | A015-C-202 | Human | Colorectum | FAP | 1.64e-07 | 4.16e-01 | -0.0849 |
| 7620 | ZNF69 | A001-C-014 | Human | Colorectum | FAP | 9.77e-14 | 3.37e-01 | 0.0135 |
| 7620 | ZNF69 | A002-C-016 | Human | Colorectum | FAP | 7.11e-17 | 1.57e-01 | 0.0521 |
| 7620 | ZNF69 | A015-C-002 | Human | Colorectum | FAP | 8.98e-08 | 1.75e-01 | -0.0763 |
| Page: 1 2 |
| Tissue | Expression Dynamics | Abbreviation |
| Colorectum (GSE201348) |  | FAP: Familial adenomatous polyposis |
| CRC: Colorectal cancer | ||
| Colorectum (HTA11) |  | AD: Adenomas |
| SER: Sessile serrated lesions | ||
| MSI-H: Microsatellite-high colorectal cancer | ||
| MSS: Microsatellite stable colorectal cancer | ||
| Lung | 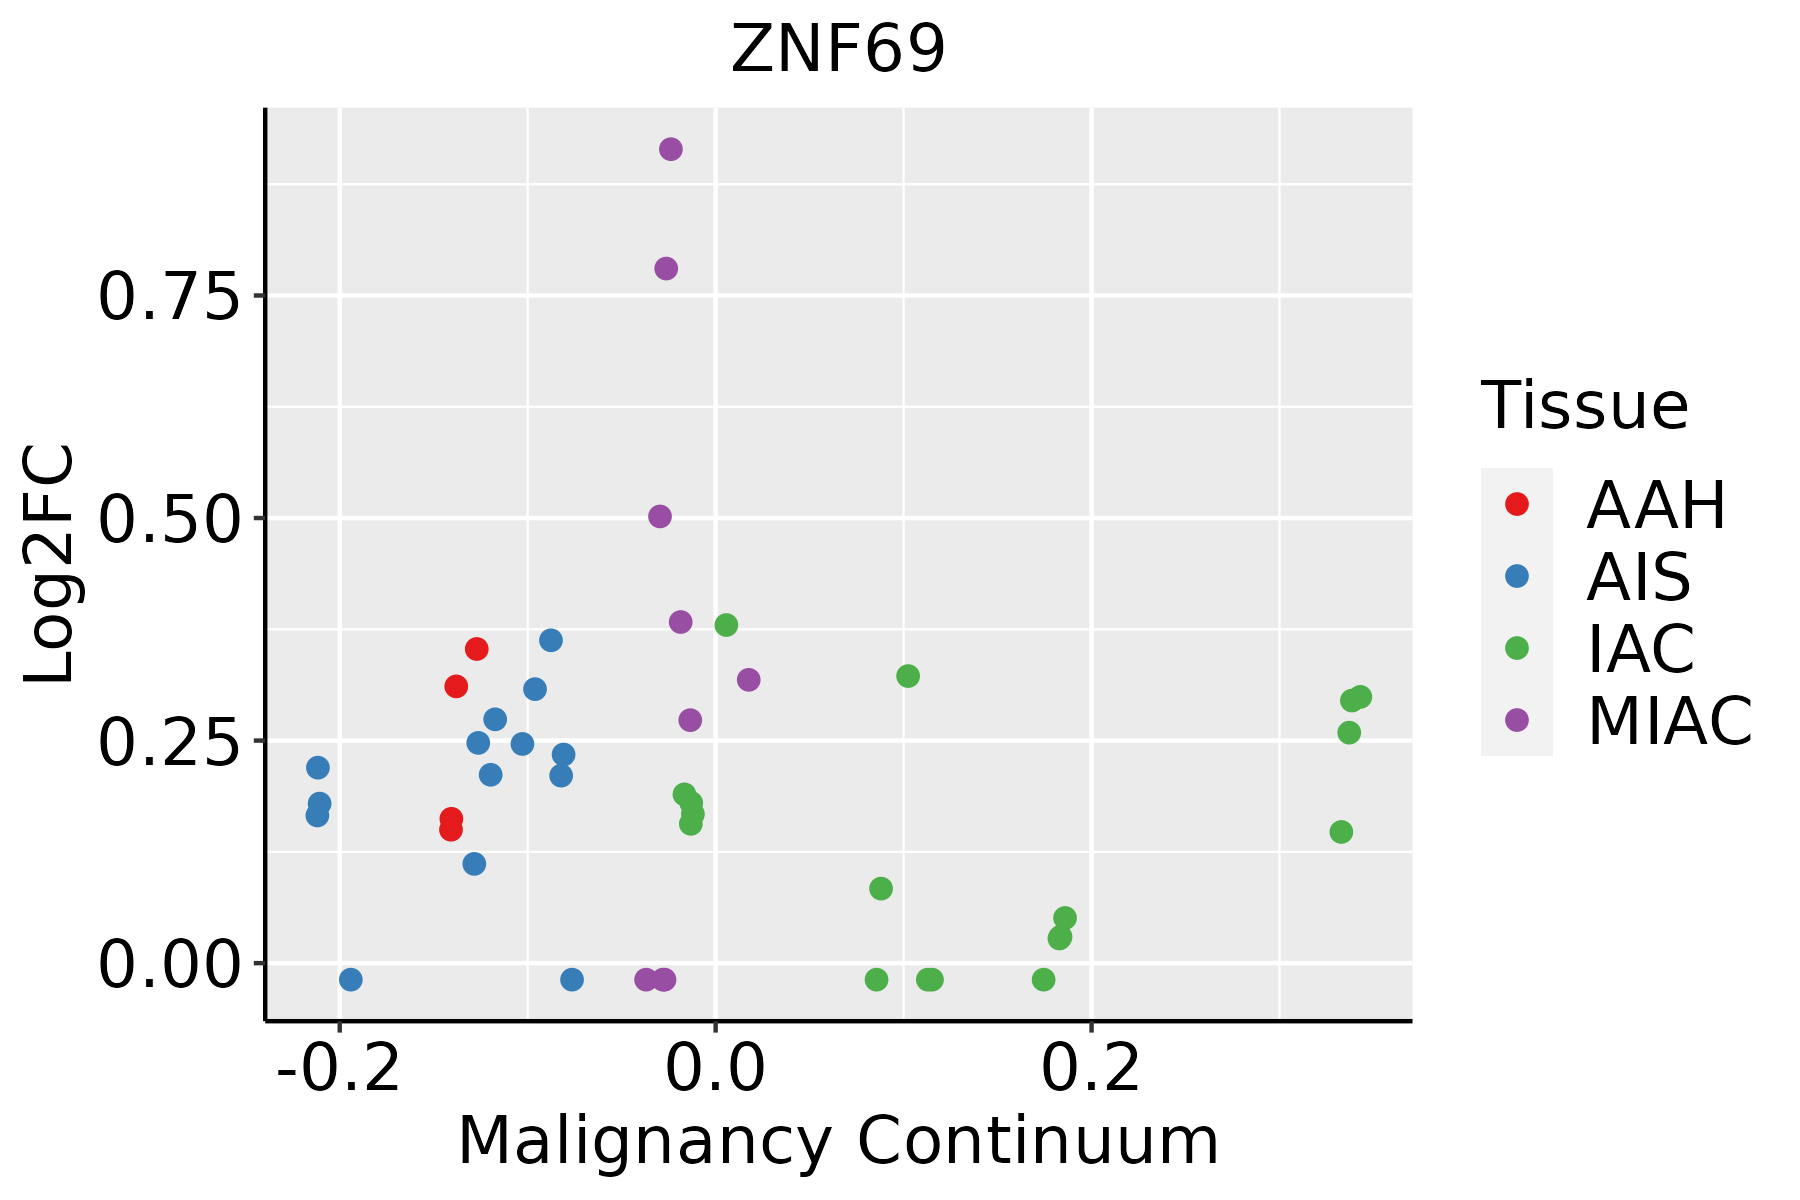 | AAH: Atypical adenomatous hyperplasia |
| AIS: Adenocarcinoma in situ | ||
| IAC: Invasive lung adenocarcinoma | ||
| MIA: Minimally invasive adenocarcinoma |
| ∗log2FC in expression of this searched gene in stem-like cells from each diseased tissue sample relative to stem-like cells in normal samples in each tissue plotted against the malignancy continuum. Samples are colored based on if they are from different disease stage. |
Top |
Malignant transformation related pathway analysis |
| Find out the enriched GO biological processes and KEGG pathways involved in transition from healthy to precancer to cancer |
| Tissue | Disease Stage | Enriched GO biological Processes |
| Colorectum | AD |  |
| Colorectum | SER |  |
| Colorectum | MSS |  |
| Colorectum | MSI-H |  |
| Colorectum | FAP |  |
| ∗Top 15 enriched GO BP terms are showed in the bar plot of each disease state in each tissue. Each row represents a significant GO biological process which is colored according to the -log10(p.adjust). |
| Page: 1 2 3 4 5 6 7 8 9 |
| GO ID | Tissue | Disease Stage | Description | Gene Ratio | Bg Ratio | pvalue | p.adjust | Count |
| GO:00059969 | Esophagus | ESCC | monosaccharide metabolic process | 159/8552 | 257/18723 | 1.11e-07 | 1.81e-06 | 159 |
| GO:00193189 | Esophagus | ESCC | hexose metabolic process | 147/8552 | 237/18723 | 2.63e-07 | 3.94e-06 | 147 |
| GO:00060069 | Esophagus | ESCC | glucose metabolic process | 119/8552 | 196/18723 | 1.51e-05 | 1.36e-04 | 119 |
| GO:00442626 | Esophagus | ESCC | cellular carbohydrate metabolic process | 160/8552 | 283/18723 | 1.43e-04 | 9.66e-04 | 160 |
| GO:00160514 | Esophagus | ESCC | carbohydrate biosynthetic process | 117/8552 | 202/18723 | 2.96e-04 | 1.79e-03 | 117 |
| GO:00620129 | Esophagus | ESCC | regulation of small molecule metabolic process | 184/8552 | 334/18723 | 3.11e-04 | 1.85e-03 | 184 |
| GO:00463643 | Esophagus | ESCC | monosaccharide biosynthetic process | 52/8552 | 82/18723 | 9.03e-04 | 4.61e-03 | 52 |
| GO:00109065 | Esophagus | ESCC | regulation of glucose metabolic process | 71/8552 | 119/18723 | 1.46e-03 | 6.92e-03 | 71 |
| GO:00193193 | Esophagus | ESCC | hexose biosynthetic process | 49/8552 | 78/18723 | 1.69e-03 | 7.81e-03 | 49 |
| GO:00061096 | Esophagus | ESCC | regulation of carbohydrate metabolic process | 101/8552 | 178/18723 | 1.89e-03 | 8.52e-03 | 101 |
| GO:00106755 | Esophagus | ESCC | regulation of cellular carbohydrate metabolic process | 83/8552 | 146/18723 | 4.24e-03 | 1.69e-02 | 83 |
| GO:00060943 | Esophagus | ESCC | gluconeogenesis | 46/8552 | 75/18723 | 4.54e-03 | 1.78e-02 | 46 |
| Page: 1 |
| Pathway ID | Tissue | Disease Stage | Description | Gene Ratio | Bg Ratio | pvalue | p.adjust | qvalue | Count |
| Page: 1 |
Top |
Cell-cell communication analysis |
| Identification of potential cell-cell interactions between two cell types and their ligand-receptor pairs for different disease states |
| Ligand | Receptor | LRpair | Pathway | Tissue | Disease Stage |
| Page: 1 |
Top |
Single-cell gene regulatory network inference analysis |
| Find out the significant the regulons (TFs) and the target genes of each regulon across cell types for different disease states |
| TF | Cell Type | Tissue | Disease Stage | Target Gene | RSS | Regulon Activity |
| ZNF69 | PERI | Stomach | CAG with IM | AC012447.1,ZMAT4,DLGAP4, etc. | 7.50e-02 |  |
| ∗The dot plots of a searched regulon are shown for all cell subpopulations in each disease state of each tissue based on the regulon specific score inferred using pySCENIC and by calculating the average expression. |
| Page: 1 |
Top |
Somatic mutation of malignant transformation related genes |
| Annotation of somatic variants for genes involved in malignant transformation |
| Hugo Symbol | Variant Class | Variant Classification | dbSNP RS | HGVSc | HGVSp | HGVSp Short | SWISSPROT | BIOTYPE | SIFT | PolyPhen | Tumor Sample Barcode | Tissue | Histology | Sex | Age | Stage | Therapy Types | Drugs | Outcome |
| ZNF69 | SNV | Missense_Mutation | c.247N>A | p.Asp83Asn | p.D83N | Q9UC07 | protein_coding | tolerated(0.13) | benign(0.001) | TCGA-BH-A0HF-01 | Breast | breast invasive carcinoma | Female | >=65 | I/II | Hormone Therapy | arimidex | SD | |
| ZNF69 | insertion | Nonsense_Mutation | novel | c.282_283insACCTAGGCTGTGGGCTCACTCCT | p.Asp95ThrfsTer2 | p.D95Tfs*2 | Q9UC07 | protein_coding | TCGA-A8-A06P-01 | Breast | breast invasive carcinoma | Female | <65 | III/IV | Unspecific | SD | |||
| ZNF69 | SNV | Missense_Mutation | novel | c.445N>T | p.Pro149Ser | p.P149S | Q9UC07 | protein_coding | deleterious(0) | probably_damaging(0.962) | TCGA-VS-A959-01 | Cervix | cervical & endocervical cancer | Female | >=65 | I/II | Unknown | Unknown | SD |
| ZNF69 | SNV | Missense_Mutation | novel | c.190N>C | p.Asn64His | p.N64H | Q9UC07 | protein_coding | tolerated(0.06) | benign(0.049) | TCGA-AZ-4315-01 | Colorectum | colon adenocarcinoma | Male | <65 | I/II | Unknown | Unknown | SD |
| ZNF69 | SNV | Missense_Mutation | novel | c.131G>T | p.Arg44Met | p.R44M | Q9UC07 | protein_coding | deleterious(0.01) | possibly_damaging(0.908) | TCGA-A5-A0G2-01 | Endometrium | uterine corpus endometrioid carcinoma | Female | <65 | III/IV | Unknown | Unknown | SD |
| ZNF69 | SNV | Missense_Mutation | novel | c.23N>T | p.Arg8Met | p.R8M | Q9UC07 | protein_coding | deleterious_low_confidence(0.02) | benign(0.029) | TCGA-EY-A1GU-01 | Endometrium | uterine corpus endometrioid carcinoma | Female | >=65 | I/II | Unknown | Unknown | SD |
| ZNF69 | insertion | Frame_Shift_Ins | novel | c.447_448insTAACTATTATTTAAAAAAC | p.Ter150%3D | p.*150%3D | Q9UC07 | protein_coding | TCGA-A5-A0R8-01 | Endometrium | uterine corpus endometrioid carcinoma | Female | >=65 | I/II | Unknown | Unknown | PD | ||
| ZNF69 | SNV | Missense_Mutation | c.132N>C | p.Arg44Ser | p.R44S | Q9UC07 | protein_coding | deleterious(0.01) | benign(0.426) | TCGA-DD-A113-01 | Liver | liver hepatocellular carcinoma | Female | <65 | I/II | Unknown | Unknown | PD | |
| ZNF69 | SNV | Missense_Mutation | c.293T>C | p.Leu98Pro | p.L98P | Q9UC07 | protein_coding | deleterious(0.02) | probably_damaging(0.993) | TCGA-ED-A7PY-01 | Liver | liver hepatocellular carcinoma | Female | <65 | I/II | Unknown | Unknown | SD | |
| ZNF69 | SNV | Missense_Mutation | c.156N>G | p.Ser52Arg | p.S52R | Q9UC07 | protein_coding | deleterious(0.04) | benign(0) | TCGA-58-8391-01 | Lung | lung squamous cell carcinoma | Female | <65 | III/IV | Chemotherapy | carboplatin | PD |
| Page: 1 2 |
Top |
Related drugs of malignant transformation related genes |
| Identification of chemicals and drugs interact with genes involved in malignant transfromation |
| (DGIdb 4.0) |
| Entrez ID | Symbol | Category | Interaction Types | Drug Claim Name | Drug Name | PMIDs |
| Page: 1 |

Copyright 2023-Present -The University of Texas Health Science Center at Houston |