
|
|||||
|
 | |
| |
| |
| |
| |
| |
|
Gene: ZNF655 |
Gene summary for ZNF655 |
| Gene information | Species | Human | Gene symbol | ZNF655 | Gene ID | 79027 |
| Gene name | zinc finger protein 655 | |
| Gene Alias | VIK | |
| Cytomap | 7q22.1 | |
| Gene Type | protein-coding | GO ID | GO:0000082 | UniProtAcc | Q8N720 |
Top |
Malignant transformation analysis |
| Identification of the aberrant gene expression in precancerous and cancerous lesions by comparing the gene expression of stem-like cells in diseased tissues with normal stem cells |
| Entrez ID | Symbol | Replicates | Species | Organ | Tissue | Adj P-value | Log2FC | Malignancy |
| 79027 | ZNF655 | HTA11_2487_2000001011 | Human | Colorectum | SER | 7.90e-11 | 2.75e-01 | -0.1808 |
| 79027 | ZNF655 | HTA11_1938_2000001011 | Human | Colorectum | AD | 5.27e-05 | 1.86e-01 | -0.0811 |
| 79027 | ZNF655 | HTA11_78_2000001011 | Human | Colorectum | AD | 2.58e-08 | 2.34e-01 | -0.1088 |
| 79027 | ZNF655 | HTA11_347_2000001011 | Human | Colorectum | AD | 3.41e-19 | 3.76e-01 | -0.1954 |
| 79027 | ZNF655 | HTA11_411_2000001011 | Human | Colorectum | SER | 7.44e-09 | 5.38e-01 | -0.2602 |
| 79027 | ZNF655 | HTA11_3361_2000001011 | Human | Colorectum | AD | 1.91e-05 | 2.24e-01 | -0.1207 |
| 79027 | ZNF655 | HTA11_83_2000001011 | Human | Colorectum | SER | 1.79e-04 | 2.31e-01 | -0.1526 |
| 79027 | ZNF655 | HTA11_696_2000001011 | Human | Colorectum | AD | 1.73e-12 | 2.39e-01 | -0.1464 |
| 79027 | ZNF655 | HTA11_866_2000001011 | Human | Colorectum | AD | 2.03e-09 | 2.24e-01 | -0.1001 |
| 79027 | ZNF655 | HTA11_1391_2000001011 | Human | Colorectum | AD | 5.08e-04 | 1.43e-01 | -0.059 |
| 79027 | ZNF655 | HTA11_2992_2000001011 | Human | Colorectum | SER | 1.94e-06 | 3.10e-01 | -0.1706 |
| 79027 | ZNF655 | HTA11_5212_2000001011 | Human | Colorectum | AD | 6.52e-06 | 3.22e-01 | -0.2061 |
| 79027 | ZNF655 | HTA11_546_2000001011 | Human | Colorectum | AD | 2.65e-04 | 2.45e-01 | -0.0842 |
| 79027 | ZNF655 | HTA11_7862_2000001011 | Human | Colorectum | AD | 3.08e-04 | 2.34e-01 | -0.0179 |
| 79027 | ZNF655 | HTA11_866_3004761011 | Human | Colorectum | AD | 2.51e-02 | 9.43e-02 | 0.096 |
| 79027 | ZNF655 | HTA11_8622_2000001021 | Human | Colorectum | SER | 3.19e-02 | 1.62e-01 | 0.0528 |
| 79027 | ZNF655 | HTA11_10623_2000001011 | Human | Colorectum | AD | 4.46e-06 | 2.63e-01 | -0.0177 |
| 79027 | ZNF655 | HTA11_6801_2000001011 | Human | Colorectum | SER | 2.21e-02 | 2.69e-01 | 0.0171 |
| 79027 | ZNF655 | HTA11_10711_2000001011 | Human | Colorectum | AD | 6.02e-03 | 1.25e-01 | 0.0338 |
| 79027 | ZNF655 | HTA11_7696_3000711011 | Human | Colorectum | AD | 1.71e-02 | 9.90e-02 | 0.0674 |
| Page: 1 2 3 4 5 6 7 8 |
| Tissue | Expression Dynamics | Abbreviation |
| Colorectum (GSE201348) |  | FAP: Familial adenomatous polyposis |
| CRC: Colorectal cancer | ||
| Colorectum (HTA11) |  | AD: Adenomas |
| SER: Sessile serrated lesions | ||
| MSI-H: Microsatellite-high colorectal cancer | ||
| MSS: Microsatellite stable colorectal cancer | ||
| Esophagus | 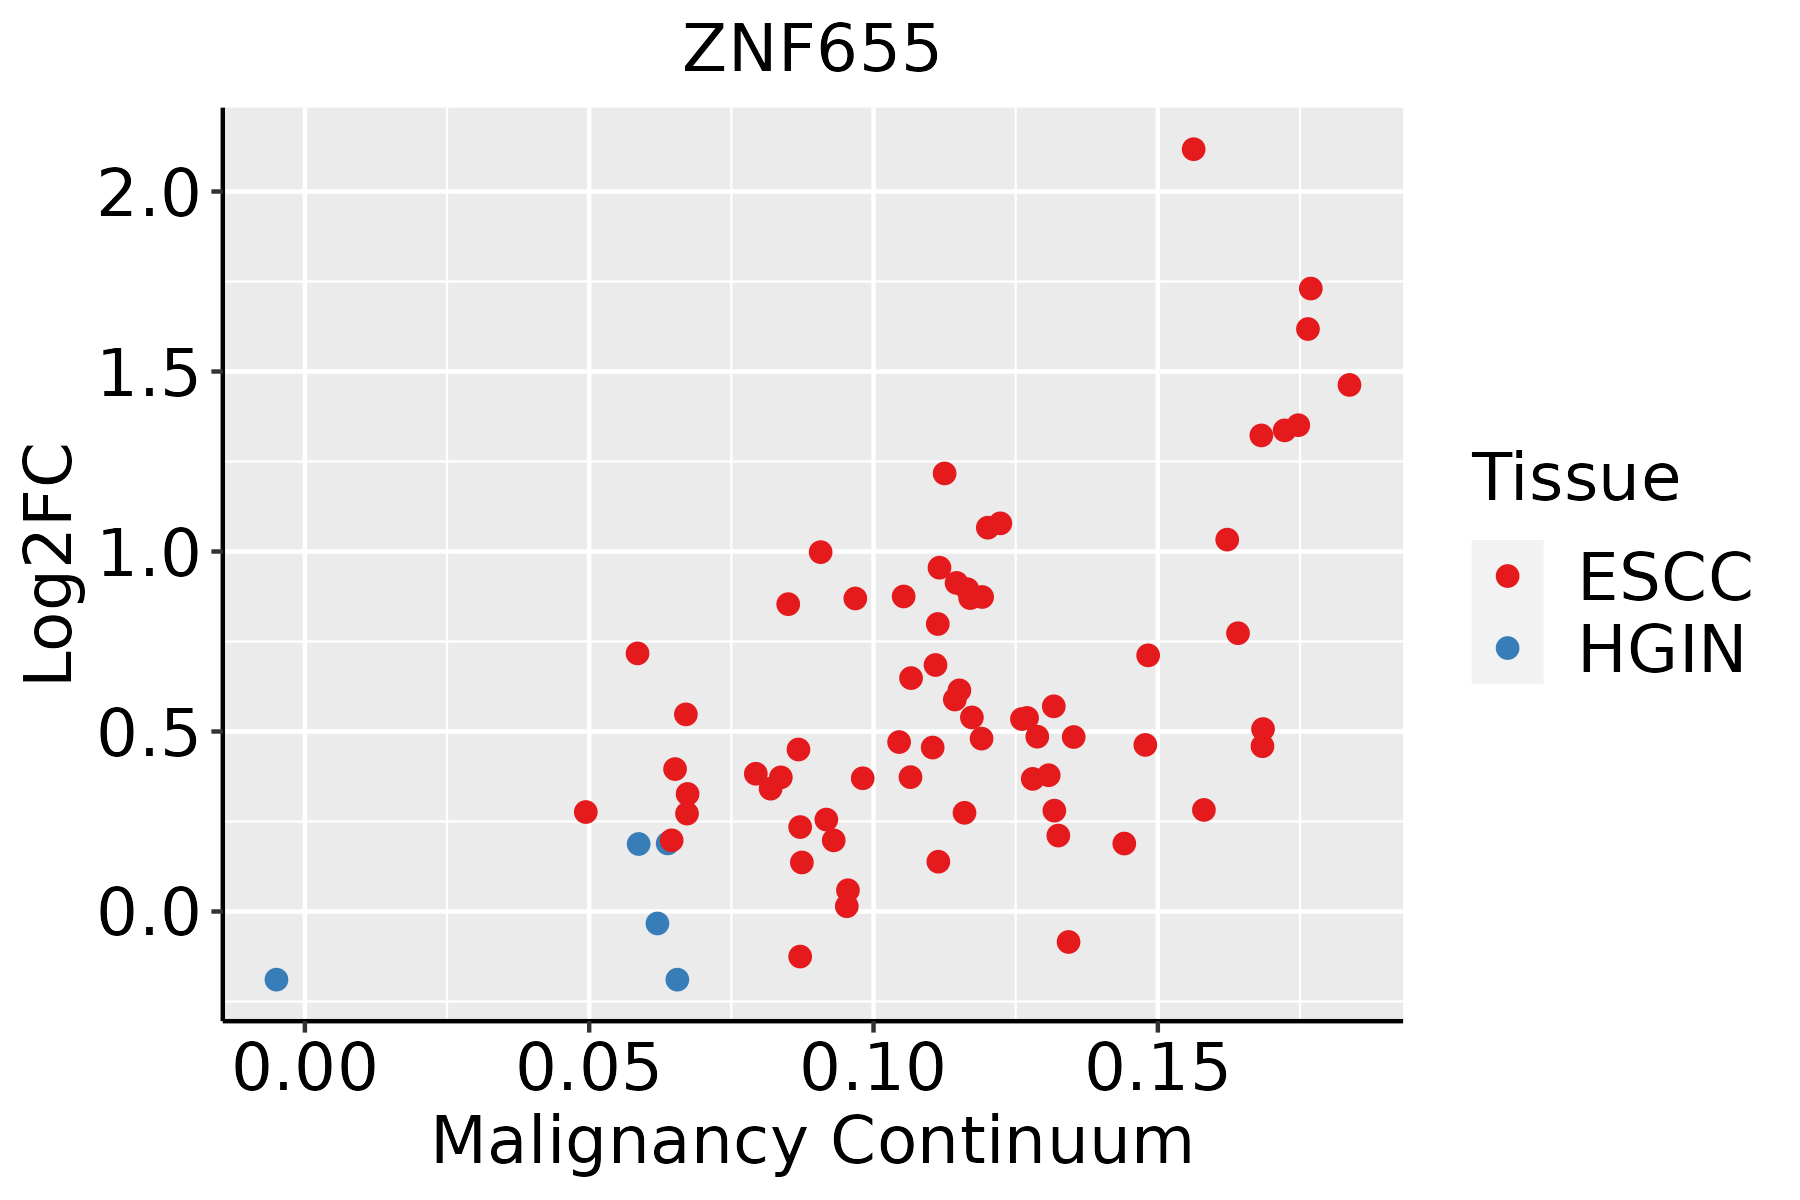 | ESCC: Esophageal squamous cell carcinoma |
| HGIN: High-grade intraepithelial neoplasias | ||
| LGIN: Low-grade intraepithelial neoplasias | ||
| Liver | 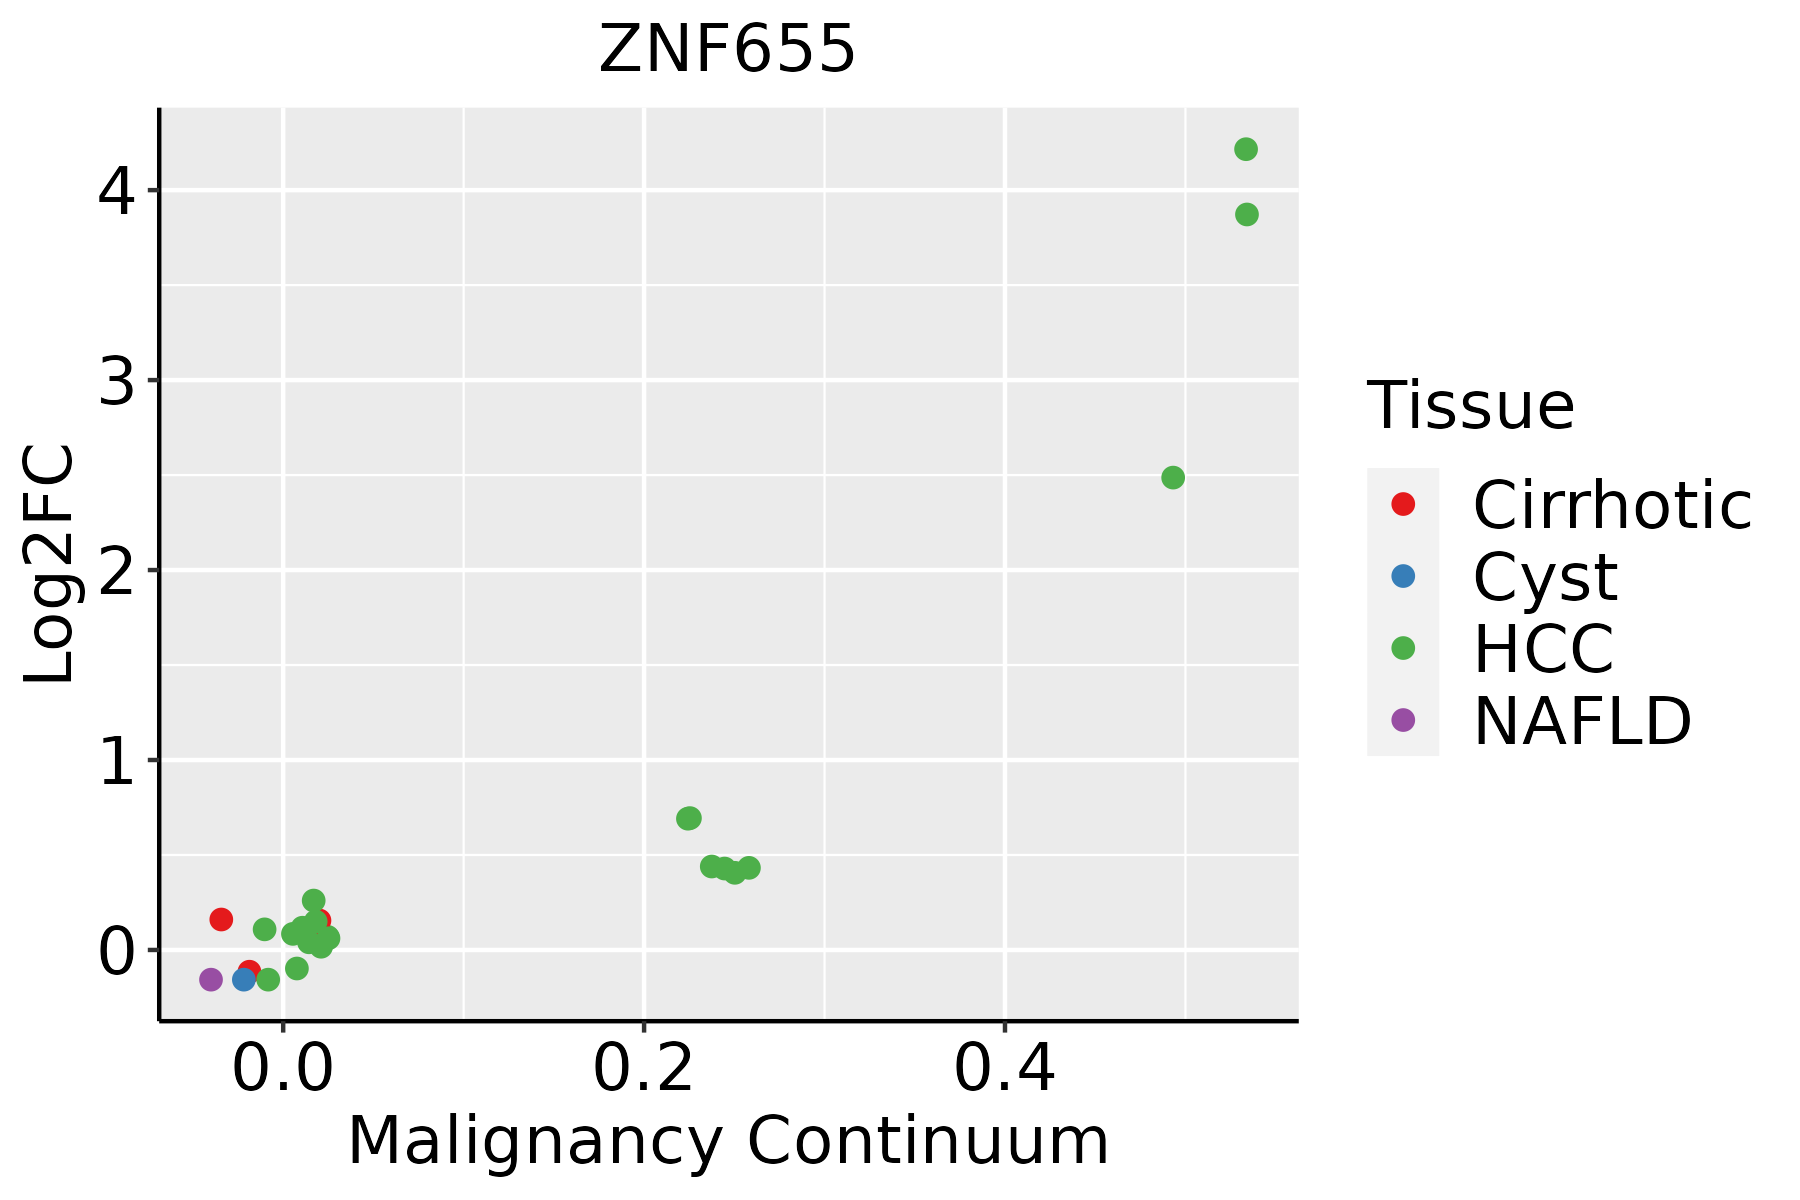 | HCC: Hepatocellular carcinoma |
| NAFLD: Non-alcoholic fatty liver disease | ||
| Oral Cavity |  | EOLP: Erosive Oral lichen planus |
| LP: leukoplakia | ||
| NEOLP: Non-erosive oral lichen planus | ||
| OSCC: Oral squamous cell carcinoma | ||
| Skin | 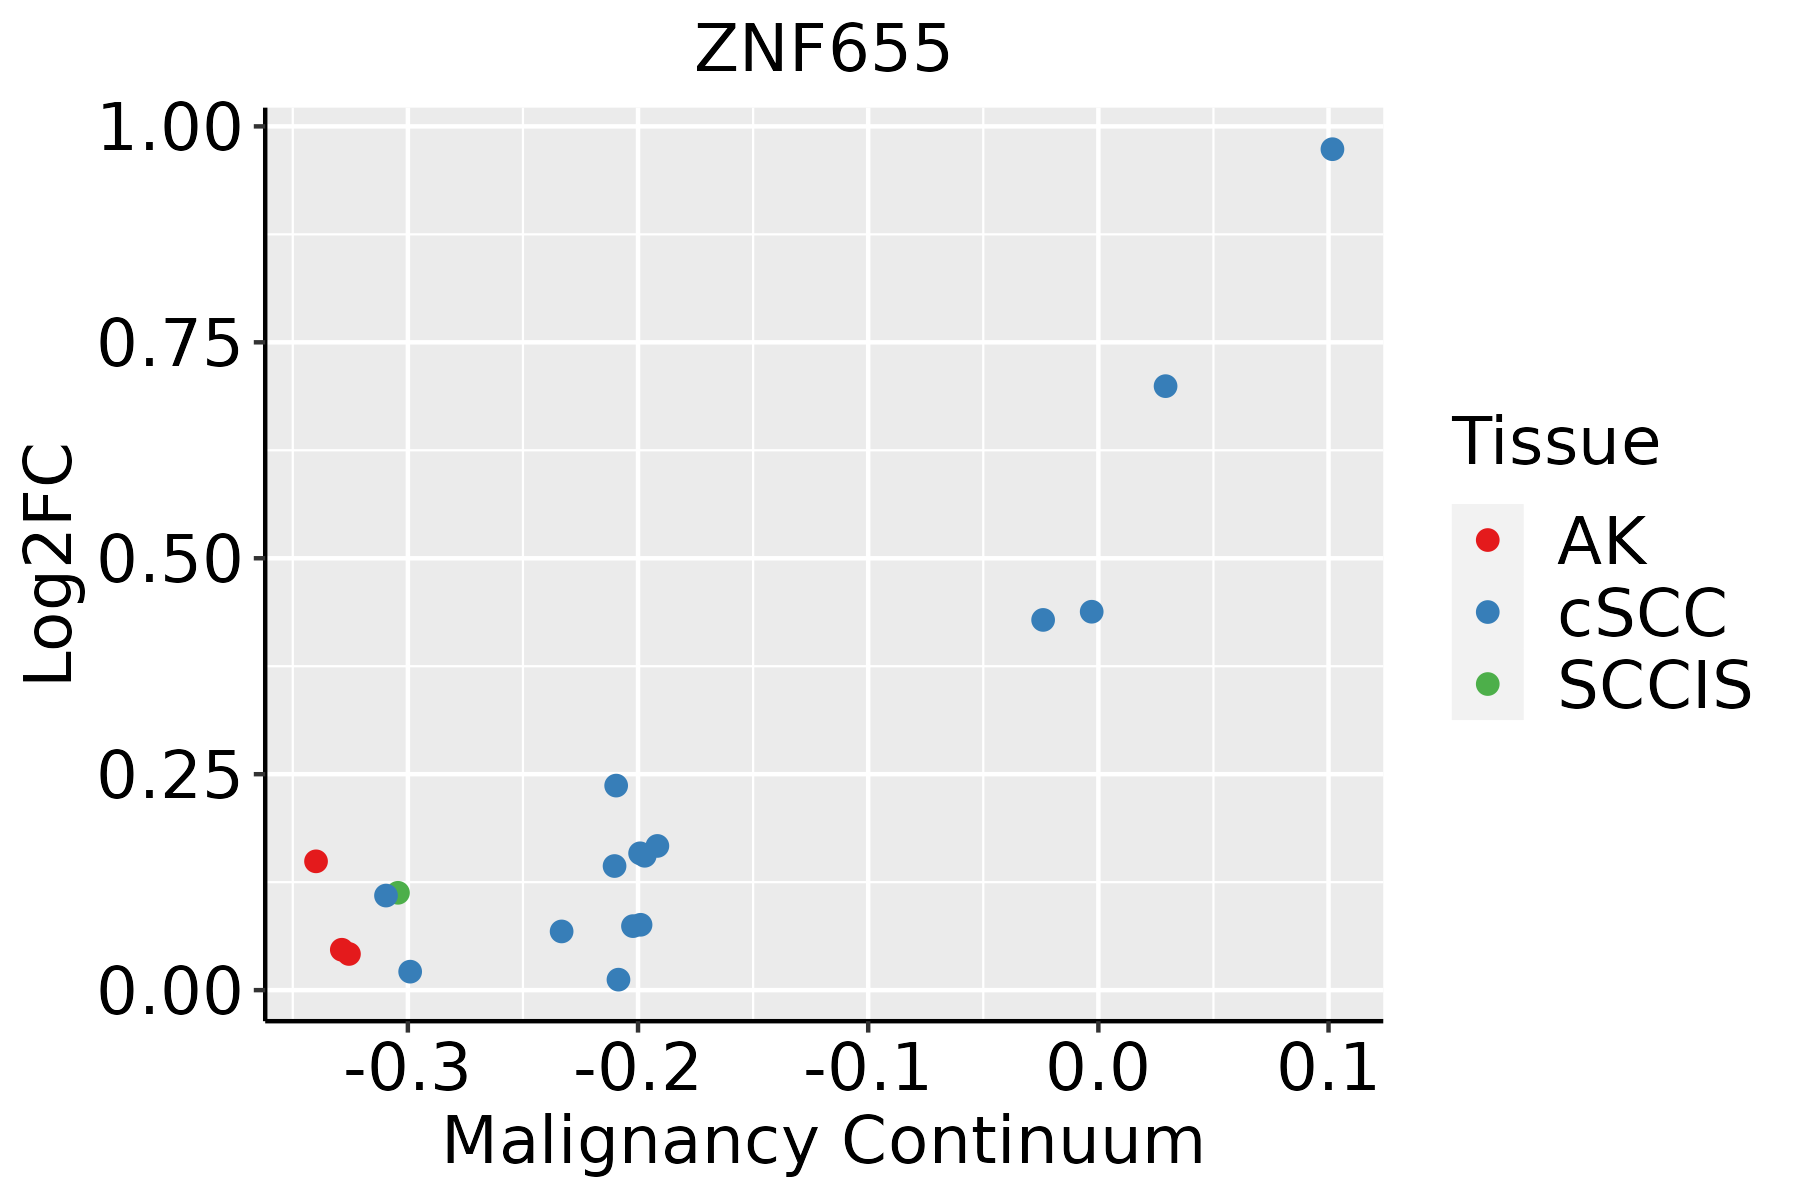 | AK: Actinic keratosis |
| cSCC: Cutaneous squamous cell carcinoma | ||
| SCCIS:squamous cell carcinoma in situ | ||
| Thyroid | 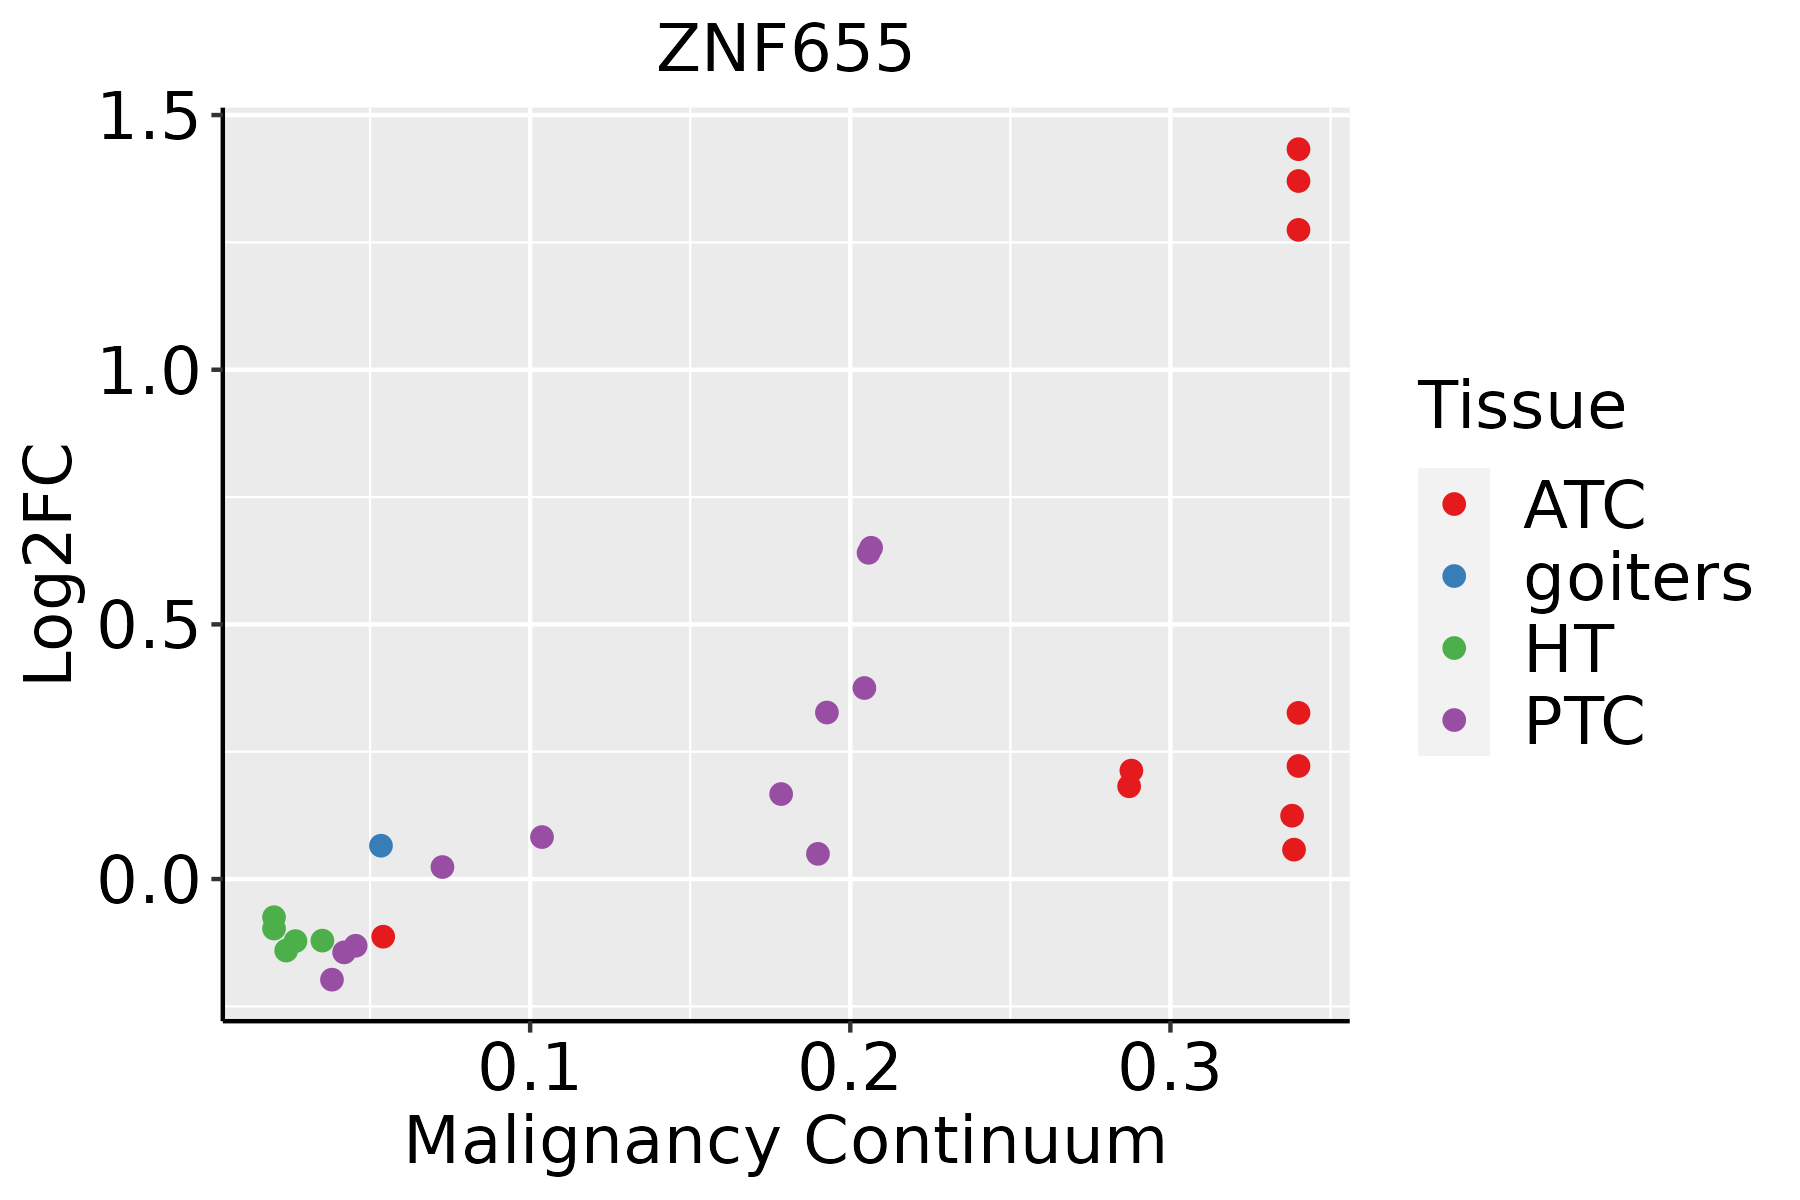 | ATC: Anaplastic thyroid cancer |
| HT: Hashimoto's thyroiditis | ||
| PTC: Papillary thyroid cancer |
| ∗log2FC in expression of this searched gene in stem-like cells from each diseased tissue sample relative to stem-like cells in normal samples in each tissue plotted against the malignancy continuum. Samples are colored based on if they are from different disease stage. |
Top |
Malignant transformation related pathway analysis |
| Find out the enriched GO biological processes and KEGG pathways involved in transition from healthy to precancer to cancer |
| Tissue | Disease Stage | Enriched GO biological Processes |
| Colorectum | AD |  |
| Colorectum | SER |  |
| Colorectum | MSS |  |
| Colorectum | MSI-H |  |
| Colorectum | FAP |  |
| ∗Top 15 enriched GO BP terms are showed in the bar plot of each disease state in each tissue. Each row represents a significant GO biological process which is colored according to the -log10(p.adjust). |
| Page: 1 2 3 4 5 6 7 8 9 |
| GO ID | Tissue | Disease Stage | Description | Gene Ratio | Bg Ratio | pvalue | p.adjust | Count |
| GO:0007346 | Colorectum | AD | regulation of mitotic cell cycle | 119/3918 | 457/18723 | 4.60e-03 | 3.14e-02 | 119 |
| GO:00073461 | Colorectum | MSS | regulation of mitotic cell cycle | 108/3467 | 457/18723 | 3.30e-03 | 2.50e-02 | 108 |
| GO:000734610 | Esophagus | HGIN | regulation of mitotic cell cycle | 98/2587 | 457/18723 | 4.39e-06 | 1.42e-04 | 98 |
| GO:00447729 | Esophagus | HGIN | mitotic cell cycle phase transition | 89/2587 | 424/18723 | 2.80e-05 | 7.21e-04 | 89 |
| GO:19019906 | Esophagus | HGIN | regulation of mitotic cell cycle phase transition | 65/2587 | 299/18723 | 1.12e-04 | 2.36e-03 | 65 |
| GO:20000456 | Esophagus | HGIN | regulation of G1/S transition of mitotic cell cycle | 36/2587 | 142/18723 | 1.74e-04 | 3.35e-03 | 36 |
| GO:00000827 | Esophagus | HGIN | G1/S transition of mitotic cell cycle | 48/2587 | 214/18723 | 3.97e-04 | 6.07e-03 | 48 |
| GO:00448437 | Esophagus | HGIN | cell cycle G1/S phase transition | 52/2587 | 241/18723 | 6.19e-04 | 8.58e-03 | 52 |
| GO:19028065 | Esophagus | HGIN | regulation of cell cycle G1/S phase transition | 39/2587 | 168/18723 | 6.60e-04 | 9.03e-03 | 39 |
| GO:20001343 | Esophagus | HGIN | negative regulation of G1/S transition of mitotic cell cycle | 23/2587 | 84/18723 | 7.90e-04 | 1.03e-02 | 23 |
| GO:00459305 | Esophagus | HGIN | negative regulation of mitotic cell cycle | 49/2587 | 235/18723 | 1.88e-03 | 2.01e-02 | 49 |
| GO:19019915 | Esophagus | HGIN | negative regulation of mitotic cell cycle phase transition | 39/2587 | 179/18723 | 2.31e-03 | 2.36e-02 | 39 |
| GO:19028073 | Esophagus | HGIN | negative regulation of cell cycle G1/S phase transition | 23/2587 | 93/18723 | 3.39e-03 | 3.18e-02 | 23 |
| GO:19019876 | Esophagus | HGIN | regulation of cell cycle phase transition | 72/2587 | 390/18723 | 5.78e-03 | 4.70e-02 | 72 |
| GO:004477216 | Esophagus | ESCC | mitotic cell cycle phase transition | 281/8552 | 424/18723 | 4.63e-18 | 4.45e-16 | 281 |
| GO:000734615 | Esophagus | ESCC | regulation of mitotic cell cycle | 293/8552 | 457/18723 | 8.00e-16 | 5.64e-14 | 293 |
| GO:190198713 | Esophagus | ESCC | regulation of cell cycle phase transition | 242/8552 | 390/18723 | 3.86e-11 | 1.26e-09 | 242 |
| GO:190199013 | Esophagus | ESCC | regulation of mitotic cell cycle phase transition | 191/8552 | 299/18723 | 1.35e-10 | 3.94e-09 | 191 |
| GO:00457865 | Esophagus | ESCC | negative regulation of cell cycle | 236/8552 | 385/18723 | 3.62e-10 | 9.93e-09 | 236 |
| GO:00109484 | Esophagus | ESCC | negative regulation of cell cycle process | 177/8552 | 294/18723 | 3.26e-07 | 4.59e-06 | 177 |
| Page: 1 2 3 4 5 6 |
| Pathway ID | Tissue | Disease Stage | Description | Gene Ratio | Bg Ratio | pvalue | p.adjust | qvalue | Count |
| Page: 1 |
Top |
Cell-cell communication analysis |
| Identification of potential cell-cell interactions between two cell types and their ligand-receptor pairs for different disease states |
| Ligand | Receptor | LRpair | Pathway | Tissue | Disease Stage |
| Page: 1 |
Top |
Single-cell gene regulatory network inference analysis |
| Find out the significant the regulons (TFs) and the target genes of each regulon across cell types for different disease states |
| TF | Cell Type | Tissue | Disease Stage | Target Gene | RSS | Regulon Activity |
| ZNF655 | TRANS | Esophagus | Healthy | AFTPH,EPAS1,SLC22A23, etc. | 2.20e-01 |  |
| ZNF655 | MALTB | Oral cavity | ADJ | FAM101B,ADAP1,TEX2, etc. | 4.48e-02 |  |
| ZNF655 | FIB | Prostate | ADJ | PGF,WFDC2,IL1RL1, etc. | 3.50e-02 |  |
| ZNF655 | INCAF | Thyroid | ATC | ZNF829,ZDBF2,LINC00662, etc. | 1.42e-01 |  |
| ∗The dot plots of a searched regulon are shown for all cell subpopulations in each disease state of each tissue based on the regulon specific score inferred using pySCENIC and by calculating the average expression. |
| Page: 1 |
Top |
Somatic mutation of malignant transformation related genes |
| Annotation of somatic variants for genes involved in malignant transformation |
| Hugo Symbol | Variant Class | Variant Classification | dbSNP RS | HGVSc | HGVSp | HGVSp Short | SWISSPROT | BIOTYPE | SIFT | PolyPhen | Tumor Sample Barcode | Tissue | Histology | Sex | Age | Stage | Therapy Types | Drugs | Outcome |
| ZNF655 | SNV | Missense_Mutation | c.556N>G | p.Leu186Val | p.L186V | Q8N720 | protein_coding | tolerated(0.47) | possibly_damaging(0.84) | TCGA-AC-A23H-01 | Breast | breast invasive carcinoma | Female | >=65 | I/II | Unknown | Unknown | PD | |
| ZNF655 | SNV | Missense_Mutation | c.1378C>A | p.Gln460Lys | p.Q460K | Q8N720 | protein_coding | tolerated(0.59) | benign(0) | TCGA-AR-A24L-01 | Breast | breast invasive carcinoma | Female | <65 | I/II | Hormone Therapy | tamoxiphen | PD | |
| ZNF655 | insertion | Nonsense_Mutation | novel | c.538_539insATACAATATATAAATAGAAA | p.Ala181ThrfsTer5 | p.A181Tfs*5 | Q8N720 | protein_coding | TCGA-A8-A09N-01 | Breast | breast invasive carcinoma | Female | <65 | III/IV | Unknown | Unknown | SD | ||
| ZNF655 | insertion | Frame_Shift_Ins | novel | c.493_494insTAGTATCTACAAGGACAAGA | p.Glu165ValfsTer42 | p.E165Vfs*42 | Q8N720 | protein_coding | TCGA-AR-A0TU-01 | Breast | breast invasive carcinoma | Female | <65 | I/II | Unspecific | Doxorubicin | SD | ||
| ZNF655 | insertion | Nonsense_Mutation | novel | c.1535_1536insTGTTGATTCCTAAGCAGAAAATTTCGGAAGA | p.His513ValfsTer4 | p.H513Vfs*4 | Q8N720 | protein_coding | TCGA-B6-A0IK-01 | Breast | breast invasive carcinoma | Female | <65 | III/IV | Unknown | Unknown | PD | ||
| ZNF655 | insertion | Nonsense_Mutation | novel | c.540_541insACAATATATAAATAGAAAAT | p.Ala181ThrfsTer5 | p.A181Tfs*5 | Q8N720 | protein_coding | TCGA-BH-A0DZ-01 | Breast | breast invasive carcinoma | Female | <65 | I/II | Chemotherapy | docetaxel | SD | ||
| ZNF655 | SNV | Missense_Mutation | novel | c.1351N>T | p.Ala451Ser | p.A451S | Q8N720 | protein_coding | tolerated(0.23) | benign(0.005) | TCGA-AA-A02J-01 | Colorectum | colon adenocarcinoma | Female | >=65 | III/IV | Unknown | Unknown | PD |
| ZNF655 | SNV | Missense_Mutation | rs753484017 | c.293N>T | p.Ser98Leu | p.S98L | Q8N720 | protein_coding | tolerated(0.42) | benign(0) | TCGA-AZ-4315-01 | Colorectum | colon adenocarcinoma | Male | <65 | I/II | Unknown | Unknown | SD |
| ZNF655 | SNV | Missense_Mutation | novel | c.719T>C | p.Ile240Thr | p.I240T | Q8N720 | protein_coding | deleterious(0.03) | benign(0.007) | TCGA-CA-6717-01 | Colorectum | colon adenocarcinoma | Male | <65 | I/II | Chemotherapy | oxaliplatin | CR |
| ZNF655 | SNV | Missense_Mutation | novel | c.1300C>A | p.Gln434Lys | p.Q434K | Q8N720 | protein_coding | deleterious(0.02) | benign(0.02) | TCGA-CA-6717-01 | Colorectum | colon adenocarcinoma | Male | <65 | I/II | Chemotherapy | oxaliplatin | CR |
| Page: 1 2 3 4 5 6 |
Top |
Related drugs of malignant transformation related genes |
| Identification of chemicals and drugs interact with genes involved in malignant transfromation |
| (DGIdb 4.0) |
| Entrez ID | Symbol | Category | Interaction Types | Drug Claim Name | Drug Name | PMIDs |
| Page: 1 |

Copyright 2023-Present -The University of Texas Health Science Center at Houston |