
|
|||||
|
 | |
| |
| |
| |
| |
| |
|
Gene: ZNF654 |
Gene summary for ZNF654 |
| Gene information | Species | Human | Gene symbol | ZNF654 | Gene ID | 55279 |
| Gene name | zinc finger protein 654 | |
| Gene Alias | ZNF654 | |
| Cytomap | 3p11.1 | |
| Gene Type | protein-coding | GO ID | GO:0006139 | UniProtAcc | NA |
Top |
Malignant transformation analysis |
| Identification of the aberrant gene expression in precancerous and cancerous lesions by comparing the gene expression of stem-like cells in diseased tissues with normal stem cells |
| Entrez ID | Symbol | Replicates | Species | Organ | Tissue | Adj P-value | Log2FC | Malignancy |
| 55279 | ZNF654 | CCI_1 | Human | Cervix | CC | 3.32e-02 | 4.88e-01 | 0.528 |
| 55279 | ZNF654 | CCI_2 | Human | Cervix | CC | 3.11e-09 | 1.04e+00 | 0.5249 |
| 55279 | ZNF654 | CCI_3 | Human | Cervix | CC | 1.67e-07 | 6.67e-01 | 0.516 |
| 55279 | ZNF654 | HTA11_3410_2000001011 | Human | Colorectum | AD | 5.98e-17 | -5.25e-01 | 0.0155 |
| 55279 | ZNF654 | HTA11_2487_2000001011 | Human | Colorectum | SER | 7.89e-08 | -5.10e-01 | -0.1808 |
| 55279 | ZNF654 | HTA11_1938_2000001011 | Human | Colorectum | AD | 2.20e-07 | -4.91e-01 | -0.0811 |
| 55279 | ZNF654 | HTA11_78_2000001011 | Human | Colorectum | AD | 1.48e-07 | -4.88e-01 | -0.1088 |
| 55279 | ZNF654 | HTA11_347_2000001011 | Human | Colorectum | AD | 9.01e-15 | -5.05e-01 | -0.1954 |
| 55279 | ZNF654 | HTA11_3361_2000001011 | Human | Colorectum | AD | 2.08e-05 | -5.05e-01 | -0.1207 |
| 55279 | ZNF654 | HTA11_83_2000001011 | Human | Colorectum | SER | 1.63e-04 | -5.15e-01 | -0.1526 |
| 55279 | ZNF654 | HTA11_696_2000001011 | Human | Colorectum | AD | 9.44e-22 | -5.17e-01 | -0.1464 |
| 55279 | ZNF654 | HTA11_866_2000001011 | Human | Colorectum | AD | 6.05e-23 | -5.03e-01 | -0.1001 |
| 55279 | ZNF654 | HTA11_1391_2000001011 | Human | Colorectum | AD | 4.30e-12 | -5.16e-01 | -0.059 |
| 55279 | ZNF654 | HTA11_2992_2000001011 | Human | Colorectum | SER | 1.88e-02 | -5.30e-01 | -0.1706 |
| 55279 | ZNF654 | HTA11_546_2000001011 | Human | Colorectum | AD | 1.65e-03 | -5.13e-01 | -0.0842 |
| 55279 | ZNF654 | HTA11_7862_2000001011 | Human | Colorectum | AD | 2.35e-04 | -5.30e-01 | -0.0179 |
| 55279 | ZNF654 | HTA11_866_3004761011 | Human | Colorectum | AD | 8.24e-12 | -5.05e-01 | 0.096 |
| 55279 | ZNF654 | HTA11_8622_2000001021 | Human | Colorectum | SER | 2.03e-03 | -5.30e-01 | 0.0528 |
| 55279 | ZNF654 | HTA11_10623_2000001011 | Human | Colorectum | AD | 4.79e-04 | -5.30e-01 | -0.0177 |
| 55279 | ZNF654 | HTA11_10711_2000001011 | Human | Colorectum | AD | 2.15e-10 | -5.30e-01 | 0.0338 |
| Page: 1 2 3 4 |
| Tissue | Expression Dynamics | Abbreviation |
| Cervix | 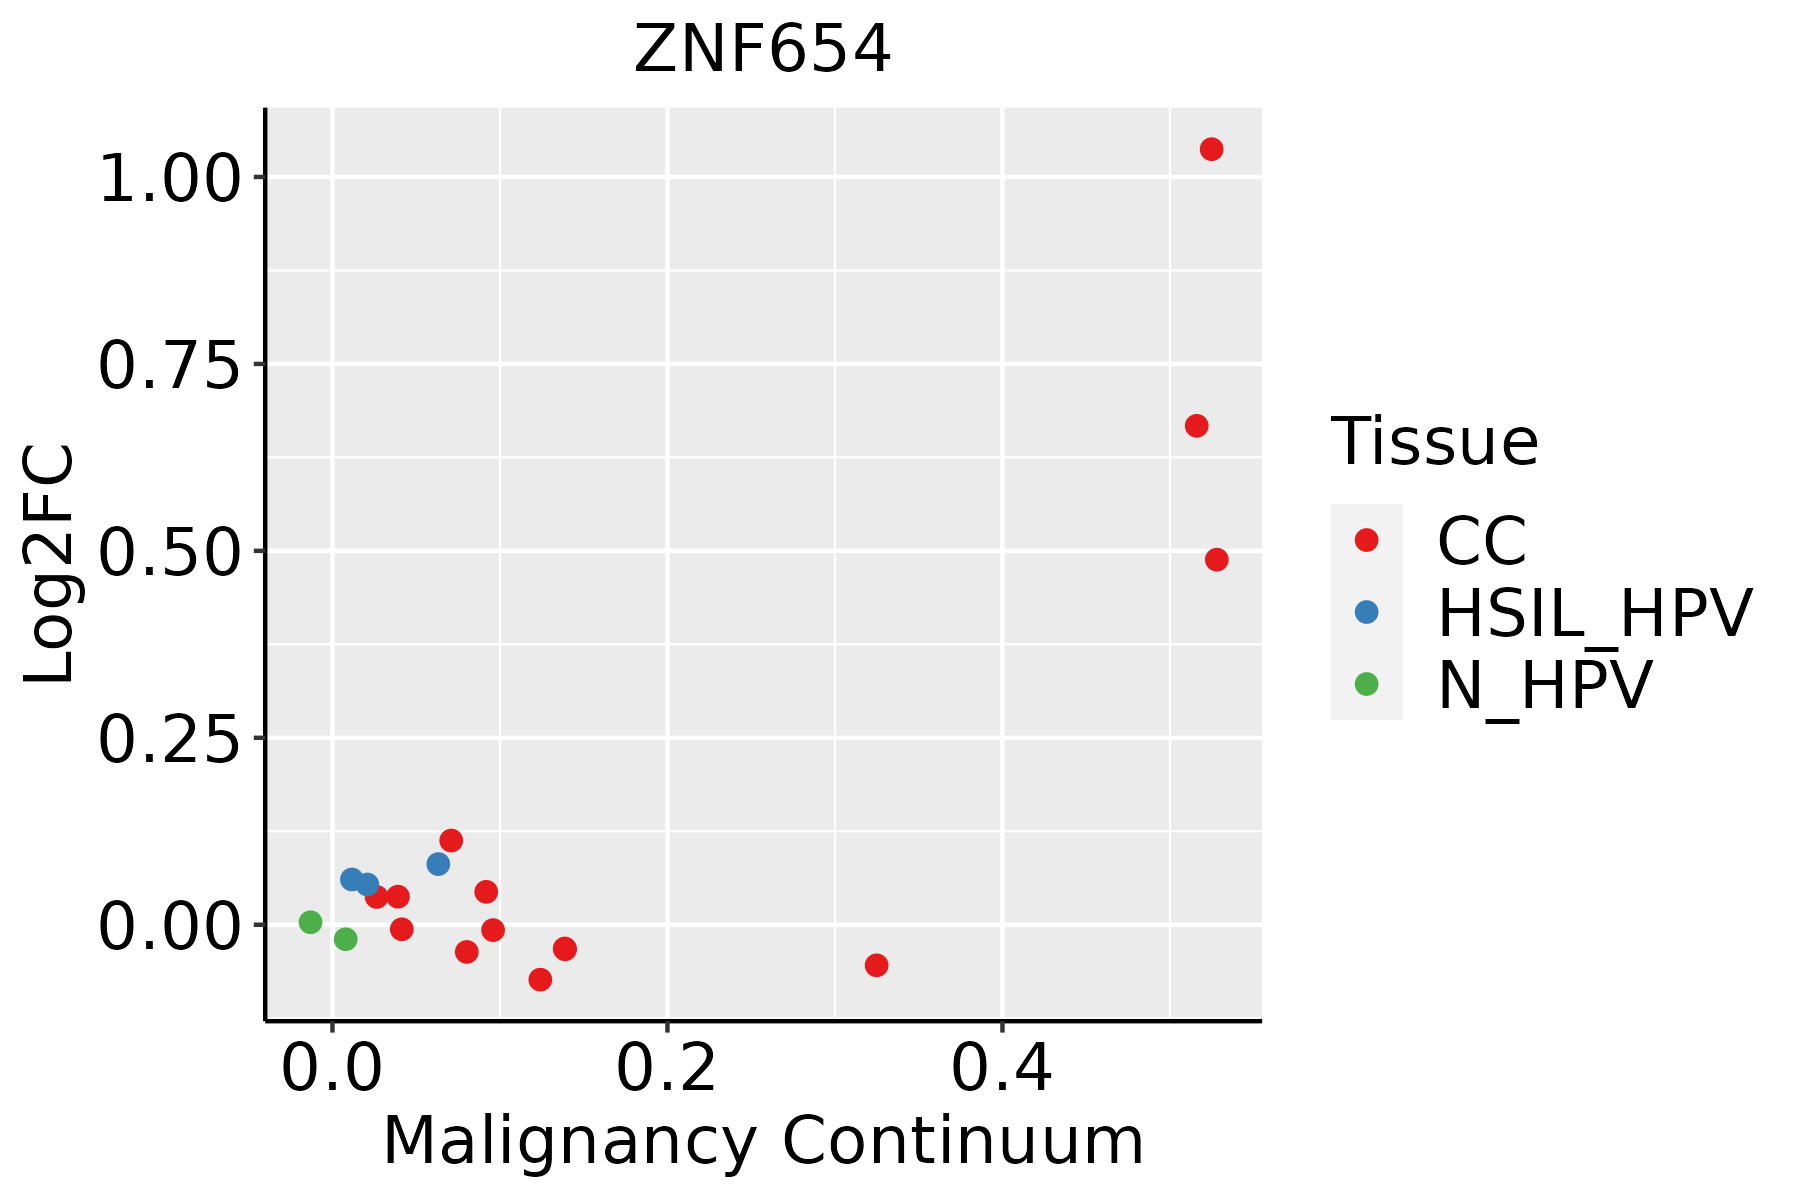 | CC: Cervix cancer |
| HSIL_HPV: HPV-infected high-grade squamous intraepithelial lesions | ||
| N_HPV: HPV-infected normal cervix | ||
| Colorectum (GSE201348) |  | FAP: Familial adenomatous polyposis |
| CRC: Colorectal cancer | ||
| Colorectum (HTA11) |  | AD: Adenomas |
| SER: Sessile serrated lesions | ||
| MSI-H: Microsatellite-high colorectal cancer | ||
| MSS: Microsatellite stable colorectal cancer | ||
| Lung | 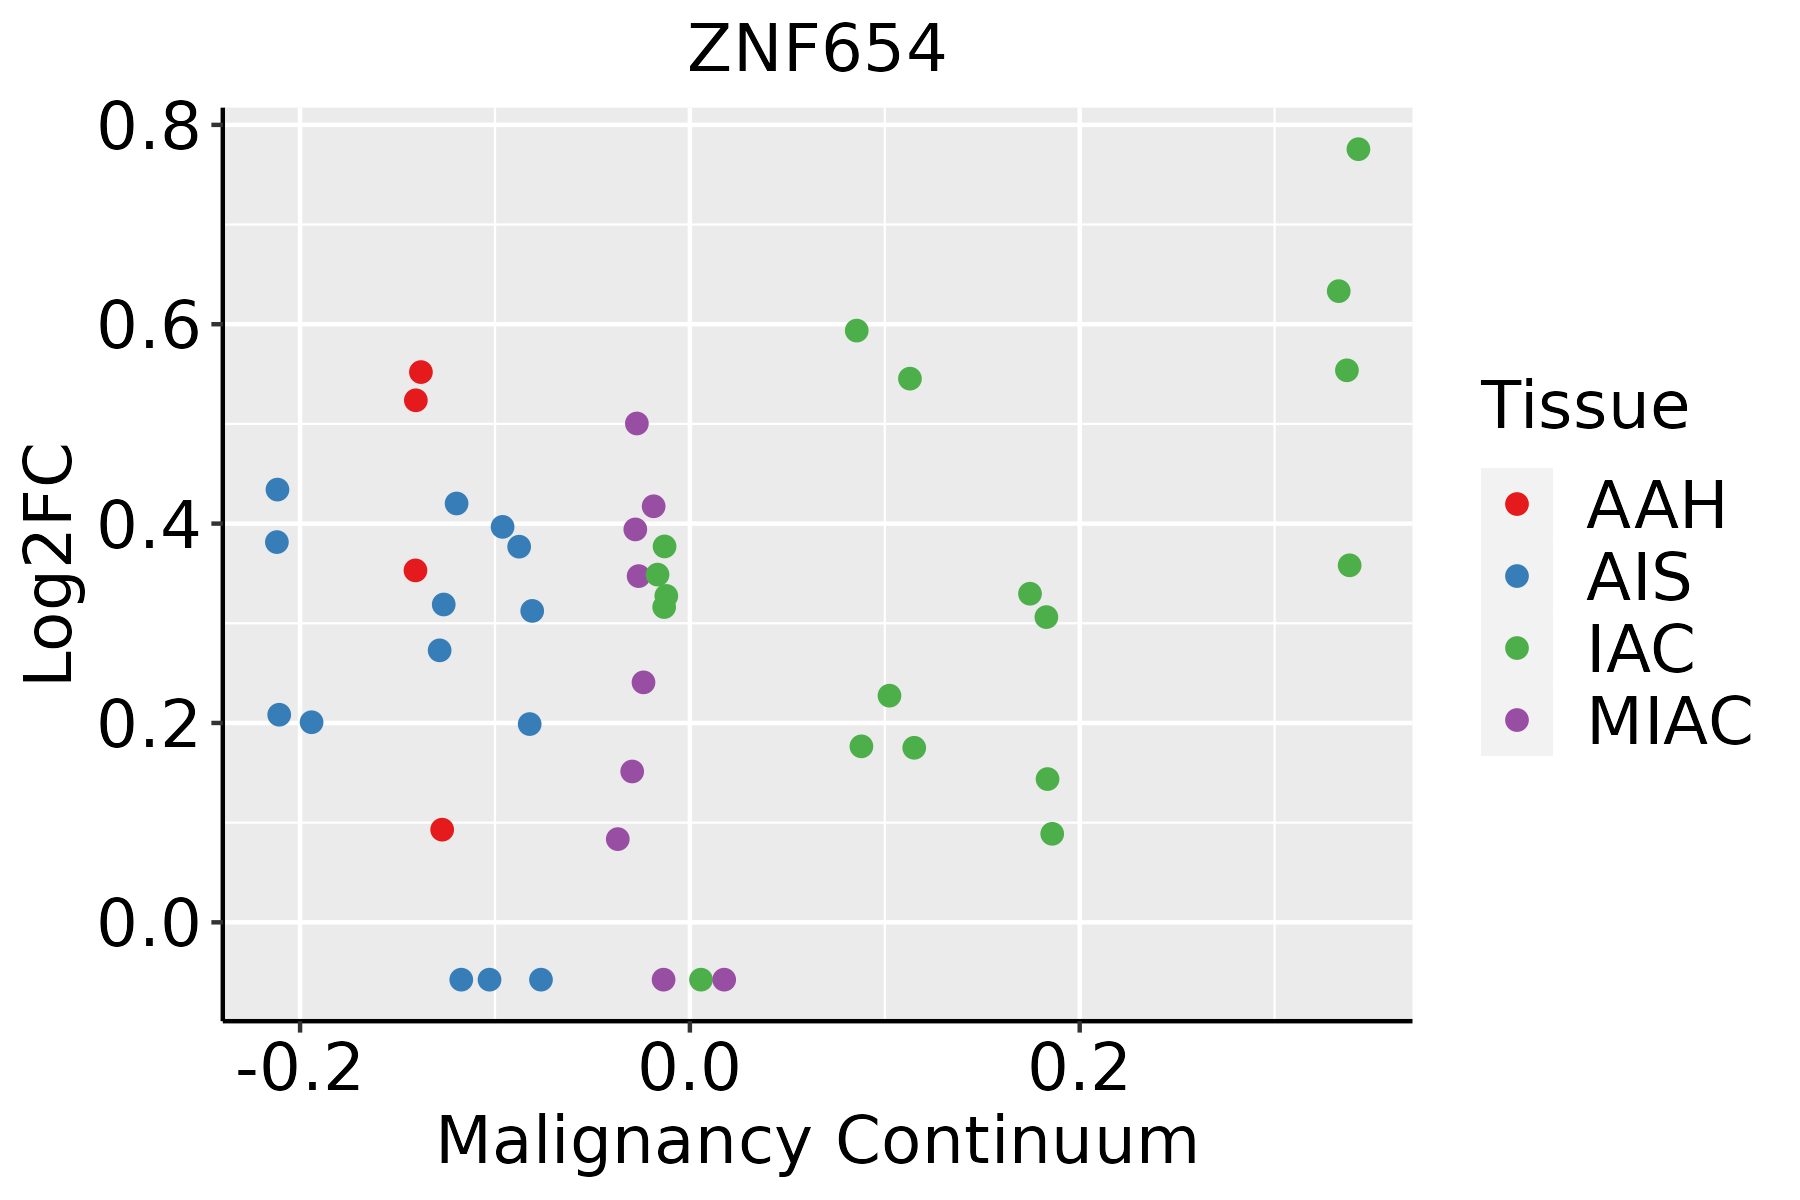 | AAH: Atypical adenomatous hyperplasia |
| AIS: Adenocarcinoma in situ | ||
| IAC: Invasive lung adenocarcinoma | ||
| MIA: Minimally invasive adenocarcinoma |
| ∗log2FC in expression of this searched gene in stem-like cells from each diseased tissue sample relative to stem-like cells in normal samples in each tissue plotted against the malignancy continuum. Samples are colored based on if they are from different disease stage. |
Top |
Malignant transformation related pathway analysis |
| Find out the enriched GO biological processes and KEGG pathways involved in transition from healthy to precancer to cancer |
| Tissue | Disease Stage | Enriched GO biological Processes |
| Colorectum | AD |  |
| Colorectum | SER |  |
| Colorectum | MSS |  |
| Colorectum | MSI-H |  |
| Colorectum | FAP |  |
| ∗Top 15 enriched GO BP terms are showed in the bar plot of each disease state in each tissue. Each row represents a significant GO biological process which is colored according to the -log10(p.adjust). |
| Page: 1 2 3 4 5 6 7 8 9 |
| GO ID | Tissue | Disease Stage | Description | Gene Ratio | Bg Ratio | pvalue | p.adjust | Count |
| Page: 1 |
| Pathway ID | Tissue | Disease Stage | Description | Gene Ratio | Bg Ratio | pvalue | p.adjust | qvalue | Count |
| Page: 1 |
Top |
Cell-cell communication analysis |
| Identification of potential cell-cell interactions between two cell types and their ligand-receptor pairs for different disease states |
| Ligand | Receptor | LRpair | Pathway | Tissue | Disease Stage |
| Page: 1 |
Top |
Single-cell gene regulatory network inference analysis |
| Find out the significant the regulons (TFs) and the target genes of each regulon across cell types for different disease states |
| TF | Cell Type | Tissue | Disease Stage | Target Gene | RSS | Regulon Activity |
| ZNF654 | CD8TEREX | Breast | ADJ | LPAR5,EBPL,NBR1, etc. | 2.53e-02 |  |
| ZNF654 | CD8TEX | Breast | ADJ | LPAR5,EBPL,NBR1, etc. | 4.12e-03 | |
| ZNF654 | TREG | Breast | Precancer | LPAR5,EBPL,NBR1, etc. | 2.58e-02 |  |
| ZNF654 | M1MAC | Breast | Precancer | LPAR5,EBPL,NBR1, etc. | 2.23e-02 | |
| ZNF654 | NEUT | Cervix | ADJ | GRB10,CGGBP1,DUSP10, etc. | 1.14e-01 |  |
| ZNF654 | BMEM | Cervix | CC | GRB10,CGGBP1,DUSP10, etc. | 5.78e-02 |  |
| ZNF654 | GC | Cervix | CC | GRB10,CGGBP1,DUSP10, etc. | 7.83e-02 | |
| ZNF654 | PLA | Cervix | Healthy | GRB10,CGGBP1,DUSP10, etc. | 8.64e-03 |  |
| ∗The dot plots of a searched regulon are shown for all cell subpopulations in each disease state of each tissue based on the regulon specific score inferred using pySCENIC and by calculating the average expression. |
| Page: 1 |
Top |
Somatic mutation of malignant transformation related genes |
| Annotation of somatic variants for genes involved in malignant transformation |
| Hugo Symbol | Variant Class | Variant Classification | dbSNP RS | HGVSc | HGVSp | HGVSp Short | SWISSPROT | BIOTYPE | SIFT | PolyPhen | Tumor Sample Barcode | Tissue | Histology | Sex | Age | Stage | Therapy Types | Drugs | Outcome |
| ZNF654 | SNV | Missense_Mutation | c.1331C>T | p.Ser444Leu | p.S444L | Q8IZM8 | protein_coding | tolerated(0.08) | benign(0.006) | TCGA-A8-A09Z-01 | Breast | breast invasive carcinoma | Female | >=65 | I/II | Unknown | Unknown | SD | |
| ZNF654 | SNV | Missense_Mutation | rs758133144 | c.115C>T | p.Leu39Phe | p.L39F | Q8IZM8 | protein_coding | tolerated(0.18) | probably_damaging(0.993) | TCGA-AR-A1AY-01 | Breast | breast invasive carcinoma | Female | >=65 | I/II | Unspecific | Doxorubicin | SD |
| ZNF654 | SNV | Missense_Mutation | novel | c.852G>T | p.Gln284His | p.Q284H | Q8IZM8 | protein_coding | tolerated(0.13) | benign(0.01) | TCGA-S3-AA10-01 | Breast | breast invasive carcinoma | Female | >=65 | I/II | Chemotherapy | cytoxan | CR |
| ZNF654 | SNV | Missense_Mutation | novel | c.986N>T | p.Ser329Leu | p.S329L | Q8IZM8 | protein_coding | tolerated(0.17) | benign(0.216) | TCGA-ZJ-AAXI-01 | Cervix | cervical & endocervical cancer | Female | >=65 | I/II | Unknown | Unknown | SD |
| ZNF654 | SNV | Missense_Mutation | rs773897741 | c.1189N>A | p.Glu397Lys | p.E397K | Q8IZM8 | protein_coding | deleterious(0.03) | benign(0.003) | TCGA-AA-3510-01 | Colorectum | colon adenocarcinoma | Male | >=65 | I/II | Unknown | Unknown | SD |
| ZNF654 | SNV | Missense_Mutation | c.860A>C | p.Gln287Pro | p.Q287P | Q8IZM8 | protein_coding | deleterious(0.02) | benign(0.091) | TCGA-AA-3966-01 | Colorectum | colon adenocarcinoma | Female | >=65 | I/II | Unknown | Unknown | SD | |
| ZNF654 | SNV | Missense_Mutation | novel | c.75N>G | p.Phe25Leu | p.F25L | Q8IZM8 | protein_coding | tolerated(0.13) | probably_damaging(0.996) | TCGA-AA-3984-01 | Colorectum | colon adenocarcinoma | Female | <65 | I/II | Unknown | Unknown | SD |
| ZNF654 | SNV | Missense_Mutation | c.481G>C | p.Gly161Arg | p.G161R | Q8IZM8 | protein_coding | tolerated(0.09) | benign(0.07) | TCGA-AA-A02O-01 | Colorectum | colon adenocarcinoma | Male | >=65 | I/II | Unknown | Unknown | SD | |
| ZNF654 | SNV | Missense_Mutation | rs374266455 | c.1606N>A | p.Val536Met | p.V536M | Q8IZM8 | protein_coding | tolerated(0.11) | benign(0.015) | TCGA-AA-A02R-01 | Colorectum | colon adenocarcinoma | Female | >=65 | I/II | Unknown | Unknown | PD |
| ZNF654 | SNV | Missense_Mutation | c.672N>A | p.His224Gln | p.H224Q | Q8IZM8 | protein_coding | deleterious(0) | probably_damaging(0.996) | TCGA-G4-6628-01 | Colorectum | colon adenocarcinoma | Male | >=65 | I/II | Unknown | Unknown | SD |
| Page: 1 2 3 4 5 6 |
Top |
Related drugs of malignant transformation related genes |
| Identification of chemicals and drugs interact with genes involved in malignant transfromation |
| (DGIdb 4.0) |
| Entrez ID | Symbol | Category | Interaction Types | Drug Claim Name | Drug Name | PMIDs |
| Page: 1 |

Copyright 2023-Present -The University of Texas Health Science Center at Houston |