
|
|||||
|
 | |
| |
| |
| |
| |
| |
|
Gene: ZNF652 |
Gene summary for ZNF652 |
| Gene information | Species | Human | Gene symbol | ZNF652 | Gene ID | 22834 |
| Gene name | zinc finger protein 652 | |
| Gene Alias | ZNF652 | |
| Cytomap | 17q21.32-q21.33 | |
| Gene Type | protein-coding | GO ID | GO:0006139 | UniProtAcc | A8K9F2 |
Top |
Malignant transformation analysis |
| Identification of the aberrant gene expression in precancerous and cancerous lesions by comparing the gene expression of stem-like cells in diseased tissues with normal stem cells |
| Entrez ID | Symbol | Replicates | Species | Organ | Tissue | Adj P-value | Log2FC | Malignancy |
| 22834 | ZNF652 | GSM4909298 | Human | Breast | IDC | 7.91e-24 | 5.38e-01 | 0.1551 |
| 22834 | ZNF652 | GSM4909302 | Human | Breast | IDC | 1.32e-15 | 5.64e-01 | 0.1545 |
| 22834 | ZNF652 | GSM4909303 | Human | Breast | IDC | 6.83e-07 | 5.22e-01 | 0.0438 |
| 22834 | ZNF652 | GSM4909304 | Human | Breast | IDC | 2.94e-09 | 3.29e-01 | 0.1636 |
| 22834 | ZNF652 | GSM4909311 | Human | Breast | IDC | 6.97e-05 | -1.46e-01 | 0.1534 |
| 22834 | ZNF652 | GSM4909319 | Human | Breast | IDC | 7.38e-08 | -1.38e-01 | 0.1563 |
| 22834 | ZNF652 | M1 | Human | Breast | IDC | 9.00e-06 | 3.32e-01 | 0.1577 |
| 22834 | ZNF652 | M5 | Human | Breast | IDC | 5.35e-06 | 7.26e-01 | 0.1598 |
| 22834 | ZNF652 | NCCBC14 | Human | Breast | DCIS | 1.46e-03 | 3.15e-01 | 0.2021 |
| 22834 | ZNF652 | P1 | Human | Breast | IDC | 5.25e-03 | 1.36e-01 | 0.1527 |
| 22834 | ZNF652 | DCIS2 | Human | Breast | DCIS | 2.84e-60 | 4.86e-01 | 0.0085 |
| 22834 | ZNF652 | HTA11_3410_2000001011 | Human | Colorectum | AD | 1.96e-03 | -1.41e-01 | 0.0155 |
| 22834 | ZNF652 | HTA11_347_2000001011 | Human | Colorectum | AD | 1.91e-11 | 6.20e-01 | -0.1954 |
| 22834 | ZNF652 | F007 | Human | Colorectum | FAP | 5.02e-03 | -2.74e-01 | 0.1176 |
| 22834 | ZNF652 | A001-C-207 | Human | Colorectum | FAP | 1.35e-02 | -1.93e-01 | 0.1278 |
| 22834 | ZNF652 | A015-C-203 | Human | Colorectum | FAP | 1.52e-22 | -3.42e-01 | -0.1294 |
| 22834 | ZNF652 | A015-C-204 | Human | Colorectum | FAP | 2.57e-04 | -2.32e-01 | -0.0228 |
| 22834 | ZNF652 | A014-C-040 | Human | Colorectum | FAP | 4.33e-04 | -4.70e-01 | -0.1184 |
| 22834 | ZNF652 | A002-C-201 | Human | Colorectum | FAP | 1.41e-09 | -2.90e-01 | 0.0324 |
| 22834 | ZNF652 | A002-C-203 | Human | Colorectum | FAP | 3.90e-02 | -1.47e-01 | 0.2786 |
| Page: 1 2 3 4 5 6 7 |
| Tissue | Expression Dynamics | Abbreviation |
| Breast | 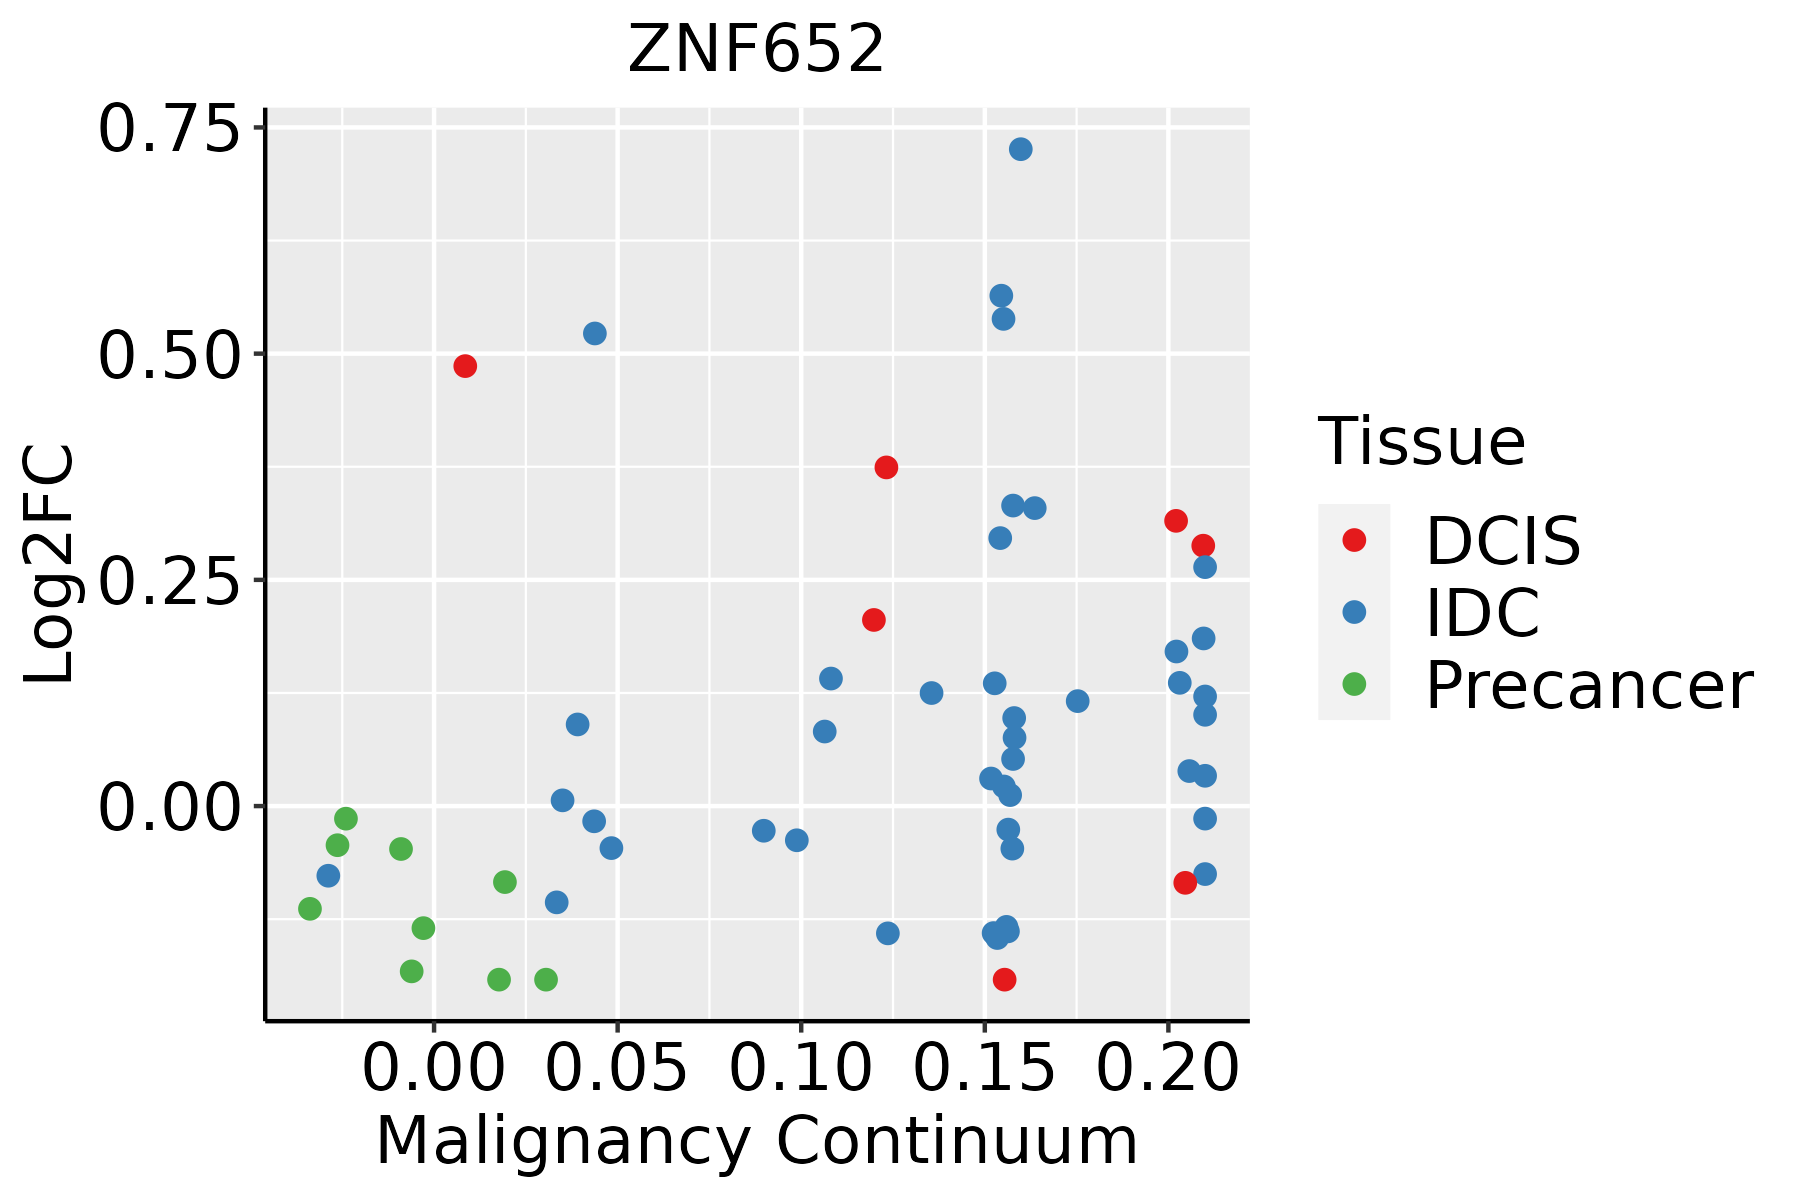 | IDC: Invasive ductal carcinoma |
| DCIS: Ductal carcinoma in situ | ||
| Precancer(BRCA1-mut): Precancerous lesion from BRCA1 mutation carriers | ||
| Colorectum (GSE201348) |  | FAP: Familial adenomatous polyposis |
| CRC: Colorectal cancer | ||
| Colorectum (HTA11) |  | AD: Adenomas |
| SER: Sessile serrated lesions | ||
| MSI-H: Microsatellite-high colorectal cancer | ||
| MSS: Microsatellite stable colorectal cancer | ||
| Esophagus | 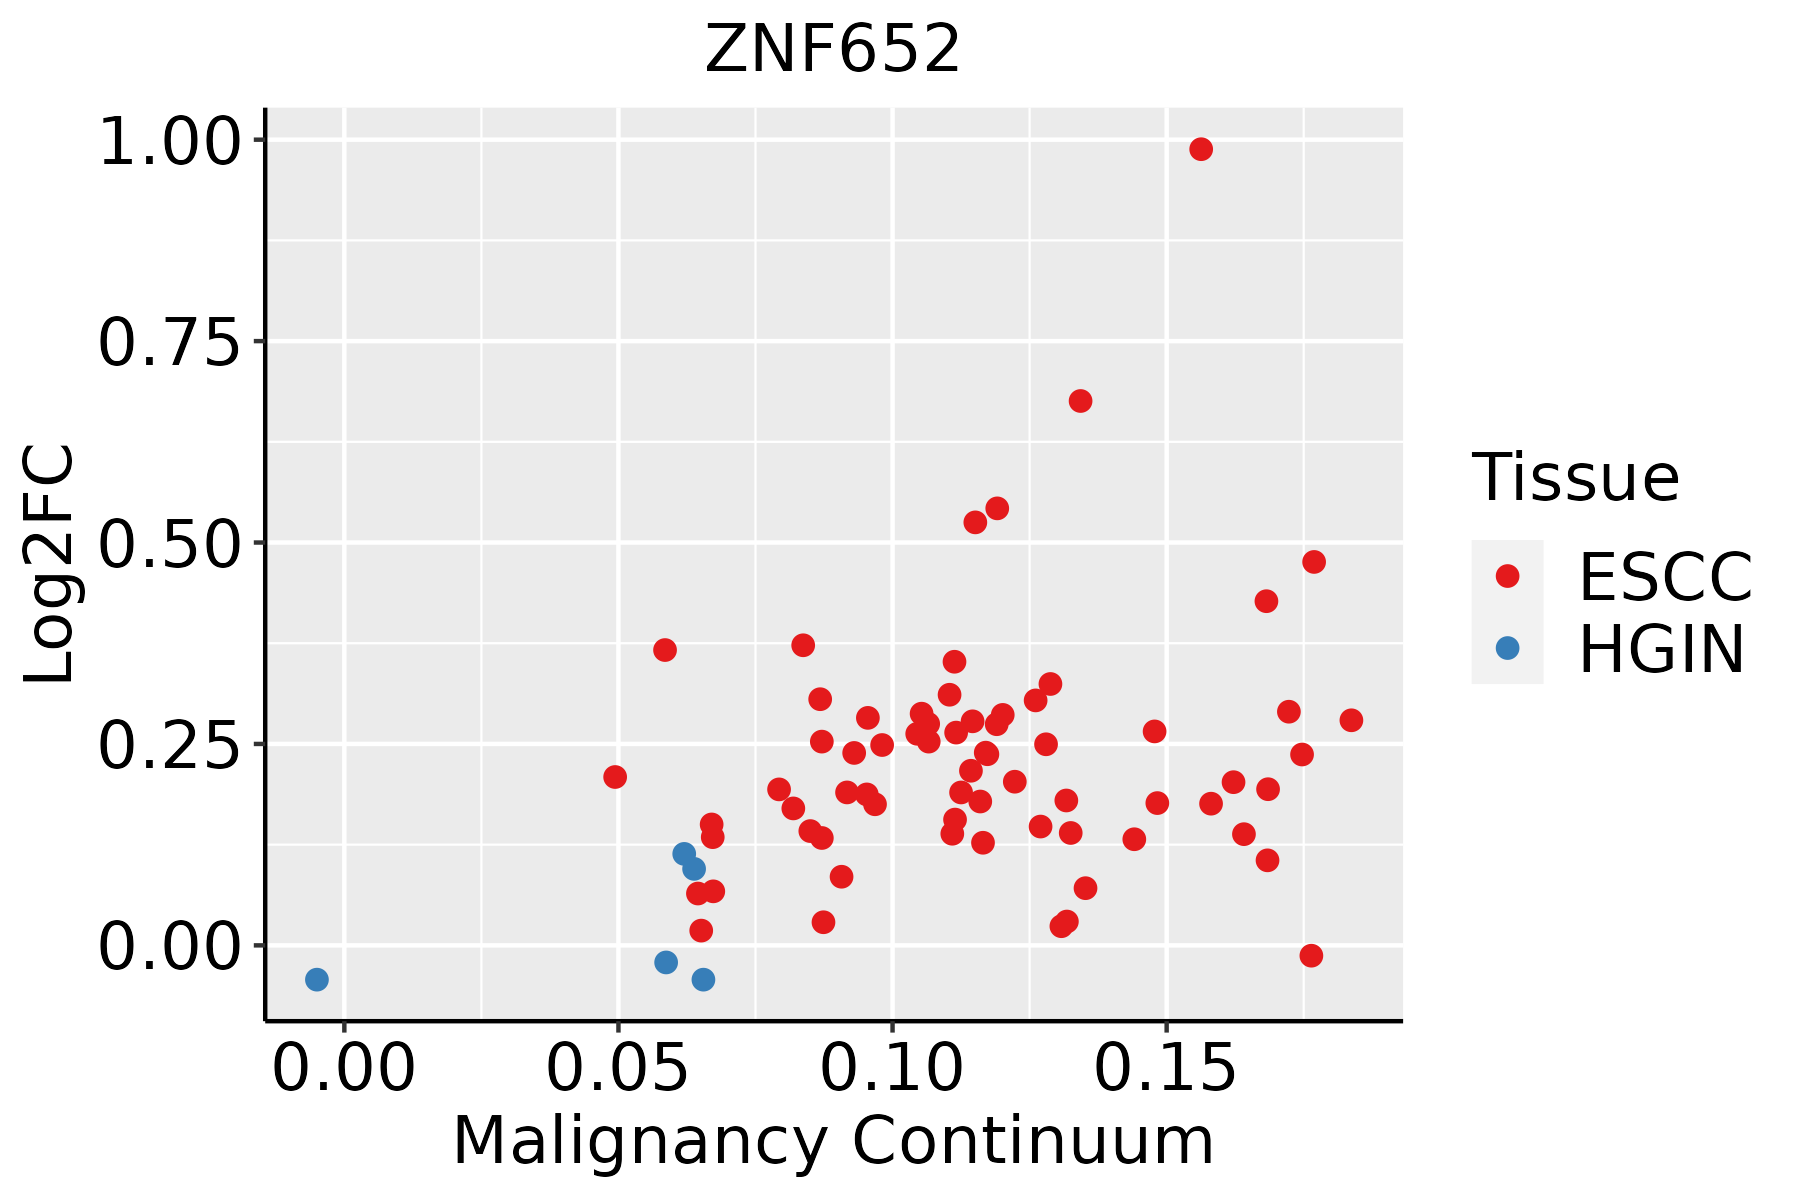 | ESCC: Esophageal squamous cell carcinoma |
| HGIN: High-grade intraepithelial neoplasias | ||
| LGIN: Low-grade intraepithelial neoplasias | ||
| Liver | 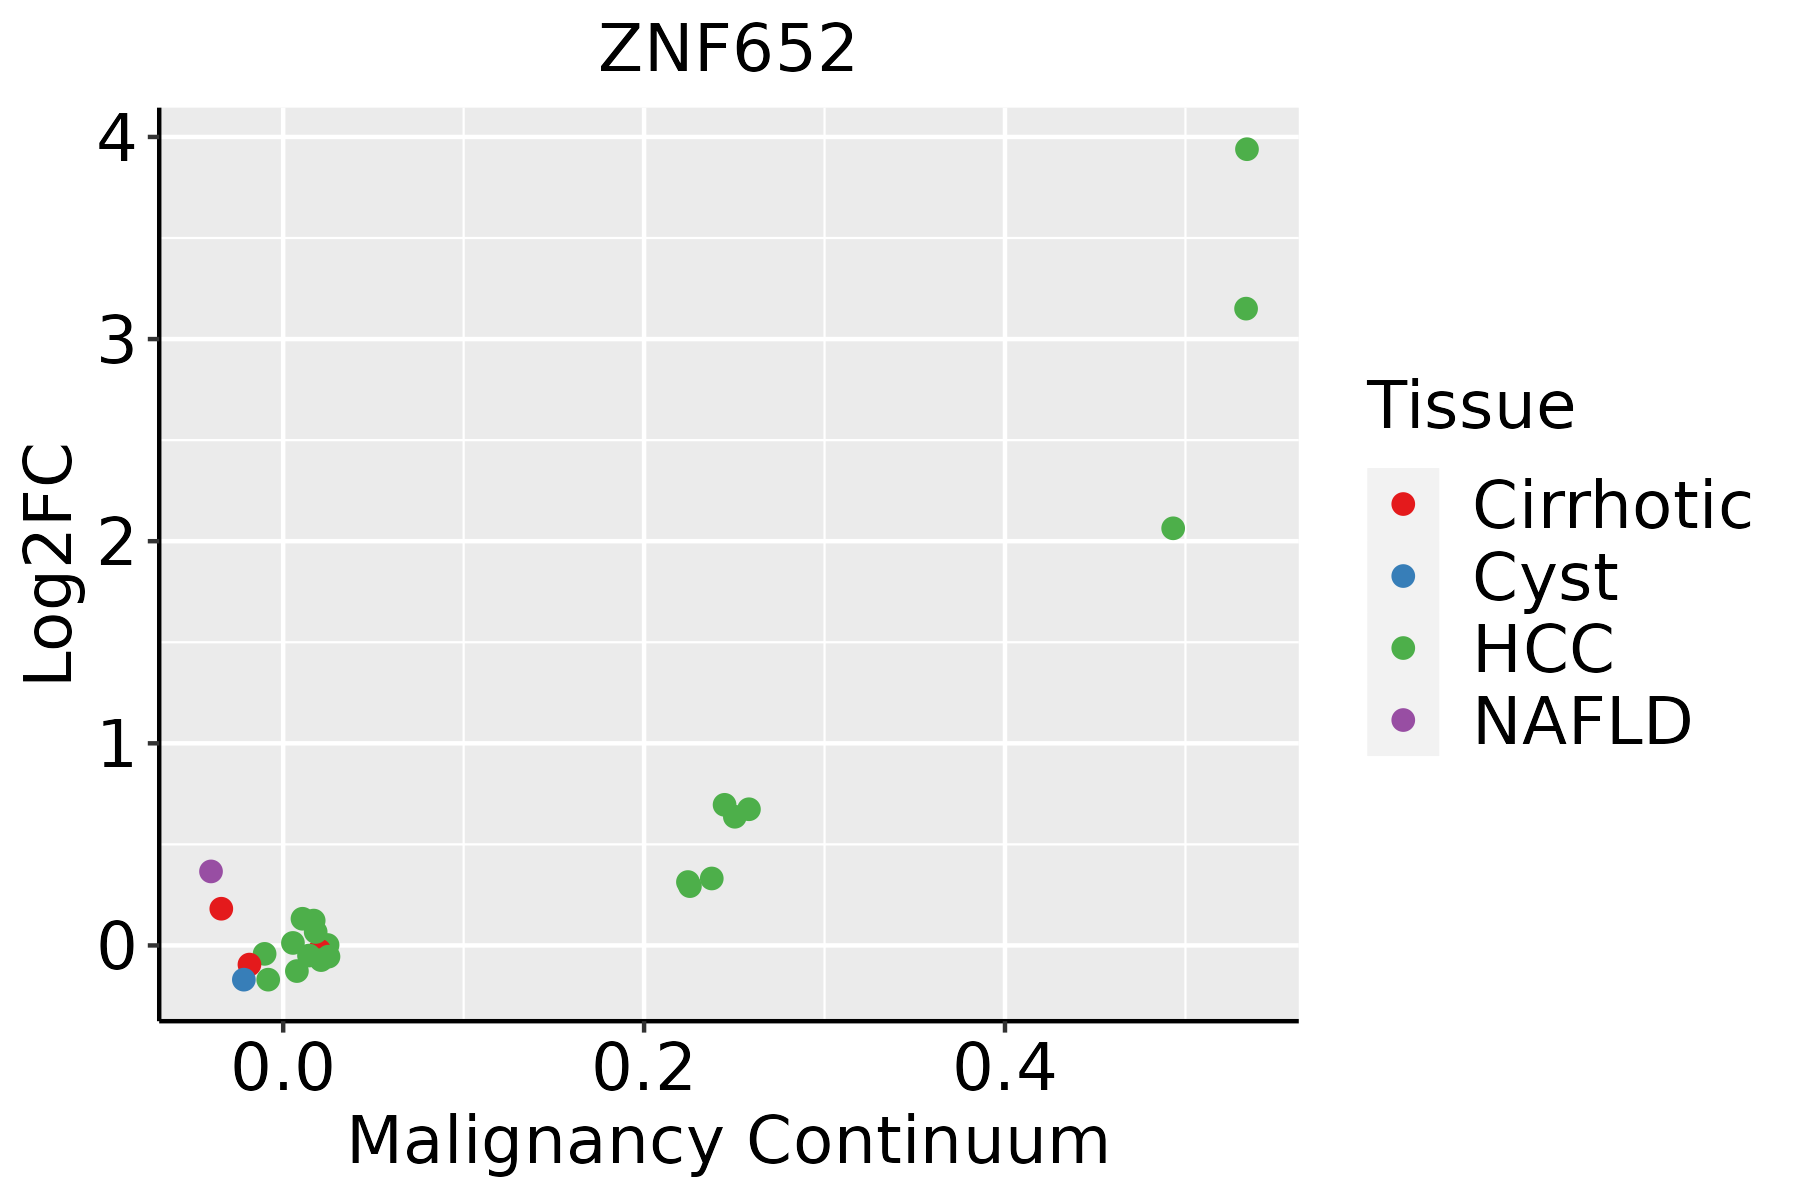 | HCC: Hepatocellular carcinoma |
| NAFLD: Non-alcoholic fatty liver disease | ||
| Lung |  | AAH: Atypical adenomatous hyperplasia |
| AIS: Adenocarcinoma in situ | ||
| IAC: Invasive lung adenocarcinoma | ||
| MIA: Minimally invasive adenocarcinoma | ||
| Prostate | 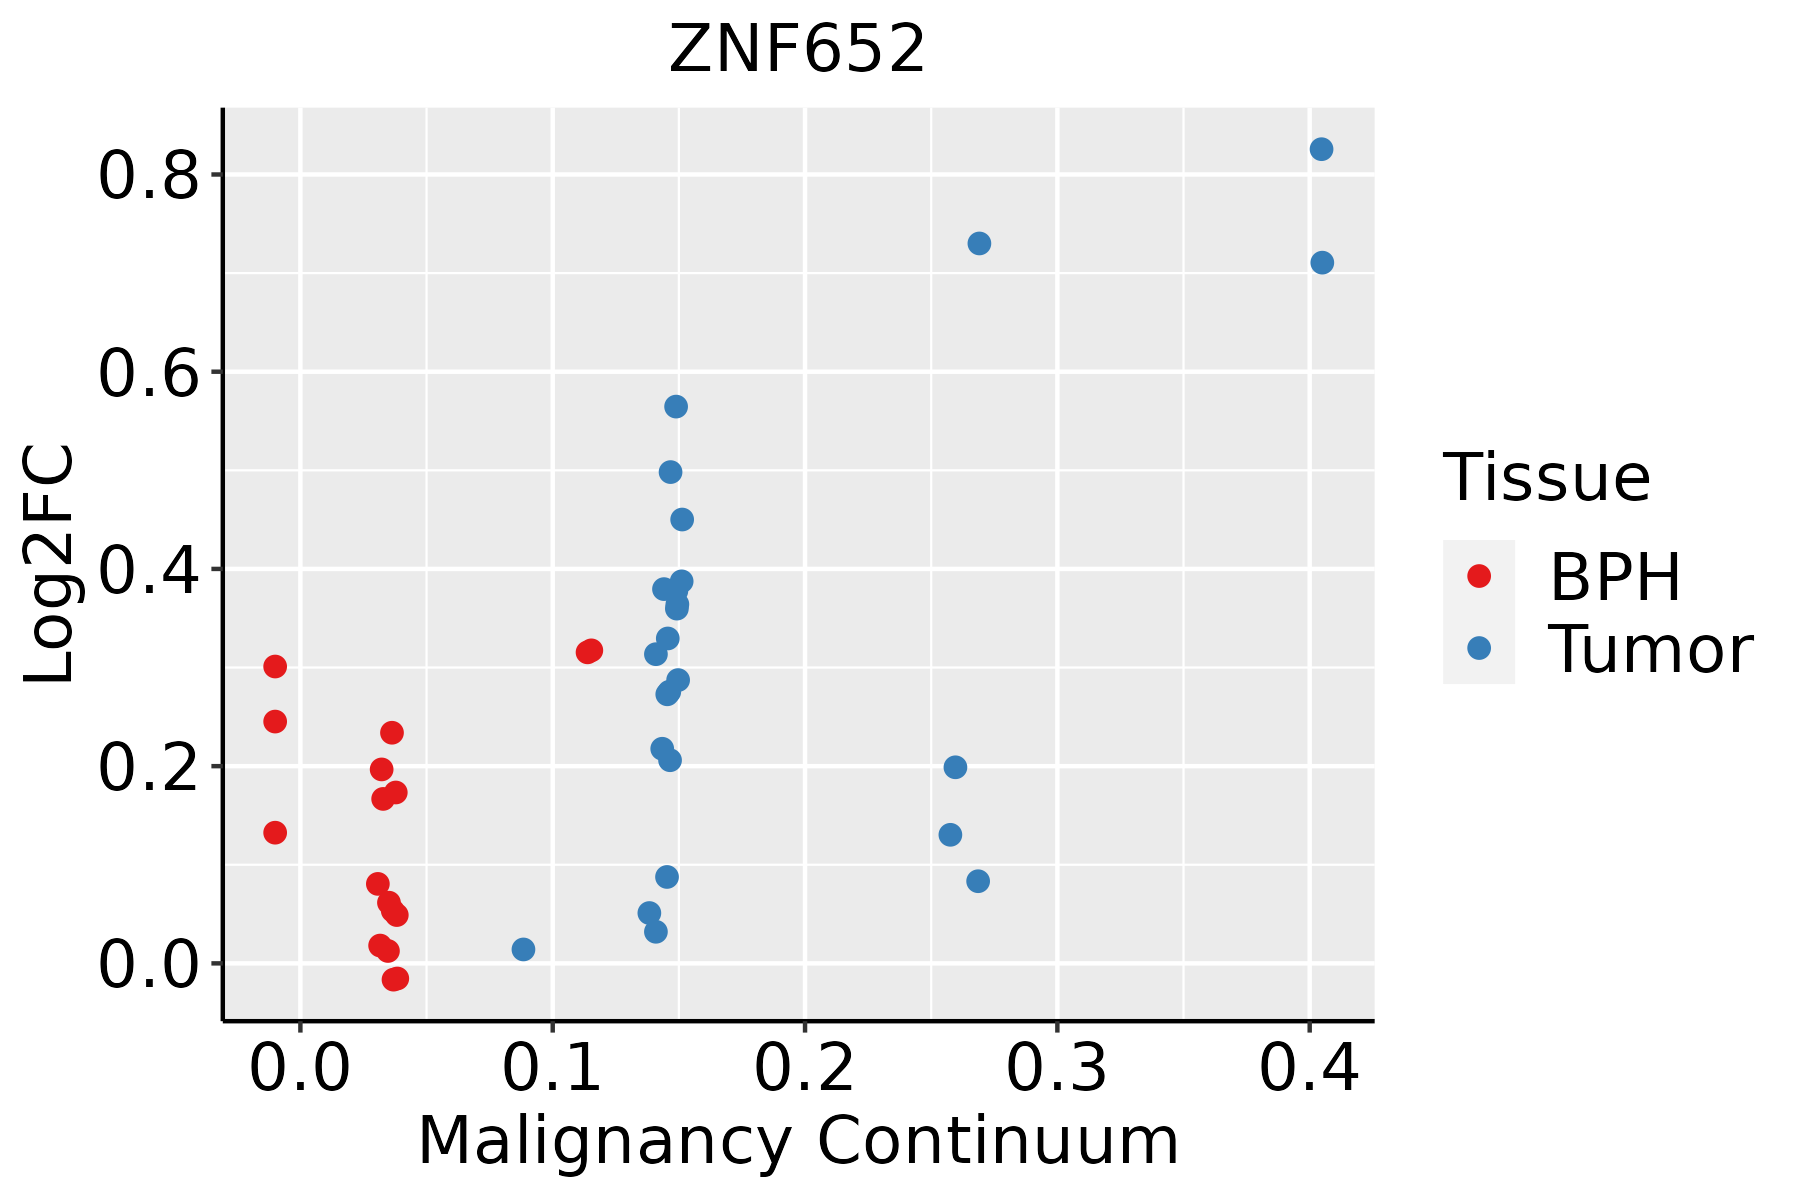 | BPH: Benign Prostatic Hyperplasia |
| Thyroid | 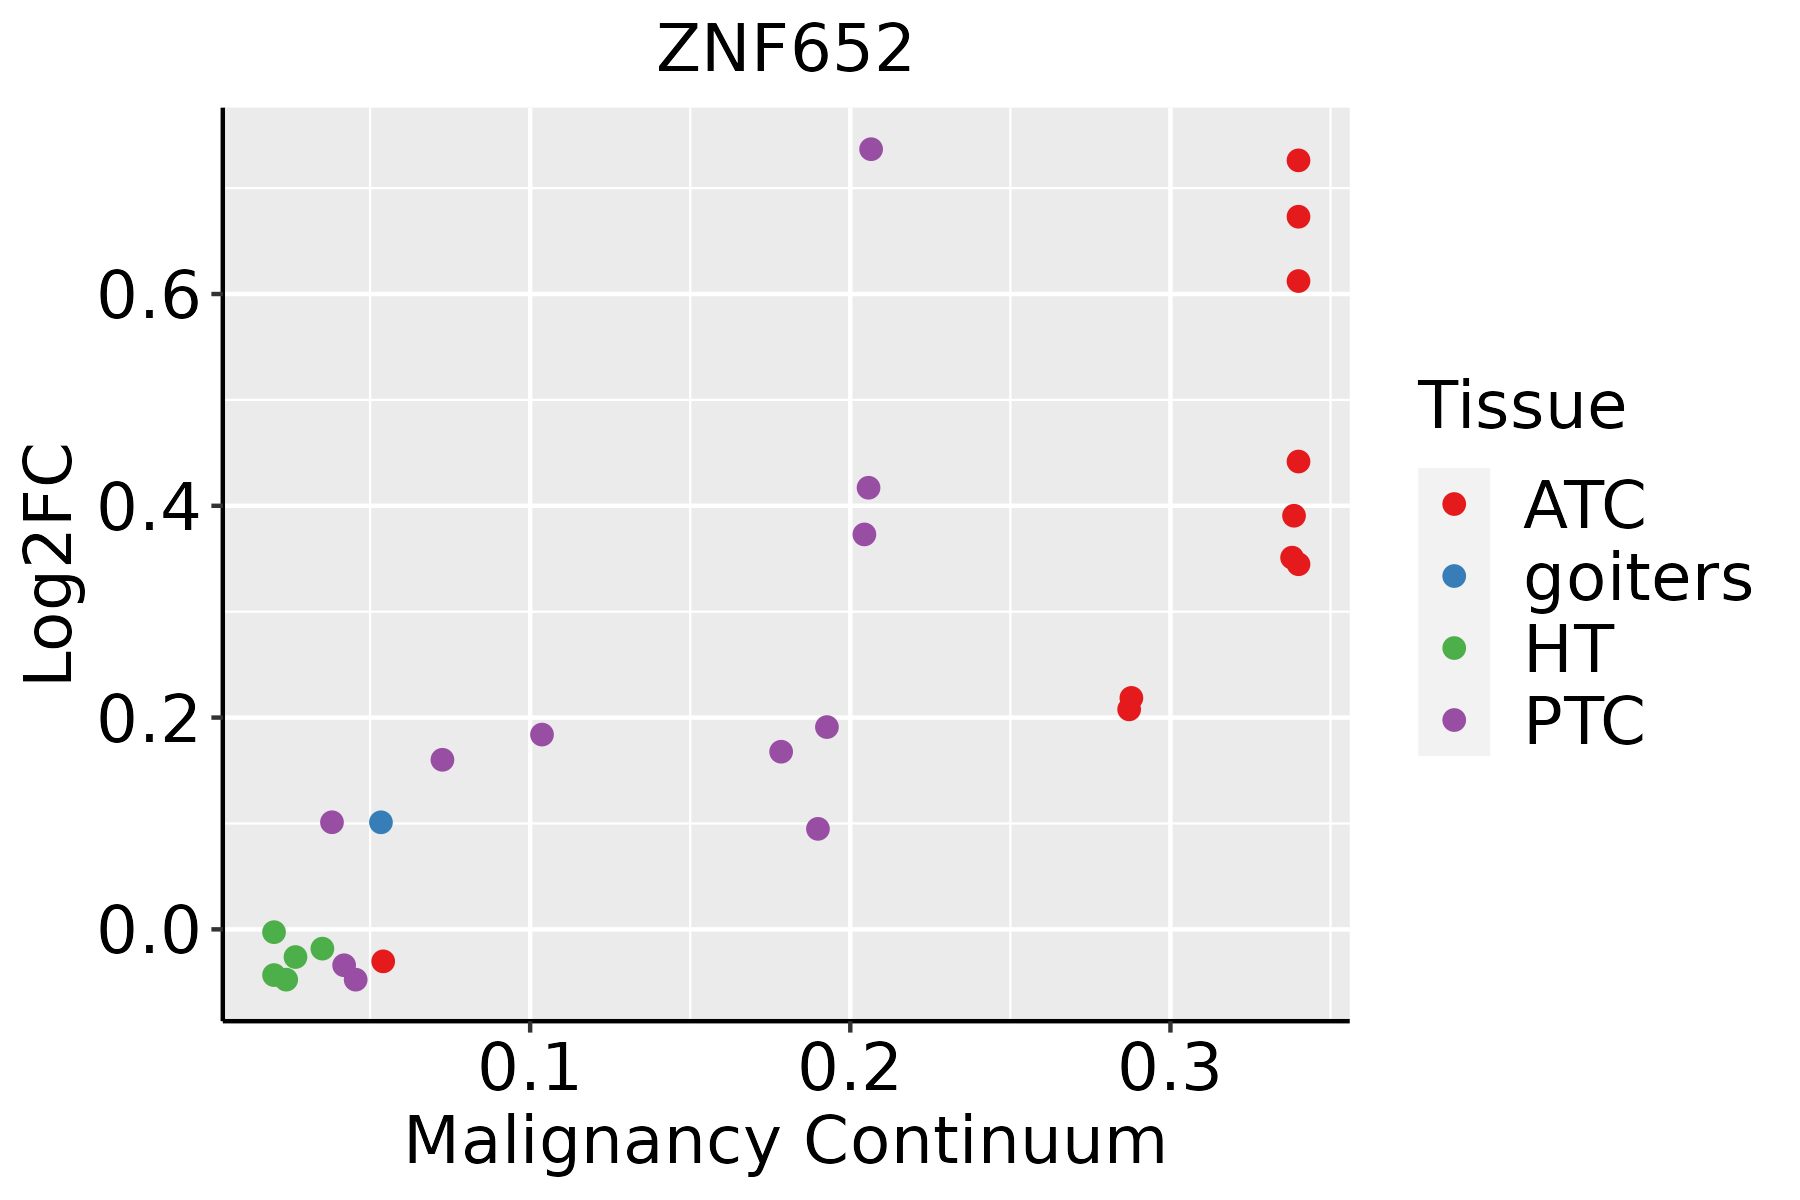 | ATC: Anaplastic thyroid cancer |
| HT: Hashimoto's thyroiditis | ||
| PTC: Papillary thyroid cancer |
| ∗log2FC in expression of this searched gene in stem-like cells from each diseased tissue sample relative to stem-like cells in normal samples in each tissue plotted against the malignancy continuum. Samples are colored based on if they are from different disease stage. |
Top |
Malignant transformation related pathway analysis |
| Find out the enriched GO biological processes and KEGG pathways involved in transition from healthy to precancer to cancer |
| Tissue | Disease Stage | Enriched GO biological Processes |
| Colorectum | AD |  |
| Colorectum | SER |  |
| Colorectum | MSS |  |
| Colorectum | MSI-H |  |
| Colorectum | FAP |  |
| ∗Top 15 enriched GO BP terms are showed in the bar plot of each disease state in each tissue. Each row represents a significant GO biological process which is colored according to the -log10(p.adjust). |
| Page: 1 2 3 4 5 6 7 8 9 |
| GO ID | Tissue | Disease Stage | Description | Gene Ratio | Bg Ratio | pvalue | p.adjust | Count |
| Page: 1 |
| Pathway ID | Tissue | Disease Stage | Description | Gene Ratio | Bg Ratio | pvalue | p.adjust | qvalue | Count |
| Page: 1 |
Top |
Cell-cell communication analysis |
| Identification of potential cell-cell interactions between two cell types and their ligand-receptor pairs for different disease states |
| Ligand | Receptor | LRpair | Pathway | Tissue | Disease Stage |
| Page: 1 |
Top |
Single-cell gene regulatory network inference analysis |
| Find out the significant the regulons (TFs) and the target genes of each regulon across cell types for different disease states |
| TF | Cell Type | Tissue | Disease Stage | Target Gene | RSS | Regulon Activity |
| ZNF652 | CD8TCM | Colorectum | AD | NUAK2,LETM1,AGAP4, etc. | 4.50e-02 |  |
| ZNF652 | TH17 | Colorectum | MSI-H | NUAK2,LETM1,AGAP4, etc. | 1.06e-01 |  |
| ZNF652 | STM | Endometrium | EEC | ENPP3,AC004797.1,NAAA, etc. | 4.88e-01 |  |
| ∗The dot plots of a searched regulon are shown for all cell subpopulations in each disease state of each tissue based on the regulon specific score inferred using pySCENIC and by calculating the average expression. |
| Page: 1 |
Top |
Somatic mutation of malignant transformation related genes |
| Annotation of somatic variants for genes involved in malignant transformation |
| Hugo Symbol | Variant Class | Variant Classification | dbSNP RS | HGVSc | HGVSp | HGVSp Short | SWISSPROT | BIOTYPE | SIFT | PolyPhen | Tumor Sample Barcode | Tissue | Histology | Sex | Age | Stage | Therapy Types | Drugs | Outcome |
| ZNF652 | SNV | Missense_Mutation | c.328N>A | p.Val110Ile | p.V110I | Q9Y2D9 | protein_coding | tolerated(0.23) | benign(0.046) | TCGA-A2-A0CP-01 | Breast | breast invasive carcinoma | Female | <65 | I/II | Chemotherapy | cytoxan | SD | |
| ZNF652 | SNV | Missense_Mutation | novel | c.220N>A | p.Glu74Lys | p.E74K | Q9Y2D9 | protein_coding | tolerated(0.62) | benign(0.026) | TCGA-AC-A23H-01 | Breast | breast invasive carcinoma | Female | >=65 | I/II | Unknown | Unknown | PD |
| ZNF652 | SNV | Missense_Mutation | rs537777094 | c.1621C>T | p.Arg541Trp | p.R541W | Q9Y2D9 | protein_coding | deleterious(0.01) | possibly_damaging(0.446) | TCGA-AC-A3YI-01 | Breast | breast invasive carcinoma | Female | >=65 | III/IV | Chemotherapy | cytoxan | CR |
| ZNF652 | SNV | Missense_Mutation | novel | c.1799N>C | p.Asn600Thr | p.N600T | Q9Y2D9 | protein_coding | tolerated_low_confidence(0.19) | benign(0) | TCGA-AN-A046-01 | Breast | breast invasive carcinoma | Female | >=65 | I/II | Unknown | Unknown | SD |
| ZNF652 | SNV | Missense_Mutation | c.286N>C | p.Asp96His | p.D96H | Q9Y2D9 | protein_coding | tolerated(0.08) | benign(0.275) | TCGA-BH-A0DZ-01 | Breast | breast invasive carcinoma | Female | <65 | I/II | Chemotherapy | docetaxel | SD | |
| ZNF652 | SNV | Missense_Mutation | c.1556T>C | p.Val519Ala | p.V519A | Q9Y2D9 | protein_coding | tolerated_low_confidence(0.82) | benign(0) | TCGA-E2-A15M-01 | Breast | breast invasive carcinoma | Female | >=65 | I/II | Hormone Therapy | arimidex | SD | |
| ZNF652 | SNV | Missense_Mutation | novel | c.694N>A | p.Ala232Thr | p.A232T | Q9Y2D9 | protein_coding | deleterious(0.01) | benign(0.054) | TCGA-2W-A8YY-01 | Cervix | cervical & endocervical cancer | Female | <65 | I/II | Chemotherapy | cisplatin | CR |
| ZNF652 | SNV | Missense_Mutation | c.1261G>T | p.Asp421Tyr | p.D421Y | Q9Y2D9 | protein_coding | deleterious(0.01) | probably_damaging(0.997) | TCGA-FU-A23L-01 | Cervix | cervical & endocervical cancer | Female | <65 | I/II | Chemotherapy | cisplatin | CR | |
| ZNF652 | SNV | Missense_Mutation | c.809G>A | p.Arg270His | p.R270H | Q9Y2D9 | protein_coding | deleterious(0.03) | probably_damaging(0.994) | TCGA-AA-3949-01 | Colorectum | colon adenocarcinoma | Female | >=65 | III/IV | Unknown | Unknown | SD | |
| ZNF652 | SNV | Missense_Mutation | rs770946812 | c.460G>A | p.Glu154Lys | p.E154K | Q9Y2D9 | protein_coding | tolerated(0.18) | benign(0.051) | TCGA-AA-3968-01 | Colorectum | colon adenocarcinoma | Female | <65 | I/II | Unknown | Unknown | SD |
| Page: 1 2 3 4 5 6 7 |
Top |
Related drugs of malignant transformation related genes |
| Identification of chemicals and drugs interact with genes involved in malignant transfromation |
| (DGIdb 4.0) |
| Entrez ID | Symbol | Category | Interaction Types | Drug Claim Name | Drug Name | PMIDs |
| Page: 1 |

Copyright 2023-Present -The University of Texas Health Science Center at Houston |