
|
|||||
|
 | |
| |
| |
| |
| |
| |
|
Gene: ZNF638 |
Gene summary for ZNF638 |
| Gene information | Species | Human | Gene symbol | ZNF638 | Gene ID | 27332 |
| Gene name | zinc finger protein 638 | |
| Gene Alias | NP220 | |
| Cytomap | 2p13.2 | |
| Gene Type | protein-coding | GO ID | GO:0006139 | UniProtAcc | Q14966 |
Top |
Malignant transformation analysis |
| Identification of the aberrant gene expression in precancerous and cancerous lesions by comparing the gene expression of stem-like cells in diseased tissues with normal stem cells |
| Entrez ID | Symbol | Replicates | Species | Organ | Tissue | Adj P-value | Log2FC | Malignancy |
| 27332 | ZNF638 | CA_HPV_1 | Human | Cervix | CC | 8.14e-04 | -1.07e-01 | 0.0264 |
| 27332 | ZNF638 | CA_HPV_3 | Human | Cervix | CC | 5.52e-04 | -2.42e-02 | 0.0414 |
| 27332 | ZNF638 | CCI_1 | Human | Cervix | CC | 4.75e-04 | 1.10e+00 | 0.528 |
| 27332 | ZNF638 | CCI_2 | Human | Cervix | CC | 2.78e-04 | 7.13e-01 | 0.5249 |
| 27332 | ZNF638 | CCI_3 | Human | Cervix | CC | 5.11e-18 | 1.24e+00 | 0.516 |
| 27332 | ZNF638 | HTA11_3410_2000001011 | Human | Colorectum | AD | 3.37e-32 | -7.60e-01 | 0.0155 |
| 27332 | ZNF638 | HTA11_2487_2000001011 | Human | Colorectum | SER | 1.31e-12 | -5.86e-01 | -0.1808 |
| 27332 | ZNF638 | HTA11_2951_2000001011 | Human | Colorectum | AD | 3.75e-03 | -7.65e-01 | 0.0216 |
| 27332 | ZNF638 | HTA11_2112_2000001011 | Human | Colorectum | SER | 4.34e-03 | -5.94e-01 | -0.2196 |
| 27332 | ZNF638 | HTA11_3361_2000001011 | Human | Colorectum | AD | 7.03e-12 | -6.70e-01 | -0.1207 |
| 27332 | ZNF638 | HTA11_83_2000001011 | Human | Colorectum | SER | 4.43e-03 | -4.20e-01 | -0.1526 |
| 27332 | ZNF638 | HTA11_696_2000001011 | Human | Colorectum | AD | 1.85e-17 | -5.16e-01 | -0.1464 |
| 27332 | ZNF638 | HTA11_866_2000001011 | Human | Colorectum | AD | 1.05e-13 | -4.59e-01 | -0.1001 |
| 27332 | ZNF638 | HTA11_5212_2000001011 | Human | Colorectum | AD | 1.45e-04 | -7.32e-01 | -0.2061 |
| 27332 | ZNF638 | HTA11_5216_2000001011 | Human | Colorectum | SER | 1.28e-02 | -6.39e-01 | -0.1462 |
| 27332 | ZNF638 | HTA11_9341_2000001011 | Human | Colorectum | SER | 6.69e-03 | -8.99e-01 | -0.00410000000000005 |
| 27332 | ZNF638 | HTA11_7862_2000001011 | Human | Colorectum | AD | 1.65e-04 | -5.41e-01 | -0.0179 |
| 27332 | ZNF638 | HTA11_866_3004761011 | Human | Colorectum | AD | 3.11e-17 | -6.86e-01 | 0.096 |
| 27332 | ZNF638 | HTA11_9408_2000001011 | Human | Colorectum | AD | 2.17e-03 | -7.50e-01 | 0.0451 |
| 27332 | ZNF638 | HTA11_8622_2000001021 | Human | Colorectum | SER | 3.39e-06 | -6.79e-01 | 0.0528 |
| Page: 1 2 3 4 5 6 7 8 9 10 11 12 |
| Tissue | Expression Dynamics | Abbreviation |
| Cervix |  | CC: Cervix cancer |
| HSIL_HPV: HPV-infected high-grade squamous intraepithelial lesions | ||
| N_HPV: HPV-infected normal cervix | ||
| Colorectum (GSE201348) |  | FAP: Familial adenomatous polyposis |
| CRC: Colorectal cancer | ||
| Colorectum (HTA11) |  | AD: Adenomas |
| SER: Sessile serrated lesions | ||
| MSI-H: Microsatellite-high colorectal cancer | ||
| MSS: Microsatellite stable colorectal cancer | ||
| Esophagus | 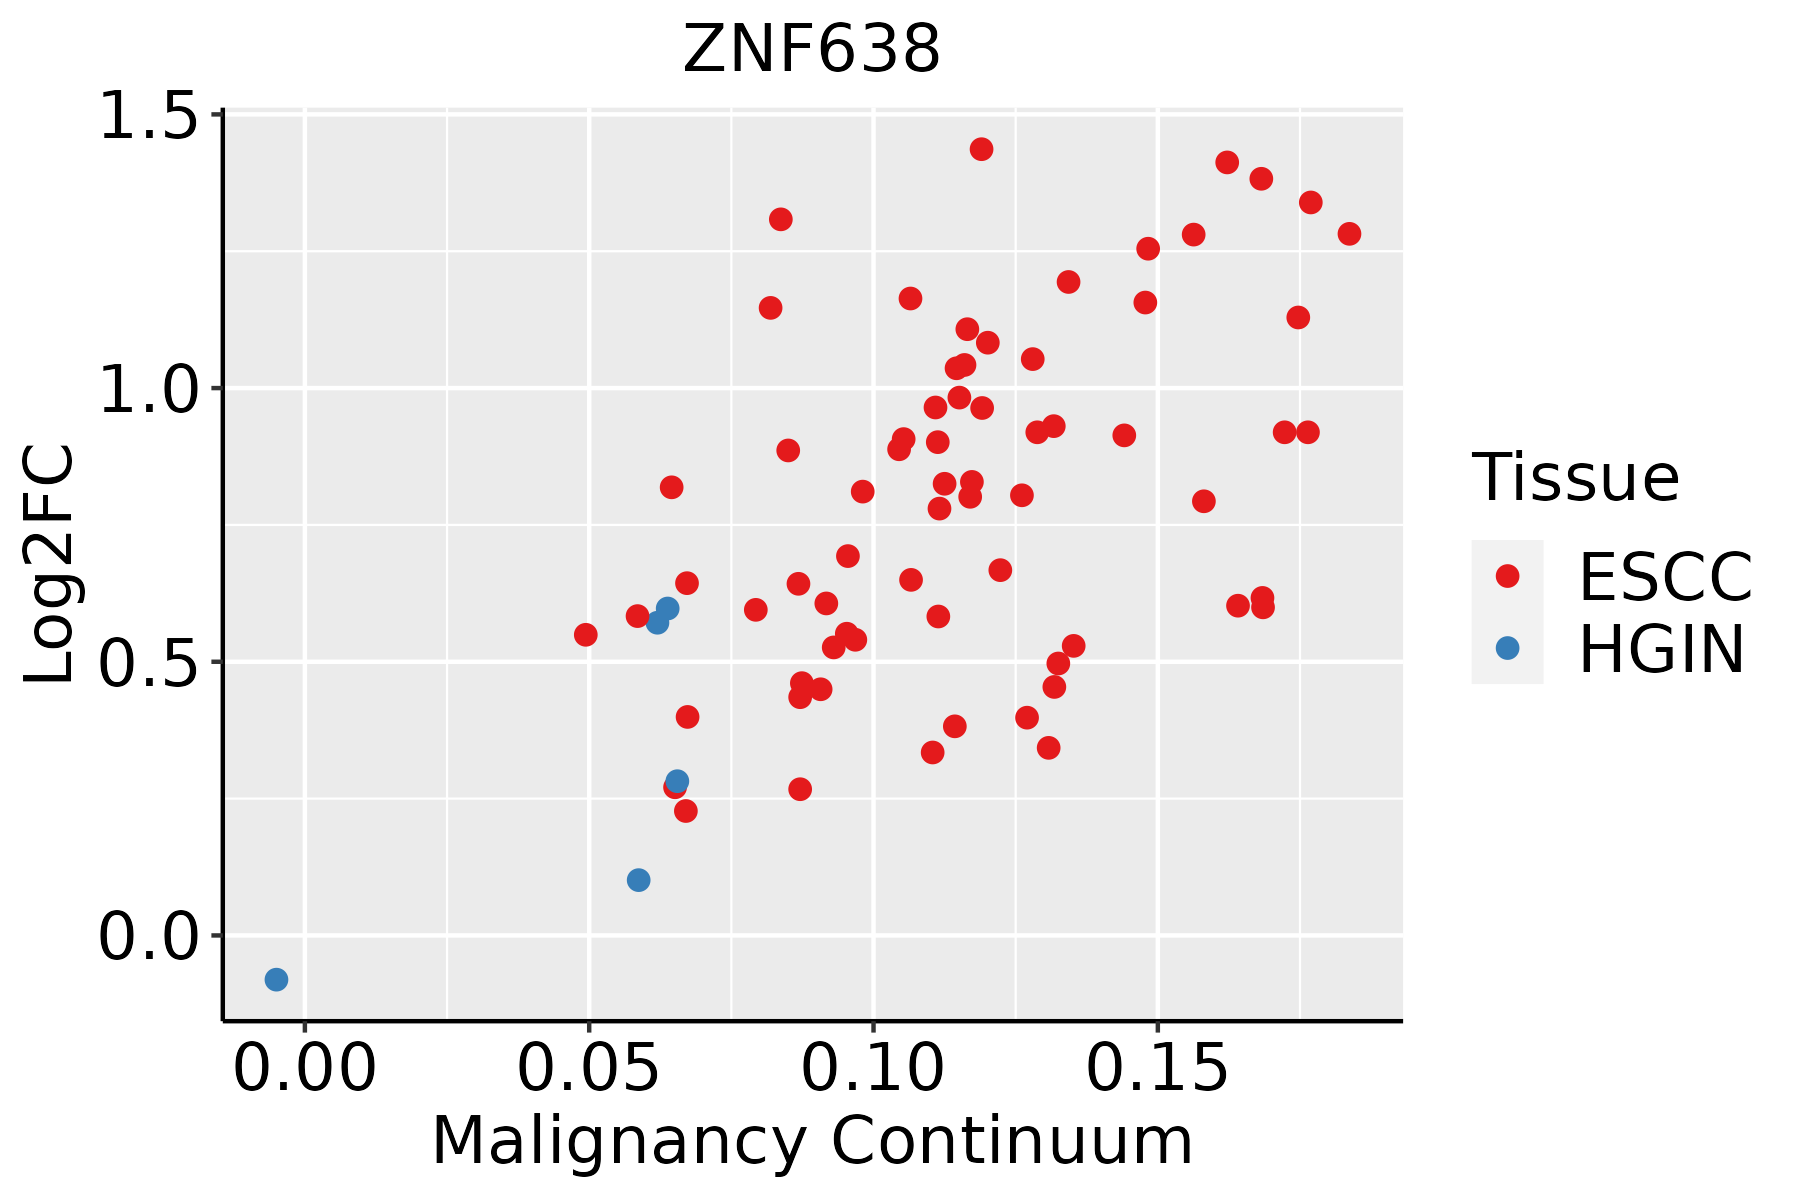 | ESCC: Esophageal squamous cell carcinoma |
| HGIN: High-grade intraepithelial neoplasias | ||
| LGIN: Low-grade intraepithelial neoplasias | ||
| Liver | 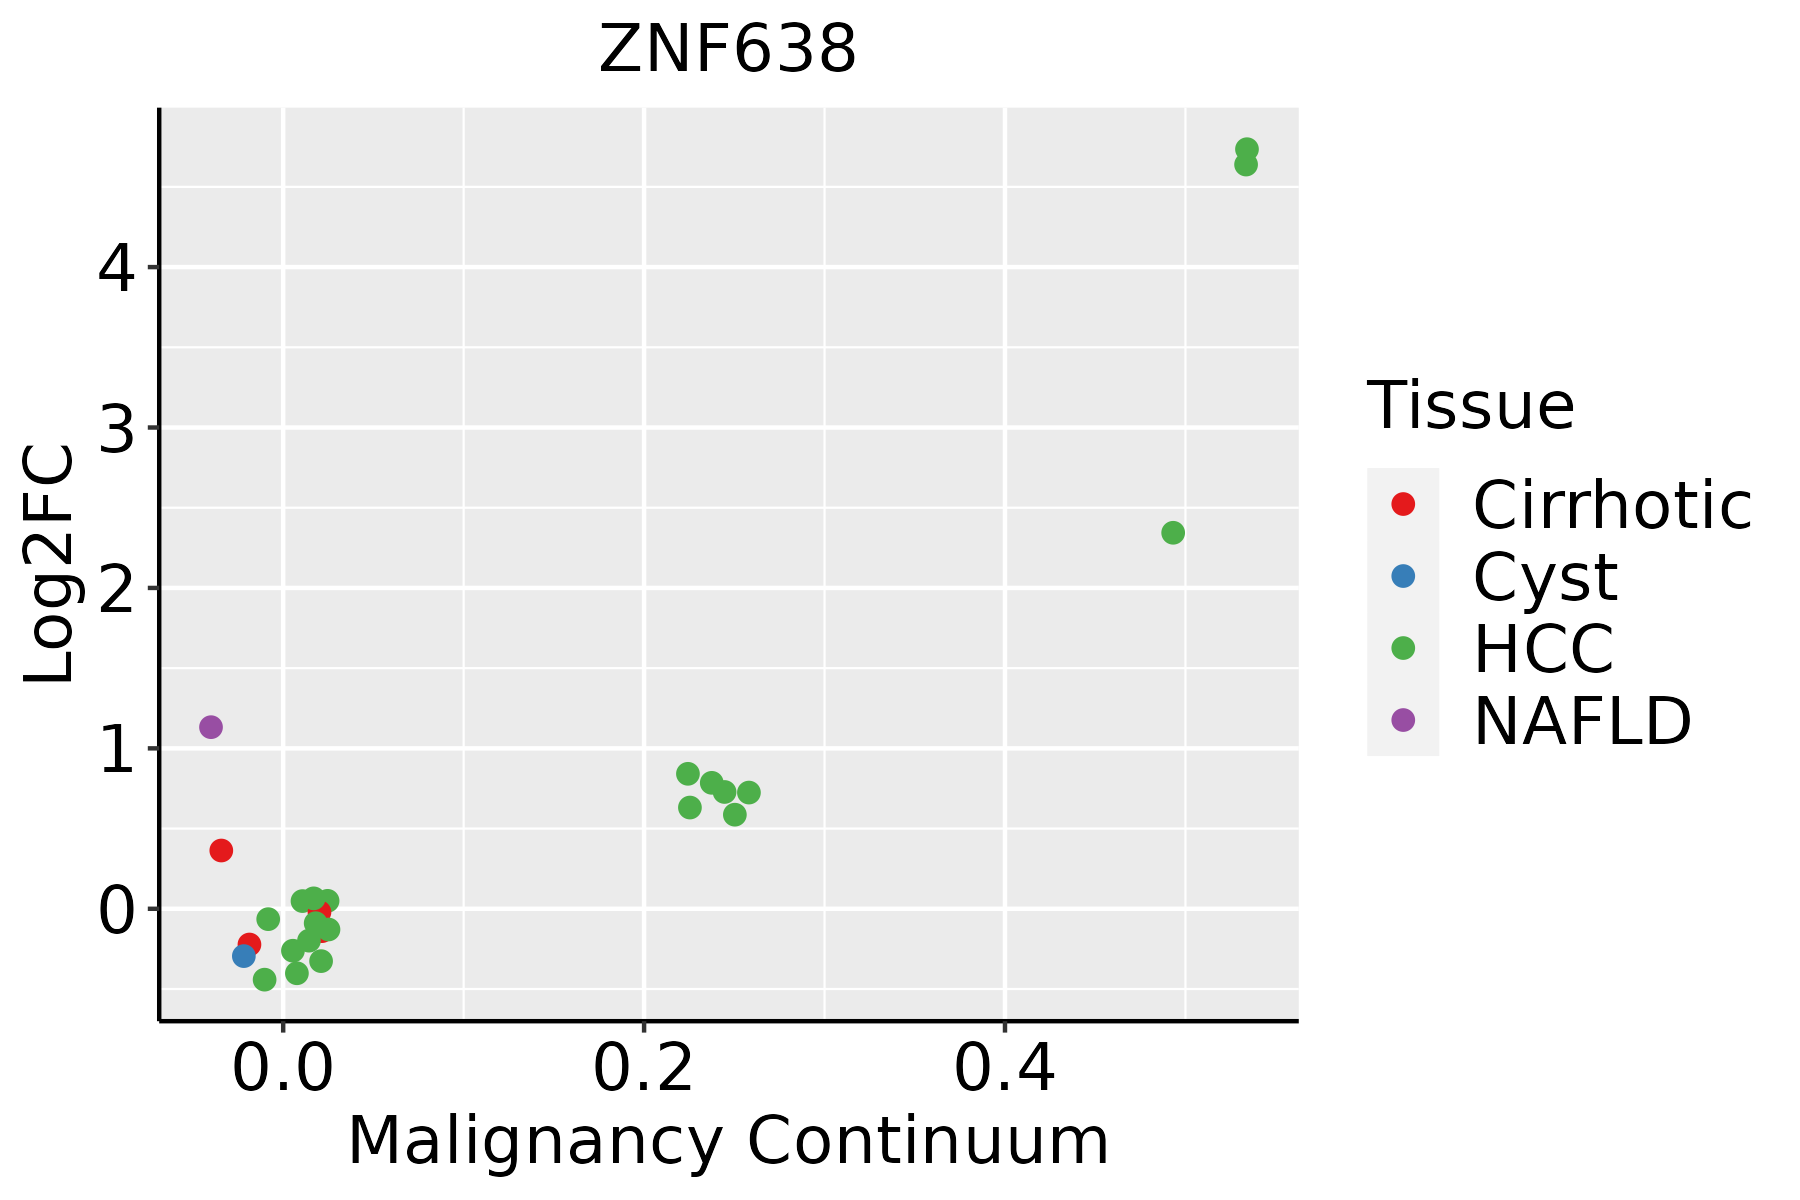 | HCC: Hepatocellular carcinoma |
| NAFLD: Non-alcoholic fatty liver disease | ||
| Lung |  | AAH: Atypical adenomatous hyperplasia |
| AIS: Adenocarcinoma in situ | ||
| IAC: Invasive lung adenocarcinoma | ||
| MIA: Minimally invasive adenocarcinoma | ||
| Oral Cavity | 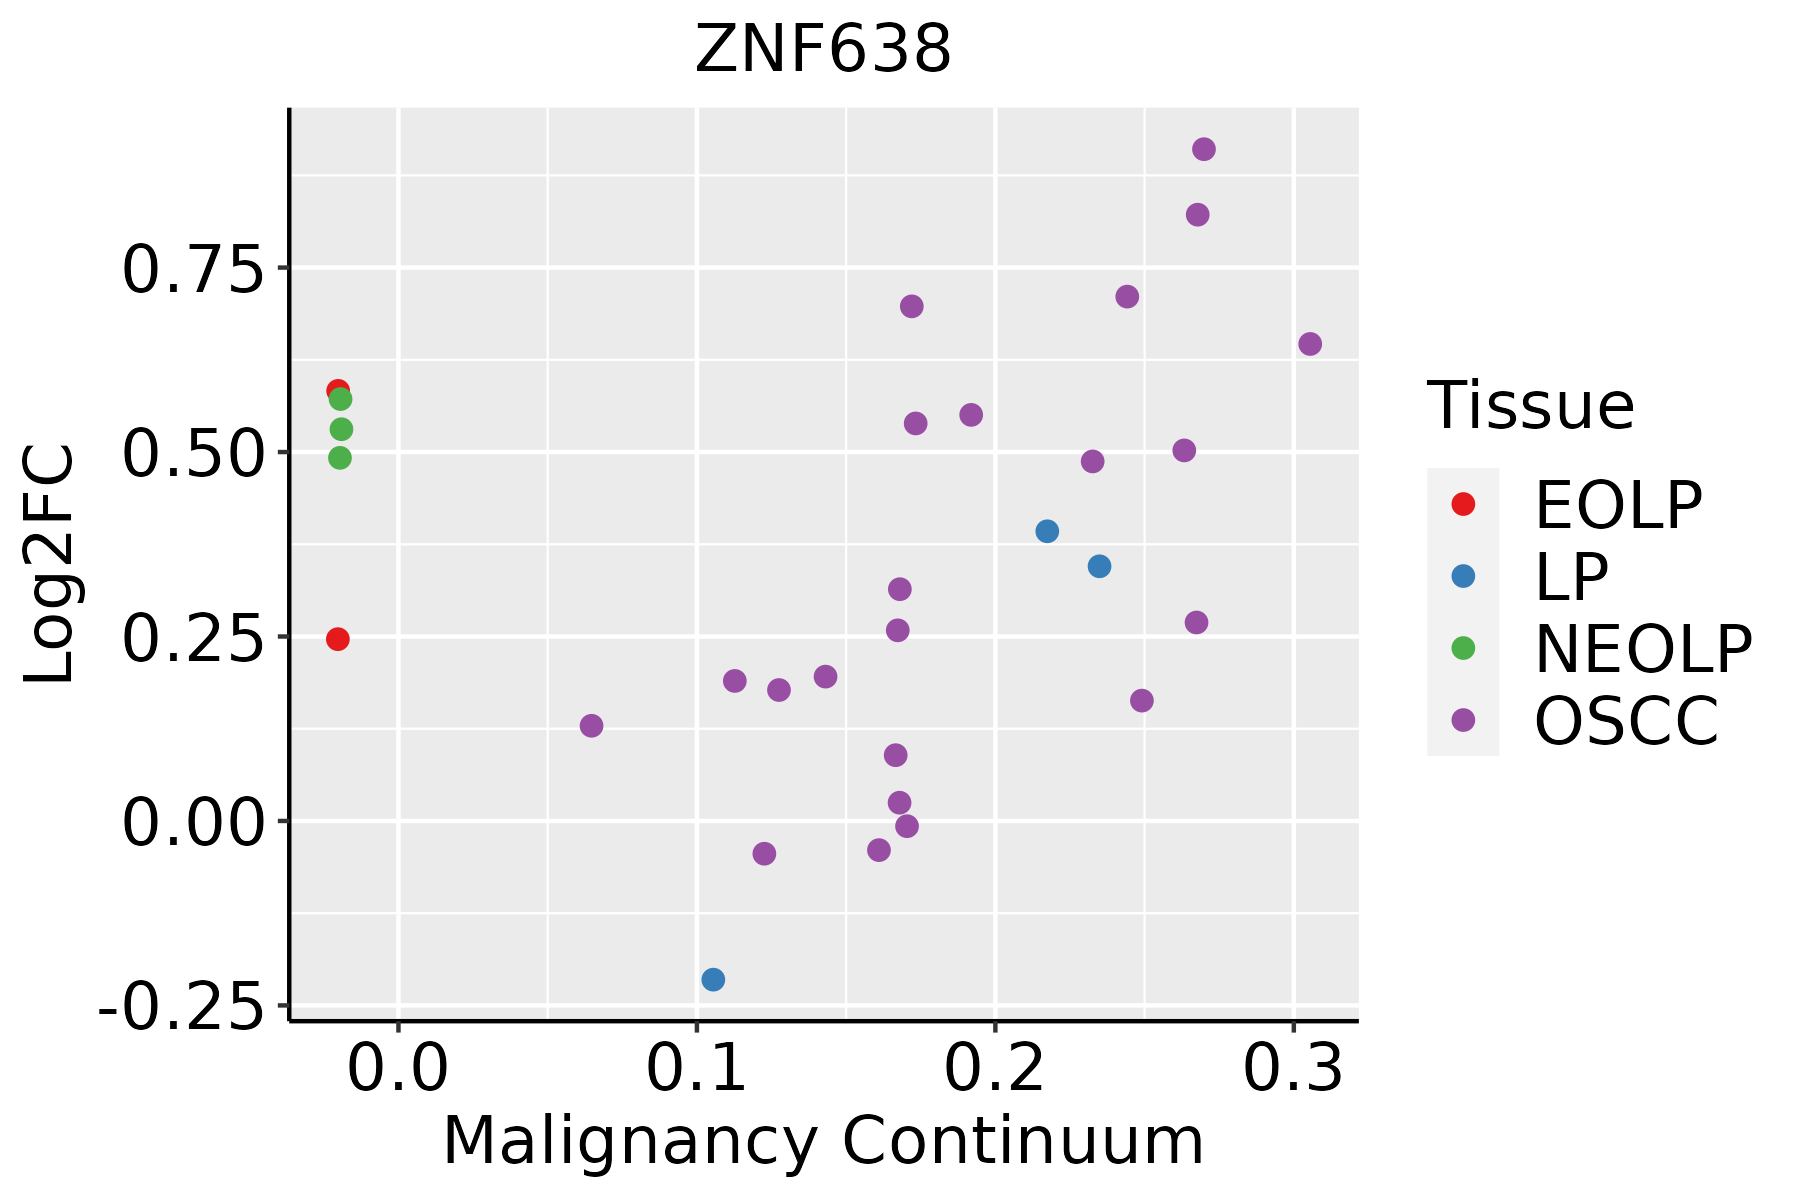 | EOLP: Erosive Oral lichen planus |
| LP: leukoplakia | ||
| NEOLP: Non-erosive oral lichen planus | ||
| OSCC: Oral squamous cell carcinoma | ||
| Prostate | 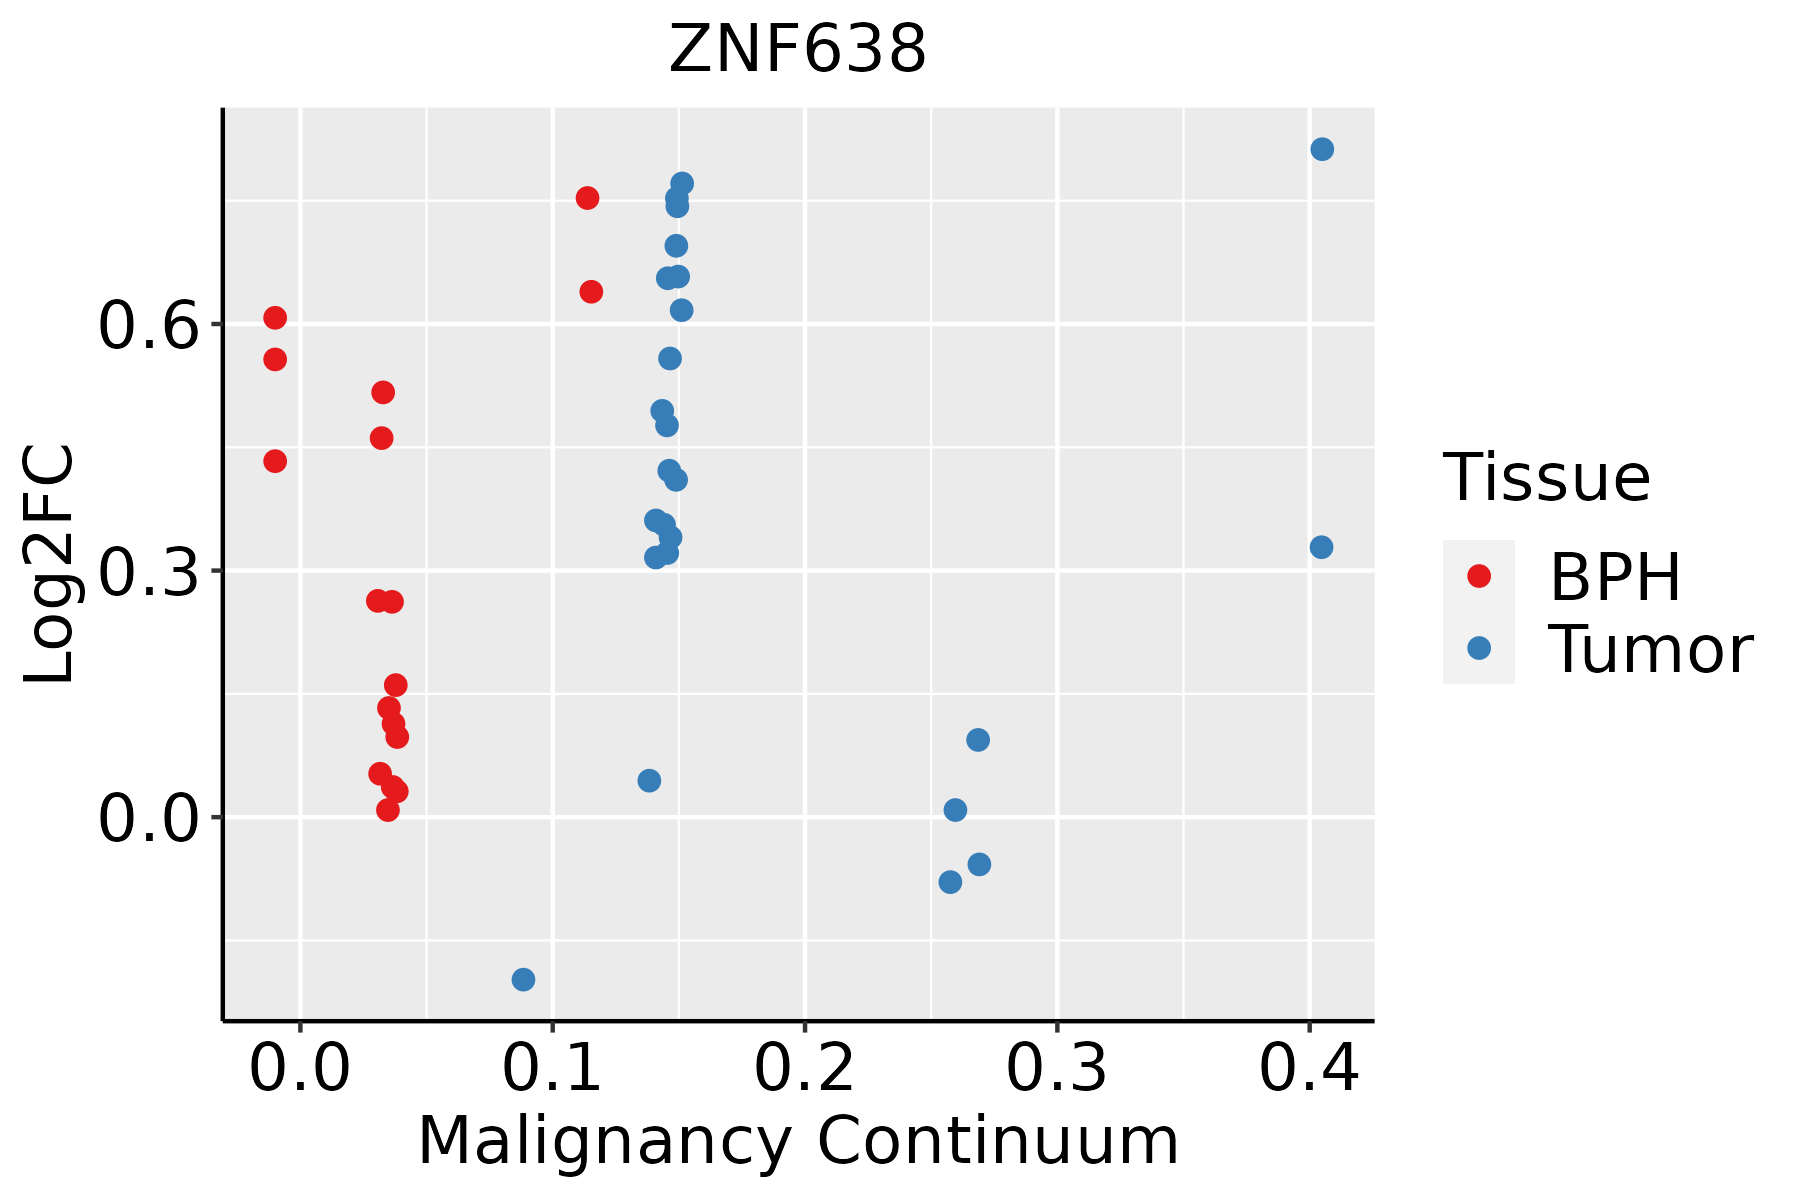 | BPH: Benign Prostatic Hyperplasia |
| Skin |  | AK: Actinic keratosis |
| cSCC: Cutaneous squamous cell carcinoma | ||
| SCCIS:squamous cell carcinoma in situ | ||
| Thyroid | 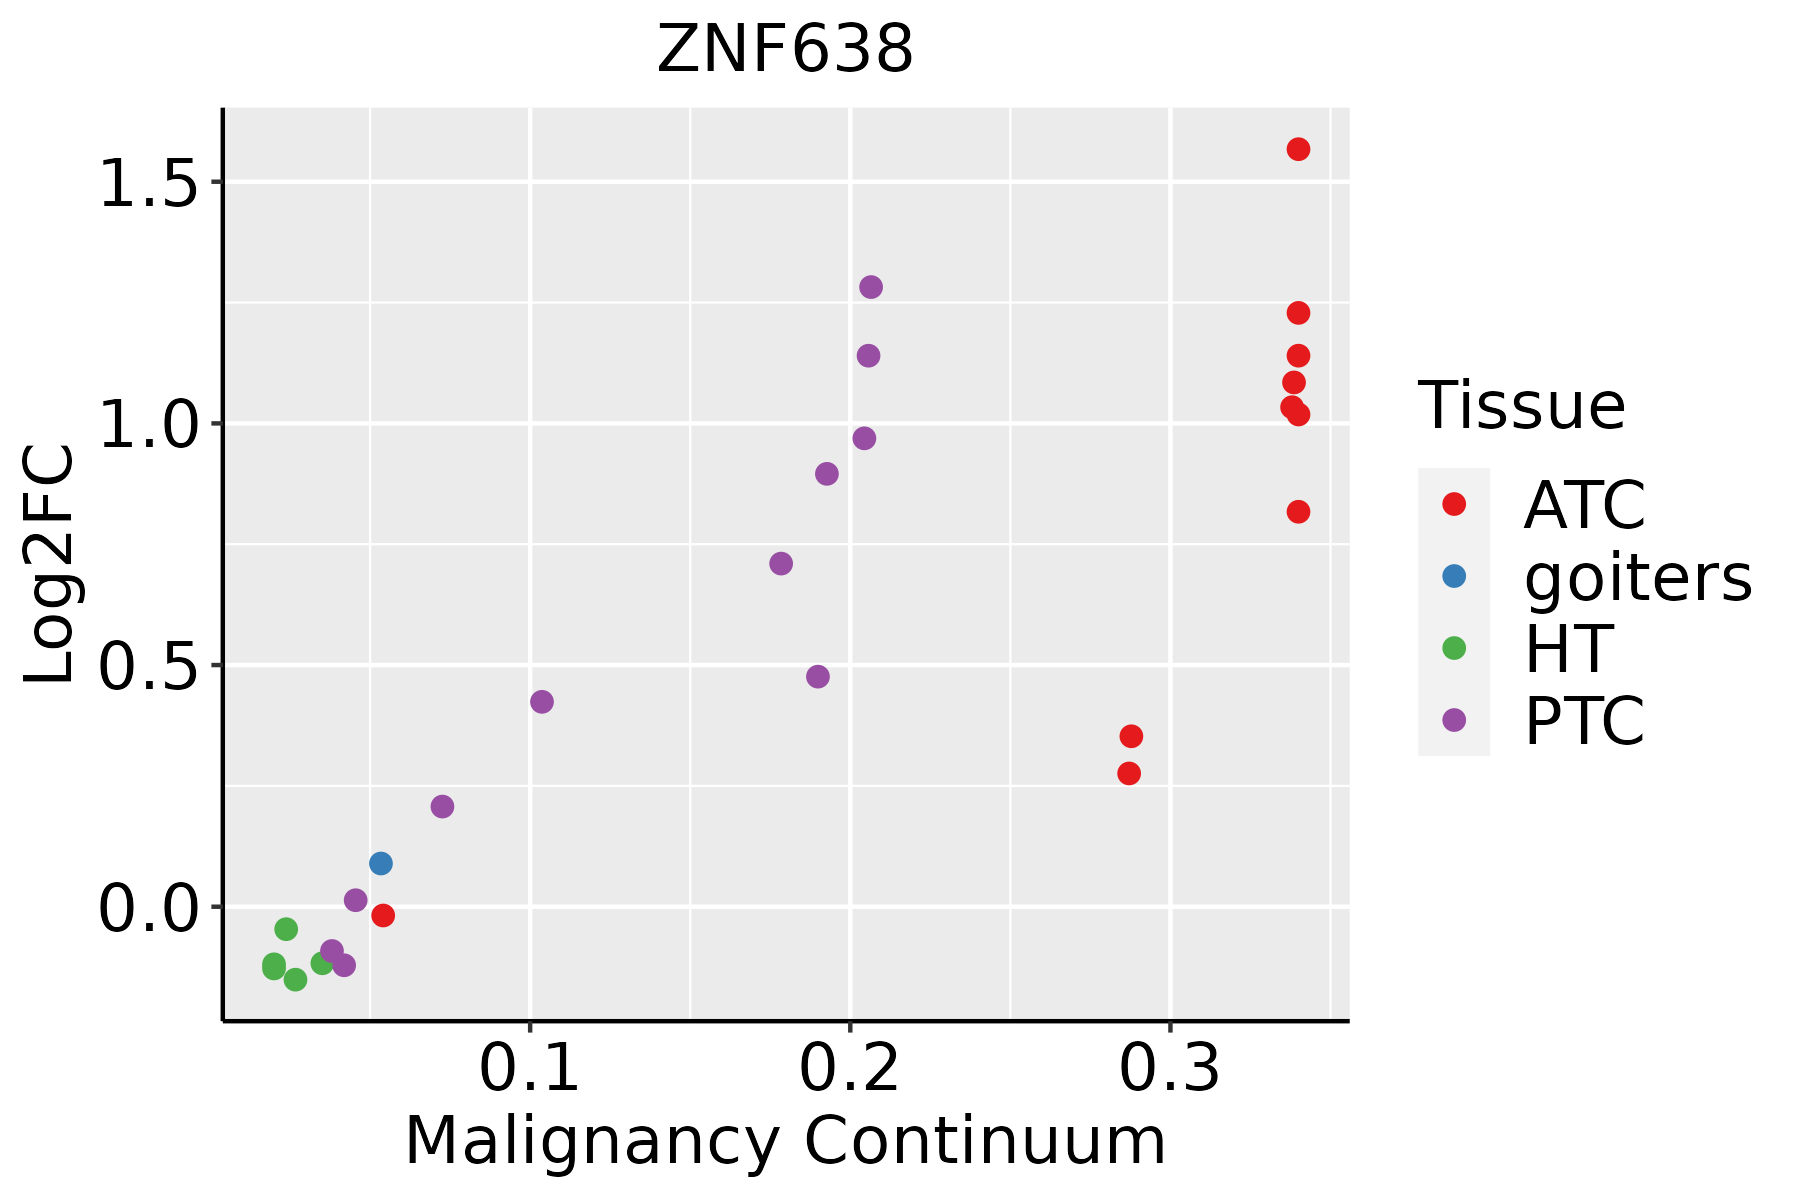 | ATC: Anaplastic thyroid cancer |
| HT: Hashimoto's thyroiditis | ||
| PTC: Papillary thyroid cancer |
| ∗log2FC in expression of this searched gene in stem-like cells from each diseased tissue sample relative to stem-like cells in normal samples in each tissue plotted against the malignancy continuum. Samples are colored based on if they are from different disease stage. |
Top |
Malignant transformation related pathway analysis |
| Find out the enriched GO biological processes and KEGG pathways involved in transition from healthy to precancer to cancer |
| Tissue | Disease Stage | Enriched GO biological Processes |
| Colorectum | AD |  |
| Colorectum | SER |  |
| Colorectum | MSS |  |
| Colorectum | MSI-H |  |
| Colorectum | FAP |  |
| ∗Top 15 enriched GO BP terms are showed in the bar plot of each disease state in each tissue. Each row represents a significant GO biological process which is colored according to the -log10(p.adjust). |
| Page: 1 2 3 4 5 6 7 8 9 |
| GO ID | Tissue | Disease Stage | Description | Gene Ratio | Bg Ratio | pvalue | p.adjust | Count |
| GO:000838010 | Cervix | CC | RNA splicing | 76/2311 | 434/18723 | 9.79e-04 | 8.19e-03 | 76 |
| GO:0008380 | Colorectum | AD | RNA splicing | 169/3918 | 434/18723 | 3.59e-18 | 2.04e-15 | 169 |
| GO:00083801 | Colorectum | SER | RNA splicing | 123/2897 | 434/18723 | 3.84e-12 | 8.41e-10 | 123 |
| GO:00083802 | Colorectum | MSS | RNA splicing | 159/3467 | 434/18723 | 1.75e-19 | 1.22e-16 | 159 |
| GO:00083804 | Colorectum | FAP | RNA splicing | 108/2622 | 434/18723 | 7.90e-10 | 1.86e-07 | 108 |
| GO:00083805 | Colorectum | CRC | RNA splicing | 90/2078 | 434/18723 | 2.80e-09 | 7.97e-07 | 90 |
| GO:000838026 | Esophagus | HGIN | RNA splicing | 160/2587 | 434/18723 | 3.74e-34 | 1.12e-30 | 160 |
| GO:0008380111 | Esophagus | ESCC | RNA splicing | 336/8552 | 434/18723 | 1.74e-42 | 3.67e-39 | 336 |
| GO:00083807 | Liver | NAFLD | RNA splicing | 70/1882 | 434/18723 | 4.62e-05 | 1.10e-03 | 70 |
| GO:000838012 | Liver | Cirrhotic | RNA splicing | 229/4634 | 434/18723 | 9.13e-37 | 2.86e-33 | 229 |
| GO:000838022 | Liver | HCC | RNA splicing | 313/7958 | 434/18723 | 1.36e-36 | 1.73e-33 | 313 |
| GO:00083808 | Lung | IAC | RNA splicing | 75/2061 | 434/18723 | 4.89e-05 | 1.12e-03 | 75 |
| GO:000838013 | Lung | AIS | RNA splicing | 68/1849 | 434/18723 | 8.50e-05 | 2.11e-03 | 68 |
| GO:000838023 | Lung | MIAC | RNA splicing | 44/967 | 434/18723 | 1.56e-05 | 1.07e-03 | 44 |
| GO:000838020 | Oral cavity | OSCC | RNA splicing | 308/7305 | 434/18723 | 2.43e-42 | 7.70e-39 | 308 |
| GO:000838025 | Oral cavity | EOLP | RNA splicing | 115/2218 | 434/18723 | 2.24e-17 | 3.04e-14 | 115 |
| GO:000838033 | Oral cavity | NEOLP | RNA splicing | 110/2005 | 434/18723 | 2.29e-18 | 2.72e-15 | 110 |
| GO:000838018 | Prostate | BPH | RNA splicing | 147/3107 | 434/18723 | 5.17e-19 | 2.29e-16 | 147 |
| GO:000838019 | Prostate | Tumor | RNA splicing | 153/3246 | 434/18723 | 9.15e-20 | 5.79e-17 | 153 |
| GO:000838027 | Skin | AK | RNA splicing | 111/1910 | 434/18723 | 1.85e-20 | 5.49e-17 | 111 |
| Page: 1 2 |
| Pathway ID | Tissue | Disease Stage | Description | Gene Ratio | Bg Ratio | pvalue | p.adjust | qvalue | Count |
| Page: 1 |
Top |
Cell-cell communication analysis |
| Identification of potential cell-cell interactions between two cell types and their ligand-receptor pairs for different disease states |
| Ligand | Receptor | LRpair | Pathway | Tissue | Disease Stage |
| Page: 1 |
Top |
Single-cell gene regulatory network inference analysis |
| Find out the significant the regulons (TFs) and the target genes of each regulon across cell types for different disease states |
| TF | Cell Type | Tissue | Disease Stage | Target Gene | RSS | Regulon Activity |
| ∗The dot plots of a searched regulon are shown for all cell subpopulations in each disease state of each tissue based on the regulon specific score inferred using pySCENIC and by calculating the average expression. |
| Page: 1 |
Top |
Somatic mutation of malignant transformation related genes |
| Annotation of somatic variants for genes involved in malignant transformation |
| Hugo Symbol | Variant Class | Variant Classification | dbSNP RS | HGVSc | HGVSp | HGVSp Short | SWISSPROT | BIOTYPE | SIFT | PolyPhen | Tumor Sample Barcode | Tissue | Histology | Sex | Age | Stage | Therapy Types | Drugs | Outcome |
| ZNF638 | SNV | Missense_Mutation | c.2614G>C | p.Glu872Gln | p.E872Q | Q14966 | protein_coding | deleterious(0.02) | possibly_damaging(0.494) | TCGA-A8-A08R-01 | Breast | breast invasive carcinoma | Female | <65 | I/II | Unknown | Unknown | SD | |
| ZNF638 | SNV | Missense_Mutation | c.4453N>C | p.Asp1485His | p.D1485H | Q14966 | protein_coding | tolerated(0.09) | probably_damaging(0.921) | TCGA-AC-A23H-01 | Breast | breast invasive carcinoma | Female | >=65 | I/II | Unknown | Unknown | PD | |
| ZNF638 | SNV | Missense_Mutation | c.5347N>A | p.Glu1783Lys | p.E1783K | Q14966 | protein_coding | deleterious(0) | probably_damaging(0.994) | TCGA-AC-A23H-01 | Breast | breast invasive carcinoma | Female | >=65 | I/II | Unknown | Unknown | PD | |
| ZNF638 | SNV | Missense_Mutation | rs141845828 | c.784A>G | p.Met262Val | p.M262V | Q14966 | protein_coding | tolerated(0.82) | benign(0) | TCGA-AC-A2QI-01 | Breast | breast invasive carcinoma | Female | >=65 | III/IV | Chemotherapy | cytoxan | CR |
| ZNF638 | SNV | Missense_Mutation | novel | c.3142N>A | p.Leu1048Ile | p.L1048I | Q14966 | protein_coding | tolerated(0.06) | benign(0.388) | TCGA-AN-A046-01 | Breast | breast invasive carcinoma | Female | >=65 | I/II | Unknown | Unknown | SD |
| ZNF638 | SNV | Missense_Mutation | c.5252N>G | p.Leu1751Trp | p.L1751W | Q14966 | protein_coding | deleterious(0) | probably_damaging(0.999) | TCGA-AN-A0AK-01 | Breast | breast invasive carcinoma | Female | >=65 | I/II | Unknown | Unknown | SD | |
| ZNF638 | SNV | Missense_Mutation | c.522N>C | p.Leu174Phe | p.L174F | Q14966 | protein_coding | deleterious(0) | probably_damaging(0.994) | TCGA-BH-A0HP-01 | Breast | breast invasive carcinoma | Female | >=65 | III/IV | Chemotherapy | doxorubicin | SD | |
| ZNF638 | SNV | Missense_Mutation | c.3433G>C | p.Glu1145Gln | p.E1145Q | Q14966 | protein_coding | tolerated(0.05) | benign(0.119) | TCGA-D8-A27G-01 | Breast | breast invasive carcinoma | Female | >=65 | I/II | Unknown | Unknown | SD | |
| ZNF638 | SNV | Missense_Mutation | c.4772N>A | p.Gly1591Asp | p.G1591D | Q14966 | protein_coding | deleterious(0.01) | benign(0.074) | TCGA-BI-A0VS-01 | Cervix | cervical & endocervical cancer | Female | <65 | I/II | Unknown | Unknown | SD | |
| ZNF638 | SNV | Missense_Mutation | rs763709853 | c.3500N>C | p.Leu1167Pro | p.L1167P | Q14966 | protein_coding | deleterious(0.04) | benign(0.121) | TCGA-C5-A2LX-01 | Cervix | cervical & endocervical cancer | Female | <65 | I/II | Chemotherapy | cisplatin | SD |
| Page: 1 2 3 4 5 6 7 8 9 10 11 12 13 14 15 16 17 18 19 20 |
Top |
Related drugs of malignant transformation related genes |
| Identification of chemicals and drugs interact with genes involved in malignant transfromation |
| (DGIdb 4.0) |
| Entrez ID | Symbol | Category | Interaction Types | Drug Claim Name | Drug Name | PMIDs |
| Page: 1 |

Copyright 2023-Present -The University of Texas Health Science Center at Houston |