
|
|||||
|
 | |
| |
| |
| |
| |
| |
|
Gene: ZNF622 |
Gene summary for ZNF622 |
| Gene information | Species | Human | Gene symbol | ZNF622 | Gene ID | 90441 |
| Gene name | zinc finger protein 622 | |
| Gene Alias | ZPR9 | |
| Cytomap | 5p15.1 | |
| Gene Type | protein-coding | GO ID | GO:0000165 | UniProtAcc | Q969S3 |
Top |
Malignant transformation analysis |
| Identification of the aberrant gene expression in precancerous and cancerous lesions by comparing the gene expression of stem-like cells in diseased tissues with normal stem cells |
| Entrez ID | Symbol | Replicates | Species | Organ | Tissue | Adj P-value | Log2FC | Malignancy |
| 90441 | ZNF622 | LZE4T | Human | Esophagus | ESCC | 1.98e-11 | 4.82e-01 | 0.0811 |
| 90441 | ZNF622 | LZE7T | Human | Esophagus | ESCC | 5.90e-09 | 5.04e-01 | 0.0667 |
| 90441 | ZNF622 | LZE8T | Human | Esophagus | ESCC | 4.53e-04 | 1.10e-01 | 0.067 |
| 90441 | ZNF622 | LZE20T | Human | Esophagus | ESCC | 7.88e-08 | 3.00e-01 | 0.0662 |
| 90441 | ZNF622 | LZE24T | Human | Esophagus | ESCC | 1.85e-06 | 2.06e-01 | 0.0596 |
| 90441 | ZNF622 | LZE6T | Human | Esophagus | ESCC | 4.19e-06 | 3.48e-01 | 0.0845 |
| 90441 | ZNF622 | P1T-E | Human | Esophagus | ESCC | 1.64e-12 | 6.21e-01 | 0.0875 |
| 90441 | ZNF622 | P2T-E | Human | Esophagus | ESCC | 4.85e-21 | 2.14e-01 | 0.1177 |
| 90441 | ZNF622 | P4T-E | Human | Esophagus | ESCC | 3.68e-30 | 6.35e-01 | 0.1323 |
| 90441 | ZNF622 | P5T-E | Human | Esophagus | ESCC | 9.91e-29 | 6.31e-01 | 0.1327 |
| 90441 | ZNF622 | P8T-E | Human | Esophagus | ESCC | 2.98e-27 | 7.16e-01 | 0.0889 |
| 90441 | ZNF622 | P9T-E | Human | Esophagus | ESCC | 1.67e-13 | 3.45e-01 | 0.1131 |
| 90441 | ZNF622 | P10T-E | Human | Esophagus | ESCC | 1.62e-24 | 5.17e-01 | 0.116 |
| 90441 | ZNF622 | P11T-E | Human | Esophagus | ESCC | 2.02e-25 | 8.95e-01 | 0.1426 |
| 90441 | ZNF622 | P12T-E | Human | Esophagus | ESCC | 2.00e-23 | 5.09e-01 | 0.1122 |
| 90441 | ZNF622 | P15T-E | Human | Esophagus | ESCC | 8.25e-19 | 3.02e-01 | 0.1149 |
| 90441 | ZNF622 | P16T-E | Human | Esophagus | ESCC | 4.80e-12 | 2.28e-01 | 0.1153 |
| 90441 | ZNF622 | P17T-E | Human | Esophagus | ESCC | 1.99e-14 | 6.89e-01 | 0.1278 |
| 90441 | ZNF622 | P19T-E | Human | Esophagus | ESCC | 9.85e-08 | 8.05e-01 | 0.1662 |
| 90441 | ZNF622 | P20T-E | Human | Esophagus | ESCC | 1.43e-20 | 5.20e-01 | 0.1124 |
| Page: 1 2 3 4 5 6 |
| Tissue | Expression Dynamics | Abbreviation |
| Esophagus | 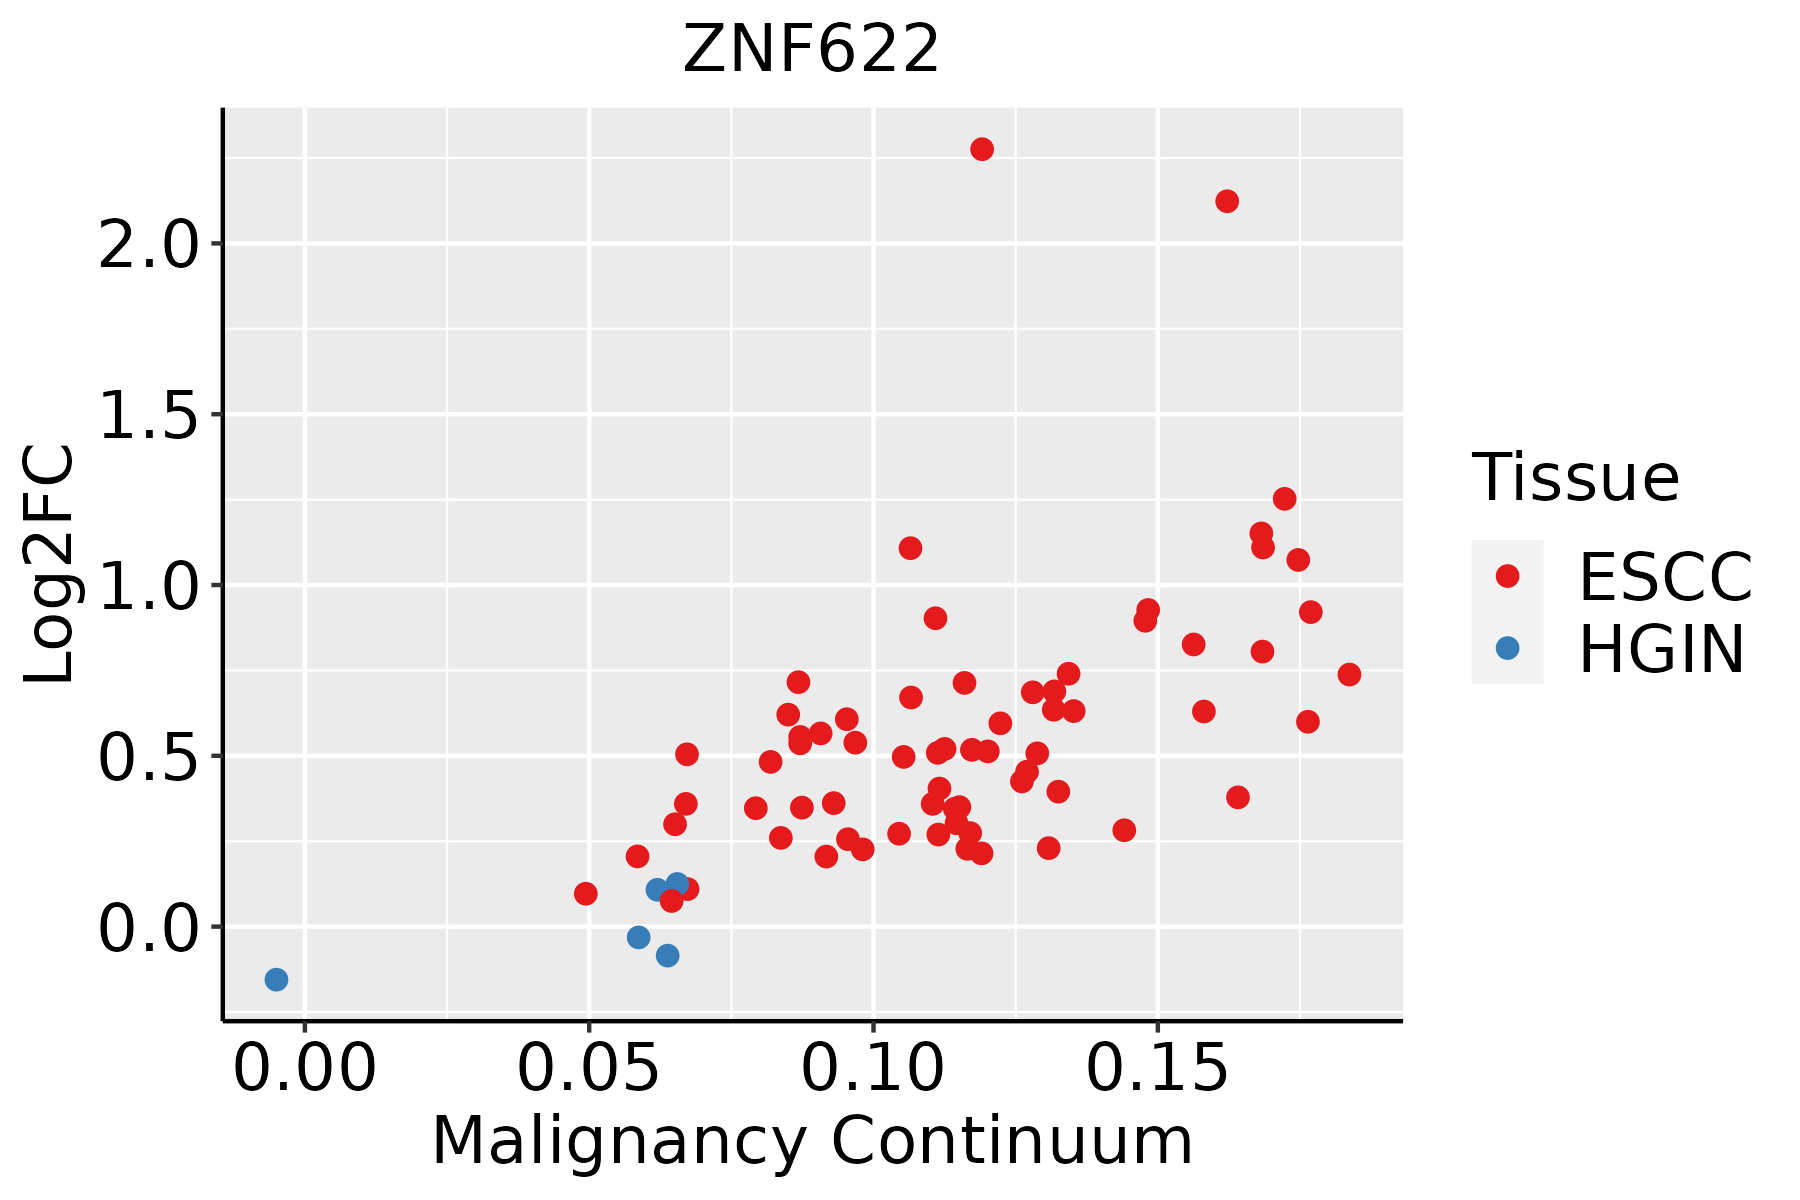 | ESCC: Esophageal squamous cell carcinoma |
| HGIN: High-grade intraepithelial neoplasias | ||
| LGIN: Low-grade intraepithelial neoplasias | ||
| Liver | 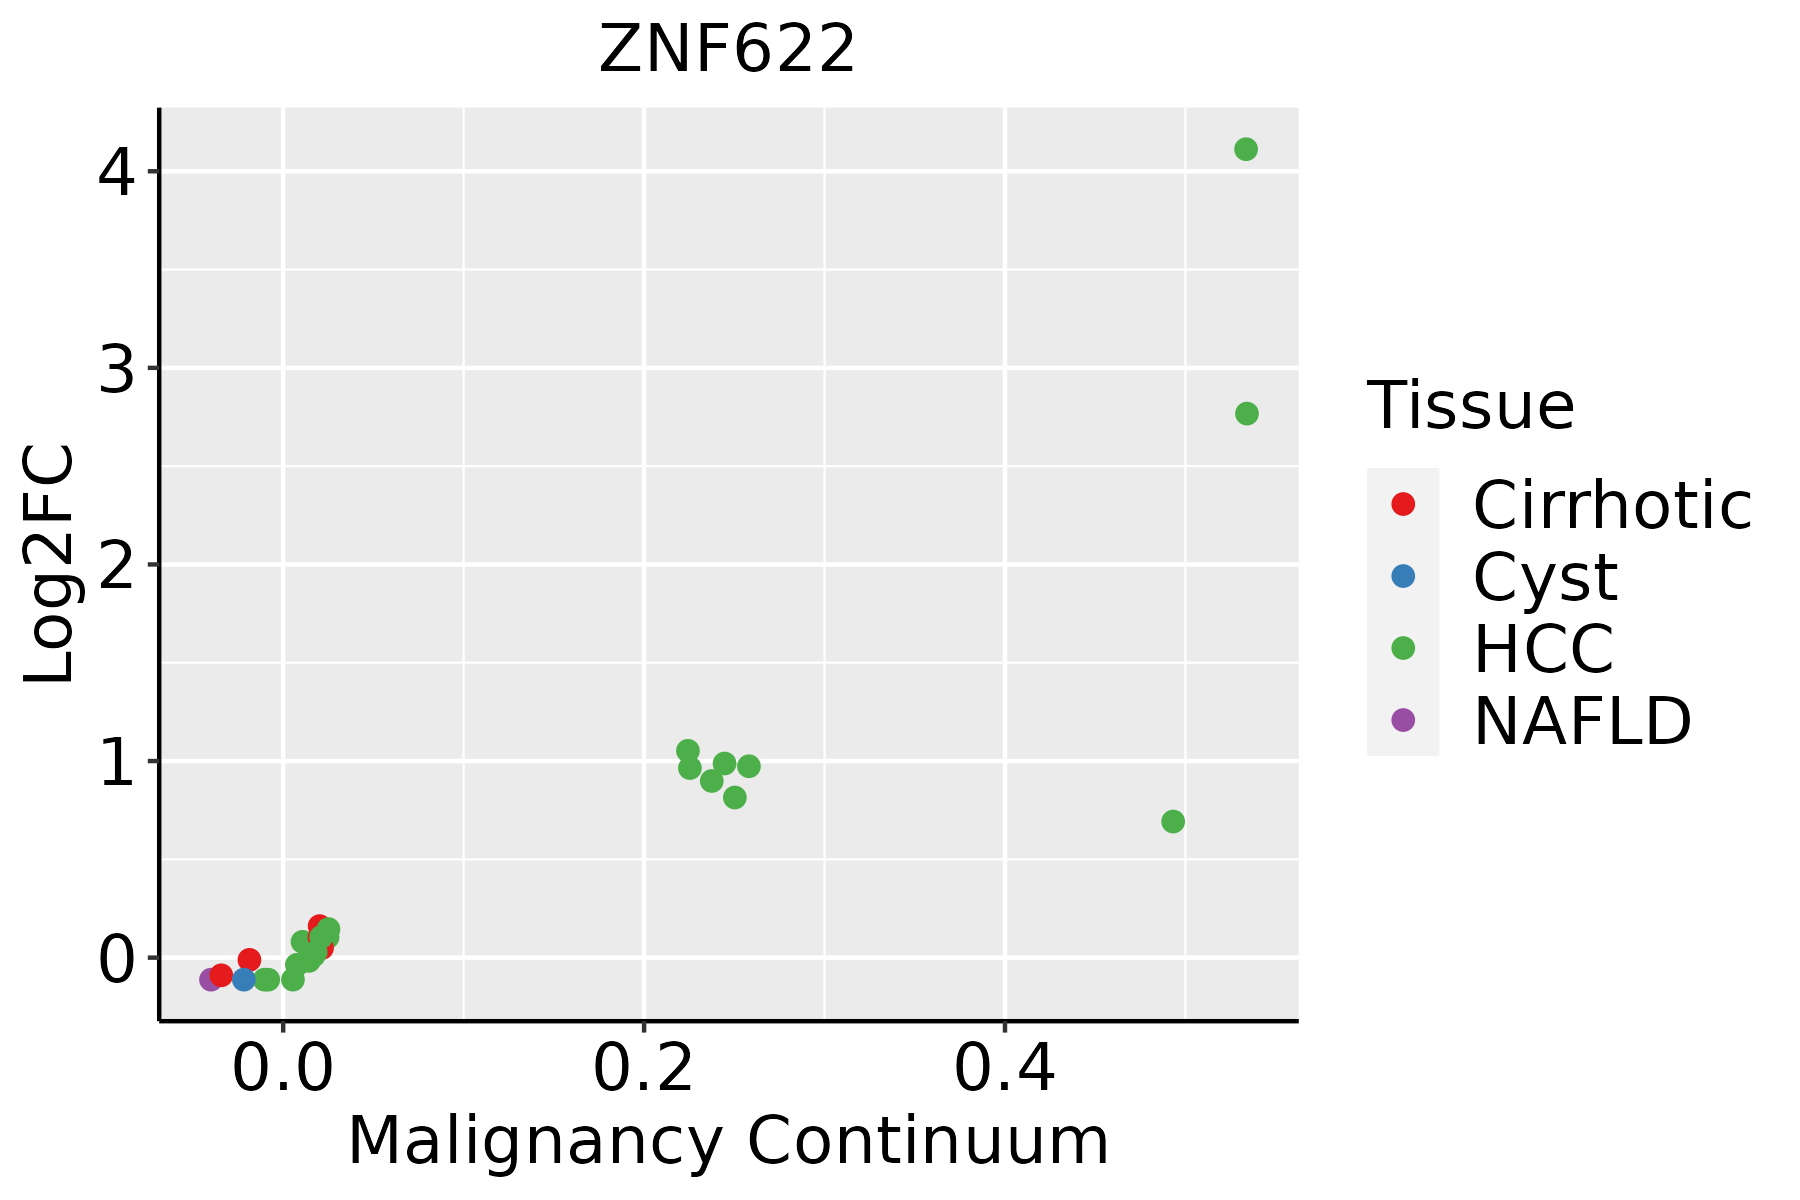 | HCC: Hepatocellular carcinoma |
| NAFLD: Non-alcoholic fatty liver disease | ||
| Oral Cavity | 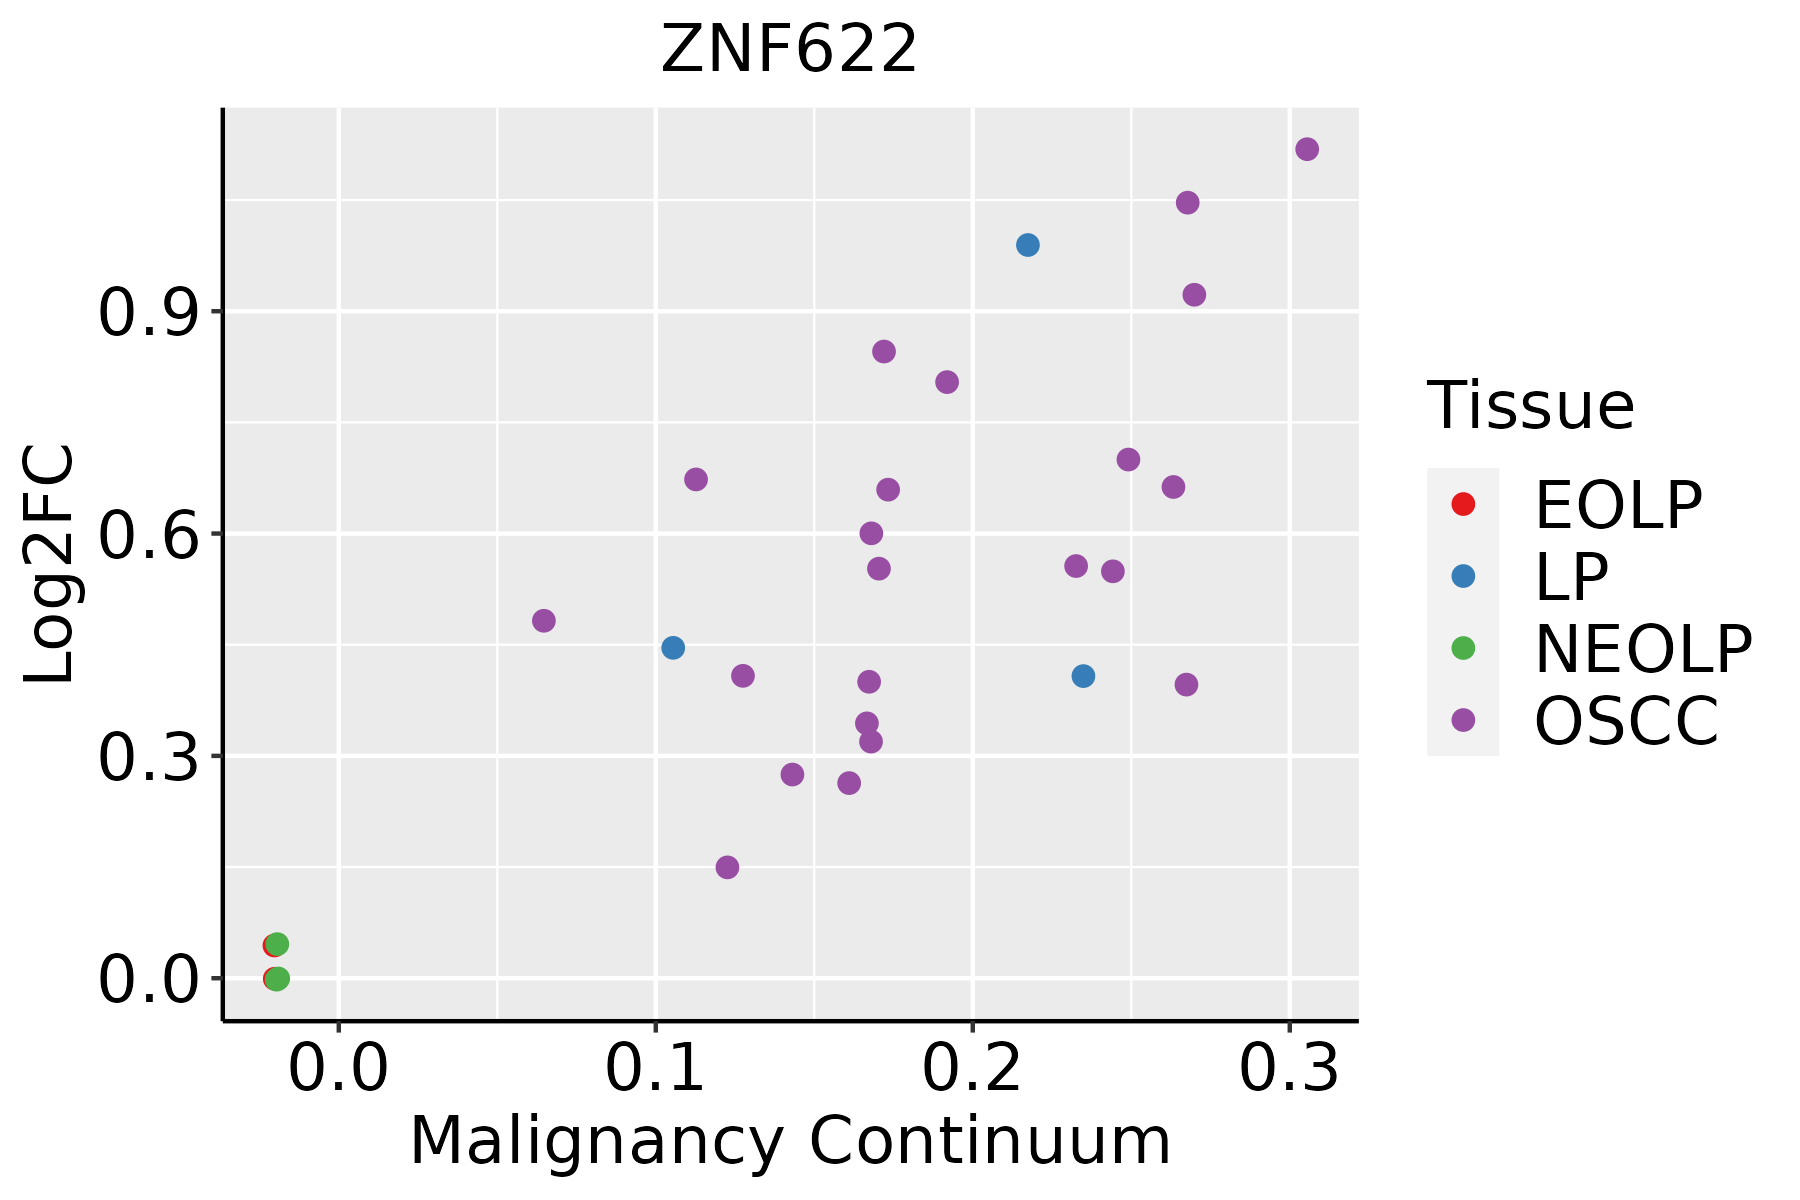 | EOLP: Erosive Oral lichen planus |
| LP: leukoplakia | ||
| NEOLP: Non-erosive oral lichen planus | ||
| OSCC: Oral squamous cell carcinoma | ||
| Skin | 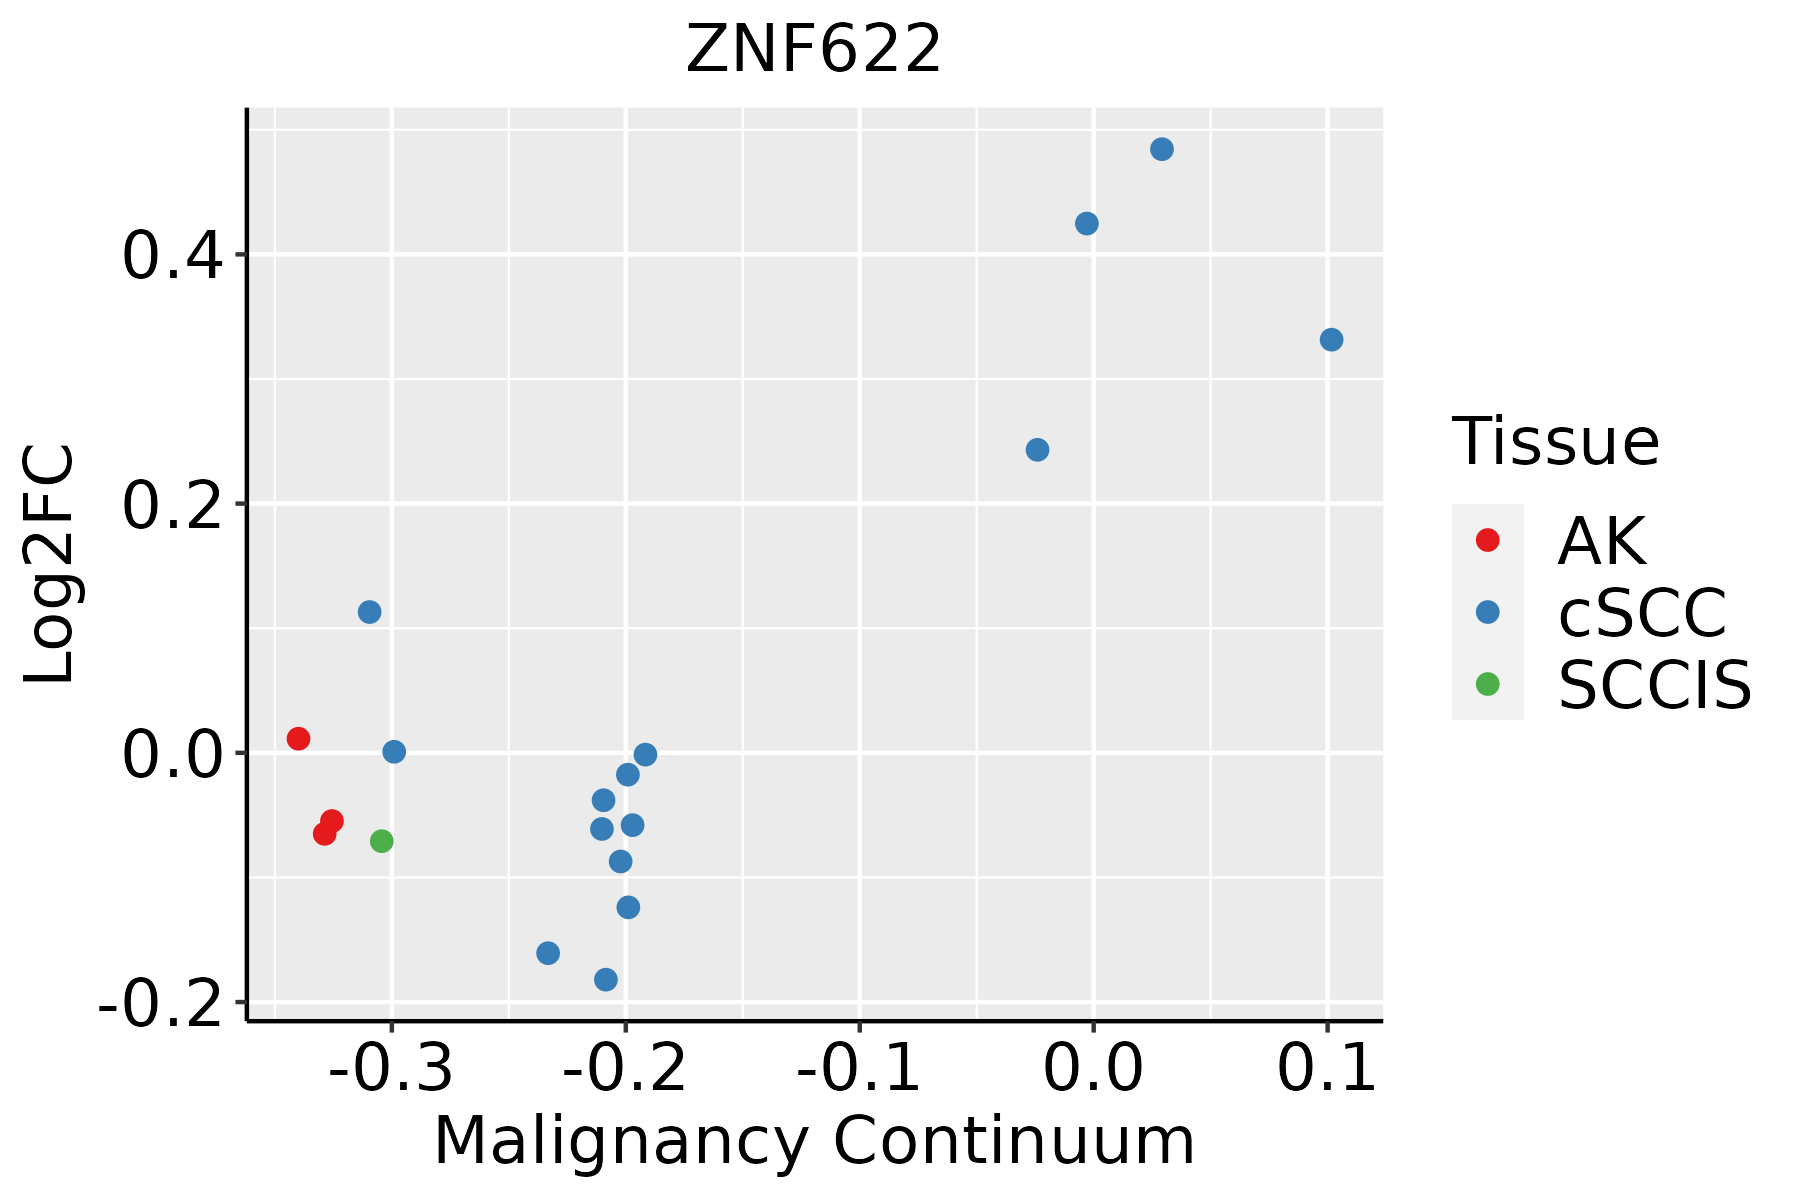 | AK: Actinic keratosis |
| cSCC: Cutaneous squamous cell carcinoma | ||
| SCCIS:squamous cell carcinoma in situ | ||
| Thyroid | 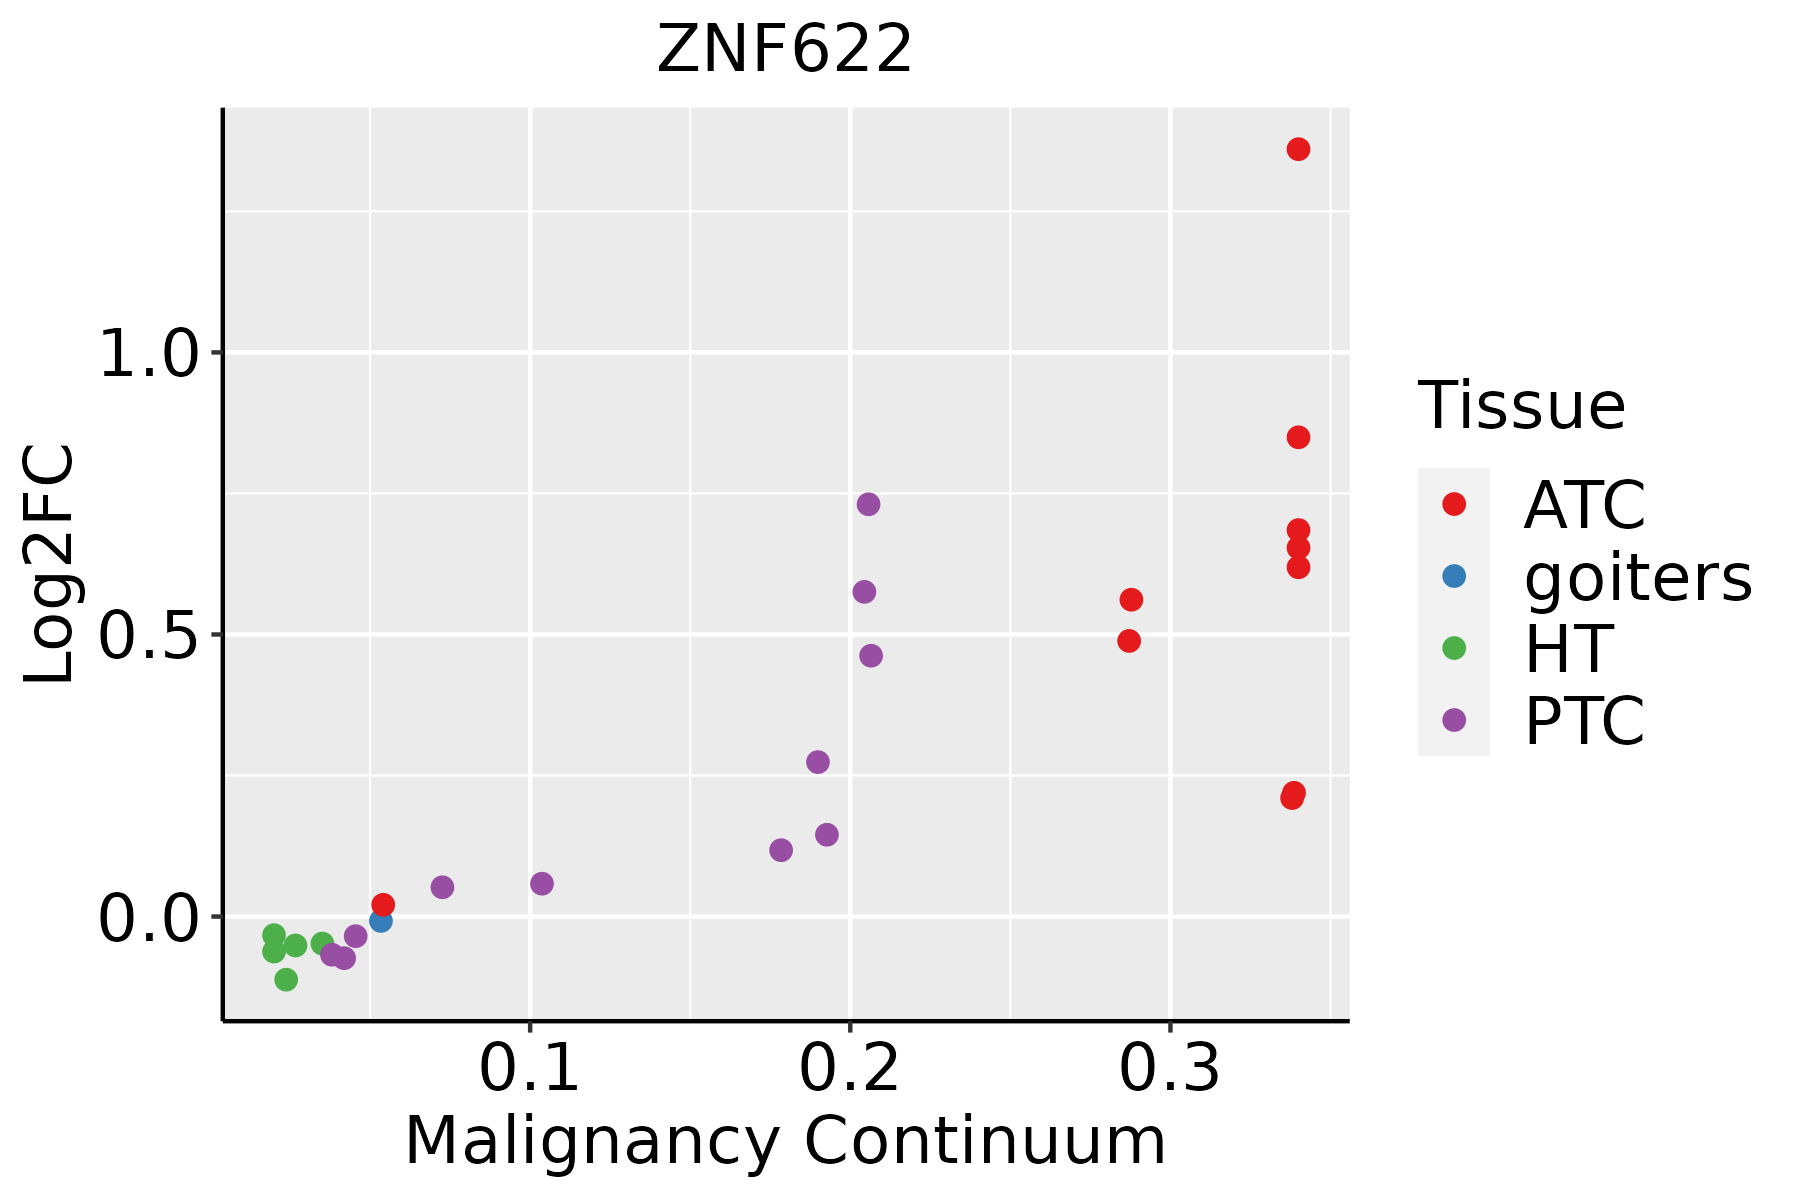 | ATC: Anaplastic thyroid cancer |
| HT: Hashimoto's thyroiditis | ||
| PTC: Papillary thyroid cancer |
| ∗log2FC in expression of this searched gene in stem-like cells from each diseased tissue sample relative to stem-like cells in normal samples in each tissue plotted against the malignancy continuum. Samples are colored based on if they are from different disease stage. |
Top |
Malignant transformation related pathway analysis |
| Find out the enriched GO biological processes and KEGG pathways involved in transition from healthy to precancer to cancer |
| Tissue | Disease Stage | Enriched GO biological Processes |
| Colorectum | AD |  |
| Colorectum | SER |  |
| Colorectum | MSS |  |
| Colorectum | MSI-H |  |
| Colorectum | FAP |  |
| ∗Top 15 enriched GO BP terms are showed in the bar plot of each disease state in each tissue. Each row represents a significant GO biological process which is colored according to the -log10(p.adjust). |
| Page: 1 2 3 4 5 6 7 8 9 |
| GO ID | Tissue | Disease Stage | Description | Gene Ratio | Bg Ratio | pvalue | p.adjust | Count |
| GO:0022613111 | Esophagus | ESCC | ribonucleoprotein complex biogenesis | 365/8552 | 463/18723 | 1.74e-49 | 1.11e-45 | 365 |
| GO:0042254111 | Esophagus | ESCC | ribosome biogenesis | 252/8552 | 299/18723 | 3.27e-44 | 1.04e-40 | 252 |
| GO:0097193111 | Esophagus | ESCC | intrinsic apoptotic signaling pathway | 222/8552 | 288/18723 | 5.87e-28 | 2.02e-25 | 222 |
| GO:0006979111 | Esophagus | ESCC | response to oxidative stress | 303/8552 | 446/18723 | 7.15e-22 | 1.30e-19 | 303 |
| GO:0062197111 | Esophagus | ESCC | cellular response to chemical stress | 234/8552 | 337/18723 | 5.37e-19 | 5.97e-17 | 234 |
| GO:0042273111 | Esophagus | ESCC | ribosomal large subunit biogenesis | 65/8552 | 72/18723 | 1.53e-15 | 9.82e-14 | 65 |
| GO:0034599111 | Esophagus | ESCC | cellular response to oxidative stress | 197/8552 | 288/18723 | 3.76e-15 | 2.15e-13 | 197 |
| GO:0008631110 | Esophagus | ESCC | intrinsic apoptotic signaling pathway in response to oxidative stress | 38/8552 | 45/18723 | 8.42e-08 | 1.43e-06 | 38 |
| GO:003109818 | Esophagus | ESCC | stress-activated protein kinase signaling cascade | 154/8552 | 247/18723 | 8.53e-08 | 1.44e-06 | 154 |
| GO:005140318 | Esophagus | ESCC | stress-activated MAPK cascade | 147/8552 | 239/18723 | 5.43e-07 | 7.18e-06 | 147 |
| GO:003367420 | Esophagus | ESCC | positive regulation of kinase activity | 260/8552 | 467/18723 | 7.26e-06 | 7.22e-05 | 260 |
| GO:007030217 | Esophagus | ESCC | regulation of stress-activated protein kinase signaling cascade | 119/8552 | 195/18723 | 1.07e-05 | 1.01e-04 | 119 |
| GO:003287217 | Esophagus | ESCC | regulation of stress-activated MAPK cascade | 116/8552 | 192/18723 | 2.63e-05 | 2.21e-04 | 116 |
| GO:00072549 | Esophagus | ESCC | JNK cascade | 102/8552 | 167/18723 | 4.22e-05 | 3.39e-04 | 102 |
| GO:00463289 | Esophagus | ESCC | regulation of JNK cascade | 80/8552 | 133/18723 | 5.35e-04 | 2.95e-03 | 80 |
| GO:003647320 | Esophagus | ESCC | cell death in response to oxidative stress | 59/8552 | 95/18723 | 9.12e-04 | 4.65e-03 | 59 |
| GO:00703046 | Esophagus | ESCC | positive regulation of stress-activated protein kinase signaling cascade | 74/8552 | 128/18723 | 3.77e-03 | 1.53e-02 | 74 |
| GO:00328745 | Esophagus | ESCC | positive regulation of stress-activated MAPK cascade | 72/8552 | 126/18723 | 6.24e-03 | 2.29e-02 | 72 |
| GO:00463302 | Esophagus | ESCC | positive regulation of JNK cascade | 52/8552 | 89/18723 | 1.04e-02 | 3.56e-02 | 52 |
| GO:002261312 | Liver | Cirrhotic | ribonucleoprotein complex biogenesis | 231/4634 | 463/18723 | 3.28e-32 | 6.86e-29 | 231 |
| Page: 1 2 3 4 5 6 7 |
| Pathway ID | Tissue | Disease Stage | Description | Gene Ratio | Bg Ratio | pvalue | p.adjust | qvalue | Count |
| Page: 1 |
Top |
Cell-cell communication analysis |
| Identification of potential cell-cell interactions between two cell types and their ligand-receptor pairs for different disease states |
| Ligand | Receptor | LRpair | Pathway | Tissue | Disease Stage |
| Page: 1 |
Top |
Single-cell gene regulatory network inference analysis |
| Find out the significant the regulons (TFs) and the target genes of each regulon across cell types for different disease states |
| TF | Cell Type | Tissue | Disease Stage | Target Gene | RSS | Regulon Activity |
| ZNF622 | COR | Oral cavity | Healthy | KRBOX1,CLTA,INTS6, etc. | 1.14e-01 |  |
| ZNF622 | SMC | Oral cavity | ADJ | HMOX1,HPCAL1,SLC7A11, etc. | 4.02e-01 |  |
| ZNF622 | PERI | Oral cavity | LP | HMOX1,HPCAL1,SLC7A11, etc. | 1.08e-01 |  |
| ZNF622 | SMC | Oral cavity | LP | HMOX1,HPCAL1,SLC7A11, etc. | 2.20e-01 | |
| ZNF622 | MESC | Stomach | CAG with IM | SH3D21,PMAIP1,SEC16B, etc. | 3.81e-02 |  |
| ZNF622 | MESC | Stomach | GC | SH3D21,PMAIP1,SEC16B, etc. | 7.22e-02 |  |
| ∗The dot plots of a searched regulon are shown for all cell subpopulations in each disease state of each tissue based on the regulon specific score inferred using pySCENIC and by calculating the average expression. |
| Page: 1 |
Top |
Somatic mutation of malignant transformation related genes |
| Annotation of somatic variants for genes involved in malignant transformation |
| Hugo Symbol | Variant Class | Variant Classification | dbSNP RS | HGVSc | HGVSp | HGVSp Short | SWISSPROT | BIOTYPE | SIFT | PolyPhen | Tumor Sample Barcode | Tissue | Histology | Sex | Age | Stage | Therapy Types | Drugs | Outcome |
| ZNF622 | SNV | Missense_Mutation | c.1301G>A | p.Ser434Asn | p.S434N | Q969S3 | protein_coding | tolerated(0.37) | benign(0.275) | TCGA-BH-A18G-01 | Breast | breast invasive carcinoma | Female | >=65 | I/II | Unknown | Unknown | SD | |
| ZNF622 | SNV | Missense_Mutation | novel | c.859G>A | p.Asp287Asn | p.D287N | Q969S3 | protein_coding | tolerated(0.07) | probably_damaging(0.999) | TCGA-2W-A8YY-01 | Cervix | cervical & endocervical cancer | Female | <65 | I/II | Chemotherapy | cisplatin | CR |
| ZNF622 | SNV | Missense_Mutation | c.365G>A | p.Ser122Asn | p.S122N | Q969S3 | protein_coding | tolerated(0.48) | benign(0) | TCGA-AA-3663-01 | Colorectum | colon adenocarcinoma | Male | <65 | I/II | Unknown | Unknown | SD | |
| ZNF622 | SNV | Missense_Mutation | c.476T>C | p.Val159Ala | p.V159A | Q969S3 | protein_coding | tolerated(1) | benign(0) | TCGA-AA-3715-01 | Colorectum | colon adenocarcinoma | Male | >=65 | I/II | Unknown | Unknown | PD | |
| ZNF622 | SNV | Missense_Mutation | c.1357N>A | p.Ser453Thr | p.S453T | Q969S3 | protein_coding | deleterious(0) | possibly_damaging(0.76) | TCGA-AA-3811-01 | Colorectum | colon adenocarcinoma | Female | >=65 | III/IV | Unknown | Unknown | PD | |
| ZNF622 | SNV | Missense_Mutation | c.391N>A | p.Ala131Thr | p.A131T | Q969S3 | protein_coding | deleterious(0.01) | probably_damaging(0.996) | TCGA-AD-6964-01 | Colorectum | colon adenocarcinoma | Male | <65 | III/IV | Chemotherapy | folfox | PD | |
| ZNF622 | SNV | Missense_Mutation | rs777954248 | c.1231G>A | p.Ala411Thr | p.A411T | Q969S3 | protein_coding | tolerated(0.4) | benign(0) | TCGA-DM-A0XD-01 | Colorectum | colon adenocarcinoma | Male | >=65 | I/II | Unknown | Unknown | PD |
| ZNF622 | SNV | Missense_Mutation | novel | c.1116G>T | p.Lys372Asn | p.K372N | Q969S3 | protein_coding | deleterious(0.04) | possibly_damaging(0.756) | TCGA-AG-A002-01 | Colorectum | rectum adenocarcinoma | Male | <65 | I/II | Unknown | Unknown | SD |
| ZNF622 | SNV | Missense_Mutation | c.786N>A | p.Ser262Arg | p.S262R | Q969S3 | protein_coding | tolerated(0.52) | benign(0.145) | TCGA-AG-A01Y-01 | Colorectum | rectum adenocarcinoma | Female | <65 | I/II | Chemotherapy | 5-fluorouracil | CR | |
| ZNF622 | SNV | Missense_Mutation | rs774703876 | c.1181N>A | p.Arg394His | p.R394H | Q969S3 | protein_coding | deleterious(0) | possibly_damaging(0.719) | TCGA-A5-A0G2-01 | Endometrium | uterine corpus endometrioid carcinoma | Female | <65 | III/IV | Unknown | Unknown | SD |
| Page: 1 2 3 4 5 |
Top |
Related drugs of malignant transformation related genes |
| Identification of chemicals and drugs interact with genes involved in malignant transfromation |
| (DGIdb 4.0) |
| Entrez ID | Symbol | Category | Interaction Types | Drug Claim Name | Drug Name | PMIDs |
| Page: 1 |

Copyright 2023-Present -The University of Texas Health Science Center at Houston |