
|
|||||
|
 | |
| |
| |
| |
| |
| |
|
Gene: ZNF618 |
Gene summary for ZNF618 |
| Gene information | Species | Human | Gene symbol | ZNF618 | Gene ID | 114991 |
| Gene name | zinc finger protein 618 | |
| Gene Alias | FP13169 | |
| Cytomap | 9q32 | |
| Gene Type | protein-coding | GO ID | GO:0006139 | UniProtAcc | Q5T7W0 |
Top |
Malignant transformation analysis |
| Identification of the aberrant gene expression in precancerous and cancerous lesions by comparing the gene expression of stem-like cells in diseased tissues with normal stem cells |
| Entrez ID | Symbol | Replicates | Species | Organ | Tissue | Adj P-value | Log2FC | Malignancy |
| 114991 | ZNF618 | LZE2T | Human | Esophagus | ESCC | 2.18e-04 | 3.51e-01 | 0.082 |
| 114991 | ZNF618 | LZE4T | Human | Esophagus | ESCC | 6.35e-03 | 1.09e-01 | 0.0811 |
| 114991 | ZNF618 | LZE7T | Human | Esophagus | ESCC | 1.02e-03 | 1.65e-01 | 0.0667 |
| 114991 | ZNF618 | LZE24T | Human | Esophagus | ESCC | 6.29e-04 | 1.16e-01 | 0.0596 |
| 114991 | ZNF618 | P1T-E | Human | Esophagus | ESCC | 2.44e-06 | 2.66e-01 | 0.0875 |
| 114991 | ZNF618 | P2T-E | Human | Esophagus | ESCC | 4.37e-35 | 6.12e-01 | 0.1177 |
| 114991 | ZNF618 | P4T-E | Human | Esophagus | ESCC | 3.78e-04 | 1.24e-01 | 0.1323 |
| 114991 | ZNF618 | P8T-E | Human | Esophagus | ESCC | 1.13e-16 | 2.80e-01 | 0.0889 |
| 114991 | ZNF618 | P10T-E | Human | Esophagus | ESCC | 2.27e-21 | 3.80e-01 | 0.116 |
| 114991 | ZNF618 | P11T-E | Human | Esophagus | ESCC | 6.08e-06 | 2.68e-01 | 0.1426 |
| 114991 | ZNF618 | P12T-E | Human | Esophagus | ESCC | 4.30e-10 | 1.87e-01 | 0.1122 |
| 114991 | ZNF618 | P15T-E | Human | Esophagus | ESCC | 5.83e-12 | 2.35e-01 | 0.1149 |
| 114991 | ZNF618 | P16T-E | Human | Esophagus | ESCC | 1.76e-12 | 2.05e-01 | 0.1153 |
| 114991 | ZNF618 | P22T-E | Human | Esophagus | ESCC | 3.89e-12 | 2.02e-01 | 0.1236 |
| 114991 | ZNF618 | P24T-E | Human | Esophagus | ESCC | 9.53e-09 | 1.96e-01 | 0.1287 |
| 114991 | ZNF618 | P26T-E | Human | Esophagus | ESCC | 2.06e-08 | 1.44e-01 | 0.1276 |
| 114991 | ZNF618 | P27T-E | Human | Esophagus | ESCC | 9.56e-08 | 1.42e-01 | 0.1055 |
| 114991 | ZNF618 | P28T-E | Human | Esophagus | ESCC | 3.14e-04 | 1.08e-01 | 0.1149 |
| 114991 | ZNF618 | P30T-E | Human | Esophagus | ESCC | 2.31e-10 | 3.19e-01 | 0.137 |
| 114991 | ZNF618 | P32T-E | Human | Esophagus | ESCC | 6.56e-15 | 2.64e-01 | 0.1666 |
| Page: 1 2 3 |
| Tissue | Expression Dynamics | Abbreviation |
| Esophagus | 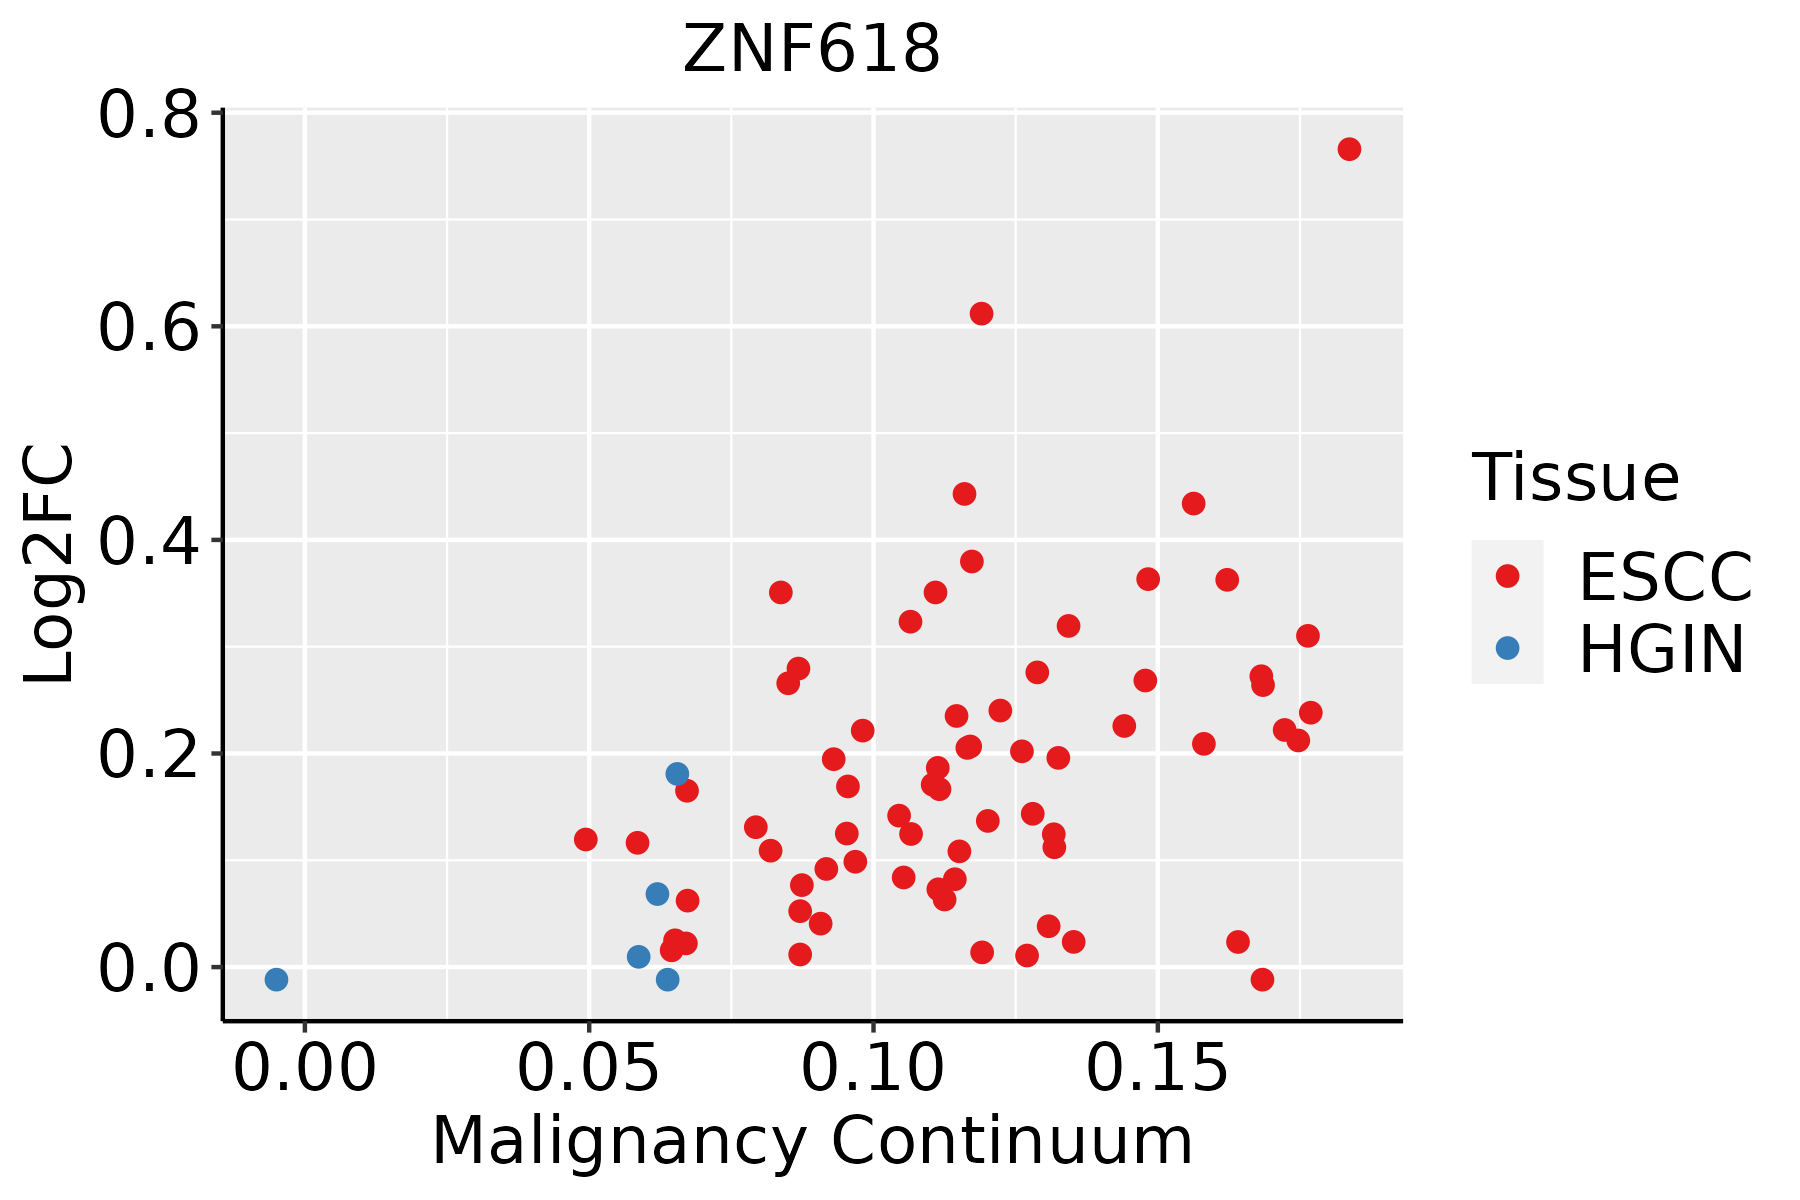 | ESCC: Esophageal squamous cell carcinoma |
| HGIN: High-grade intraepithelial neoplasias | ||
| LGIN: Low-grade intraepithelial neoplasias | ||
| Thyroid | 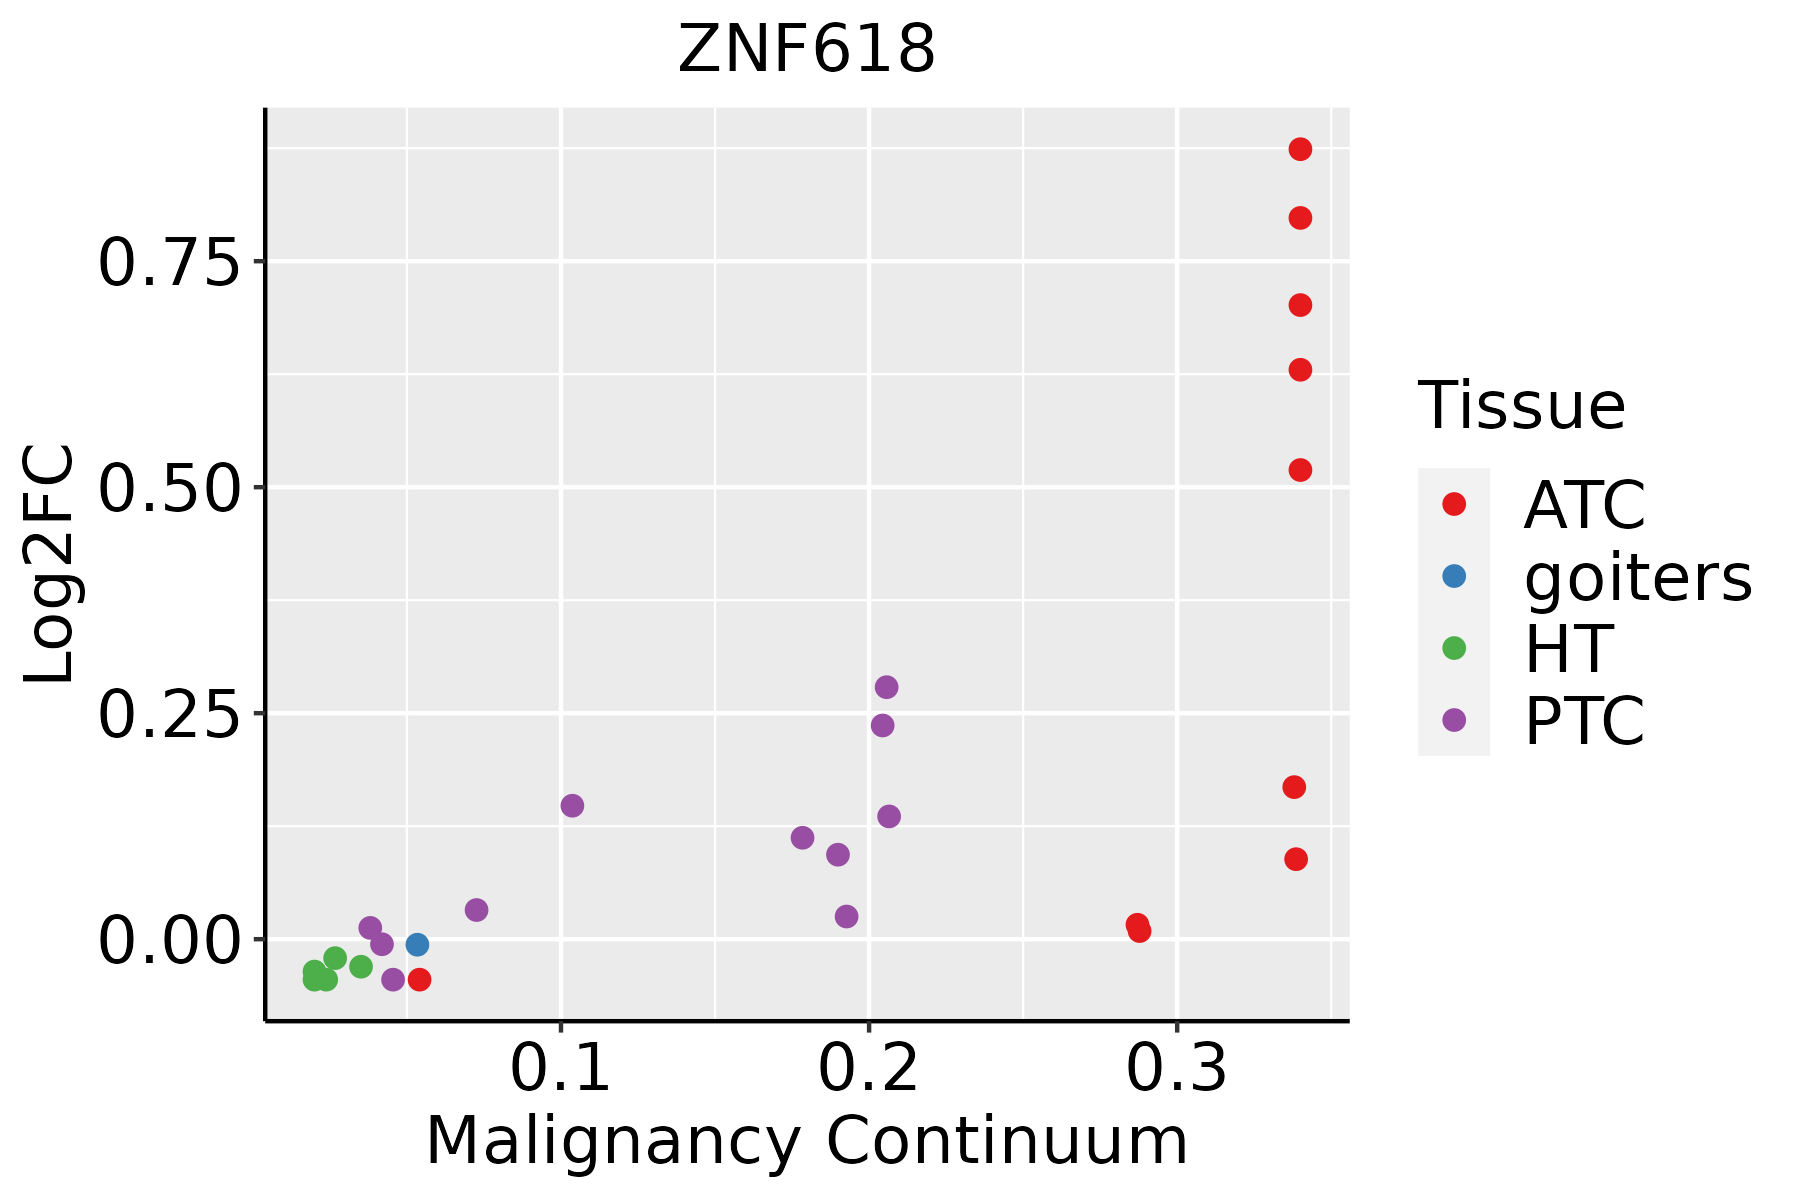 | ATC: Anaplastic thyroid cancer |
| HT: Hashimoto's thyroiditis | ||
| PTC: Papillary thyroid cancer |
| ∗log2FC in expression of this searched gene in stem-like cells from each diseased tissue sample relative to stem-like cells in normal samples in each tissue plotted against the malignancy continuum. Samples are colored based on if they are from different disease stage. |
Top |
Malignant transformation related pathway analysis |
| Find out the enriched GO biological processes and KEGG pathways involved in transition from healthy to precancer to cancer |
| Tissue | Disease Stage | Enriched GO biological Processes |
| Colorectum | AD |  |
| Colorectum | SER |  |
| Colorectum | MSS |  |
| Colorectum | MSI-H |  |
| Colorectum | FAP |  |
| ∗Top 15 enriched GO BP terms are showed in the bar plot of each disease state in each tissue. Each row represents a significant GO biological process which is colored according to the -log10(p.adjust). |
| Page: 1 2 3 4 5 6 7 8 9 |
| GO ID | Tissue | Disease Stage | Description | Gene Ratio | Bg Ratio | pvalue | p.adjust | Count |
| GO:0051098111 | Esophagus | ESCC | regulation of binding | 251/8552 | 363/18723 | 6.73e-20 | 8.46e-18 | 251 |
| GO:0051099111 | Esophagus | ESCC | positive regulation of binding | 122/8552 | 173/18723 | 2.79e-11 | 9.45e-10 | 122 |
| GO:0035563 | Esophagus | ESCC | positive regulation of chromatin binding | 11/8552 | 14/18723 | 1.30e-02 | 4.27e-02 | 11 |
| GO:0051098113 | Thyroid | PTC | regulation of binding | 195/5968 | 363/18723 | 3.21e-18 | 3.37e-16 | 195 |
| GO:0051099113 | Thyroid | PTC | positive regulation of binding | 100/5968 | 173/18723 | 1.56e-12 | 6.96e-11 | 100 |
| GO:005109834 | Thyroid | ATC | regulation of binding | 203/6293 | 363/18723 | 1.18e-18 | 1.55e-16 | 203 |
| GO:005109934 | Thyroid | ATC | positive regulation of binding | 103/6293 | 173/18723 | 2.19e-12 | 9.05e-11 | 103 |
| Page: 1 |
| Pathway ID | Tissue | Disease Stage | Description | Gene Ratio | Bg Ratio | pvalue | p.adjust | qvalue | Count |
| Page: 1 |
Top |
Cell-cell communication analysis |
| Identification of potential cell-cell interactions between two cell types and their ligand-receptor pairs for different disease states |
| Ligand | Receptor | LRpair | Pathway | Tissue | Disease Stage |
| Page: 1 |
Top |
Single-cell gene regulatory network inference analysis |
| Find out the significant the regulons (TFs) and the target genes of each regulon across cell types for different disease states |
| TF | Cell Type | Tissue | Disease Stage | Target Gene | RSS | Regulon Activity |
| ∗The dot plots of a searched regulon are shown for all cell subpopulations in each disease state of each tissue based on the regulon specific score inferred using pySCENIC and by calculating the average expression. |
| Page: 1 |
Top |
Somatic mutation of malignant transformation related genes |
| Annotation of somatic variants for genes involved in malignant transformation |
| Hugo Symbol | Variant Class | Variant Classification | dbSNP RS | HGVSc | HGVSp | HGVSp Short | SWISSPROT | BIOTYPE | SIFT | PolyPhen | Tumor Sample Barcode | Tissue | Histology | Sex | Age | Stage | Therapy Types | Drugs | Outcome |
| ZNF618 | SNV | Missense_Mutation | c.455G>A | p.Cys152Tyr | p.C152Y | Q5T7W0 | protein_coding | deleterious_low_confidence(0) | probably_damaging(0.999) | TCGA-AN-A049-01 | Breast | breast invasive carcinoma | Female | <65 | I/II | Unknown | Unknown | SD | |
| ZNF618 | SNV | Missense_Mutation | rs759301939 | c.173N>T | p.Thr58Met | p.T58M | Q5T7W0 | protein_coding | deleterious_low_confidence(0) | possibly_damaging(0.781) | TCGA-AO-A0J2-01 | Breast | breast invasive carcinoma | Female | <65 | I/II | Chemotherapy | cyclophosphamide | SD |
| ZNF618 | SNV | Missense_Mutation | rs752559976 | c.1438G>A | p.Asp480Asn | p.D480N | Q5T7W0 | protein_coding | deleterious(0.01) | probably_damaging(0.996) | TCGA-BH-A18P-01 | Breast | breast invasive carcinoma | Female | <65 | I/II | Unknown | Unknown | PD |
| ZNF618 | SNV | Missense_Mutation | c.2761N>C | p.Gly921Arg | p.G921R | Q5T7W0 | protein_coding | deleterious(0.02) | benign(0.026) | TCGA-D8-A1JK-01 | Breast | breast invasive carcinoma | Female | >=65 | I/II | Unknown | Unknown | SD | |
| ZNF618 | SNV | Missense_Mutation | c.1520G>T | p.Gly507Val | p.G507V | Q5T7W0 | protein_coding | deleterious(0) | probably_damaging(0.999) | TCGA-E2-A1B6-01 | Breast | breast invasive carcinoma | Female | <65 | I/II | Unspecific | Adriamycin | SD | |
| ZNF618 | insertion | Frame_Shift_Ins | novel | c.1140_1141insA | p.Thr381AsnfsTer37 | p.T381Nfs*37 | Q5T7W0 | protein_coding | TCGA-A8-A0A6-01 | Breast | breast invasive carcinoma | Female | <65 | III/IV | Chemotherapy | epirubicin | CR | ||
| ZNF618 | insertion | Nonsense_Mutation | novel | c.1142_1143insCCTGTTGGCATGAGTTTGCATCTCCCACCTTTCA | p.Asn382LeufsTer4 | p.N382Lfs*4 | Q5T7W0 | protein_coding | TCGA-A8-A0A6-01 | Breast | breast invasive carcinoma | Female | <65 | III/IV | Chemotherapy | epirubicin | CR | ||
| ZNF618 | SNV | Missense_Mutation | novel | c.1010N>A | p.Arg337His | p.R337H | Q5T7W0 | protein_coding | tolerated_low_confidence(0.08) | benign(0.215) | TCGA-2W-A8YY-01 | Cervix | cervical & endocervical cancer | Female | <65 | I/II | Chemotherapy | cisplatin | CR |
| ZNF618 | SNV | Missense_Mutation | rs770522574 | c.1868N>T | p.Thr623Met | p.T623M | Q5T7W0 | protein_coding | tolerated(0.11) | benign(0.266) | TCGA-2W-A8YY-01 | Cervix | cervical & endocervical cancer | Female | <65 | I/II | Chemotherapy | cisplatin | CR |
| ZNF618 | SNV | Missense_Mutation | c.2491N>A | p.Glu831Lys | p.E831K | Q5T7W0 | protein_coding | tolerated(0.13) | possibly_damaging(0.76) | TCGA-IR-A3LH-01 | Cervix | cervical & endocervical cancer | Female | <65 | I/II | Chemotherapy | cisplatin | CR |
| Page: 1 2 3 4 5 6 7 8 9 |
Top |
Related drugs of malignant transformation related genes |
| Identification of chemicals and drugs interact with genes involved in malignant transfromation |
| (DGIdb 4.0) |
| Entrez ID | Symbol | Category | Interaction Types | Drug Claim Name | Drug Name | PMIDs |
| Page: 1 |

Copyright 2023-Present -The University of Texas Health Science Center at Houston |