
|
|||||
|
 | |
| |
| |
| |
| |
| |
|
Gene: ZNF609 |
Gene summary for ZNF609 |
| Gene information | Species | Human | Gene symbol | ZNF609 | Gene ID | 23060 |
| Gene name | zinc finger protein 609 | |
| Gene Alias | ZNF609 | |
| Cytomap | 15q22.31 | |
| Gene Type | protein-coding | GO ID | GO:0001764 | UniProtAcc | O15014 |
Top |
Malignant transformation analysis |
| Identification of the aberrant gene expression in precancerous and cancerous lesions by comparing the gene expression of stem-like cells in diseased tissues with normal stem cells |
| Entrez ID | Symbol | Replicates | Species | Organ | Tissue | Adj P-value | Log2FC | Malignancy |
| 23060 | ZNF609 | CCI_1 | Human | Cervix | CC | 1.23e-06 | 1.11e+00 | 0.528 |
| 23060 | ZNF609 | CCI_2 | Human | Cervix | CC | 2.55e-10 | 1.53e+00 | 0.5249 |
| 23060 | ZNF609 | CCI_3 | Human | Cervix | CC | 3.37e-15 | 1.07e+00 | 0.516 |
| 23060 | ZNF609 | HTA11_3410_2000001011 | Human | Colorectum | AD | 2.58e-03 | -3.13e-01 | 0.0155 |
| 23060 | ZNF609 | HTA11_1391_2000001011 | Human | Colorectum | AD | 6.40e-04 | 5.28e-01 | -0.059 |
| 23060 | ZNF609 | HTA11_99999970781_79442 | Human | Colorectum | MSS | 1.06e-02 | -2.72e-01 | 0.294 |
| 23060 | ZNF609 | HTA11_99999965062_69753 | Human | Colorectum | MSI-H | 2.62e-03 | 9.11e-01 | 0.3487 |
| 23060 | ZNF609 | HTA11_99999971662_82457 | Human | Colorectum | MSS | 3.97e-02 | -2.64e-01 | 0.3859 |
| 23060 | ZNF609 | A002-C-010 | Human | Colorectum | FAP | 3.09e-02 | -6.80e-02 | 0.242 |
| 23060 | ZNF609 | A001-C-207 | Human | Colorectum | FAP | 3.08e-02 | -1.97e-01 | 0.1278 |
| 23060 | ZNF609 | A015-C-203 | Human | Colorectum | FAP | 6.42e-35 | -3.99e-01 | -0.1294 |
| 23060 | ZNF609 | A015-C-204 | Human | Colorectum | FAP | 7.15e-07 | -3.85e-01 | -0.0228 |
| 23060 | ZNF609 | A014-C-040 | Human | Colorectum | FAP | 1.84e-06 | -4.61e-01 | -0.1184 |
| 23060 | ZNF609 | A002-C-201 | Human | Colorectum | FAP | 2.72e-11 | -2.14e-01 | 0.0324 |
| 23060 | ZNF609 | A002-C-203 | Human | Colorectum | FAP | 6.43e-03 | -6.31e-02 | 0.2786 |
| 23060 | ZNF609 | A001-C-119 | Human | Colorectum | FAP | 1.27e-09 | 1.11e-01 | -0.1557 |
| 23060 | ZNF609 | A001-C-108 | Human | Colorectum | FAP | 2.65e-15 | -1.89e-01 | -0.0272 |
| 23060 | ZNF609 | A002-C-205 | Human | Colorectum | FAP | 7.52e-25 | -3.35e-01 | -0.1236 |
| 23060 | ZNF609 | A015-C-006 | Human | Colorectum | FAP | 1.50e-14 | -3.53e-01 | -0.0994 |
| 23060 | ZNF609 | A015-C-106 | Human | Colorectum | FAP | 2.38e-10 | -2.26e-01 | -0.0511 |
| Page: 1 2 3 4 5 6 7 |
| Tissue | Expression Dynamics | Abbreviation |
| Cervix | 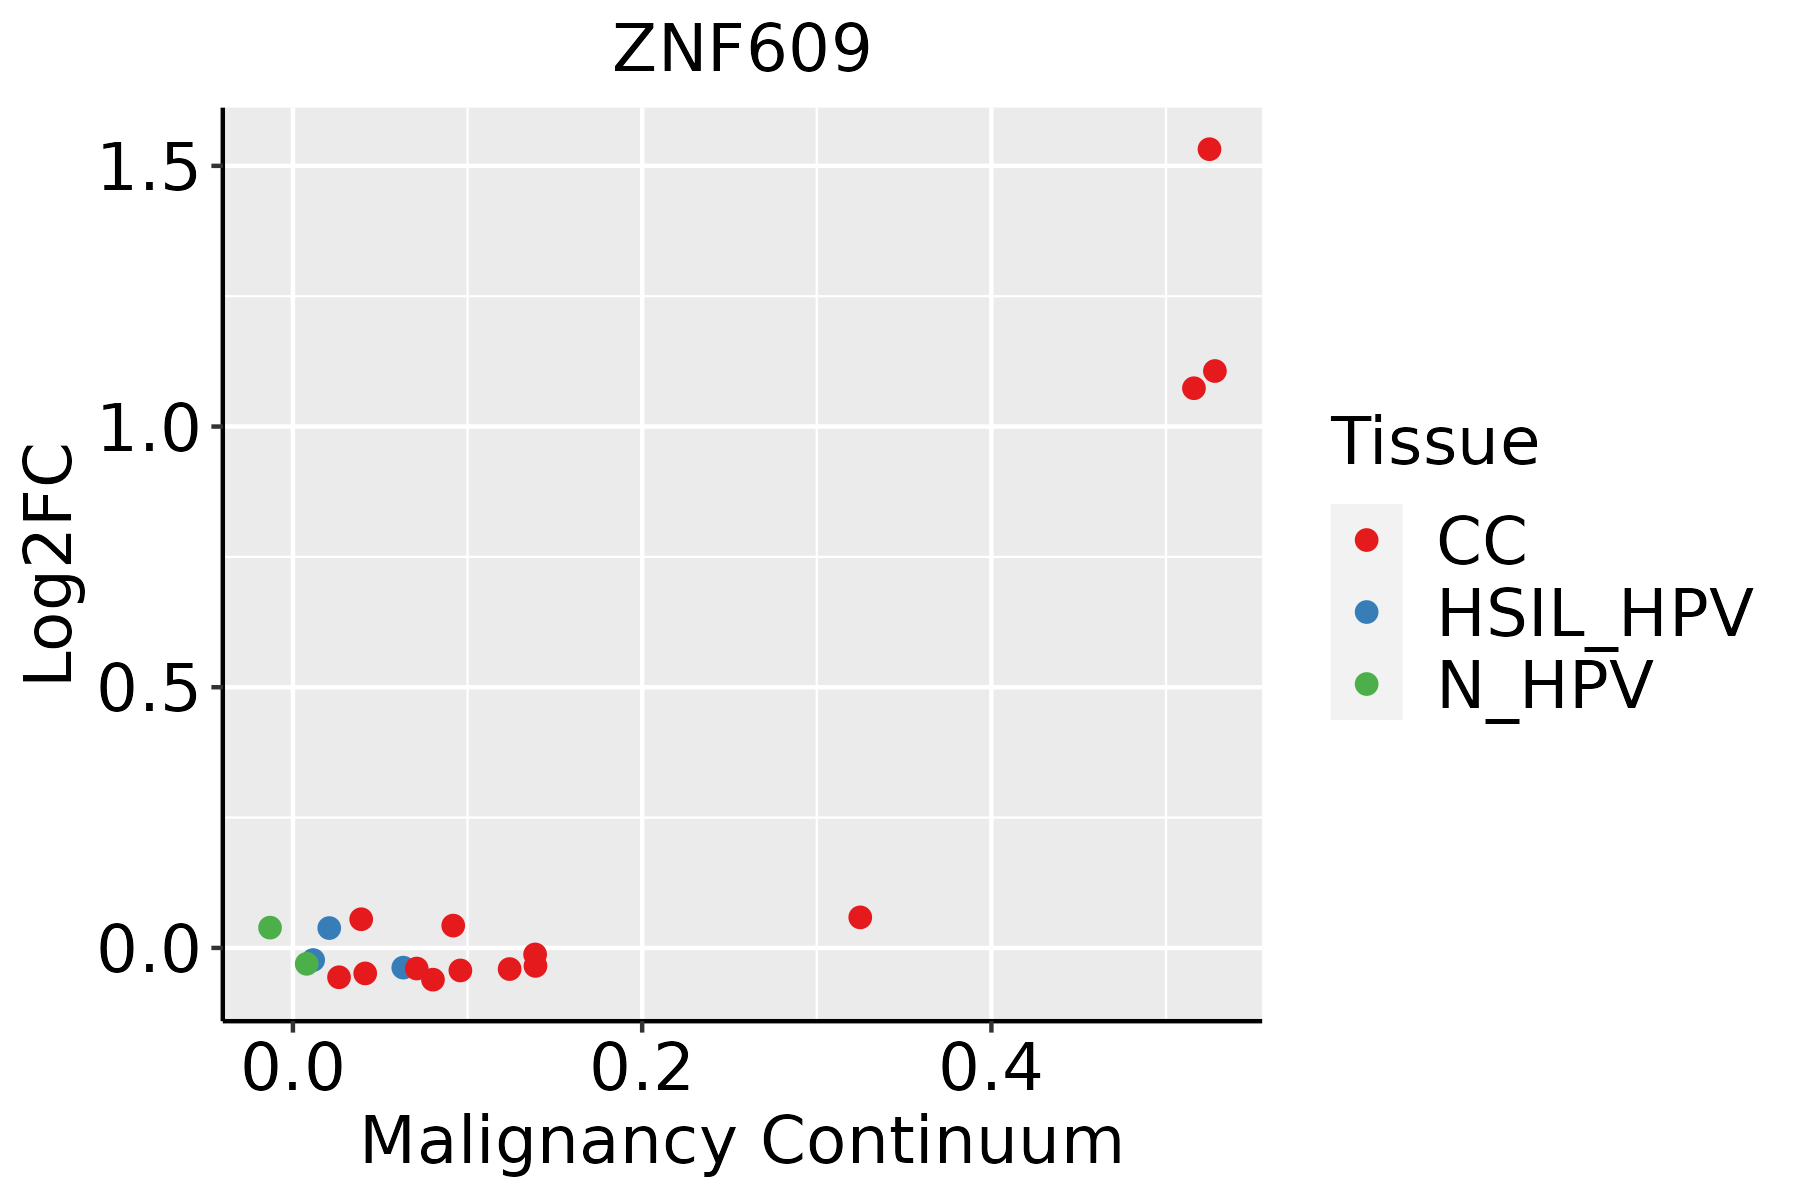 | CC: Cervix cancer |
| HSIL_HPV: HPV-infected high-grade squamous intraepithelial lesions | ||
| N_HPV: HPV-infected normal cervix | ||
| Colorectum (GSE201348) |  | FAP: Familial adenomatous polyposis |
| CRC: Colorectal cancer | ||
| Colorectum (HTA11) |  | AD: Adenomas |
| SER: Sessile serrated lesions | ||
| MSI-H: Microsatellite-high colorectal cancer | ||
| MSS: Microsatellite stable colorectal cancer | ||
| Endometrium |  | AEH: Atypical endometrial hyperplasia |
| EEC: Endometrioid Cancer | ||
| Liver |  | HCC: Hepatocellular carcinoma |
| NAFLD: Non-alcoholic fatty liver disease | ||
| Lung | 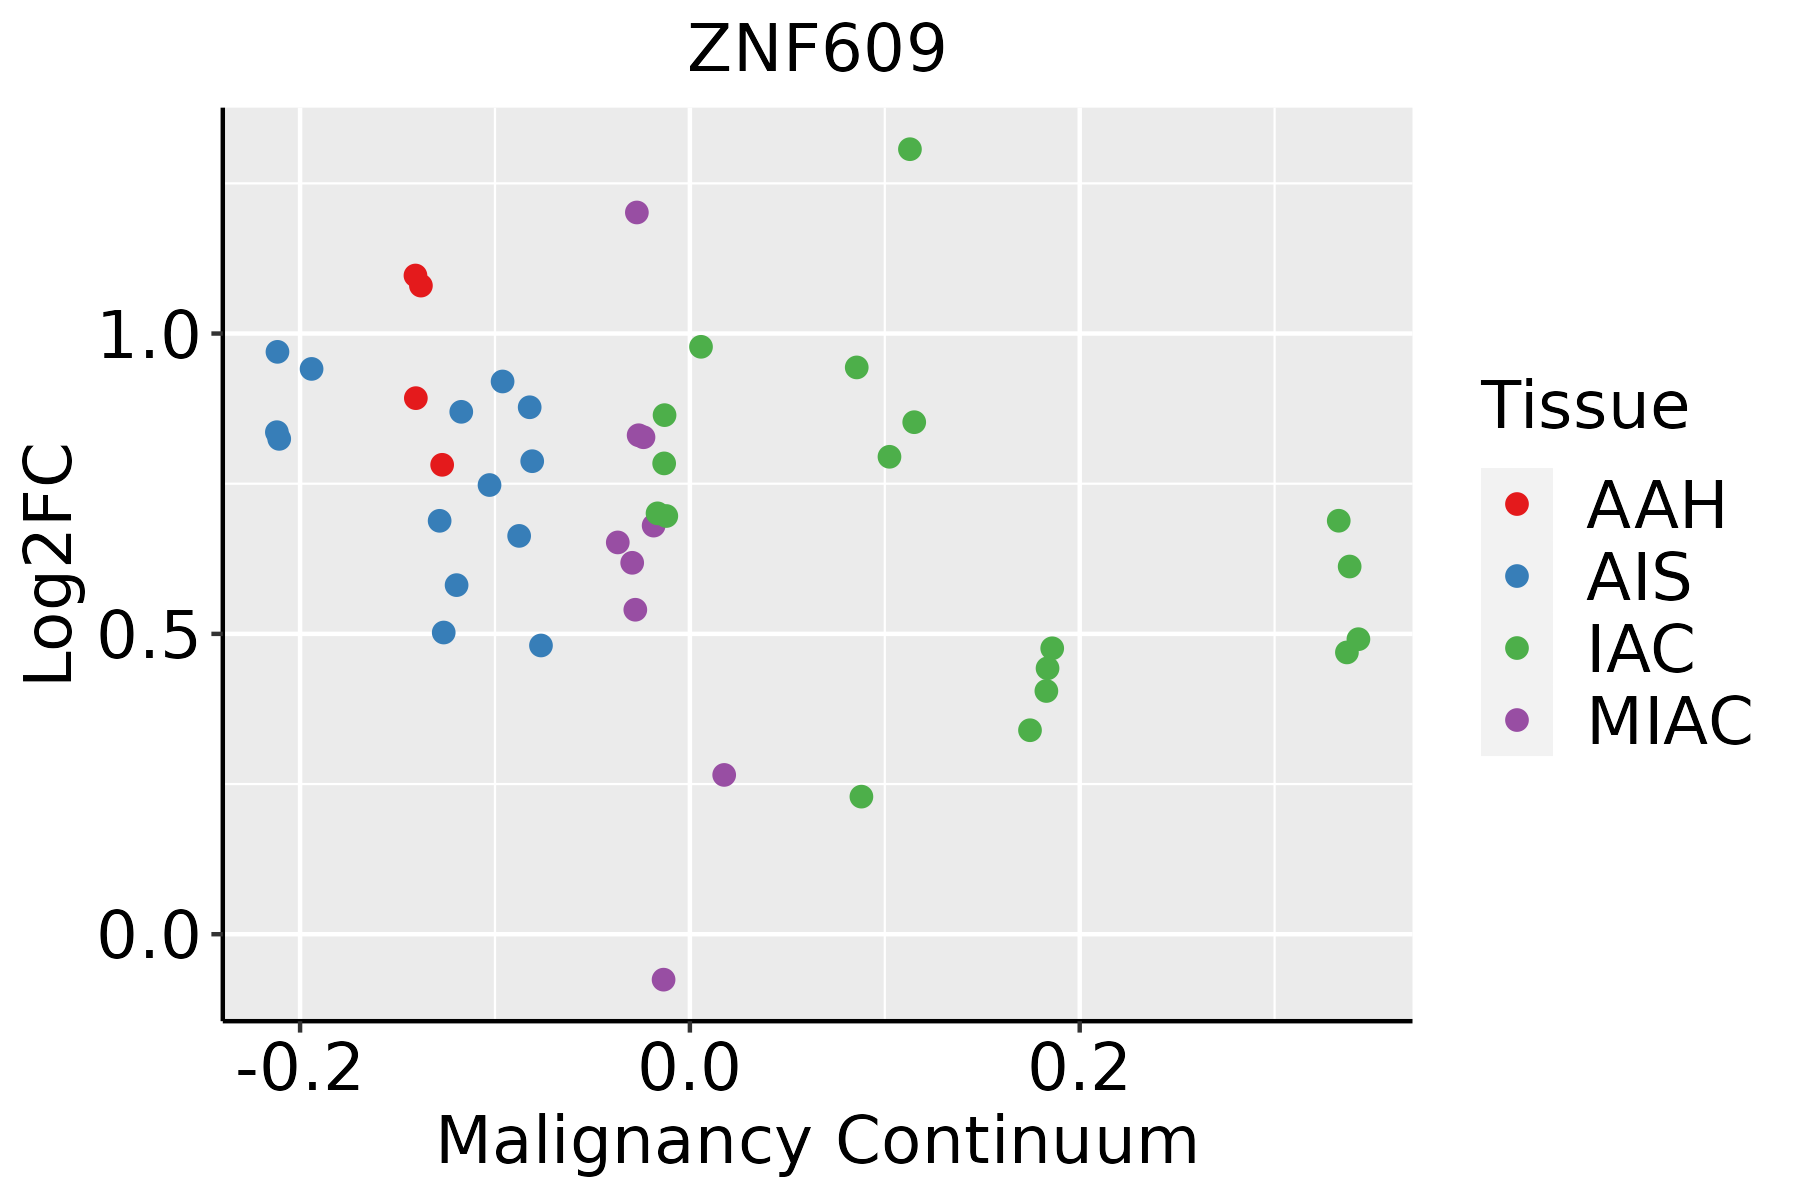 | AAH: Atypical adenomatous hyperplasia |
| AIS: Adenocarcinoma in situ | ||
| IAC: Invasive lung adenocarcinoma | ||
| MIA: Minimally invasive adenocarcinoma | ||
| Oral Cavity | 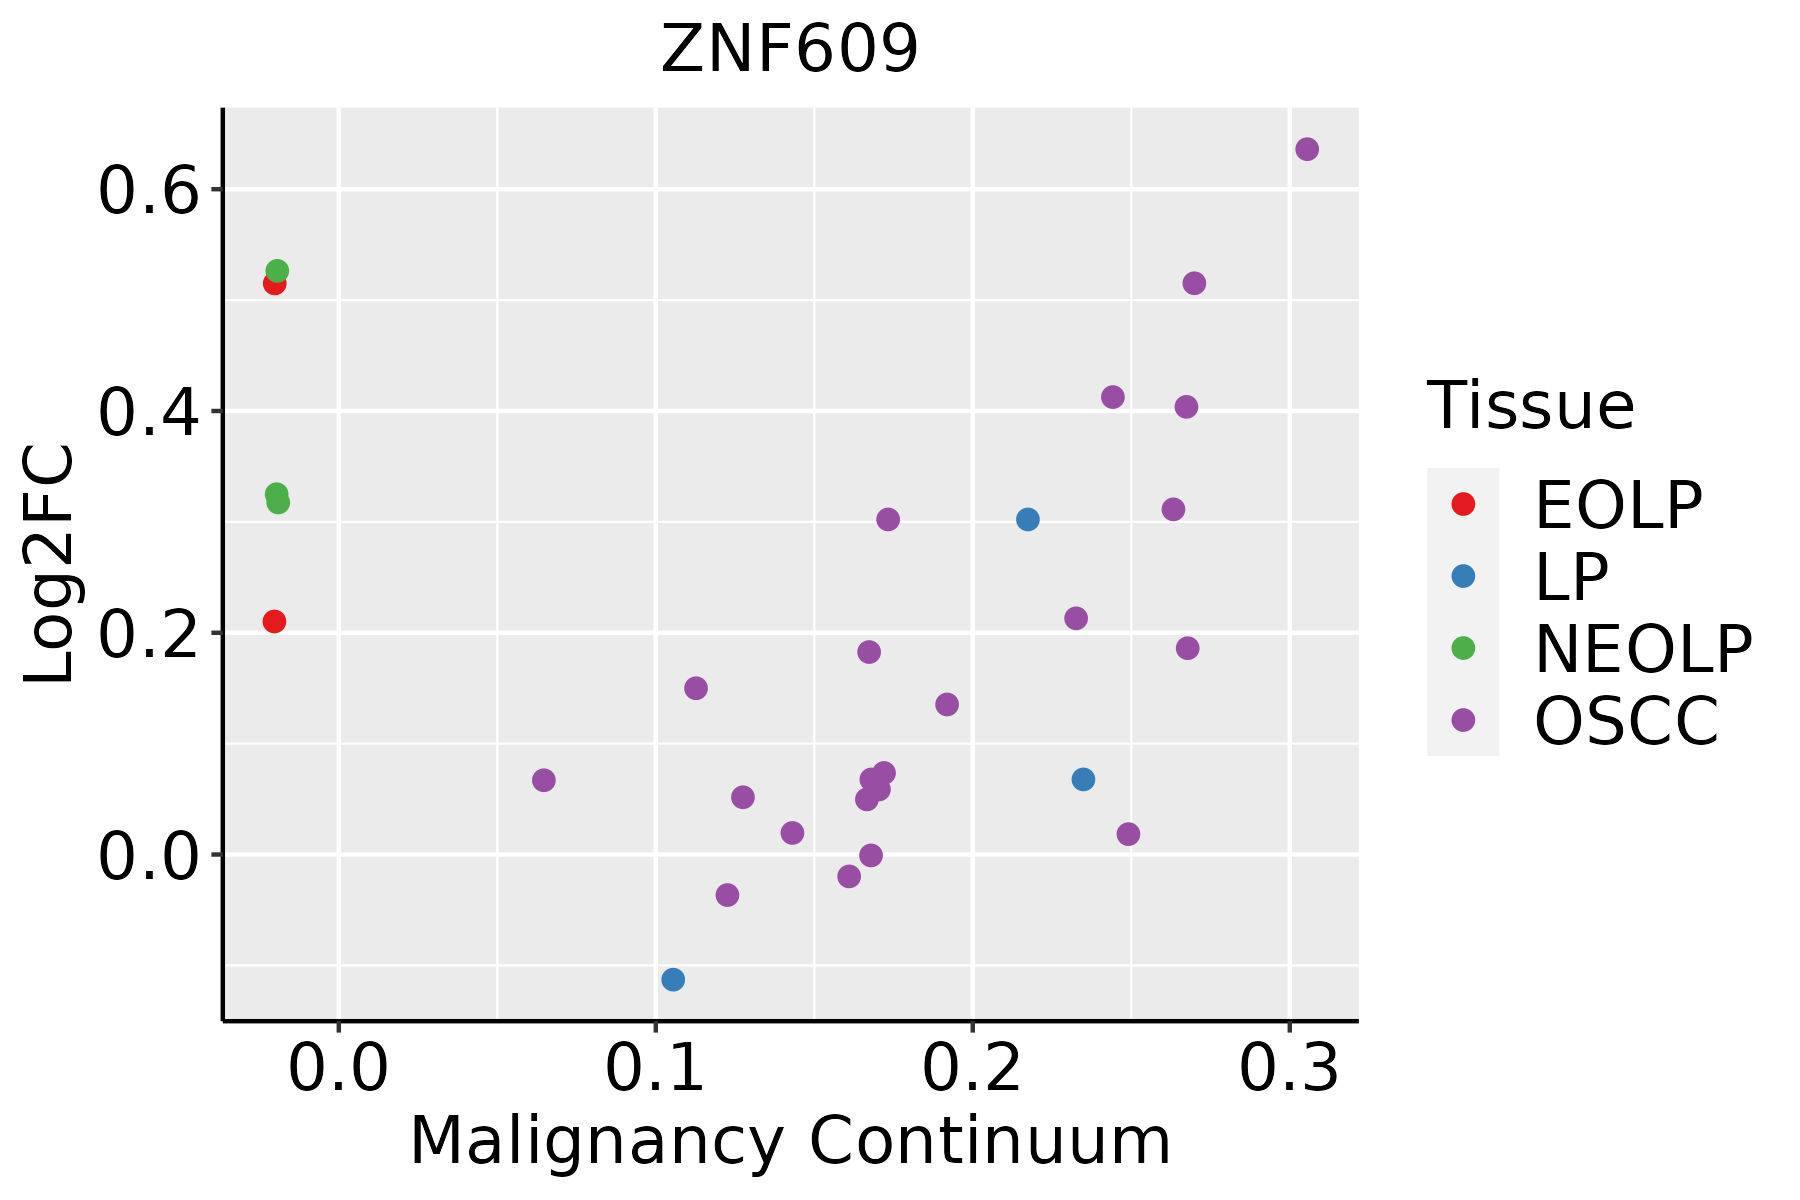 | EOLP: Erosive Oral lichen planus |
| LP: leukoplakia | ||
| NEOLP: Non-erosive oral lichen planus | ||
| OSCC: Oral squamous cell carcinoma | ||
| Prostate | 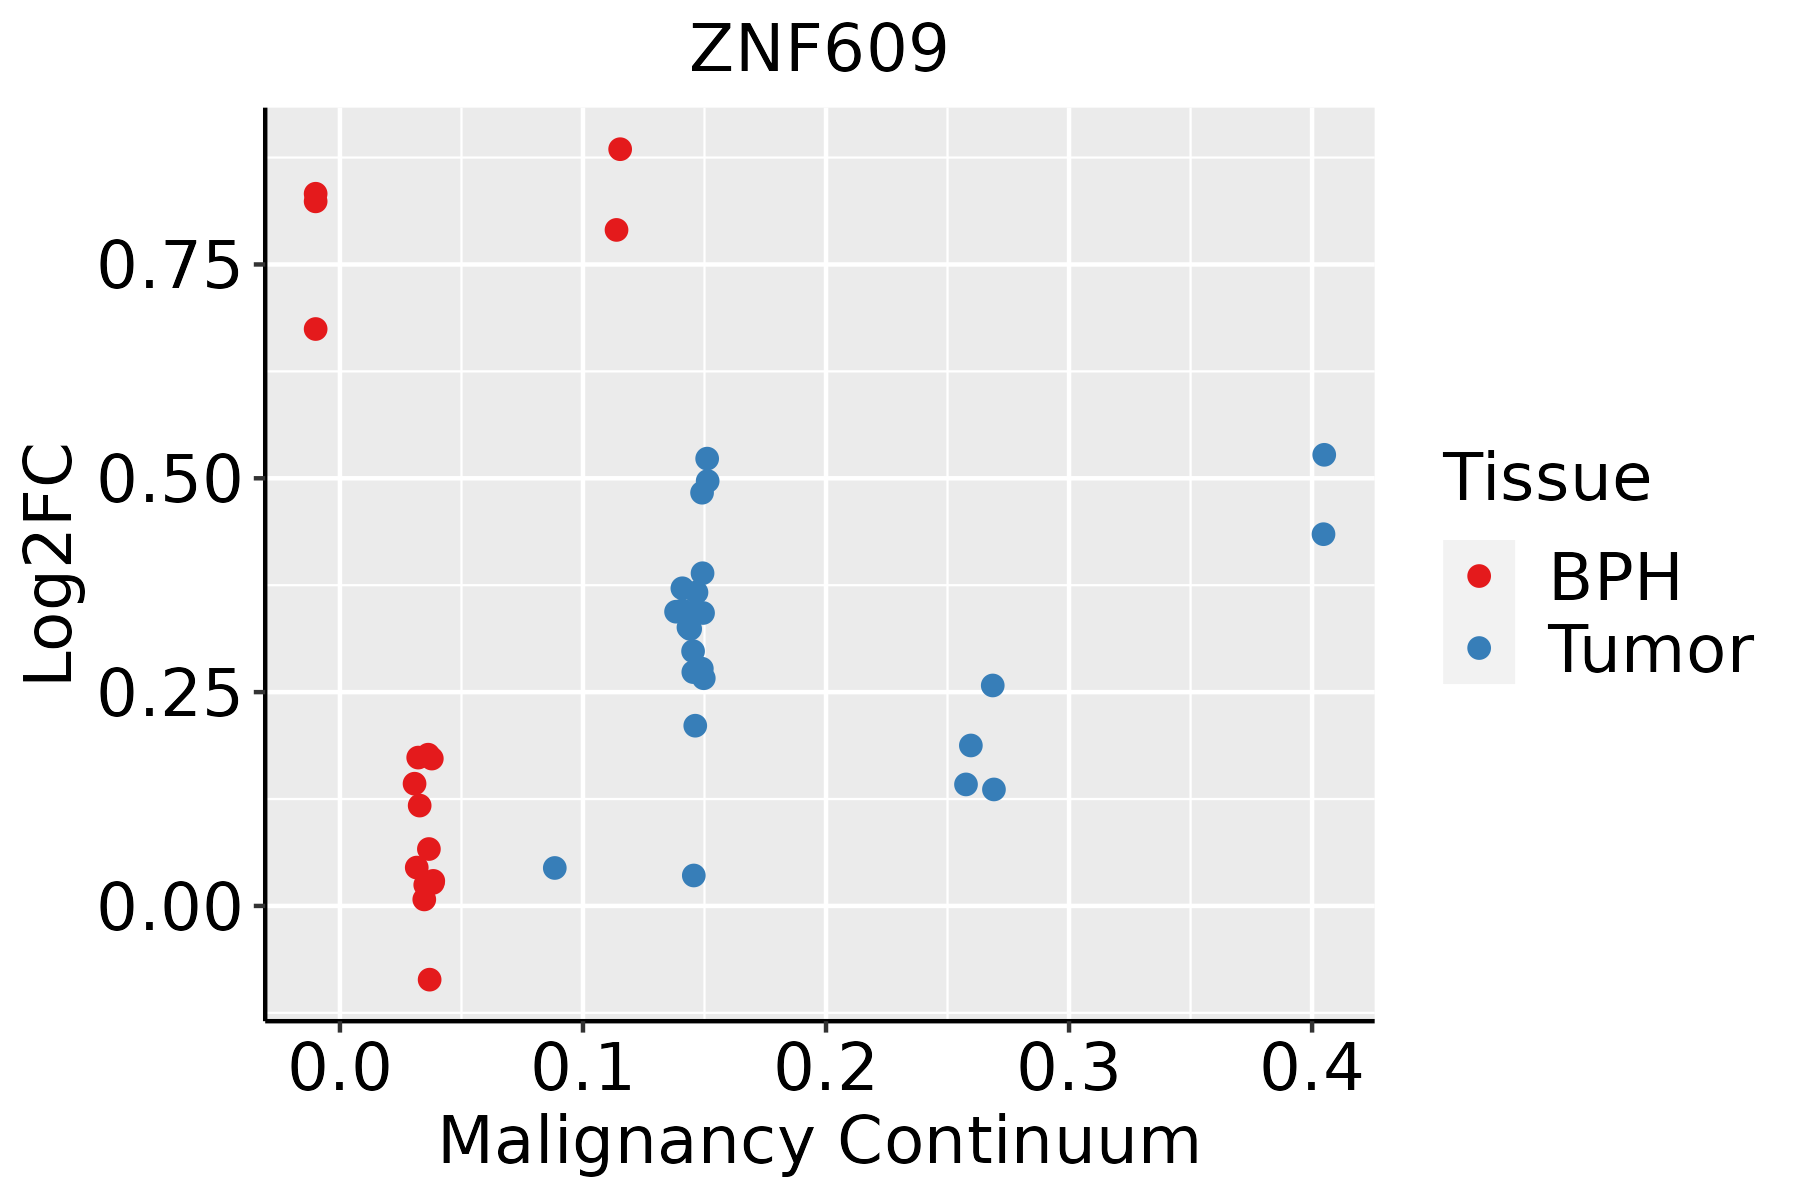 | BPH: Benign Prostatic Hyperplasia |
| Thyroid | 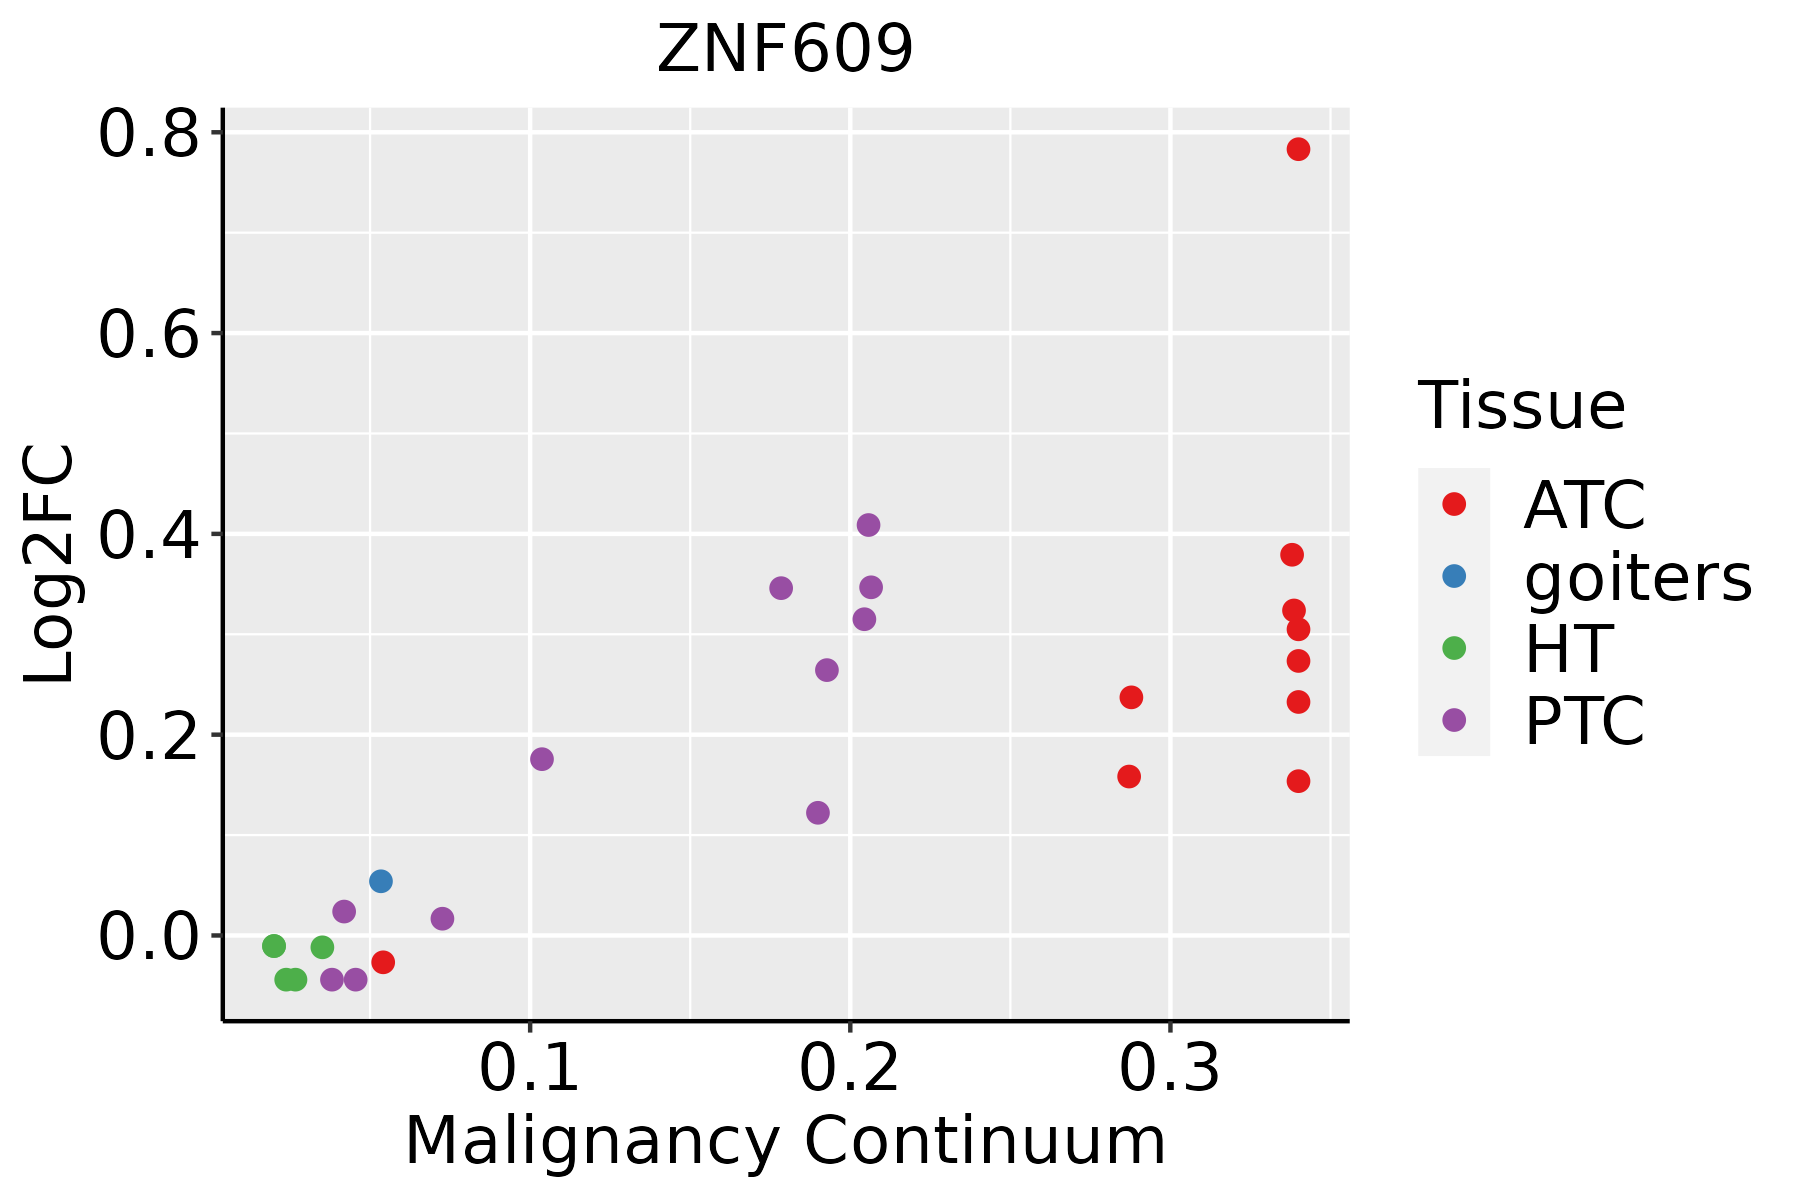 | ATC: Anaplastic thyroid cancer |
| HT: Hashimoto's thyroiditis | ||
| PTC: Papillary thyroid cancer |
| ∗log2FC in expression of this searched gene in stem-like cells from each diseased tissue sample relative to stem-like cells in normal samples in each tissue plotted against the malignancy continuum. Samples are colored based on if they are from different disease stage. |
Top |
Malignant transformation related pathway analysis |
| Find out the enriched GO biological processes and KEGG pathways involved in transition from healthy to precancer to cancer |
| Tissue | Disease Stage | Enriched GO biological Processes |
| Colorectum | AD |  |
| Colorectum | SER |  |
| Colorectum | MSS |  |
| Colorectum | MSI-H |  |
| Colorectum | FAP |  |
| ∗Top 15 enriched GO BP terms are showed in the bar plot of each disease state in each tissue. Each row represents a significant GO biological process which is colored according to the -log10(p.adjust). |
| Page: 1 2 3 4 5 6 7 8 9 |
| GO ID | Tissue | Disease Stage | Description | Gene Ratio | Bg Ratio | pvalue | p.adjust | Count |
| GO:00075173 | Cervix | CC | muscle organ development | 58/2311 | 327/18723 | 2.73e-03 | 1.85e-02 | 58 |
| GO:20012241 | Cervix | CC | positive regulation of neuron migration | 6/2311 | 16/18723 | 9.35e-03 | 4.66e-02 | 6 |
| GO:00075174 | Endometrium | AEH | muscle organ development | 60/2100 | 327/18723 | 8.19e-05 | 1.22e-03 | 60 |
| GO:00017642 | Endometrium | AEH | neuron migration | 31/2100 | 156/18723 | 1.08e-03 | 9.46e-03 | 31 |
| GO:000751712 | Endometrium | EEC | muscle organ development | 59/2168 | 327/18723 | 3.49e-04 | 3.85e-03 | 59 |
| GO:00017641 | Endometrium | EEC | neuron migration | 33/2168 | 156/18723 | 4.17e-04 | 4.38e-03 | 33 |
| GO:2001224 | Liver | HCC | positive regulation of neuron migration | 14/7958 | 16/18723 | 2.73e-04 | 1.98e-03 | 14 |
| GO:0001764 | Lung | IAC | neuron migration | 31/2061 | 156/18723 | 7.89e-04 | 1.02e-02 | 31 |
| GO:0007517 | Lung | AAH | muscle organ development | 22/613 | 327/18723 | 1.20e-03 | 3.33e-02 | 22 |
| GO:00075176 | Oral cavity | EOLP | muscle organ development | 57/2218 | 327/18723 | 1.76e-03 | 1.15e-02 | 57 |
| GO:000751714 | Oral cavity | NEOLP | muscle organ development | 56/2005 | 327/18723 | 2.65e-04 | 2.70e-03 | 56 |
| GO:00017643 | Oral cavity | NEOLP | neuron migration | 31/2005 | 156/18723 | 4.96e-04 | 4.40e-03 | 31 |
| GO:00075175 | Prostate | BPH | muscle organ development | 71/3107 | 327/18723 | 9.00e-03 | 3.84e-02 | 71 |
| GO:000751713 | Prostate | Tumor | muscle organ development | 74/3246 | 327/18723 | 8.03e-03 | 3.54e-02 | 74 |
| GO:000751716 | Thyroid | ATC | muscle organ development | 139/6293 | 327/18723 | 4.45e-04 | 2.64e-03 | 139 |
| Page: 1 |
| Pathway ID | Tissue | Disease Stage | Description | Gene Ratio | Bg Ratio | pvalue | p.adjust | qvalue | Count |
| Page: 1 |
Top |
Cell-cell communication analysis |
| Identification of potential cell-cell interactions between two cell types and their ligand-receptor pairs for different disease states |
| Ligand | Receptor | LRpair | Pathway | Tissue | Disease Stage |
| Page: 1 |
Top |
Single-cell gene regulatory network inference analysis |
| Find out the significant the regulons (TFs) and the target genes of each regulon across cell types for different disease states |
| TF | Cell Type | Tissue | Disease Stage | Target Gene | RSS | Regulon Activity |
| ∗The dot plots of a searched regulon are shown for all cell subpopulations in each disease state of each tissue based on the regulon specific score inferred using pySCENIC and by calculating the average expression. |
| Page: 1 |
Top |
Somatic mutation of malignant transformation related genes |
| Annotation of somatic variants for genes involved in malignant transformation |
| Hugo Symbol | Variant Class | Variant Classification | dbSNP RS | HGVSc | HGVSp | HGVSp Short | SWISSPROT | BIOTYPE | SIFT | PolyPhen | Tumor Sample Barcode | Tissue | Histology | Sex | Age | Stage | Therapy Types | Drugs | Outcome |
| ZNF609 | SNV | Missense_Mutation | c.781C>T | p.Pro261Ser | p.P261S | O15014 | protein_coding | deleterious(0.02) | probably_damaging(0.964) | TCGA-AN-A0AJ-01 | Breast | breast invasive carcinoma | Female | >=65 | I/II | Unknown | Unknown | SD | |
| ZNF609 | SNV | Missense_Mutation | novel | c.457N>A | p.Val153Ile | p.V153I | O15014 | protein_coding | tolerated(0.32) | benign(0.003) | TCGA-B6-A0IJ-01 | Breast | breast invasive carcinoma | Female | <65 | I/II | Unknown | Unknown | SD |
| ZNF609 | SNV | Missense_Mutation | c.952G>C | p.Val318Leu | p.V318L | O15014 | protein_coding | deleterious(0) | probably_damaging(0.935) | TCGA-D8-A1JT-01 | Breast | breast invasive carcinoma | Female | >=65 | I/II | Hormone Therapy | arimidex | SD | |
| ZNF609 | SNV | Missense_Mutation | rs756586641 | c.389N>G | p.Asn130Ser | p.N130S | O15014 | protein_coding | tolerated(0.89) | benign(0.001) | TCGA-E2-A152-01 | Breast | breast invasive carcinoma | Female | <65 | I/II | Targeted Molecular therapy | trastuzumab | PD |
| ZNF609 | SNV | Missense_Mutation | c.3647C>G | p.Ser1216Cys | p.S1216C | O15014 | protein_coding | deleterious(0) | probably_damaging(0.997) | TCGA-E2-A1LH-01 | Breast | breast invasive carcinoma | Female | <65 | I/II | Chemotherapy | adriamycin | SD | |
| ZNF609 | SNV | Missense_Mutation | novel | c.3103N>T | p.Ala1035Ser | p.A1035S | O15014 | protein_coding | tolerated(1) | benign(0) | TCGA-E9-A3X8-01 | Breast | breast invasive carcinoma | Female | <65 | I/II | Chemotherapy | cyclophosphane | CR |
| ZNF609 | SNV | Missense_Mutation | novel | c.164A>G | p.Lys55Arg | p.K55R | O15014 | protein_coding | tolerated(0.06) | probably_damaging(0.99) | TCGA-EW-A1P4-01 | Breast | breast invasive carcinoma | Female | <65 | I/II | Chemotherapy | docetaxel | SD |
| ZNF609 | SNV | Missense_Mutation | novel | c.43N>A | p.Ala15Thr | p.A15T | O15014 | protein_coding | tolerated(0.27) | benign(0.005) | TCGA-OL-A97C-01 | Breast | breast invasive carcinoma | Female | >=65 | I/II | Unknown | Unknown | PD |
| ZNF609 | insertion | Frame_Shift_Ins | novel | c.3302_3303insACAAGAAGGCAGAGATGGGCCTGAAGGAGCGG | p.Ser1102GlnfsTer17 | p.S1102Qfs*17 | O15014 | protein_coding | TCGA-AN-A0FS-01 | Breast | breast invasive carcinoma | Female | <65 | I/II | Unknown | Unknown | SD | ||
| ZNF609 | SNV | Missense_Mutation | novel | c.1160N>T | p.Ala387Val | p.A387V | O15014 | protein_coding | deleterious(0.04) | benign(0.017) | TCGA-2W-A8YY-01 | Cervix | cervical & endocervical cancer | Female | <65 | I/II | Chemotherapy | cisplatin | CR |
| Page: 1 2 3 4 5 6 7 8 9 10 11 12 |
Top |
Related drugs of malignant transformation related genes |
| Identification of chemicals and drugs interact with genes involved in malignant transfromation |
| (DGIdb 4.0) |
| Entrez ID | Symbol | Category | Interaction Types | Drug Claim Name | Drug Name | PMIDs |
| Page: 1 |

Copyright 2023-Present -The University of Texas Health Science Center at Houston |