
|
|||||
|
 | |
| |
| |
| |
| |
| |
|
Gene: ZNF600 |
Gene summary for ZNF600 |
| Gene information | Species | Human | Gene symbol | ZNF600 | Gene ID | 162966 |
| Gene name | zinc finger protein 600 | |
| Gene Alias | KR-ZNF1 | |
| Cytomap | 19q13.41 | |
| Gene Type | protein-coding | GO ID | GO:0006139 | UniProtAcc | Q6ZNG1 |
Top |
Malignant transformation analysis |
| Identification of the aberrant gene expression in precancerous and cancerous lesions by comparing the gene expression of stem-like cells in diseased tissues with normal stem cells |
| Entrez ID | Symbol | Replicates | Species | Organ | Tissue | Adj P-value | Log2FC | Malignancy |
| 162966 | ZNF600 | LZE20T | Human | Esophagus | ESCC | 1.67e-05 | 1.71e-01 | 0.0662 |
| 162966 | ZNF600 | LZE24T | Human | Esophagus | ESCC | 1.77e-12 | 3.73e-01 | 0.0596 |
| 162966 | ZNF600 | P1T-E | Human | Esophagus | ESCC | 3.84e-03 | 3.17e-01 | 0.0875 |
| 162966 | ZNF600 | P2T-E | Human | Esophagus | ESCC | 1.36e-17 | 1.49e-01 | 0.1177 |
| 162966 | ZNF600 | P4T-E | Human | Esophagus | ESCC | 6.18e-15 | 3.61e-01 | 0.1323 |
| 162966 | ZNF600 | P5T-E | Human | Esophagus | ESCC | 4.70e-10 | 2.22e-01 | 0.1327 |
| 162966 | ZNF600 | P8T-E | Human | Esophagus | ESCC | 2.23e-17 | 2.94e-01 | 0.0889 |
| 162966 | ZNF600 | P10T-E | Human | Esophagus | ESCC | 1.87e-20 | 2.45e-01 | 0.116 |
| 162966 | ZNF600 | P11T-E | Human | Esophagus | ESCC | 1.44e-06 | 3.14e-01 | 0.1426 |
| 162966 | ZNF600 | P12T-E | Human | Esophagus | ESCC | 5.34e-15 | 3.26e-01 | 0.1122 |
| 162966 | ZNF600 | P16T-E | Human | Esophagus | ESCC | 9.76e-07 | 5.82e-02 | 0.1153 |
| 162966 | ZNF600 | P17T-E | Human | Esophagus | ESCC | 2.91e-07 | 2.51e-01 | 0.1278 |
| 162966 | ZNF600 | P20T-E | Human | Esophagus | ESCC | 1.25e-03 | 8.56e-02 | 0.1124 |
| 162966 | ZNF600 | P21T-E | Human | Esophagus | ESCC | 8.04e-16 | 3.27e-01 | 0.1617 |
| 162966 | ZNF600 | P22T-E | Human | Esophagus | ESCC | 1.00e-22 | 2.24e-01 | 0.1236 |
| 162966 | ZNF600 | P24T-E | Human | Esophagus | ESCC | 1.10e-10 | 1.11e-01 | 0.1287 |
| 162966 | ZNF600 | P26T-E | Human | Esophagus | ESCC | 9.48e-20 | 3.64e-01 | 0.1276 |
| 162966 | ZNF600 | P27T-E | Human | Esophagus | ESCC | 2.85e-25 | 3.58e-01 | 0.1055 |
| 162966 | ZNF600 | P28T-E | Human | Esophagus | ESCC | 2.70e-09 | 1.94e-01 | 0.1149 |
| 162966 | ZNF600 | P30T-E | Human | Esophagus | ESCC | 2.96e-15 | 5.83e-01 | 0.137 |
| Page: 1 2 3 |
| Tissue | Expression Dynamics | Abbreviation |
| Esophagus | 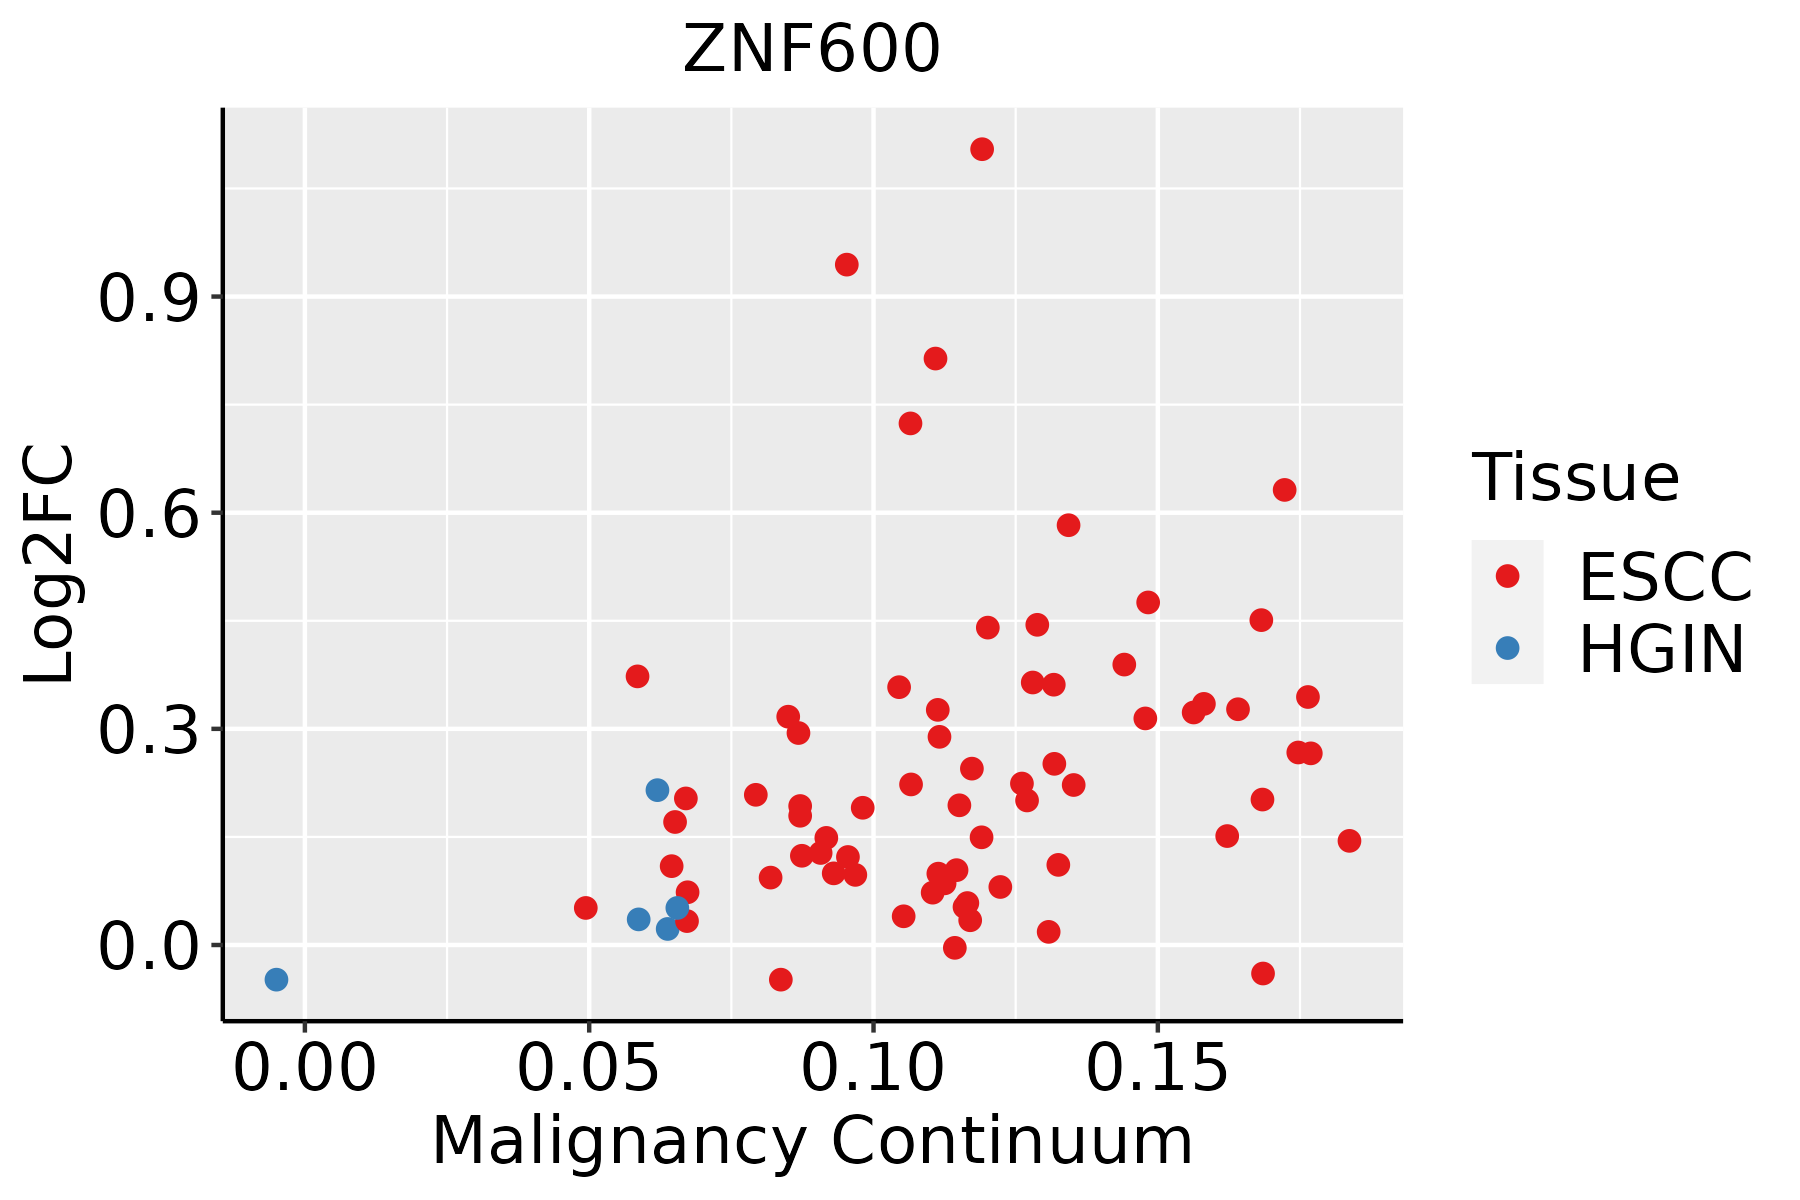 | ESCC: Esophageal squamous cell carcinoma |
| HGIN: High-grade intraepithelial neoplasias | ||
| LGIN: Low-grade intraepithelial neoplasias | ||
| Lung | 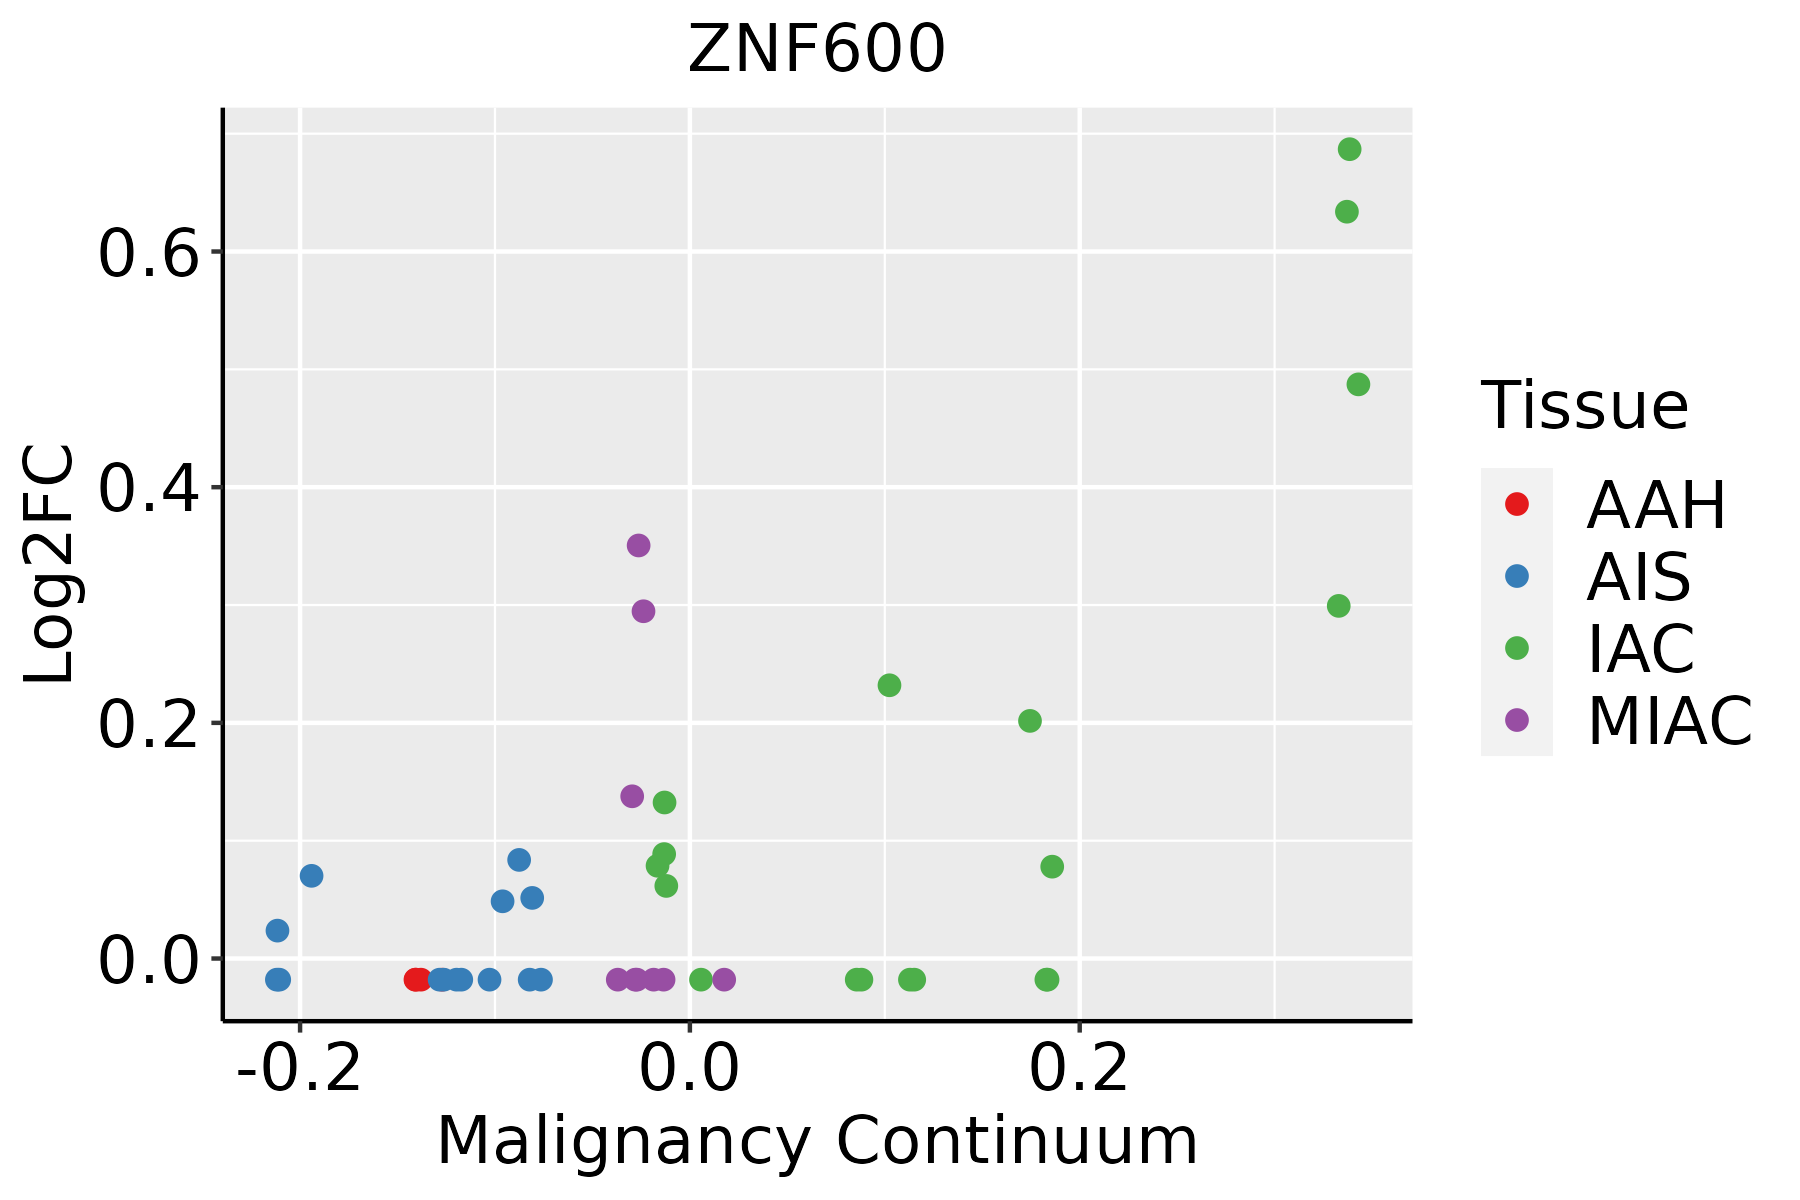 | AAH: Atypical adenomatous hyperplasia |
| AIS: Adenocarcinoma in situ | ||
| IAC: Invasive lung adenocarcinoma | ||
| MIA: Minimally invasive adenocarcinoma |
| ∗log2FC in expression of this searched gene in stem-like cells from each diseased tissue sample relative to stem-like cells in normal samples in each tissue plotted against the malignancy continuum. Samples are colored based on if they are from different disease stage. |
Top |
Malignant transformation related pathway analysis |
| Find out the enriched GO biological processes and KEGG pathways involved in transition from healthy to precancer to cancer |
| Tissue | Disease Stage | Enriched GO biological Processes |
| Colorectum | AD |  |
| Colorectum | SER |  |
| Colorectum | MSS |  |
| Colorectum | MSI-H |  |
| Colorectum | FAP |  |
| ∗Top 15 enriched GO BP terms are showed in the bar plot of each disease state in each tissue. Each row represents a significant GO biological process which is colored according to the -log10(p.adjust). |
| Page: 1 2 3 4 5 6 7 8 9 |
| GO ID | Tissue | Disease Stage | Description | Gene Ratio | Bg Ratio | pvalue | p.adjust | Count |
| Page: 1 |
| Pathway ID | Tissue | Disease Stage | Description | Gene Ratio | Bg Ratio | pvalue | p.adjust | qvalue | Count |
| Page: 1 |
Top |
Cell-cell communication analysis |
| Identification of potential cell-cell interactions between two cell types and their ligand-receptor pairs for different disease states |
| Ligand | Receptor | LRpair | Pathway | Tissue | Disease Stage |
| Page: 1 |
Top |
Single-cell gene regulatory network inference analysis |
| Find out the significant the regulons (TFs) and the target genes of each regulon across cell types for different disease states |
| TF | Cell Type | Tissue | Disease Stage | Target Gene | RSS | Regulon Activity |
| ZNF600 | GDT | Oral cavity | EOLP | FAM13A,ATL1,EIF3J-DT, etc. | 1.85e-01 |  |
| ZNF600 | GDT | Oral cavity | Healthy | FAM13A,ATL1,EIF3J-DT, etc. | 1.39e-01 |  |
| ZNF600 | GDT | Oral cavity | LP | FAM13A,ATL1,EIF3J-DT, etc. | 1.77e-01 |  |
| ZNF600 | GDT | Oral cavity | NEOLP | FAM13A,ATL1,EIF3J-DT, etc. | 1.92e-01 |  |
| ZNF600 | GDT | Oral cavity | OSCC | FAM13A,ATL1,EIF3J-DT, etc. | 1.43e-01 |  |
| ∗The dot plots of a searched regulon are shown for all cell subpopulations in each disease state of each tissue based on the regulon specific score inferred using pySCENIC and by calculating the average expression. |
| Page: 1 |
Top |
Somatic mutation of malignant transformation related genes |
| Annotation of somatic variants for genes involved in malignant transformation |
| Hugo Symbol | Variant Class | Variant Classification | dbSNP RS | HGVSc | HGVSp | HGVSp Short | SWISSPROT | BIOTYPE | SIFT | PolyPhen | Tumor Sample Barcode | Tissue | Histology | Sex | Age | Stage | Therapy Types | Drugs | Outcome |
| ZNF600 | SNV | Missense_Mutation | novel | c.2161N>G | p.Leu721Val | p.L721V | Q6ZNG1 | protein_coding | tolerated(0.17) | benign(0.003) | TCGA-A7-A26I-01 | Breast | breast invasive carcinoma | Female | >=65 | I/II | Chemotherapy | cytoxan | SD |
| ZNF600 | SNV | Missense_Mutation | c.922N>C | p.Asp308His | p.D308H | Q6ZNG1 | protein_coding | deleterious(0.03) | possibly_damaging(0.823) | TCGA-A8-A081-01 | Breast | breast invasive carcinoma | Female | >=65 | I/II | Unknown | Unknown | SD | |
| ZNF600 | SNV | Missense_Mutation | rs762792866 | c.1124N>A | p.Cys375Tyr | p.C375Y | Q6ZNG1 | protein_coding | tolerated(1) | benign(0.005) | TCGA-A8-A08P-01 | Breast | breast invasive carcinoma | Female | >=65 | III/IV | Chemotherapy | 5-fluorouracil | CR |
| ZNF600 | SNV | Missense_Mutation | c.1705N>A | p.Leu569Ile | p.L569I | Q6ZNG1 | protein_coding | deleterious(0.02) | probably_damaging(0.988) | TCGA-A8-A09Z-01 | Breast | breast invasive carcinoma | Female | >=65 | I/II | Unknown | Unknown | SD | |
| ZNF600 | SNV | Missense_Mutation | novel | c.158N>T | p.Arg53Ile | p.R53I | Q6ZNG1 | protein_coding | tolerated(0.09) | benign(0.086) | TCGA-AN-A046-01 | Breast | breast invasive carcinoma | Female | >=65 | I/II | Unknown | Unknown | SD |
| ZNF600 | SNV | Missense_Mutation | novel | c.1358G>T | p.Cys453Phe | p.C453F | Q6ZNG1 | protein_coding | tolerated(0.71) | benign(0.044) | TCGA-S3-AA10-01 | Breast | breast invasive carcinoma | Female | >=65 | I/II | Chemotherapy | cytoxan | CR |
| ZNF600 | SNV | Missense_Mutation | rs747468038 | c.1550N>A | p.Arg517His | p.R517H | Q6ZNG1 | protein_coding | tolerated(0.26) | benign(0.012) | TCGA-2W-A8YY-01 | Cervix | cervical & endocervical cancer | Female | <65 | I/II | Chemotherapy | cisplatin | CR |
| ZNF600 | SNV | Missense_Mutation | rs202167068 | c.385C>T | p.Pro129Ser | p.P129S | Q6ZNG1 | protein_coding | tolerated(0.58) | benign(0) | TCGA-DS-A1OA-01 | Cervix | cervical & endocervical cancer | Female | >=65 | I/II | Chemotherapy | carboplatin | PD |
| ZNF600 | SNV | Missense_Mutation | c.1973N>C | p.Arg658Thr | p.R658T | Q6ZNG1 | protein_coding | tolerated(0.13) | possibly_damaging(0.849) | TCGA-VS-A8QC-01 | Cervix | cervical & endocervical cancer | Female | <65 | I/II | Chemotherapy | paclitaxel | PD | |
| ZNF600 | SNV | Missense_Mutation | novel | c.1040N>C | p.Arg347Thr | p.R347T | Q6ZNG1 | protein_coding | tolerated(0.62) | benign(0.394) | TCGA-VS-A959-01 | Cervix | cervical & endocervical cancer | Female | >=65 | I/II | Unknown | Unknown | SD |
| Page: 1 2 3 4 5 6 7 8 9 10 11 |
Top |
Related drugs of malignant transformation related genes |
| Identification of chemicals and drugs interact with genes involved in malignant transfromation |
| (DGIdb 4.0) |
| Entrez ID | Symbol | Category | Interaction Types | Drug Claim Name | Drug Name | PMIDs |
| Page: 1 |

Copyright 2023-Present -The University of Texas Health Science Center at Houston |