
|
|||||
|
 | |
| |
| |
| |
| |
| |
|
Gene: ZNF598 |
Gene summary for ZNF598 |
| Gene information | Species | Human | Gene symbol | ZNF598 | Gene ID | 90850 |
| Gene name | zinc finger protein 598, E3 ubiquitin ligase | |
| Gene Alias | HEL2 | |
| Cytomap | 16p13.3 | |
| Gene Type | protein-coding | GO ID | GO:0006412 | UniProtAcc | Q86UK7 |
Top |
Malignant transformation analysis |
| Identification of the aberrant gene expression in precancerous and cancerous lesions by comparing the gene expression of stem-like cells in diseased tissues with normal stem cells |
| Entrez ID | Symbol | Replicates | Species | Organ | Tissue | Adj P-value | Log2FC | Malignancy |
| 90850 | ZNF598 | LZE7T | Human | Esophagus | ESCC | 2.87e-11 | 3.81e-01 | 0.0667 |
| 90850 | ZNF598 | LZE8T | Human | Esophagus | ESCC | 6.88e-05 | 7.16e-02 | 0.067 |
| 90850 | ZNF598 | LZE24T | Human | Esophagus | ESCC | 5.32e-11 | 1.77e-01 | 0.0596 |
| 90850 | ZNF598 | P1T-E | Human | Esophagus | ESCC | 1.07e-15 | 5.61e-01 | 0.0875 |
| 90850 | ZNF598 | P2T-E | Human | Esophagus | ESCC | 6.38e-18 | 1.96e-01 | 0.1177 |
| 90850 | ZNF598 | P4T-E | Human | Esophagus | ESCC | 5.75e-07 | 1.46e-01 | 0.1323 |
| 90850 | ZNF598 | P5T-E | Human | Esophagus | ESCC | 1.08e-03 | 7.33e-02 | 0.1327 |
| 90850 | ZNF598 | P8T-E | Human | Esophagus | ESCC | 7.79e-24 | 1.72e-01 | 0.0889 |
| 90850 | ZNF598 | P9T-E | Human | Esophagus | ESCC | 2.55e-12 | 1.13e-01 | 0.1131 |
| 90850 | ZNF598 | P10T-E | Human | Esophagus | ESCC | 5.16e-08 | 3.67e-02 | 0.116 |
| 90850 | ZNF598 | P11T-E | Human | Esophagus | ESCC | 1.55e-03 | 1.70e-01 | 0.1426 |
| 90850 | ZNF598 | P12T-E | Human | Esophagus | ESCC | 2.38e-08 | 1.01e-01 | 0.1122 |
| 90850 | ZNF598 | P15T-E | Human | Esophagus | ESCC | 9.14e-22 | 1.94e-01 | 0.1149 |
| 90850 | ZNF598 | P16T-E | Human | Esophagus | ESCC | 2.31e-04 | -2.33e-02 | 0.1153 |
| 90850 | ZNF598 | P17T-E | Human | Esophagus | ESCC | 6.13e-05 | 1.43e-01 | 0.1278 |
| 90850 | ZNF598 | P20T-E | Human | Esophagus | ESCC | 1.17e-09 | 1.31e-01 | 0.1124 |
| 90850 | ZNF598 | P21T-E | Human | Esophagus | ESCC | 3.21e-16 | 2.48e-01 | 0.1617 |
| 90850 | ZNF598 | P22T-E | Human | Esophagus | ESCC | 1.00e-09 | 9.43e-02 | 0.1236 |
| 90850 | ZNF598 | P23T-E | Human | Esophagus | ESCC | 1.16e-09 | 2.93e-01 | 0.108 |
| 90850 | ZNF598 | P24T-E | Human | Esophagus | ESCC | 5.16e-05 | 7.69e-02 | 0.1287 |
| Page: 1 2 3 4 5 |
| Tissue | Expression Dynamics | Abbreviation |
| Esophagus | 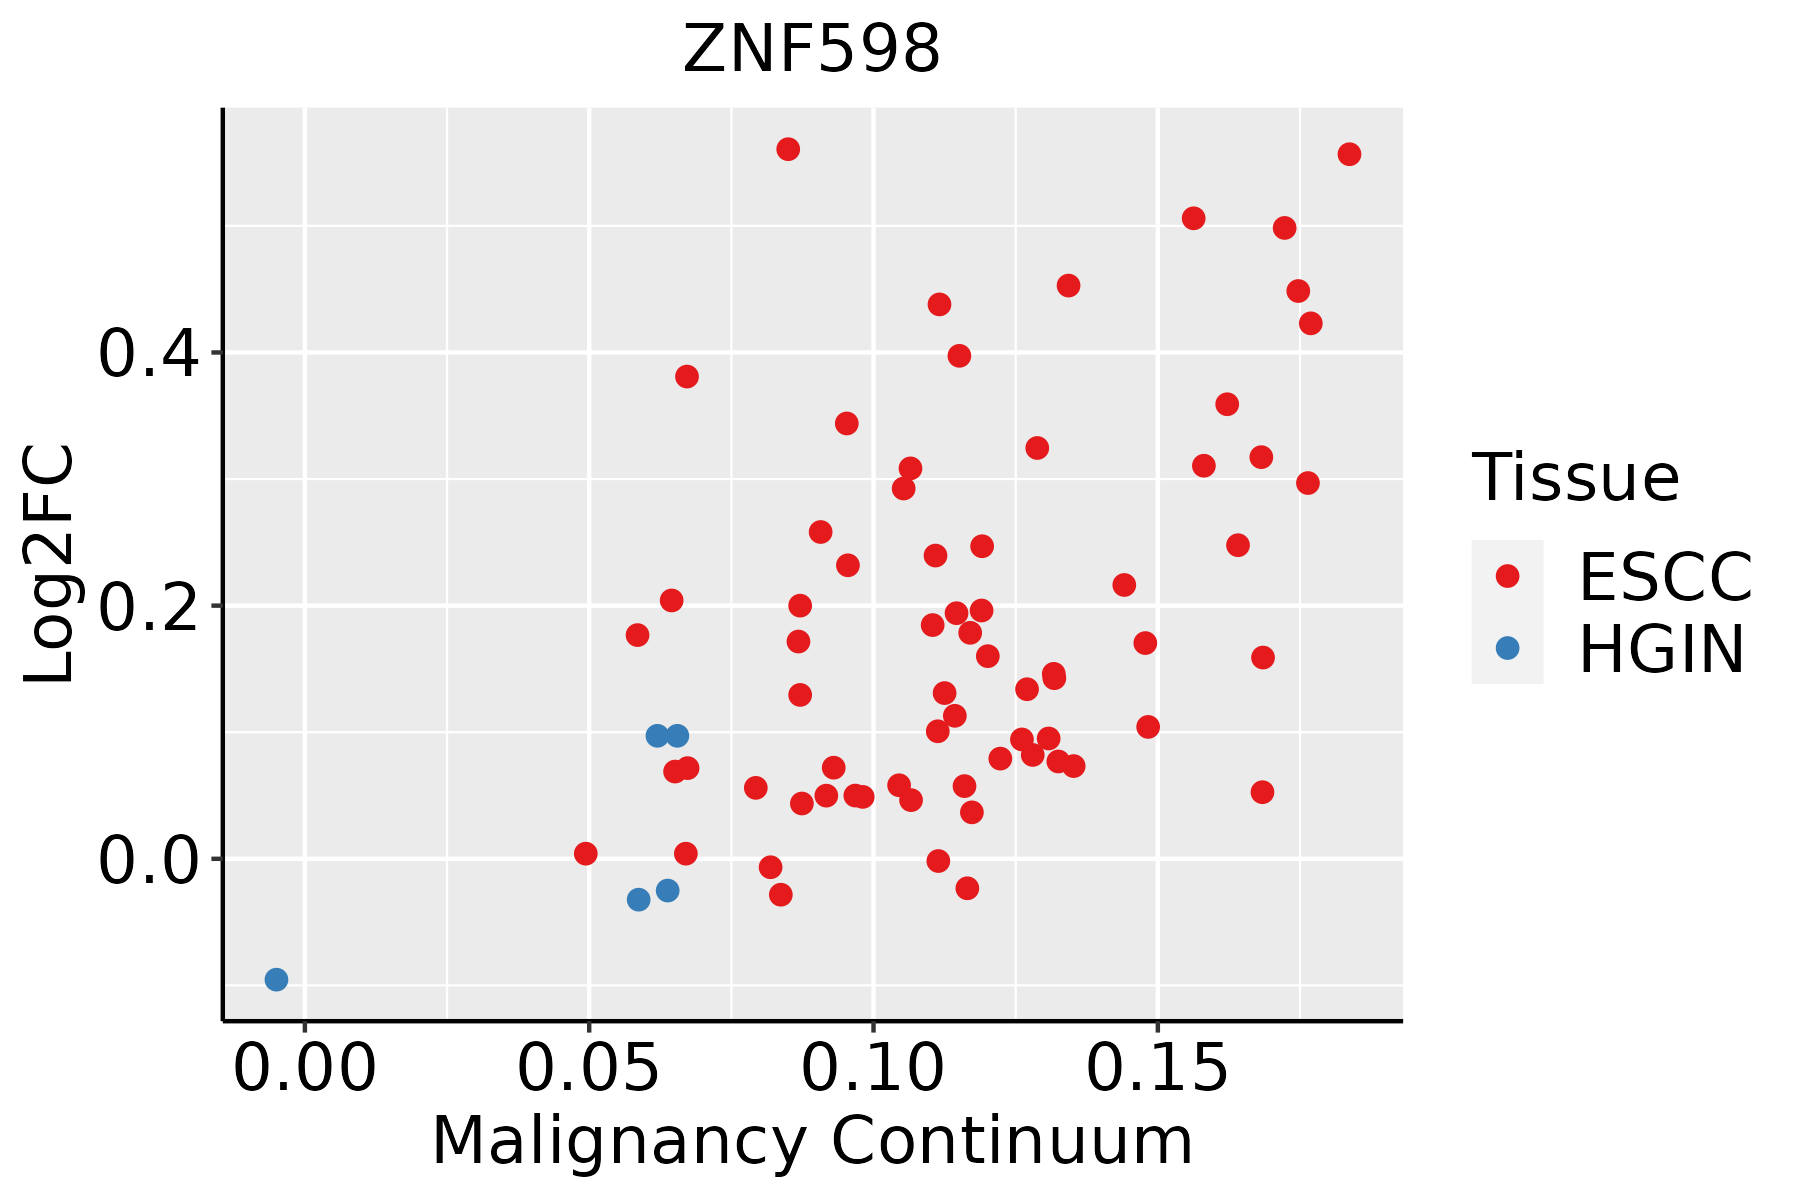 | ESCC: Esophageal squamous cell carcinoma |
| HGIN: High-grade intraepithelial neoplasias | ||
| LGIN: Low-grade intraepithelial neoplasias | ||
| Liver | 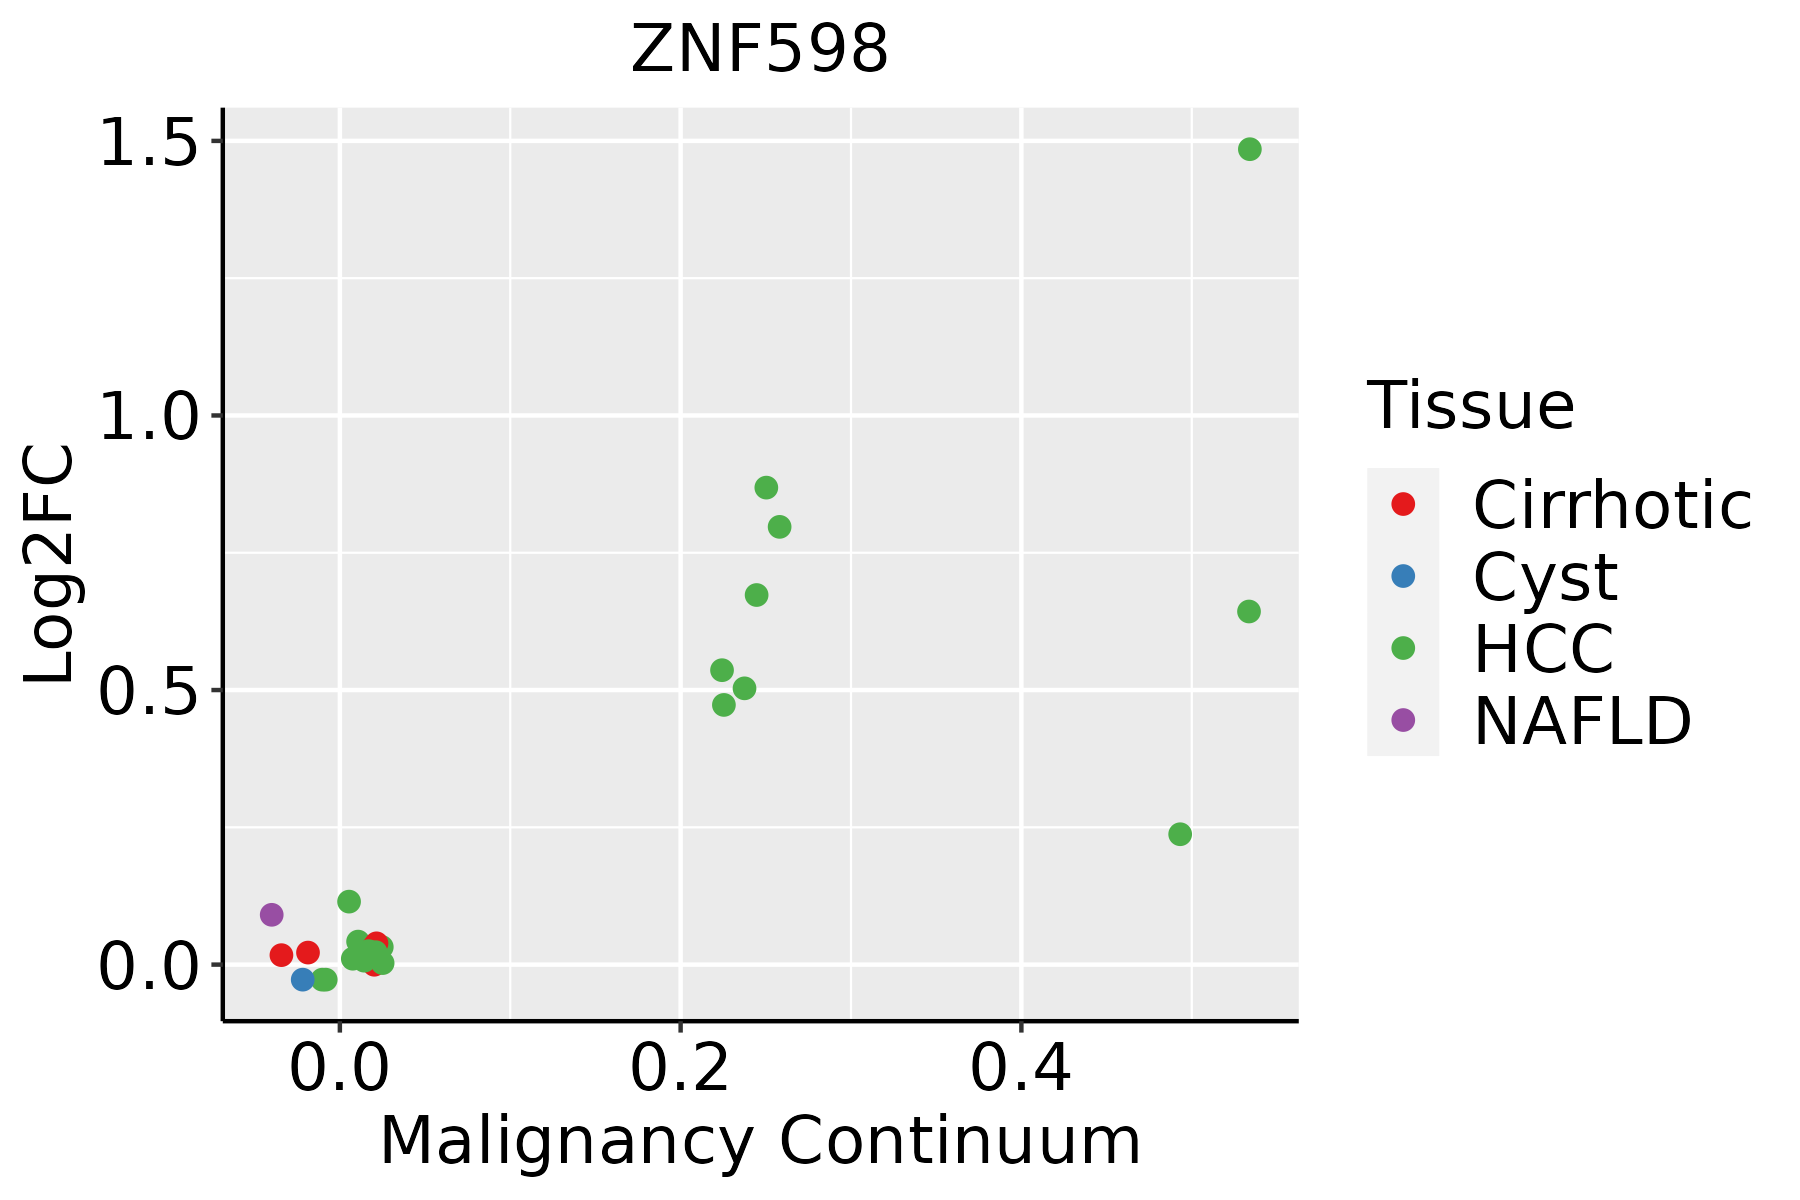 | HCC: Hepatocellular carcinoma |
| NAFLD: Non-alcoholic fatty liver disease | ||
| Oral Cavity | 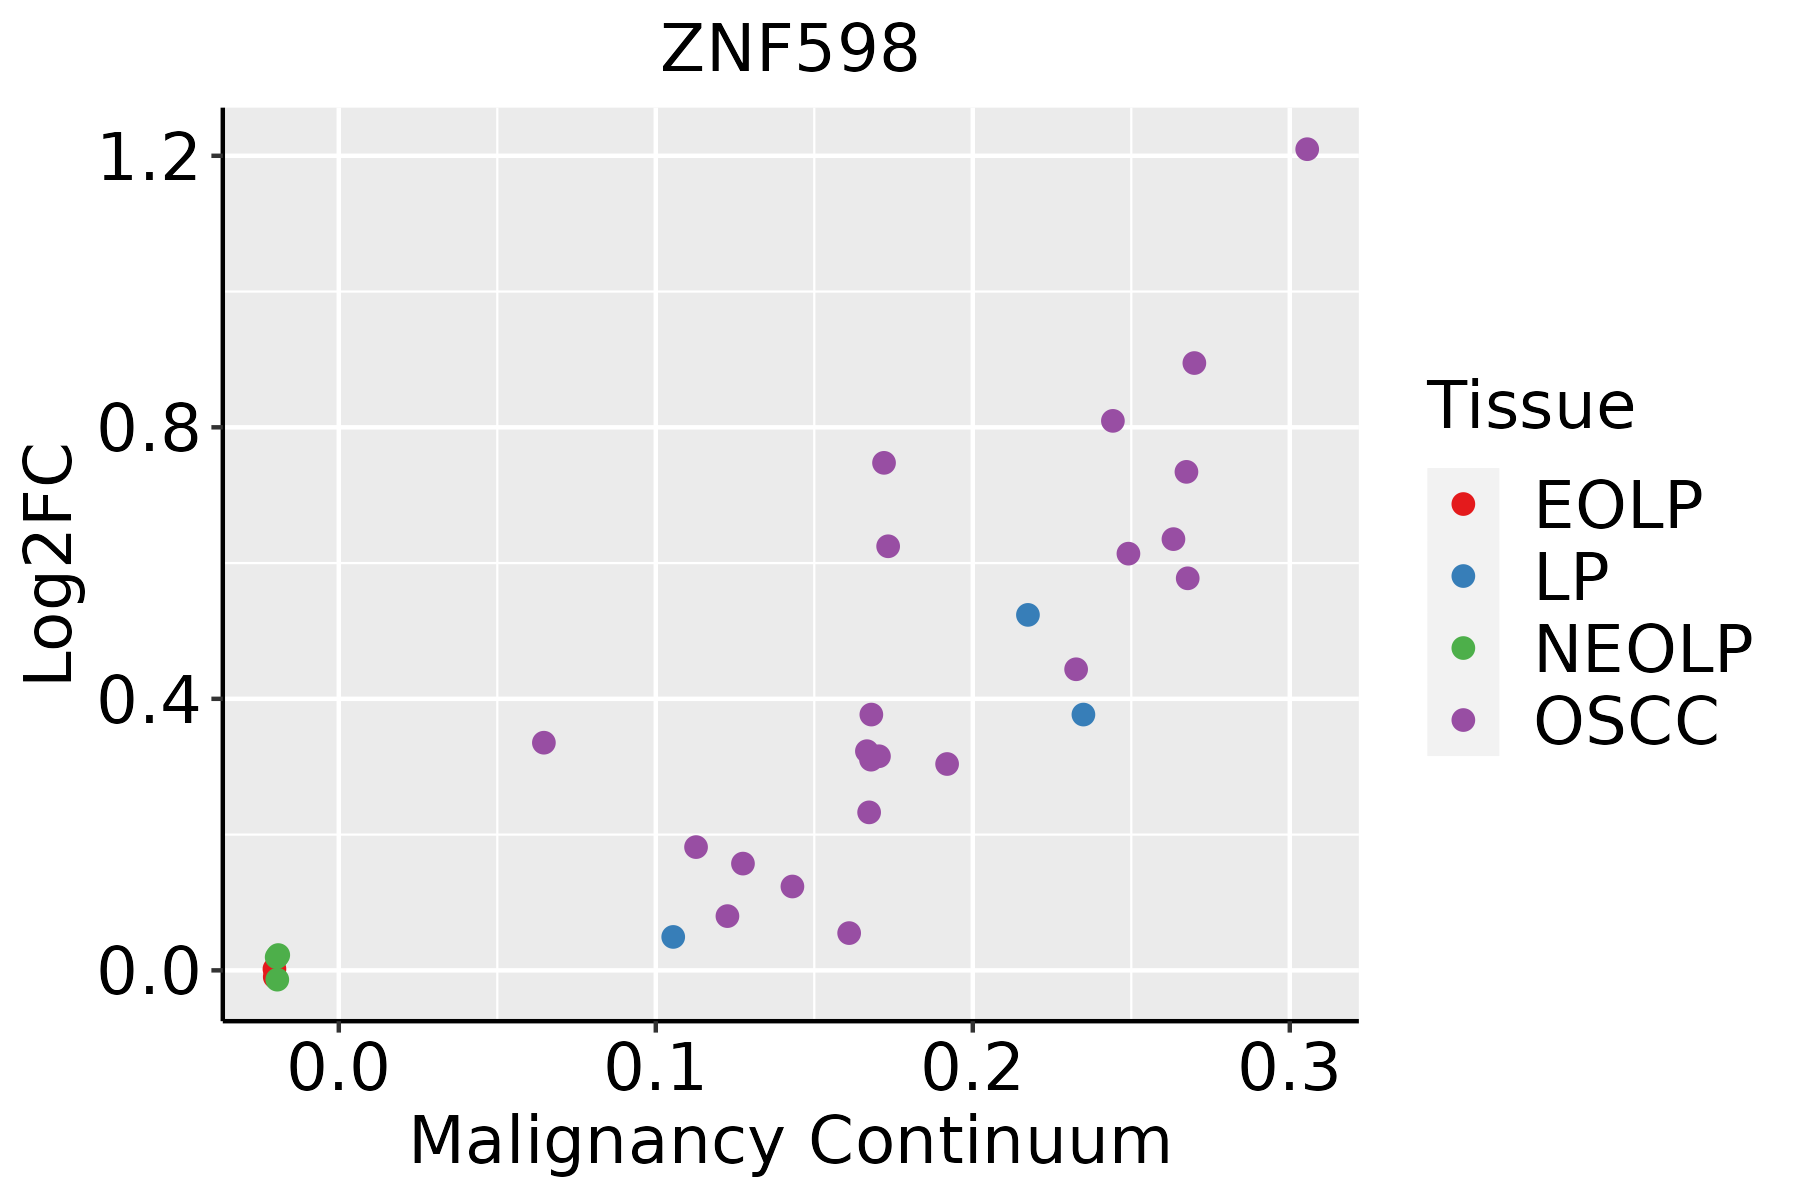 | EOLP: Erosive Oral lichen planus |
| LP: leukoplakia | ||
| NEOLP: Non-erosive oral lichen planus | ||
| OSCC: Oral squamous cell carcinoma | ||
| Skin |  | AK: Actinic keratosis |
| cSCC: Cutaneous squamous cell carcinoma | ||
| SCCIS:squamous cell carcinoma in situ |
| ∗log2FC in expression of this searched gene in stem-like cells from each diseased tissue sample relative to stem-like cells in normal samples in each tissue plotted against the malignancy continuum. Samples are colored based on if they are from different disease stage. |
Top |
Malignant transformation related pathway analysis |
| Find out the enriched GO biological processes and KEGG pathways involved in transition from healthy to precancer to cancer |
| Tissue | Disease Stage | Enriched GO biological Processes |
| Colorectum | AD |  |
| Colorectum | SER |  |
| Colorectum | MSS |  |
| Colorectum | MSI-H |  |
| Colorectum | FAP |  |
| ∗Top 15 enriched GO BP terms are showed in the bar plot of each disease state in each tissue. Each row represents a significant GO biological process which is colored according to the -log10(p.adjust). |
| Page: 1 2 3 4 5 6 7 8 9 |
| GO ID | Tissue | Disease Stage | Description | Gene Ratio | Bg Ratio | pvalue | p.adjust | Count |
| GO:0010498111 | Esophagus | ESCC | proteasomal protein catabolic process | 369/8552 | 490/18723 | 1.13e-41 | 1.80e-38 | 369 |
| GO:0043161111 | Esophagus | ESCC | proteasome-mediated ubiquitin-dependent protein catabolic process | 312/8552 | 412/18723 | 3.53e-36 | 4.48e-33 | 312 |
| GO:0006417111 | Esophagus | ESCC | regulation of translation | 304/8552 | 468/18723 | 1.53e-17 | 1.33e-15 | 304 |
| GO:00065136 | Esophagus | ESCC | protein monoubiquitination | 53/8552 | 67/18723 | 2.11e-08 | 4.03e-07 | 53 |
| GO:000641419 | Esophagus | ESCC | translational elongation | 41/8552 | 55/18723 | 1.26e-05 | 1.16e-04 | 41 |
| GO:001049822 | Liver | HCC | proteasomal protein catabolic process | 351/7958 | 490/18723 | 6.92e-40 | 1.46e-36 | 351 |
| GO:004316122 | Liver | HCC | proteasome-mediated ubiquitin-dependent protein catabolic process | 299/7958 | 412/18723 | 7.82e-36 | 8.27e-33 | 299 |
| GO:000641722 | Liver | HCC | regulation of translation | 287/7958 | 468/18723 | 8.79e-17 | 8.08e-15 | 287 |
| GO:000651311 | Liver | HCC | protein monoubiquitination | 44/7958 | 67/18723 | 1.08e-04 | 9.22e-04 | 44 |
| GO:000641412 | Liver | HCC | translational elongation | 36/7958 | 55/18723 | 4.94e-04 | 3.23e-03 | 36 |
| GO:001049820 | Oral cavity | OSCC | proteasomal protein catabolic process | 336/7305 | 490/18723 | 5.45e-41 | 8.63e-38 | 336 |
| GO:004316120 | Oral cavity | OSCC | proteasome-mediated ubiquitin-dependent protein catabolic process | 285/7305 | 412/18723 | 5.68e-36 | 5.99e-33 | 285 |
| GO:000641720 | Oral cavity | OSCC | regulation of translation | 274/7305 | 468/18723 | 4.39e-18 | 4.63e-16 | 274 |
| GO:00065135 | Oral cavity | OSCC | protein monoubiquitination | 47/7305 | 67/18723 | 2.32e-07 | 3.68e-06 | 47 |
| GO:000641416 | Oral cavity | OSCC | translational elongation | 37/7305 | 55/18723 | 2.03e-05 | 1.94e-04 | 37 |
| GO:0010498110 | Oral cavity | LP | proteasomal protein catabolic process | 224/4623 | 490/18723 | 9.57e-25 | 4.00e-22 | 224 |
| GO:0043161110 | Oral cavity | LP | proteasome-mediated ubiquitin-dependent protein catabolic process | 190/4623 | 412/18723 | 1.08e-21 | 2.93e-19 | 190 |
| GO:0006417110 | Oral cavity | LP | regulation of translation | 175/4623 | 468/18723 | 4.49e-10 | 2.22e-08 | 175 |
| GO:000641417 | Oral cavity | LP | translational elongation | 25/4623 | 55/18723 | 6.27e-04 | 5.71e-03 | 25 |
| GO:000651313 | Oral cavity | LP | protein monoubiquitination | 29/4623 | 67/18723 | 6.51e-04 | 5.90e-03 | 29 |
| Page: 1 2 |
| Pathway ID | Tissue | Disease Stage | Description | Gene Ratio | Bg Ratio | pvalue | p.adjust | qvalue | Count |
| Page: 1 |
Top |
Cell-cell communication analysis |
| Identification of potential cell-cell interactions between two cell types and their ligand-receptor pairs for different disease states |
| Ligand | Receptor | LRpair | Pathway | Tissue | Disease Stage |
| Page: 1 |
Top |
Single-cell gene regulatory network inference analysis |
| Find out the significant the regulons (TFs) and the target genes of each regulon across cell types for different disease states |
| TF | Cell Type | Tissue | Disease Stage | Target Gene | RSS | Regulon Activity |
| ∗The dot plots of a searched regulon are shown for all cell subpopulations in each disease state of each tissue based on the regulon specific score inferred using pySCENIC and by calculating the average expression. |
| Page: 1 |
Top |
Somatic mutation of malignant transformation related genes |
| Annotation of somatic variants for genes involved in malignant transformation |
| Hugo Symbol | Variant Class | Variant Classification | dbSNP RS | HGVSc | HGVSp | HGVSp Short | SWISSPROT | BIOTYPE | SIFT | PolyPhen | Tumor Sample Barcode | Tissue | Histology | Sex | Age | Stage | Therapy Types | Drugs | Outcome |
| ZNF598 | SNV | Missense_Mutation | rs761148339 | c.2467G>A | p.Asp823Asn | p.D823N | protein_coding | deleterious(0) | probably_damaging(0.999) | TCGA-BH-A1FM-01 | Breast | breast invasive carcinoma | Female | <65 | III/IV | Unknown | Unknown | SD | |
| ZNF598 | SNV | Missense_Mutation | rs746185966 | c.457C>T | p.Arg153Cys | p.R153C | protein_coding | deleterious(0) | probably_damaging(0.962) | TCGA-C8-A3M7-01 | Breast | breast invasive carcinoma | Female | <65 | III/IV | Unknown | Unknown | PD | |
| ZNF598 | insertion | Nonsense_Mutation | novel | c.155_156insAGAGCCAGGCTTCTGACCCAGGCCATGTGCACAGCCATG | p.Val52_Tyr53insGluProGlyPheTerProArgProCysAlaGlnProTrp | p.V52_Y53insEPGF*PRPCAQPW | protein_coding | TCGA-A2-A0CP-01 | Breast | breast invasive carcinoma | Female | <65 | I/II | Chemotherapy | cytoxan | SD | |||
| ZNF598 | SNV | Missense_Mutation | c.1085N>T | p.Ser362Leu | p.S362L | protein_coding | deleterious(0.02) | benign(0.001) | TCGA-DG-A2KM-01 | Cervix | cervical & endocervical cancer | Female | <65 | I/II | Chemotherapy | cisplatin | SD | ||
| ZNF598 | SNV | Missense_Mutation | novel | c.1804C>A | p.Leu602Met | p.L602M | protein_coding | tolerated(0.1) | benign(0.094) | TCGA-A6-3809-01 | Colorectum | colon adenocarcinoma | Female | >=65 | I/II | Unknown | Unknown | SD | |
| ZNF598 | SNV | Missense_Mutation | novel | c.910G>C | p.Glu304Gln | p.E304Q | protein_coding | tolerated(0.4) | benign(0.05) | TCGA-AA-3947-01 | Colorectum | colon adenocarcinoma | Female | <65 | I/II | Unknown | Unknown | SD | |
| ZNF598 | SNV | Missense_Mutation | c.833G>A | p.Ser278Asn | p.S278N | protein_coding | tolerated(0.05) | probably_damaging(0.996) | TCGA-CK-4951-01 | Colorectum | colon adenocarcinoma | Female | >=65 | I/II | Unknown | Unknown | PD | ||
| ZNF598 | SNV | Missense_Mutation | rs758722408 | c.2459C>T | p.Ala820Val | p.A820V | protein_coding | deleterious(0.01) | possibly_damaging(0.715) | TCGA-CM-4746-01 | Colorectum | colon adenocarcinoma | Male | <65 | I/II | Unknown | Unknown | SD | |
| ZNF598 | SNV | Missense_Mutation | rs776908919 | c.1927N>T | p.Pro643Ser | p.P643S | protein_coding | deleterious(0.04) | probably_damaging(0.999) | TCGA-CM-5861-01 | Colorectum | colon adenocarcinoma | Female | <65 | I/II | Unknown | Unknown | PD | |
| ZNF598 | insertion | Frame_Shift_Ins | novel | c.1934_1935insC | p.Pro646AlafsTer20 | p.P646Afs*20 | protein_coding | TCGA-A6-5665-01 | Colorectum | colon adenocarcinoma | Female | >=65 | I/II | Unknown | Unknown | PD |
| Page: 1 2 3 4 5 6 7 8 |
Top |
Related drugs of malignant transformation related genes |
| Identification of chemicals and drugs interact with genes involved in malignant transfromation |
| (DGIdb 4.0) |
| Entrez ID | Symbol | Category | Interaction Types | Drug Claim Name | Drug Name | PMIDs |
| Page: 1 |

Copyright 2023-Present -The University of Texas Health Science Center at Houston |