
|
|||||
|
 | |
| |
| |
| |
| |
| |
|
Gene: ZNF593 |
Gene summary for ZNF593 |
| Gene information | Species | Human | Gene symbol | ZNF593 | Gene ID | 51042 |
| Gene name | zinc finger protein 593 | |
| Gene Alias | ZT86 | |
| Cytomap | 1p36.11 | |
| Gene Type | protein-coding | GO ID | GO:0006139 | UniProtAcc | O00488 |
Top |
Malignant transformation analysis |
| Identification of the aberrant gene expression in precancerous and cancerous lesions by comparing the gene expression of stem-like cells in diseased tissues with normal stem cells |
| Entrez ID | Symbol | Replicates | Species | Organ | Tissue | Adj P-value | Log2FC | Malignancy |
| 51042 | ZNF593 | LZE4T | Human | Esophagus | ESCC | 2.02e-09 | 3.28e-01 | 0.0811 |
| 51042 | ZNF593 | LZE5T | Human | Esophagus | ESCC | 5.04e-04 | 3.49e-01 | 0.0514 |
| 51042 | ZNF593 | LZE7T | Human | Esophagus | ESCC | 2.38e-05 | 7.80e-01 | 0.0667 |
| 51042 | ZNF593 | LZE8T | Human | Esophagus | ESCC | 5.82e-05 | 4.94e-01 | 0.067 |
| 51042 | ZNF593 | LZE20T | Human | Esophagus | ESCC | 4.51e-02 | 1.46e-01 | 0.0662 |
| 51042 | ZNF593 | LZE22D1 | Human | Esophagus | HGIN | 3.40e-03 | 1.31e-01 | 0.0595 |
| 51042 | ZNF593 | LZE24D1 | Human | Esophagus | HGIN | 2.07e-03 | 1.97e-01 | 0.054 |
| 51042 | ZNF593 | LZE24T | Human | Esophagus | ESCC | 2.39e-22 | 1.05e+00 | 0.0596 |
| 51042 | ZNF593 | LZE22D3 | Human | Esophagus | HGIN | 1.54e-02 | 3.28e-01 | 0.0653 |
| 51042 | ZNF593 | P1T-E | Human | Esophagus | ESCC | 2.60e-07 | 6.97e-01 | 0.0875 |
| 51042 | ZNF593 | P2T-E | Human | Esophagus | ESCC | 4.32e-29 | 6.98e-01 | 0.1177 |
| 51042 | ZNF593 | P4T-E | Human | Esophagus | ESCC | 9.00e-28 | 9.84e-01 | 0.1323 |
| 51042 | ZNF593 | P5T-E | Human | Esophagus | ESCC | 2.55e-53 | 1.16e+00 | 0.1327 |
| 51042 | ZNF593 | P8T-E | Human | Esophagus | ESCC | 3.35e-19 | 5.67e-01 | 0.0889 |
| 51042 | ZNF593 | P9T-E | Human | Esophagus | ESCC | 1.29e-22 | 8.90e-01 | 0.1131 |
| 51042 | ZNF593 | P10T-E | Human | Esophagus | ESCC | 8.19e-34 | 7.70e-01 | 0.116 |
| 51042 | ZNF593 | P11T-E | Human | Esophagus | ESCC | 2.74e-06 | 7.67e-01 | 0.1426 |
| 51042 | ZNF593 | P12T-E | Human | Esophagus | ESCC | 8.80e-36 | 7.25e-01 | 0.1122 |
| 51042 | ZNF593 | P15T-E | Human | Esophagus | ESCC | 5.25e-24 | 6.47e-01 | 0.1149 |
| 51042 | ZNF593 | P16T-E | Human | Esophagus | ESCC | 3.98e-18 | 3.22e-01 | 0.1153 |
| Page: 1 2 3 4 5 6 7 8 |
| Tissue | Expression Dynamics | Abbreviation |
| Esophagus |  | ESCC: Esophageal squamous cell carcinoma |
| HGIN: High-grade intraepithelial neoplasias | ||
| LGIN: Low-grade intraepithelial neoplasias | ||
| Liver | 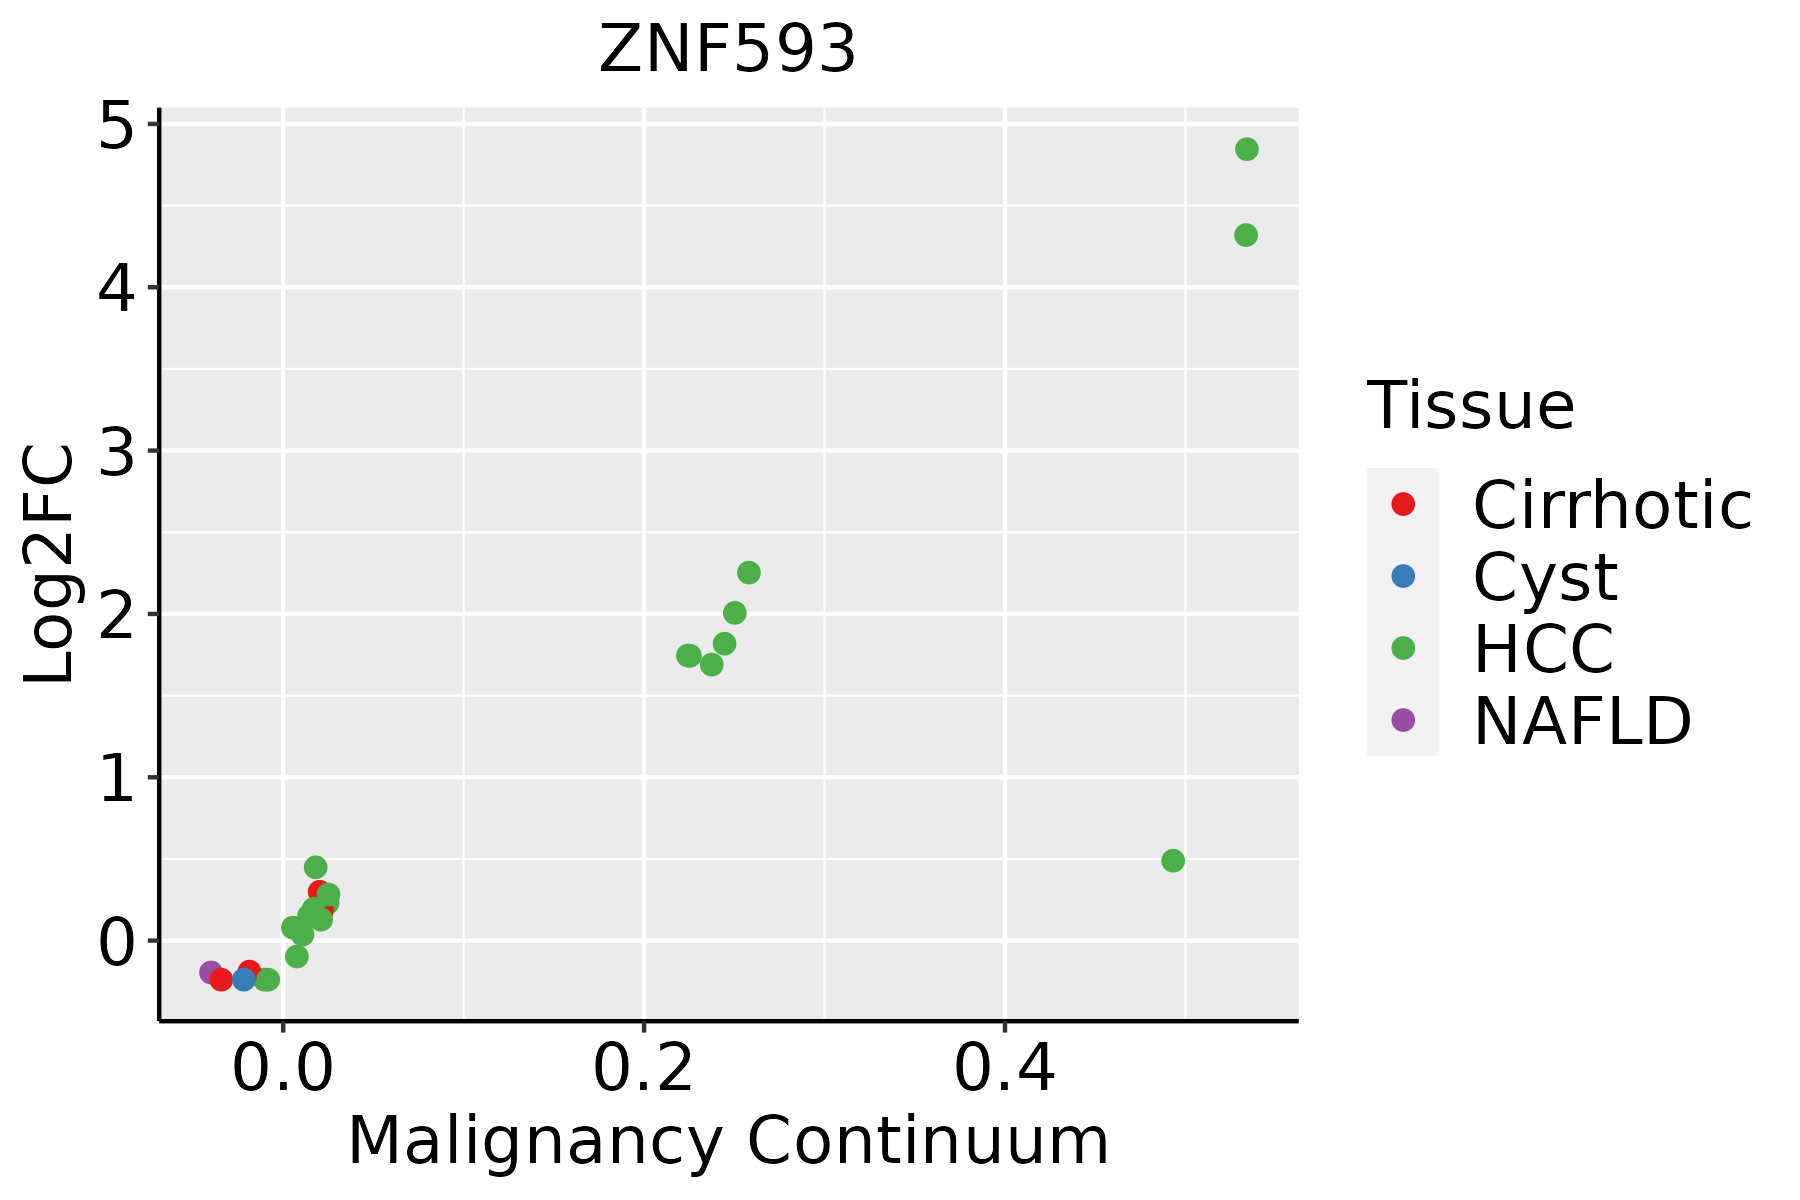 | HCC: Hepatocellular carcinoma |
| NAFLD: Non-alcoholic fatty liver disease | ||
| Oral Cavity | 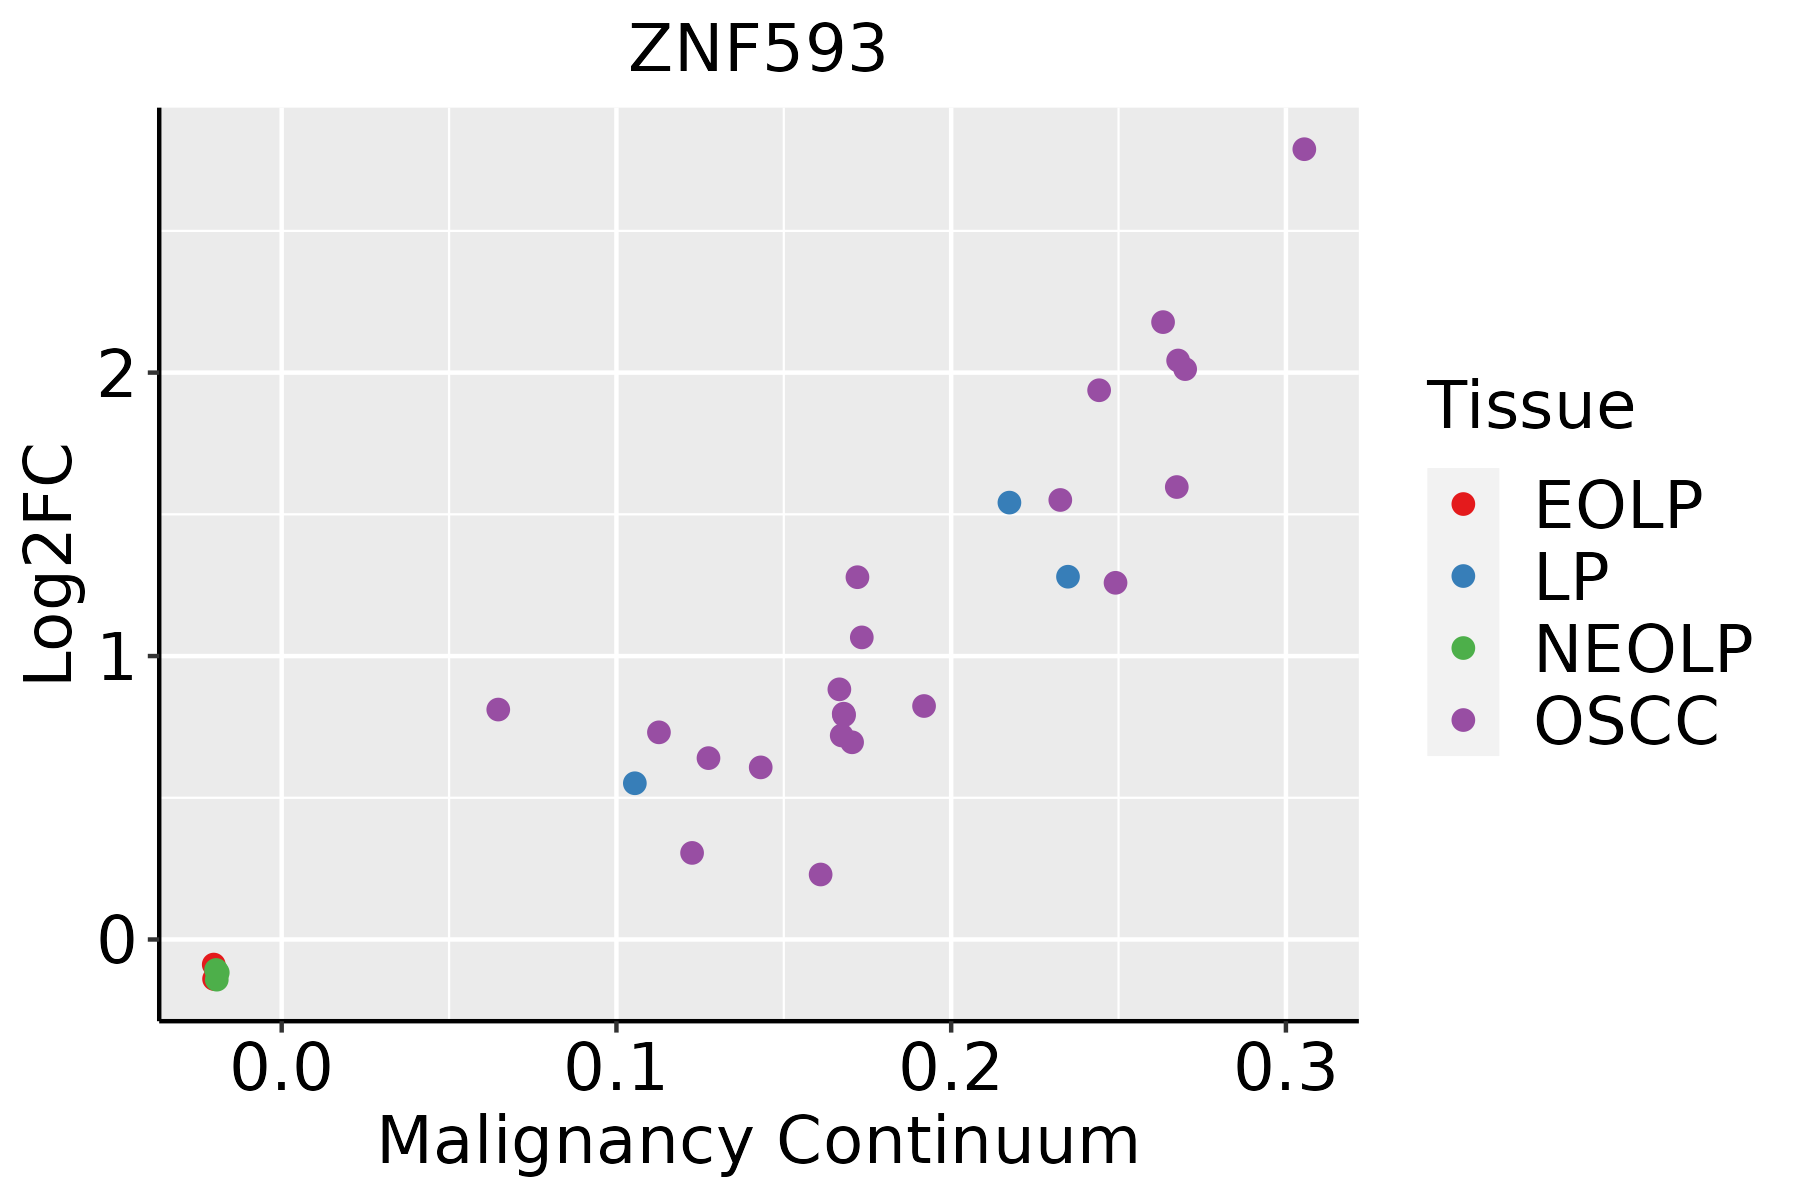 | EOLP: Erosive Oral lichen planus |
| LP: leukoplakia | ||
| NEOLP: Non-erosive oral lichen planus | ||
| OSCC: Oral squamous cell carcinoma | ||
| Prostate | 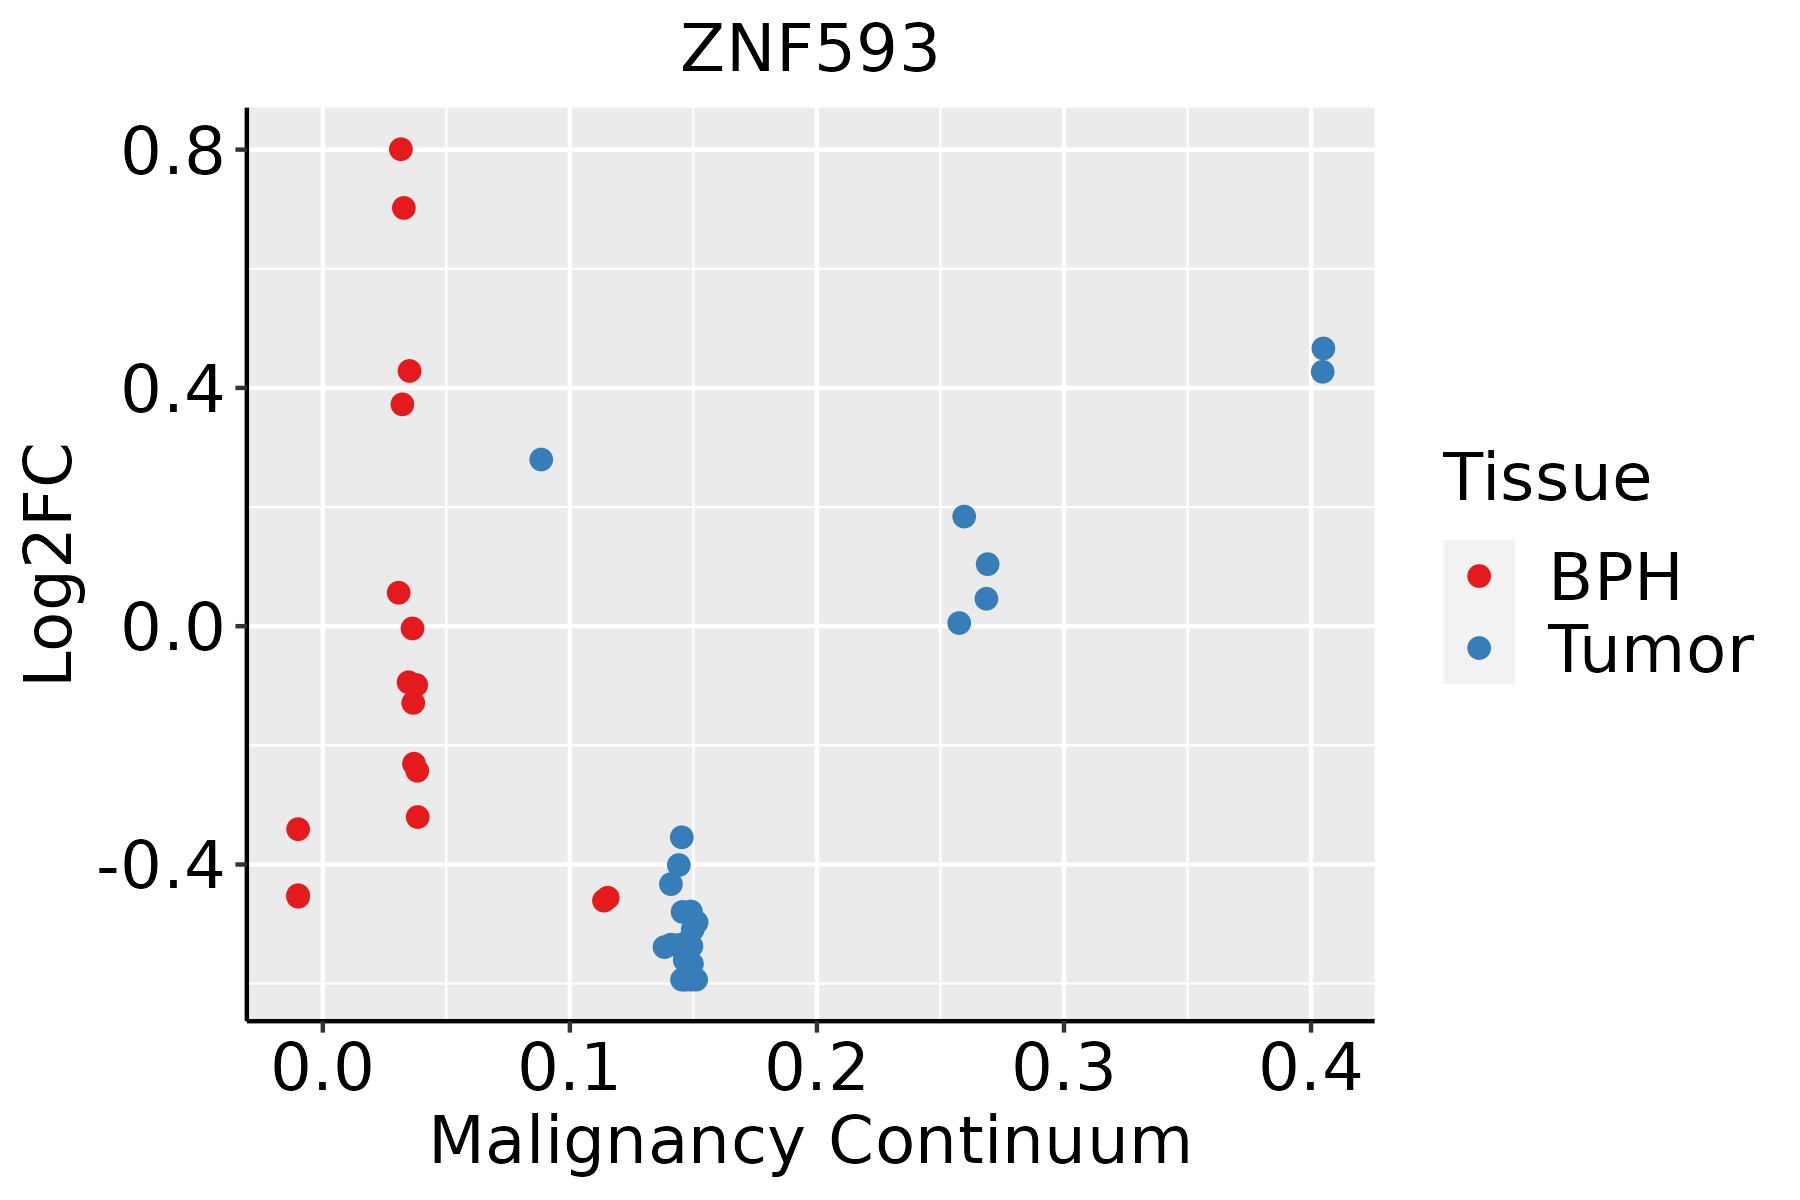 | BPH: Benign Prostatic Hyperplasia |
| Skin | 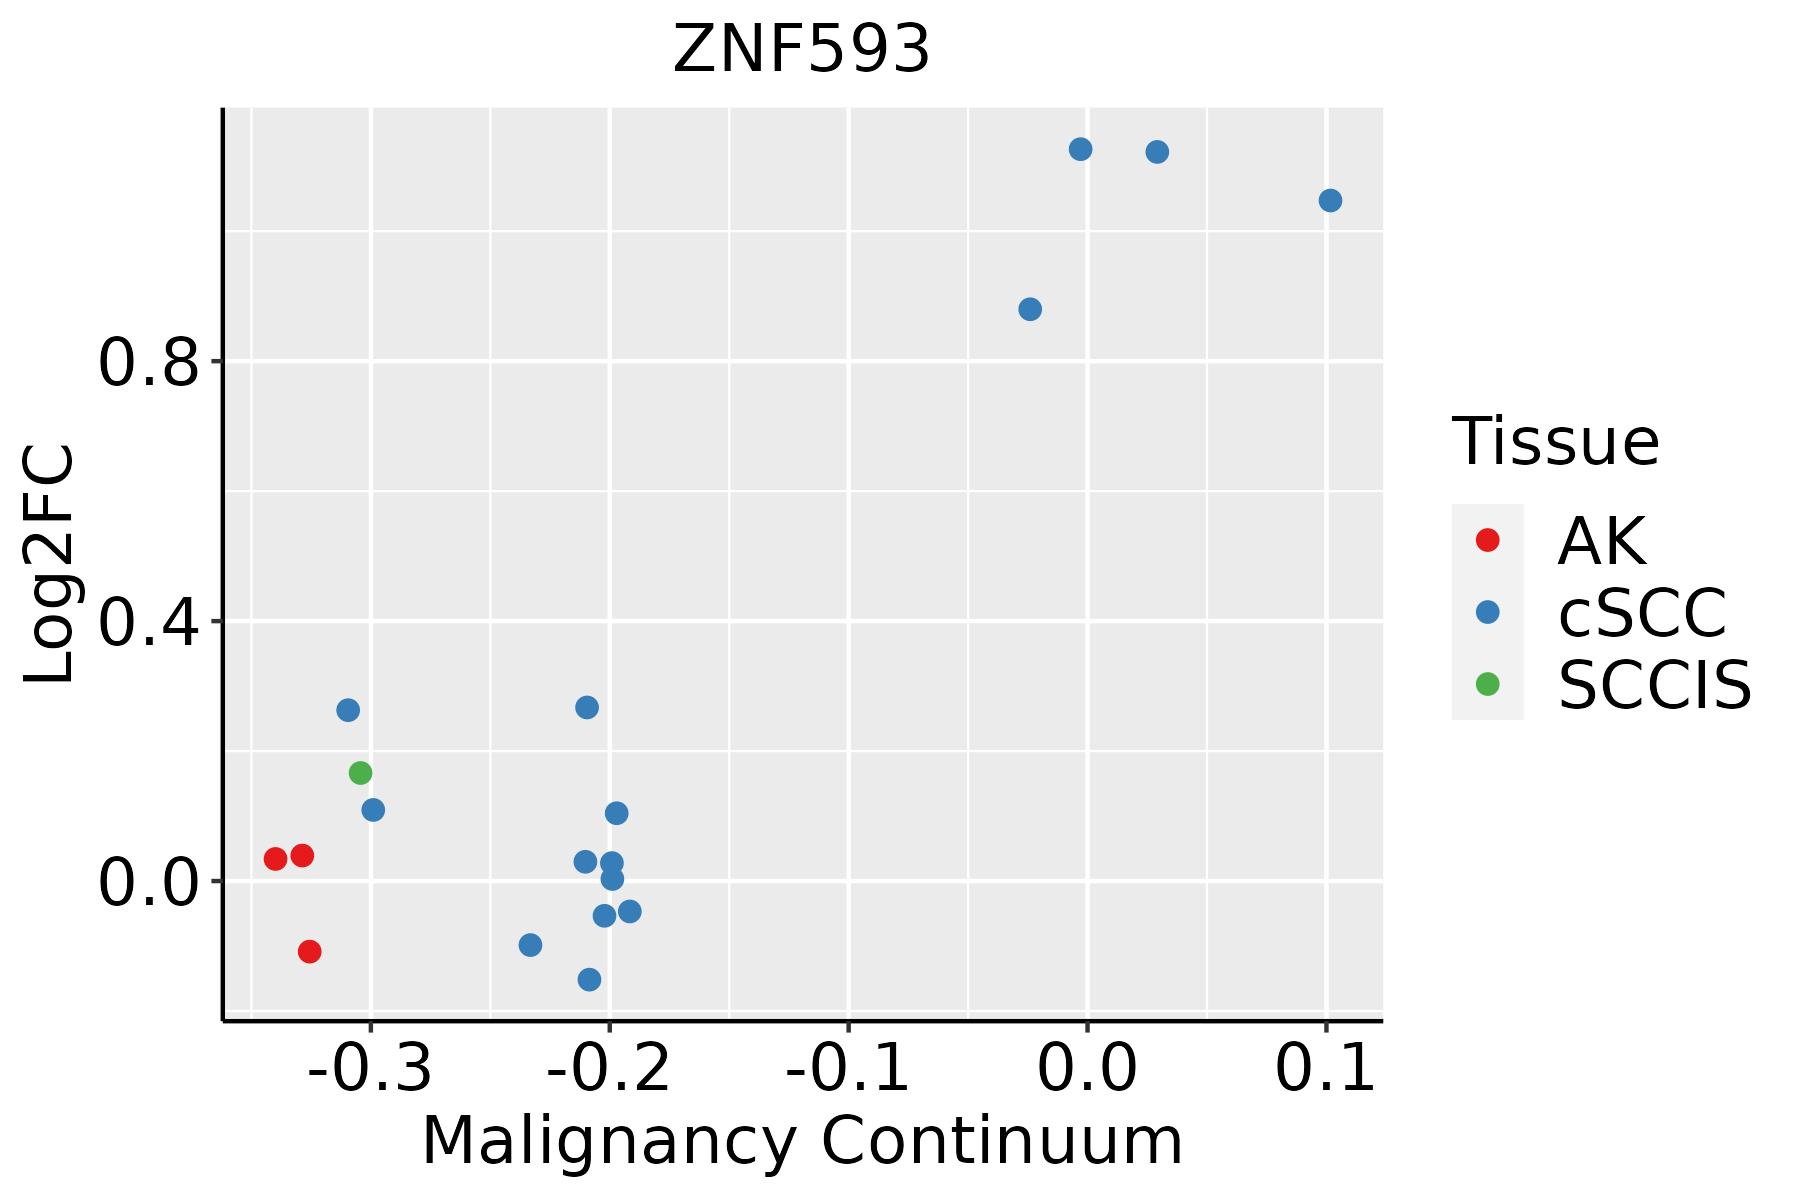 | AK: Actinic keratosis |
| cSCC: Cutaneous squamous cell carcinoma | ||
| SCCIS:squamous cell carcinoma in situ | ||
| Thyroid | 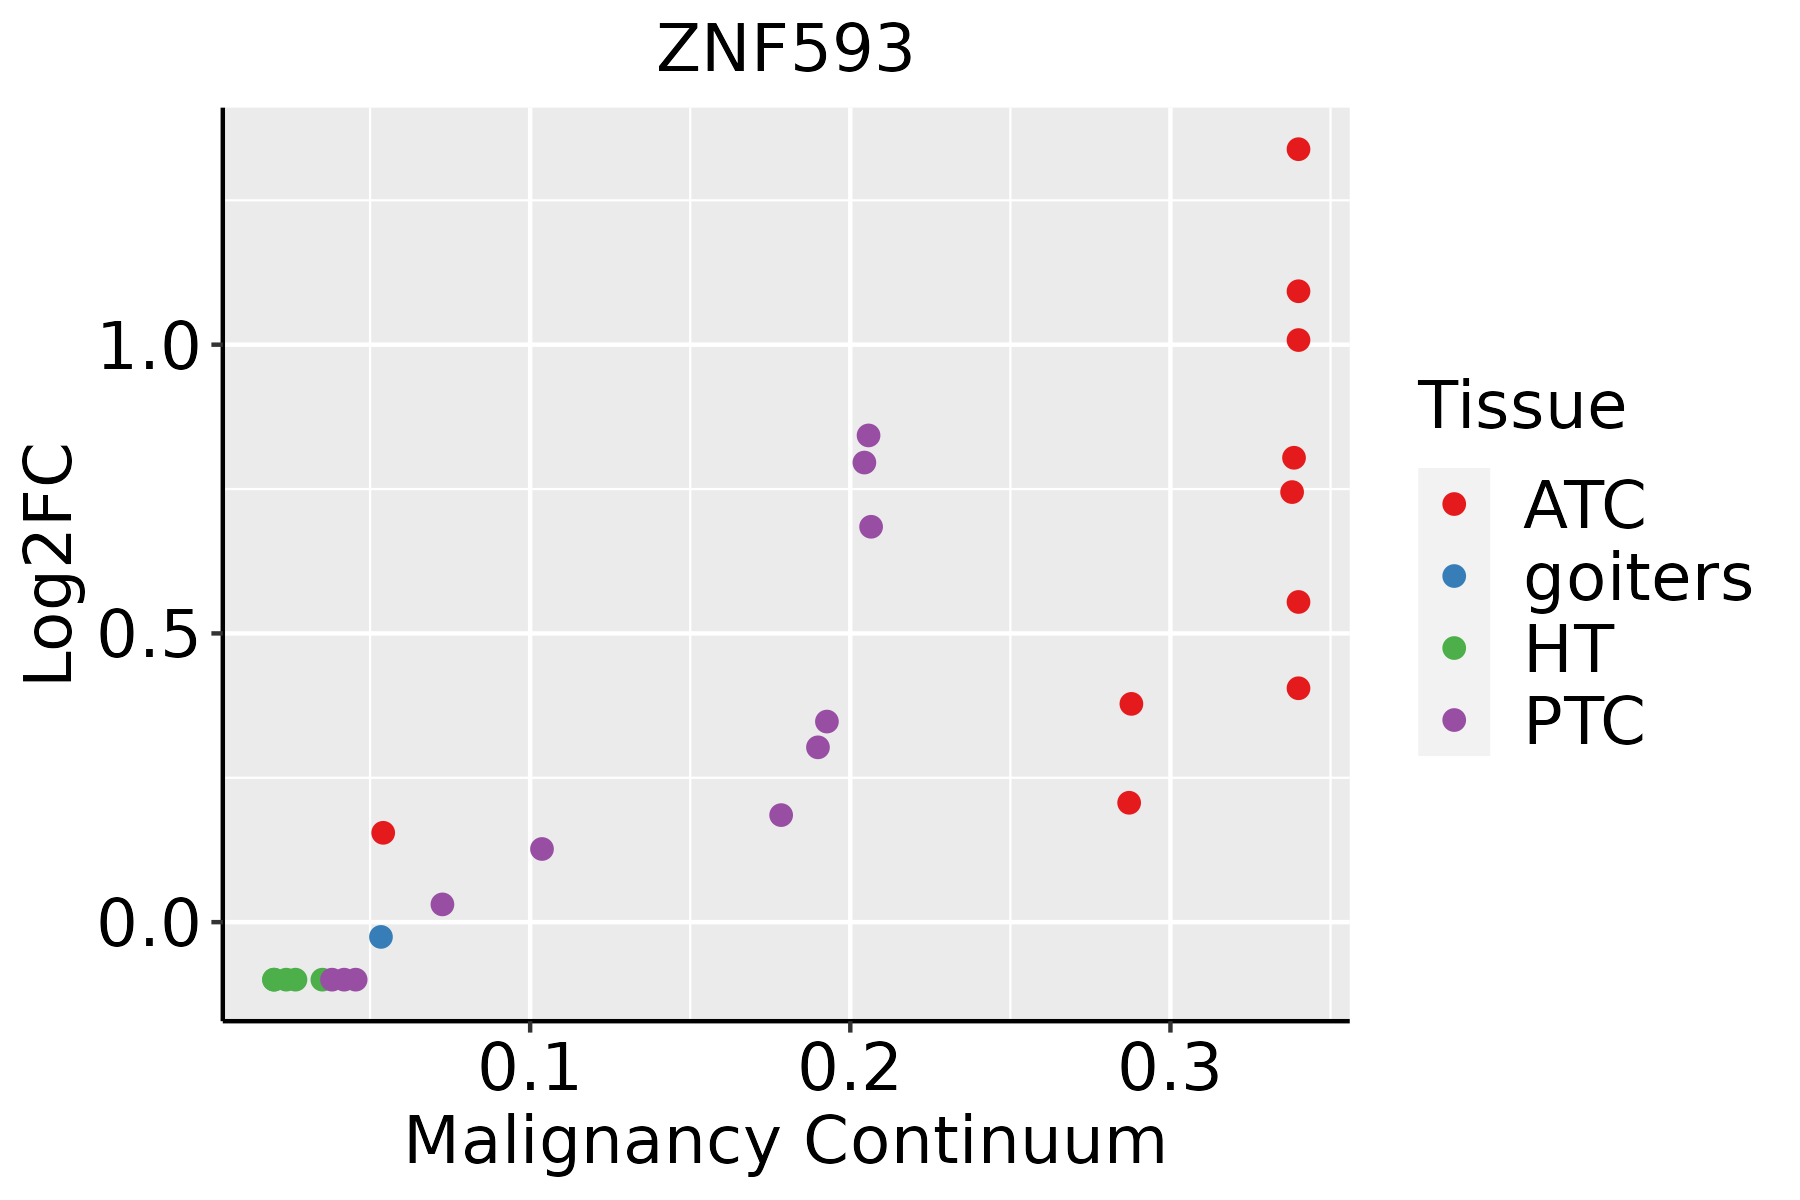 | ATC: Anaplastic thyroid cancer |
| HT: Hashimoto's thyroiditis | ||
| PTC: Papillary thyroid cancer |
| ∗log2FC in expression of this searched gene in stem-like cells from each diseased tissue sample relative to stem-like cells in normal samples in each tissue plotted against the malignancy continuum. Samples are colored based on if they are from different disease stage. |
Top |
Malignant transformation related pathway analysis |
| Find out the enriched GO biological processes and KEGG pathways involved in transition from healthy to precancer to cancer |
| Tissue | Disease Stage | Enriched GO biological Processes |
| Colorectum | AD |  |
| Colorectum | SER |  |
| Colorectum | MSS |  |
| Colorectum | MSI-H |  |
| Colorectum | FAP |  |
| ∗Top 15 enriched GO BP terms are showed in the bar plot of each disease state in each tissue. Each row represents a significant GO biological process which is colored according to the -log10(p.adjust). |
| Page: 1 2 3 4 5 6 7 8 9 |
| GO ID | Tissue | Disease Stage | Description | Gene Ratio | Bg Ratio | pvalue | p.adjust | Count |
| GO:005109825 | Esophagus | HGIN | regulation of binding | 78/2587 | 363/18723 | 3.73e-05 | 9.30e-04 | 78 |
| GO:005110125 | Esophagus | HGIN | regulation of DNA binding | 28/2587 | 118/18723 | 2.54e-03 | 2.51e-02 | 28 |
| GO:005110020 | Esophagus | HGIN | negative regulation of binding | 35/2587 | 162/18723 | 4.32e-03 | 3.84e-02 | 35 |
| GO:0051098111 | Esophagus | ESCC | regulation of binding | 251/8552 | 363/18723 | 6.73e-20 | 8.46e-18 | 251 |
| GO:0051101111 | Esophagus | ESCC | regulation of DNA binding | 84/8552 | 118/18723 | 1.64e-08 | 3.21e-07 | 84 |
| GO:0051100111 | Esophagus | ESCC | negative regulation of binding | 109/8552 | 162/18723 | 2.10e-08 | 4.03e-07 | 109 |
| GO:00433924 | Esophagus | ESCC | negative regulation of DNA binding | 37/8552 | 52/18723 | 1.75e-04 | 1.14e-03 | 37 |
| GO:19030254 | Esophagus | ESCC | regulation of RNA polymerase II regulatory region sequence-specific DNA binding | 12/8552 | 13/18723 | 6.18e-04 | 3.32e-03 | 12 |
| GO:20006772 | Esophagus | ESCC | regulation of transcription regulatory region DNA binding | 33/8552 | 50/18723 | 2.98e-03 | 1.24e-02 | 33 |
| GO:005109812 | Liver | Cirrhotic | regulation of binding | 148/4634 | 363/18723 | 9.14e-12 | 5.97e-10 | 148 |
| GO:00511006 | Liver | Cirrhotic | negative regulation of binding | 63/4634 | 162/18723 | 4.54e-05 | 5.31e-04 | 63 |
| GO:00511017 | Liver | Cirrhotic | regulation of DNA binding | 47/4634 | 118/18723 | 2.07e-04 | 1.90e-03 | 47 |
| GO:19030251 | Liver | Cirrhotic | regulation of RNA polymerase II regulatory region sequence-specific DNA binding | 9/4634 | 13/18723 | 9.10e-04 | 6.49e-03 | 9 |
| GO:005109822 | Liver | HCC | regulation of binding | 225/7958 | 363/18723 | 3.78e-14 | 2.37e-12 | 225 |
| GO:005110012 | Liver | HCC | negative regulation of binding | 94/7958 | 162/18723 | 4.69e-05 | 4.50e-04 | 94 |
| GO:005110112 | Liver | HCC | regulation of DNA binding | 64/7958 | 118/18723 | 6.60e-03 | 2.68e-02 | 64 |
| GO:19030252 | Liver | HCC | regulation of RNA polymerase II regulatory region sequence-specific DNA binding | 10/7958 | 13/18723 | 1.28e-02 | 4.61e-02 | 10 |
| GO:005109820 | Oral cavity | OSCC | regulation of binding | 212/7305 | 363/18723 | 3.88e-14 | 2.15e-12 | 212 |
| GO:005110019 | Oral cavity | OSCC | negative regulation of binding | 87/7305 | 162/18723 | 1.00e-04 | 7.54e-04 | 87 |
| GO:005110120 | Oral cavity | OSCC | regulation of DNA binding | 64/7305 | 118/18723 | 5.53e-04 | 3.21e-03 | 64 |
| Page: 1 2 3 |
| Pathway ID | Tissue | Disease Stage | Description | Gene Ratio | Bg Ratio | pvalue | p.adjust | qvalue | Count |
| Page: 1 |
Top |
Cell-cell communication analysis |
| Identification of potential cell-cell interactions between two cell types and their ligand-receptor pairs for different disease states |
| Ligand | Receptor | LRpair | Pathway | Tissue | Disease Stage |
| Page: 1 |
Top |
Single-cell gene regulatory network inference analysis |
| Find out the significant the regulons (TFs) and the target genes of each regulon across cell types for different disease states |
| TF | Cell Type | Tissue | Disease Stage | Target Gene | RSS | Regulon Activity |
| ∗The dot plots of a searched regulon are shown for all cell subpopulations in each disease state of each tissue based on the regulon specific score inferred using pySCENIC and by calculating the average expression. |
| Page: 1 |
Top |
Somatic mutation of malignant transformation related genes |
| Annotation of somatic variants for genes involved in malignant transformation |
| Hugo Symbol | Variant Class | Variant Classification | dbSNP RS | HGVSc | HGVSp | HGVSp Short | SWISSPROT | BIOTYPE | SIFT | PolyPhen | Tumor Sample Barcode | Tissue | Histology | Sex | Age | Stage | Therapy Types | Drugs | Outcome |
| ZNF593 | SNV | Missense_Mutation | c.90N>C | p.Glu30Asp | p.E30D | O00488 | protein_coding | deleterious(0.02) | possibly_damaging(0.621) | TCGA-JX-A3Q0-01 | Cervix | cervical & endocervical cancer | Female | <65 | III/IV | Unknown | Unknown | SD | |
| ZNF593 | SNV | Missense_Mutation | c.286C>T | p.Pro96Ser | p.P96S | O00488 | protein_coding | deleterious(0) | probably_damaging(0.973) | TCGA-AA-3710-01 | Colorectum | colon adenocarcinoma | Female | >=65 | I/II | Unknown | Unknown | SD | |
| ZNF593 | SNV | Missense_Mutation | c.347N>A | p.Arg116Gln | p.R116Q | O00488 | protein_coding | deleterious(0.04) | benign(0.03) | TCGA-AG-A025-01 | Colorectum | rectum adenocarcinoma | Female | <65 | I/II | Unknown | Unknown | SD | |
| ZNF593 | SNV | Missense_Mutation | novel | c.258G>T | p.Lys86Asn | p.K86N | O00488 | protein_coding | deleterious(0) | possibly_damaging(0.905) | TCGA-F5-6814-01 | Colorectum | rectum adenocarcinoma | Male | <65 | I/II | Unknown | Unknown | SD |
| ZNF593 | SNV | Missense_Mutation | novel | c.178N>G | p.Leu60Val | p.L60V | O00488 | protein_coding | deleterious(0.04) | benign(0.05) | TCGA-AX-A0IZ-01 | Endometrium | uterine corpus endometrioid carcinoma | Female | <65 | I/II | Unknown | Unknown | SD |
| ZNF593 | SNV | Missense_Mutation | rs757730721 | c.214N>A | p.Asp72Asn | p.D72N | O00488 | protein_coding | tolerated(0.28) | possibly_damaging(0.78) | TCGA-B5-A1MR-01 | Endometrium | uterine corpus endometrioid carcinoma | Female | >=65 | III/IV | Unknown | Unknown | SD |
| ZNF593 | SNV | Missense_Mutation | novel | c.57N>T | p.Met19Ile | p.M19I | O00488 | protein_coding | tolerated(0.3) | benign(0.018) | TCGA-B5-A5OC-01 | Endometrium | uterine corpus endometrioid carcinoma | Female | >=65 | III/IV | Chemotherapy | cisplatin | SD |
| ZNF593 | SNV | Missense_Mutation | novel | c.258G>T | p.Lys86Asn | p.K86N | O00488 | protein_coding | deleterious(0) | possibly_damaging(0.905) | TCGA-EY-A1G8-01 | Endometrium | uterine corpus endometrioid carcinoma | Female | >=65 | I/II | Unknown | Unknown | SD |
| ZNF593 | SNV | Missense_Mutation | rs749150132 | c.305C>T | p.Ala102Val | p.A102V | O00488 | protein_coding | deleterious(0) | probably_damaging(0.962) | TCGA-FI-A2D0-01 | Endometrium | uterine corpus endometrioid carcinoma | Female | <65 | I/II | Unknown | Unknown | SD |
| ZNF593 | SNV | Missense_Mutation | novel | c.376G>A | p.Glu126Lys | p.E126K | O00488 | protein_coding | tolerated(0.15) | benign(0.039) | TCGA-77-7140-01 | Lung | lung squamous cell carcinoma | Female | >=65 | I/II | Unknown | Unknown | PD |
| Page: 1 |
Top |
Related drugs of malignant transformation related genes |
| Identification of chemicals and drugs interact with genes involved in malignant transfromation |
| (DGIdb 4.0) |
| Entrez ID | Symbol | Category | Interaction Types | Drug Claim Name | Drug Name | PMIDs |
| Page: 1 |

Copyright 2023-Present -The University of Texas Health Science Center at Houston |